Investor Presentation Sept 2012
26
Investor Presentation September 2012 September 2012
Transcript of Investor Presentation Sept 2012

Investor PresentationSeptember 2012September 2012
Forward-Looking StatementsThis presentation includes “forward-looking statements.” These statements are subject to a number of risks, uncertainties andThis presentation includes forward looking statements. These statements are subject to a number of risks, uncertainties and other factors that could cause our actual results, performance, prospects or opportunities, as well as those of the markets we serve or intend to serve, to differ materially from those expressed in, or implied by, these statements. You can identify these statements by the fact that they do not relate to matters of a strictly factual or historical nature and generally discuss or relate to forecasts, estimates or other expectations regarding future events. Generally, the words “believe,” “expect,” “intend,” “estimate,” “anticipate,” “project,” “may,” “can,” “could,” “might,” “will” and similar expressions identify forward-looking statements, including statements related to expected operating and performing results planned transactions planned objectives of managementstatements related to expected operating and performing results, planned transactions, planned objectives of management, future developments or conditions in the industries in which we participate and other trends, developments and uncertainties that may affect our business in the future. Such risks, uncertainties and other factors include, among other things: interest rate changes and the availability of mortgage financing; continued volatility in the debt and equity markets; competition within the industries in which PulteGroup operates; the availability and cost of land and other raw materials used by PulteGroup in its homebuilding operations; the impact of any changes to our strategy in responding to continuing adverse conditions in the industry including any changes regarding our landchanges to our strategy in responding to continuing adverse conditions in the industry, including any changes regarding our landpositions; the availability and cost of insurance covering risks associated with PulteGroup's businesses; shortages and the costof labor; weather related slowdowns; slow growth initiatives and/or local building moratoria; governmental regulation directed at or affecting the housing market, the homebuilding industry or construction activities; uncertainty in the mortgage lending industry, including revisions to underwriting standards and repurchase requirements associated with the sale of mortgage loans; the interpretation of or changes to tax, labor and environmental laws; economic changes nationally or in PulteGroup’s local markets,i l di i fl ti d fl ti h i fid d f d th t t f th k t f h i lincluding inflation, deflation, changes in consumer confidence and preferences and the state of the market for homes in general;legal or regulatory proceedings or claims; required accounting changes; terrorist acts and other acts of war; and other factors of national, regional and global scale, including those of a political, economic, business and competitive nature. See PulteGroup’sAnnual Report on Form 10-K for the fiscal year ended December 31, 2011, and other public filings with the Securities and Exchange Commission (the “SEC”) for a further discussion of these and other risks and uncertainties applicable to our businesses. PulteGroup undertakes no duty to update any forward-looking statement, whether as a result of new information, f t t h i P lt G ’ t tifuture events or changes in PulteGroup’s expectations.Certain statements in this presentation contain references to non-GAAP financial measures. A reconciliation of the non-GAAP financial measures to the comparable GAAP numbers is included in this presentation.
1

Presentation Agenda
Profile of PulteGroup
Opportunities to Drive Business Performance Margin Expansion Margin Expansion
Overhead Leverage
L d S i d T i Land Strategies and Tactics
Review of Industry Conditions
2
Overview of PulteGroup and Recent Financial Results
3
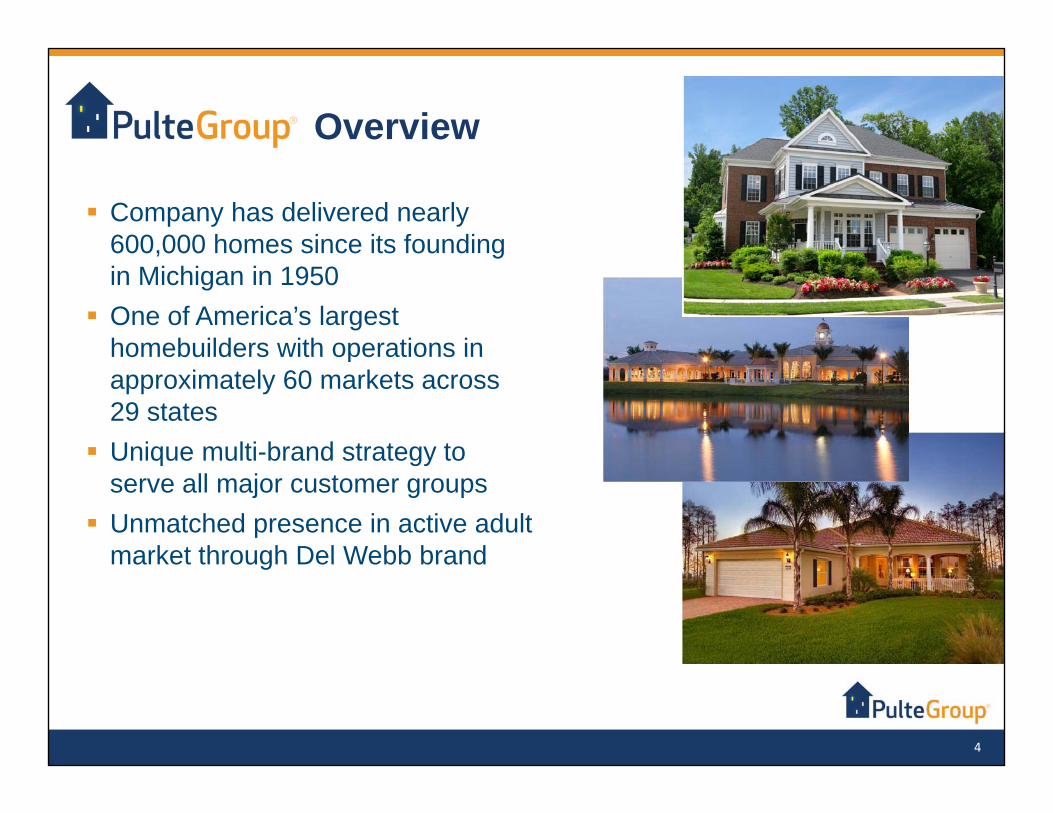
Overview
Company has delivered nearly 600,000 homes since its founding600,000 homes since its founding in Michigan in 1950
One of America’s largest homebuilders with operations inhomebuilders with operations in approximately 60 markets across 29 states
Unique multi-brand strategy toUnique multi brand strategy to serve all major customer groups
Unmatched presence in active adult market through Del Webb brandmarket through Del Webb brand
4

Seattle
Portland
Northern CaliforniaIlli i
Minnesota
Michigan
Cleveland Northeast Corridor
New England
Central Area
Southern CalArizona New Mexico
IllinoisIndianapolis
Mid Atlantic
TennesseeRaleigh
Charlotte
St. Louis
Colorado
Southern Nevada
New Mexico
Dallas Georgia
Coastal Carolinas
Central TexasSouthwest Area
East Area
San AntonioHouston
South Florida
North Florida
Texas Area
Florida Area
5

Broadest Exposure Across Customer Segments
Target: Entry‐Level Buyers Target: Move‐Up Buyers Target: Active Adults
Positioning: Crafting smart, life‐enhancing environments
that enrich everyday life
Positioning: Bringing pride of homeownership within reach
Positioning: Inspiring life’s most exciting possibilities
2011
Multiple brands allow greater focus on buyer wants and needs in each segment
2011 Closings36% 36% 28%
6
Pulte Homes (move-up buyer) grew to 42% of closings in Q2 2012

Positive Market Opportunity for Active Adult
Demographics continue to drive demand
U.S. Population Over 55(in millions)
Buyer segment remains one of the largest and most affluent
45% of Del Webb buyers pay
AGE
45% of Del Webb buyers pay cash for their home
Active adults typically need to yp ysell an existing homeSome will wait for rebound,
others moving to next life stageothers moving to next life stage
Significant equity remains in many homesy
7

Unmatched in Serving Active Adult Buyers
8
Marker indicates number of active Del Webb communities in the state

Driving Business Performance
9

Actions to Further Improve Gross Margins
Increased percentage of closings from move-up buyers, plus hi h i ithi h b
21.0%
Adjusted Homebuilding Gross Margin *
higher margins within each buyer group Increased closings from newer19 0%
19.5%
20.0%
20.5%
Increased closings from newer land assets which can carry higher margins
17 5%
18.0%
18.5%
19.0%
Initiatives underway to further expand gross margins: Ongoing reduction of house costs16.0%
16.5%
17.0%
17.5%
Ongoing reduction of house costsChange pricing model to base house with
options/upgradesEmphasize presales with managed spec
15.0%
15.5%
1Q '11 2Q '11 3Q '11 4Q '11 1Q '12 2Q'12Emphasize presales with managed spec
production
10
* Home sale gross margin before impairments and interest expense

Working to Deliver Greater Overhead Leverage
Overheads have been resized to better match
YOY Change in Q2 SG&A Costs ($ millions)
current volumes
Q2 2012 SG&A reduced by $135
$140
10% from prior year
Focus on volume growth ithin e isting footprint can
$130
within existing footprint can enable additional upside leverage
$120
$125
$115
$120
11
Q2 '11 Q2 '12

Land Strategy Aligned with ROIC Goals
160,000 Optioned
Company remains opportunistic and disciplined in land investment
Lots Under Control
120,000
140,000 Ownedp
Put approximately 2,000 lots under control in Q2
Plan to increase 2012 land spend to
80,000
100,000Plan to increase 2012 land spend to $900+ million
Reoriented capital allocation and
20 000
40,000
60,000p
land investment practices to drive better long-term returns
0
20,000
2009 2010 2011 Q2 '12
Continue to focus on better absorption pace rather than community count growthcommunity count growth
12

Debt Maturity Schedule
Continue to Improve Balance Sheet
Ended Q2 2012 with $1.4 billion of cash
Debt Maturity Schedule ($ millions)
$1,200
Q2 2012 cash balance up $96 million from Q1 2012F i h i ki
$800
$1,000
Focus remains on shrinking the balance sheet to more appropriately match current $400
$600
pp p ysize of operations
2012 notes paid at maturity in August with cash on hand
$200
$400
August with cash on hand $0 20
12
20
13
20
14
20
15
20
16
20
17
20
32
+
13

Mortgage Repurchase Information
14

2Q12 Financial Results: Mortgage Put-Back Analysis
2005 2006 2007 2008 TotalOrigination Volumes Units ($ billions) Units ($ billions) Units ($ billions) Units ($ billions) Units ($ billions)
Prime 73,703 $15.1 65,222 $14.4 47,224 $10.5 21,639 $4.6 207,788 $44.6
Mi O hMisc. Other 37,763 $8.4 33,562 $8.1 23,626 $5.9 21,479 $4.6 116,430 $27.0
Subprime 1,280 $0.2 1,416 $0.3 1,653 $0.3 421 $0.1 4,770 $0.9
Total 112,746 $23.7 100,200 $22.8 72,503 $16.7 43,539 $9.3 328,988 $72.5
• These figures have not been adjusted for subsequent activity such as borrower repayments of principal, foreclosures, or repurchases or make-whole payments completed to date. As a result, the principal balance currently outstanding is lower. Misc Other primarily represents brokered and government originations Repurchase activity to• Misc. Other primarily represents brokered and government originations. Repurchase activity to date has been insignificant.
• Represents $14 billion of originations in 2006-2007
• Almost 80% of put-back requests relate to mortgages originated in 2006 and 2007Almost 80% of put back requests relate to mortgages originated in 2006 and 2007• Over 60% of gross put-back requests are cured or refuted by our mortgage operations.
Requests not immediately refuted undergo extensive analysis to verify exposure, attempt to correct underlying issue and, when needed, confirm liability
15

Over 60% of gross loan repurchase requests are successfully refuted by our mortgage
Gross Loan Repurchase Requests Per Month
Gross Monthly Loan Repurchase Requests for Pulte and CTX Mortgage Combined
g p q y y g goperations. Requests undergo extensive analysis to verify exposure, attempt to correct underlying issue and, when needed, confirm liability.
150
y p q g g
100
Units
0
50
0
Jan‐09
Feb‐09
Mar‐09
Apr‐09
May‐09
Jun‐09
Jul‐0
9Au
g‐09
Sep‐09
Oct‐09
Nov
‐09
Dec‐09
Jan‐10
Feb‐10
Mar‐10
Apr‐10
May‐10
Jun‐10
Jul‐1
0Au
g‐10
Sep‐10
Oct‐10
Nov
‐10
Dec‐10
Jan‐11
Feb‐11
Mar‐11
Apr‐11
May‐11
Jun‐11
Jul‐1
1Au
g‐11
Sep‐11
Oct‐ 11
Nov
‐11
Dec‐11
Jan‐12
Feb‐12
Mar‐12
Apr‐12
May‐12
Jun‐12
Company reserves associated with potential future loan repurchase obligations incorporates expectation that such requests will likely continue through 2013
16
expectation that such requests will likely continue through 2013.

Review of Industry Conditions
17

Data Support Potential for Housing Recovery
N H S l Housing showing signs of
recovery after long decline700,000
800,000New Home Sales
2005 cyclical peak of 1.3 million single-family new home sales
2011 single-family sales down to 500,000
600,000
302,000; a drop of almost 80% from the peak
2012 sales through June show 300,000
400,000
,
2012 sales through June show rebound to 350,000 SAAR Employment and consumer
100 000
200,000
300,000
confidence need to improve to help ensure ongoing recovery 0
100,000
2007 2008 2009 2010 2011 2012
18

Demographic Drivers are Supportive of Housing Demand
Population By Age (000)
e a d
20,000
25,000Echo Boom Baby Bust Baby Boom Pre-Baby Boom
10,000
15,000Foreign Born
Native Born
5,000
0Under
55-9 10-14 15-19 20-24 25-29 30-34 35-39 40-44 45-49 50-54 55-59 60-64 65-69 70-74 75-79 80-84 85 and
Over
19

Male and Female Adults
Pent-up Demand has Been Building
15%6,000
Total living at home
Male and Female Adults Aged 25-34 Living at Home
25Doubled-up Households
13%
14%
5,000
5,500
15
20
ns
12%
13%
4,500
5,000
10
15
Mill
ion
11%4,0005
10%3,50019
8319
8519
8719
8919
9119
9319
9519
9719
9920
0120
0320
0520
0720
0920
11
01
2007 2011
20

Conclusion
PulteGroup: Well Positioned for Today and Tomorrow Margin Expansion – continuing to build on our successes in capturing
greater construction efficiencies and overhead leveragegreater construction efficiencies and overhead leverage
Land Strategy – working to maximize return opportunities within existing land portfolio while integrating new land positions
Unique Market Position – defined multi-brand strategy with leadership position in serving Baby Boomers
Balance Sheet – over $1.0 billion in cash and flexibility to support current foperations and future growth opportunities
Leadership – experienced leadership team focused on driving improvements in core homebuilding operations
2121

Supplemental Non-GAAP Data
22

Reconciliation of Non-GAAP DataThis presentation contains information about home sale gross margin reflecting certain adjustments. This measure is considered a non-GAAP financial measure under the SEC’s rules and should be considered in addition to, rather than as a substitute for, thecomparable GAAP financial measure as a measure of our operating performance. Management and our local divisions use this measure in evaluating the operating performance of each community and in making strategic decisions regarding sales pricing, construction and development pace, product mix, and other daily operating decisions. We believe it is a relevant and useful p p , p , y p gmeasure to investors for evaluating our performance through gross profit generated on homes delivered during a given period and for comparing our operating performance to other companies in the homebuilding industry. Although other companies in the homebuilding industry report similar information, the methods used may differ. We urge investors to understand the methods used by other companies in the homebuilding industry to calculate gross margins and any adjustments thereto before comparing our measure to that of such other companies.
The following table sets forth a reconciliation of this non-GAAP financial measure to the GAAP financial measure that management believes to be most directly comparable.
23

Supplemental Non-GAAP Data – Adjusted Margin Analysis
Three Months Ended
June 30, 2012
March 31, 2012
December 31, 2011
September 30, 2011
June 30, 2011
($ thousands)
Home sale revenues $ 1,024,405 $ 813,786 $ 1,167,141 $ 1,101,368 $ 899,763
Home sale cost of revenues (869,379) (712,166) (1,021,873) (947,817) (789,678)
Home sale gross margin 155,026 101,620 145,268 153,551 110,085
Add:
Impairments (a) 663 3,700 7,885 526 2,046
Capitalized interest amortization (a) 52,070 47,186 63,979 48,693 41,894
Adjusted home sale gross margin $ 207,729 $ 152,506 $ 217,132 $ 202,770 $ 154,025
Home sale gross margin as a percentage of home salerevenues 15.1% 12.5% 12.4% 13.9% 12.2%
Adjusted home sale gross margin as a percentage ofhome sale revenues 20.3% 18.7% 18.6% 18.4% 17.1%
(a) Write-offs of capitalized interest related to impairments are reflected in capitalized interest amortization.
24


![Financial Results, Results Press Release, Investor Presentation & Limited Review Report for Sept 30, 2015 [Result]](https://static.fdocuments.net/doc/165x107/577cb0d71a28aba7118b4e98/financial-results-results-press-release-investor-presentation-limited-review.jpg)