Investor Presentation Q4/FY ended March 2021
37
Investor Presentation Q4/FY ended March 2021 27-April-2021
Transcript of Investor Presentation Q4/FY ended March 2021

Investor PresentationQ4/FY ended March 2021
27-April-2021

Contents
2
A
B
Progress on the New Agenda
Strategy Monitorables
Business & Financial Performance
Shareholding and ESG Snapshot
Key Takeaways
Growth in Housing Finance Sector

New Agenda set by the Company
3
Strengthening the Core Drive Efficiency Accelerate Growth
Retail Focused
Lending
• Leverage expertise in
mass housing and
merchant category
• Increase fee income
through cross sell,
upsell and co-lending
• Retail to be the
engine of growth
Grow Affordable
Housing “Unnati”
• Building higher yielding
Unnati portfolio
• Focus on Average
ticket size of ~INR 15
lakh
• Strengthen distribution
network with increased
presence in Tier 2 and
3 cities
Risk Management
• Leverage advance
analytics and new
age technologies
• Automate credit
appraisal journey with
human touch
• Strengthen EWS to
improve collection
efficiencies
• Remedial
Management Group
to focus on resolution
of corporate book
Cost
Management
• Rationalize
operating model
with focus on
profitability
• Optimize cost and
productivity
• Improve
accountability
across organization
• Product and
segment level
monitoring
Digital Drive
• Accelerate digital
transformation across
the value chain
• Increase use of AI,
ML, RPAs to
augment business,
underwriting and
accelerate
efficiencies
• Advanced analytics
for portfolio
management, risk,
collection
• Building Super app to
strengthen digital
platform
Management
• Strengthen leadership
team with internal
promotions & external
hires
• On boarded senior
talent in
Collections,
Information
security, Affordable
Housing and
Internal Audit
• Augment Risk & data
analytics team
• Introduced incentive
plan to retain talent
• Focus on upgrading
skill sets
Capital
Position
• Improve capital and
gearing
• Build significant
provision
• Option to raise capital
across different
modes

4
FY20
8.53x
17.98%**
2.61%
85%
98.5%
Remarks
Further strengthen management team
Introduced RSU for critical positions
With reduced share of Corporate Book
Adjusted for deposit made with
companies in same group, CRAR is
20.61%
Net worth to NNPA is 5.9x
Capital Raise process ongoing
Leveraging digital interventions to
enhance efficiencies
Strengthened bucket wise resolutions
FY21
5 hires and 2 promotion
RSU Allotment done
6.72x
18.73%
4.09%
In process
84%
96.8%
Strengthening the Core – Key Monitorables
* As on last day of the period
**As per IGAAP
Pillars to Agenda
Risk
Management
Monitorables
Key roles hired at senior level
Introduced incentive plan to retain
talent
Reduce Leverage*
Maintain adequate Total Provision
to Total Asset*
Improve CRAR*
Tier 1 Capital
% of loans sanctioned within
stipulated TAT
Improve Collection Efficiencies
Capital
Position
Management
Team
5
Pillars to Agenda
Digital Drive
Cost
Management
Monitorables
Maintain Cost to Income Ratio
Reduce incremental Cost of
Borrowing
Implement Transformation
journey
Increase in digital sourcing
Automate underwriting for
Straight through Processing
Analytics across the organisation
through integration and data
warehousing
FY20
16.9%
8.47%
9%
FY21
15.1%
6.80%
Project ‘IGNITE’ initiated
22%
Vendors identified
Advance stages of vendor identification
Drive Efficiency – Key Monitorables
Remarks
Incremental COB for Q4FY21 has
dropped to 6.26%
Focus on business repositioning,
strengthen u/w, & collections, digital and
cost efficiencies
Increased focus on digital sourcing
Expected to go live by Sep’21
Implementation from Sep’21
Cost rationalisation measures
undertaken

Accelerate Growth – Key Monitorables
6
Grow
Affordable
Housing
“Unnati”
Retail
Focussed
Lending
Pillars to Agenda
Create separate vertical and open
lean branch infrastructure
Grow Retail Book (YoY)
Focus on building Granular book
(disbursement)
Reduction in Corporate book*
Grow Unnati book*
Monitorables
Existing branches
-6%
87.2%
INR 14,614 crore
18% of AUM
INR 2,607 crore
FY20
Disbursements higher by 50% Reduced
lending rates
Focus on lower ticket asset sourcing
Sell down/accelerated payment of INR
1,880 in FY21
Focus on building Unnati book
Locations identified for opening new
branches
Remarks
Separate vertical created
-5%
92.3%
INR 11,786 crore
16% of AUM
INR 2,985 crore
FY21
* As on last day of the period
Business and Financial Performance
7

Performance Highlights
8
Data as on 31-Mar-21 **On cumulative disbursements*For FY21 / #Q4 FY21
DisbursementINR 10,445 Crore*/
INR 4,103 Crore#
Asset Under Management INR 74,469 Crore
Retail Loans 84% of the AUM
Deposits INR 17,129 Crore
Gearing Ratio 6.72x
Gross Margin* 3.33%* / 3.69%#
Total Provision/
Total Assets4.09%
GNPA 4.44% on Loan Assets
3.95% on AUM
NNPA 2.43%
Write-offs since Inception** 15 bps
Capital to
Risk Asset Ratio18.73%
Book Value Per Share INR 530

Update on FY21 Guidance
9
Disbursements
FY21 Guidance FY21 Actual Achieved
AUM
Opex
ROA
Gross Margin
Spread
Retail >85% of Total AUM Retail 84% of Total AUM
Focus on lower risk weighted retail
segment and Unnati segment
INR 10,445 Crore
96% of disbursements in Retail
5-10% reduction on absolute basis 18% reduction on absolute basis
210-220 bps 277 bps
300-315 bps 333 bps
140-160 bps 123 bps
Unnati SegmentUnnati to be 10-15% of IHL
disbursements
Unnati is 10% of IHL disbursements;
Yield of ~11.1%
FY20 Actual
Retail 82% of Total AUM
INR 18,626 Crore
92% of disbursements in Retail
7% reduction on absolute basis
246 bps
321 bps
80 bps
Unnati is 10% of IHL disbursements
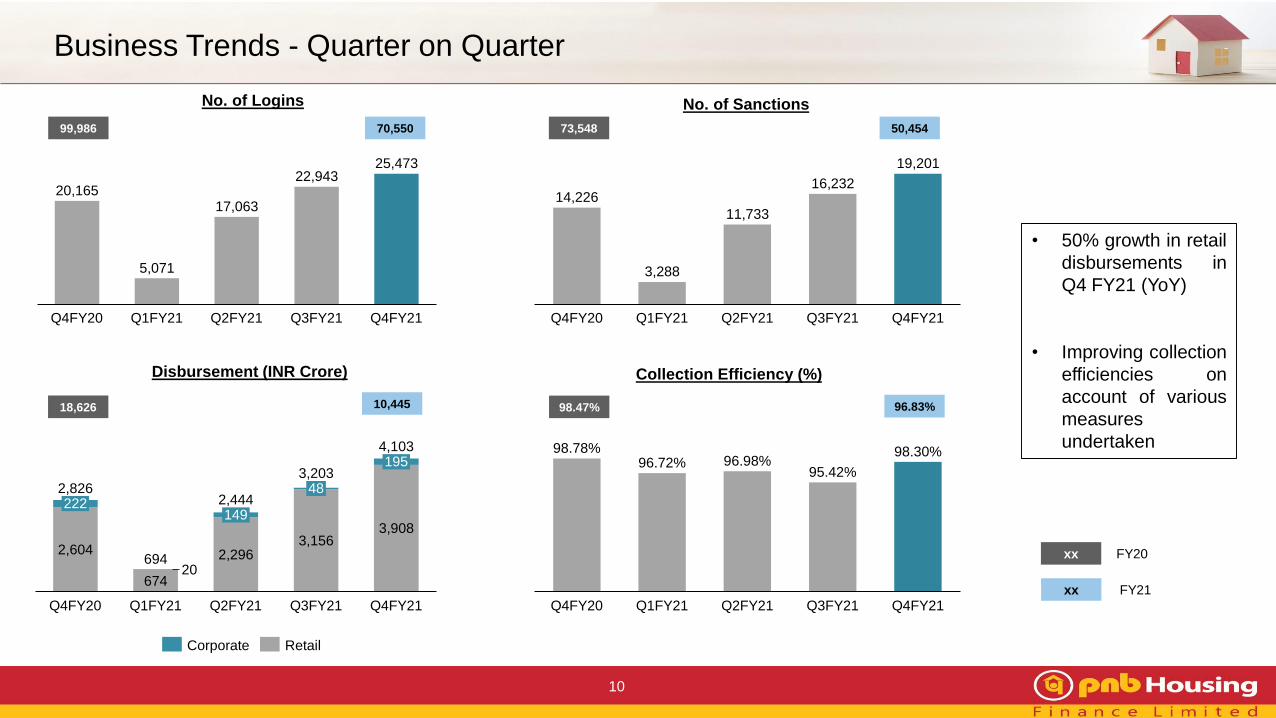
Business Trends - Quarter on Quarter
10
2,604
674
2,2963,156
3,908
20
149
Q4FY20
694
222
Q3FY21Q1FY21 Q2FY21
48
195
Q4FY21
2,8262,444
3,203
4,103
20,165
5,071
17,063
22,94325,473
Q2FY21Q4FY20 Q1FY21 Q3FY21 Q4FY21
No. of Logins No. of Sanctions
Disbursement (INR Crore)
Corporate Retail
14,226
3,288
11,733
16,232
19,201
Q4FY20 Q1FY21 Q2FY21 Q3FY21 Q4FY21
Collection Efficiency (%)
• 50% growth in retail
disbursements in
Q4 FY21 (YoY)
• Improving collection
efficiencies on
account of various
measures
undertaken
Q4FY21Q4FY20
96.98%
Q1FY21 Q3FY21Q2FY21
96.72%98.78%
95.42%
98.30%
99,986 70,550 73,548 50,454
18,626 10,445 98.47% 96.83%
xx
xx
FY20
FY21
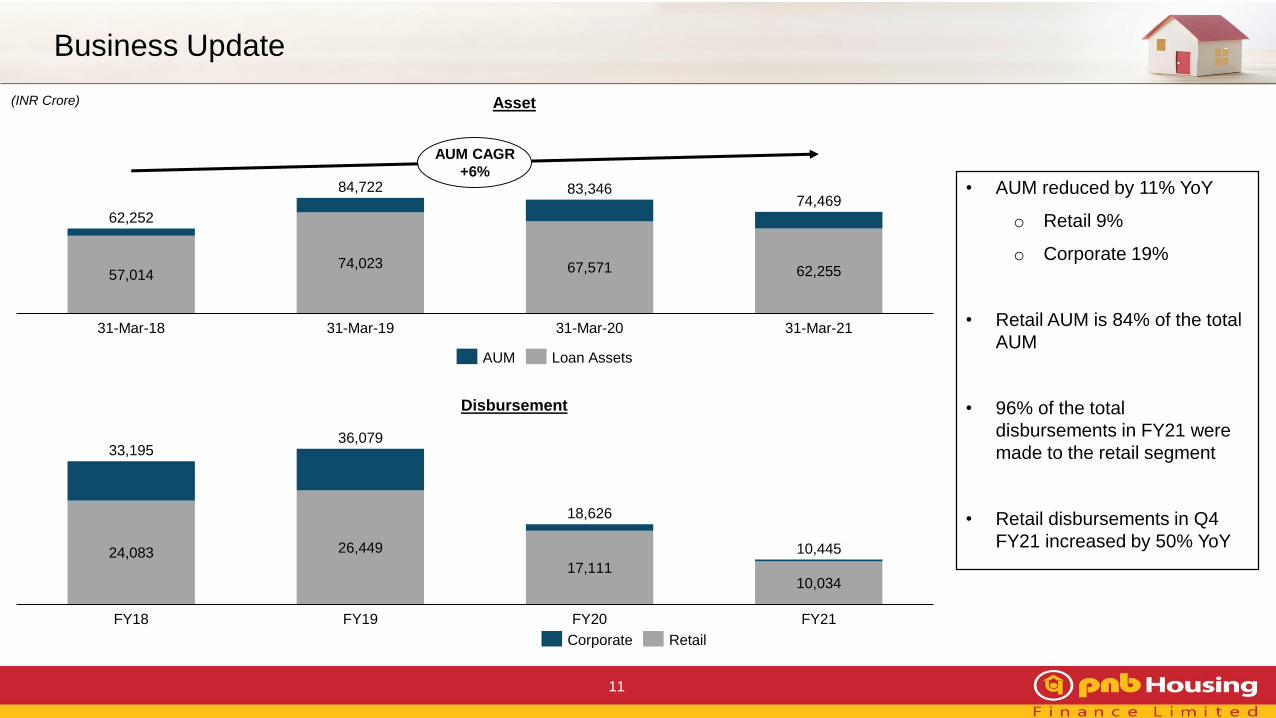
Business Update
11
(INR Crore)
57,01474,023 67,571 62,255
31-Mar-18 31-Mar-19 31-Mar-20
62,252
31-Mar-21
84,722 83,34674,469
AUM CAGR
+6%
AUM Loan Assets
Asset
Disbursement
24,083 26,449
17,11110,034
FY21
10,445
FY18 FY19 FY20
33,195
18,626
36,079
Corporate Retail
• AUM reduced by 11% YoY
o Retail 9%
o Corporate 19%
• Retail AUM is 84% of the total
AUM
• 96% of the total
disbursements in FY21 were
made to the retail segment
• Retail disbursements in Q4
FY21 increased by 50% YoY
Salaried 45%
Self Employed
39%
Corporate 16%
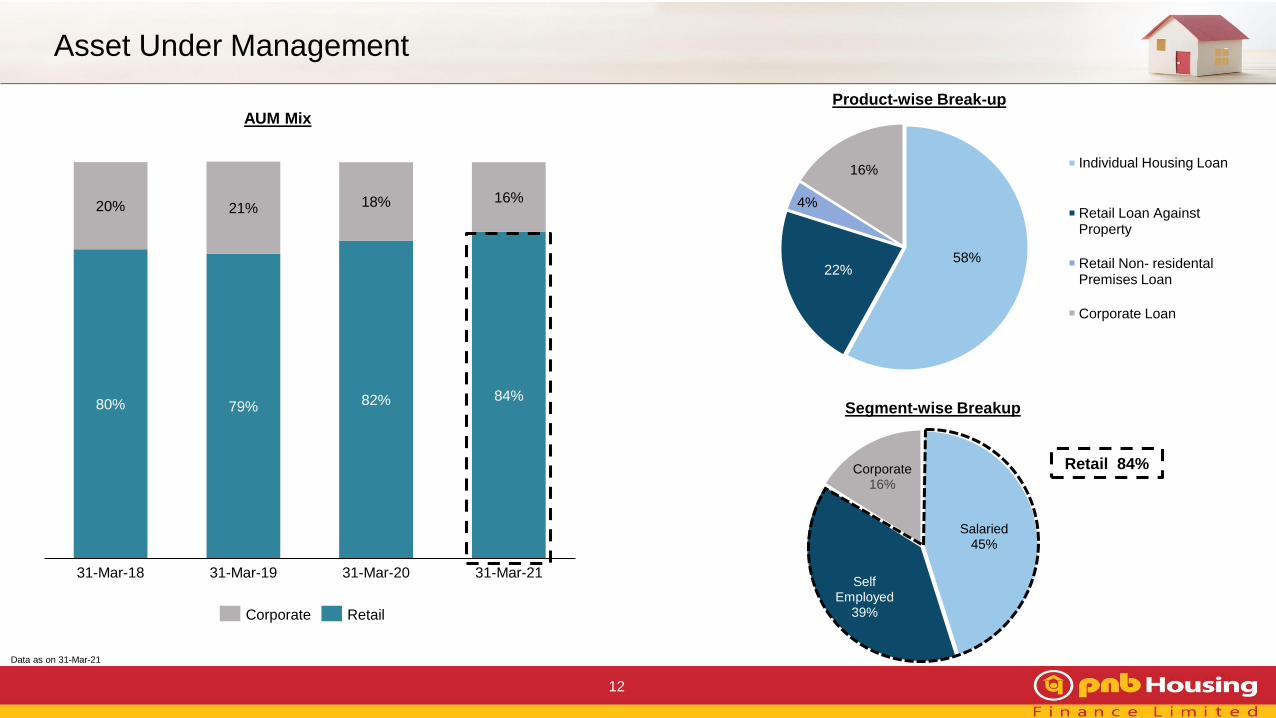
Asset Under Management
12
Corporate Retail
79%
20% 18%
31-Mar-19
80%
31-Mar-18
21%
82%
31-Mar-20
16%
84%
31-Mar-21
AUM Mix
Data as on 31-Mar-21
Product-wise Break-up
Retail 84%
58%22%
4%
16%Individual Housing Loan
Retail Loan Against Property
Retail Non- residental Premises Loan
Corporate Loan
Segment-wise Breakup

13
31 31 29 27
52 5147
44
31-Mar-2131-Mar-18 31-Mar-19 31-Mar-20
IHL LAP
Average Ticket Size
32% 30% 28% 30%
68% 70% 72% 70%
31-Mar-1931-Mar-18 31-Mar-20 31-Mar-21
Salaried Self Employed
83% 82% 81% 80%
17% 18% 19% 20%
31-Mar-18 31-Mar-2131-Mar-19 31-Mar-20
Salaried vs Self-Employed
Individual Housing Loan Loan Against Property
Self EmployedSalaried
ATS and LTV at Origination
Weighted Average Loan to Value
72%
31-Mar-18 31-Mar-19 31-Mar-20
49%
69%
31-Mar-21
71%
47%
71%
49% 49%
IHL LAP
Under construction vs Completed
74% 76% 81% 83%
26% 24% 19% 17%
31-Mar-18 31-Mar-2031-Mar-19 31-Mar-21
Under Construction Completed
Individual Housing Loan
Retail Loan Book – Key Attributes
INR Lakhs
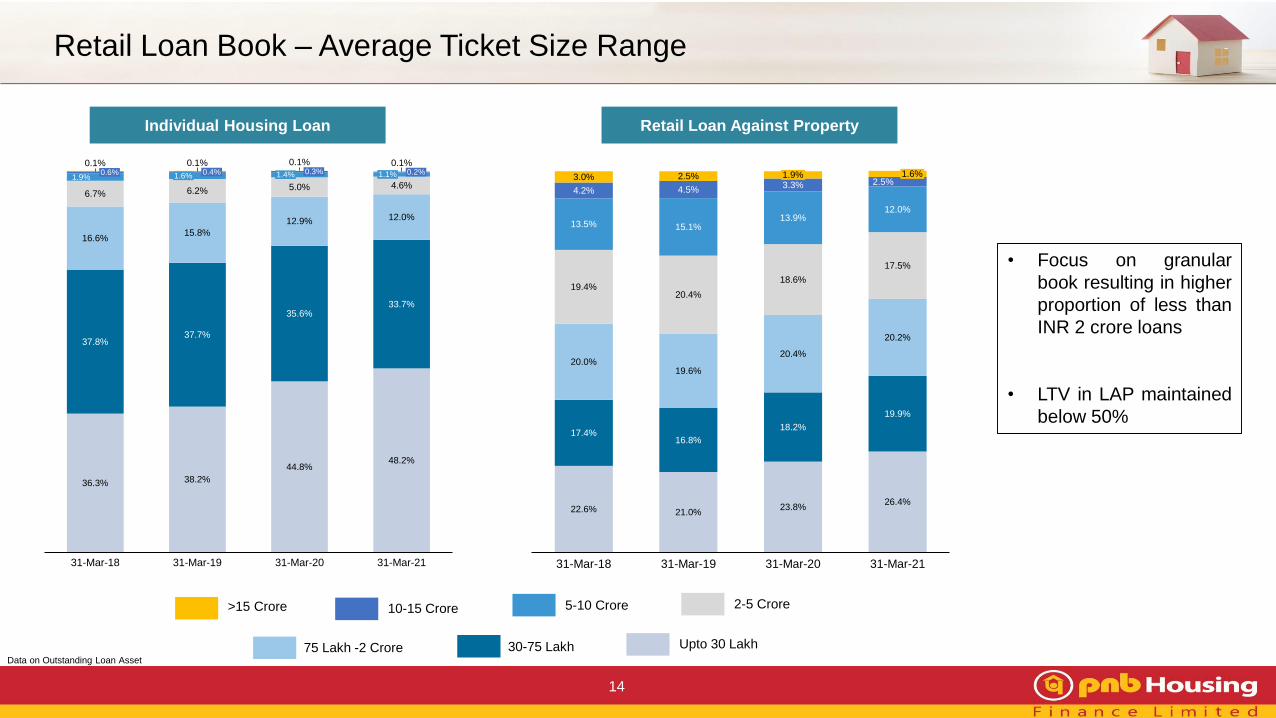
Retail Loan Book – Average Ticket Size Range
14
Individual Housing Loan Retail Loan Against Property
5-10 Crore
75 Lakh -2 Crore 30-75 Lakh
2-5 Crore10-15 Crore>15 Crore
Upto 30 LakhData on Outstanding Loan Asset
• Focus on granular
book resulting in higher
proportion of less than
INR 2 crore loans
• LTV in LAP maintained
below 50%
36.3% 38.2%
44.8%48.2%
37.8%37.7%
35.6%33.7%
16.6%15.8%
12.9% 12.0%
6.7% 6.2% 5.0% 4.6%1.9%
0.1% 0.1% 0.1%0.6%
31-Mar-19
0.4%
31-Mar-18
0.2%1.6%
0.1%0.3%1.4%
31-Mar-20
1.1%
31-Mar-21
22.6% 21.0%23.8%
26.4%
17.4%16.8%
18.2%
19.9%
20.0%19.6%
20.4%
20.2%
19.4%20.4%
18.6%
17.5%
13.5% 15.1%13.9%
12.0%
4.2% 4.5%3.3% 2.5%
3.0% 2.5%
31-Mar-2131-Mar-2031-Mar-18 31-Mar-19
1.9% 1.6%

Corporate Book Exposure Continues to Scale Down
15
3,092
3,678
3,052 3,126 2,955 2,677 2,243
11,152
10,356 10,453 10,3529,636
8,637
914
Mar-19 Sep-20
1,0241,229 9061,206
Mar-20 Jun-20 Dec-20 Mar-21
17,922
14,614 14,808 14,33113,227
11,786
-34%
Construction Finance Corporate Term Loan Lease Rental Discounting
Geographical Distribution
24%
19%56%
North South West
City Concentration
87%
13%
Top 7 Markets Others
Average Ticket Size
(Unique Corporate Houses)
(Mar’21)
Top 3 markets
MMR: 39%
NCR: 19%
Bangalore: 13%
Product
Segment
ATS
(INR Crore)
Construction
Finance167
Corporate Term
Loan98
Lease Rental
Discounting84
% of
Total
AUM
21.1% 17.5% 17.7% 17.6% 17.0% 15.8%
-19%
Corporate Book Performance
16
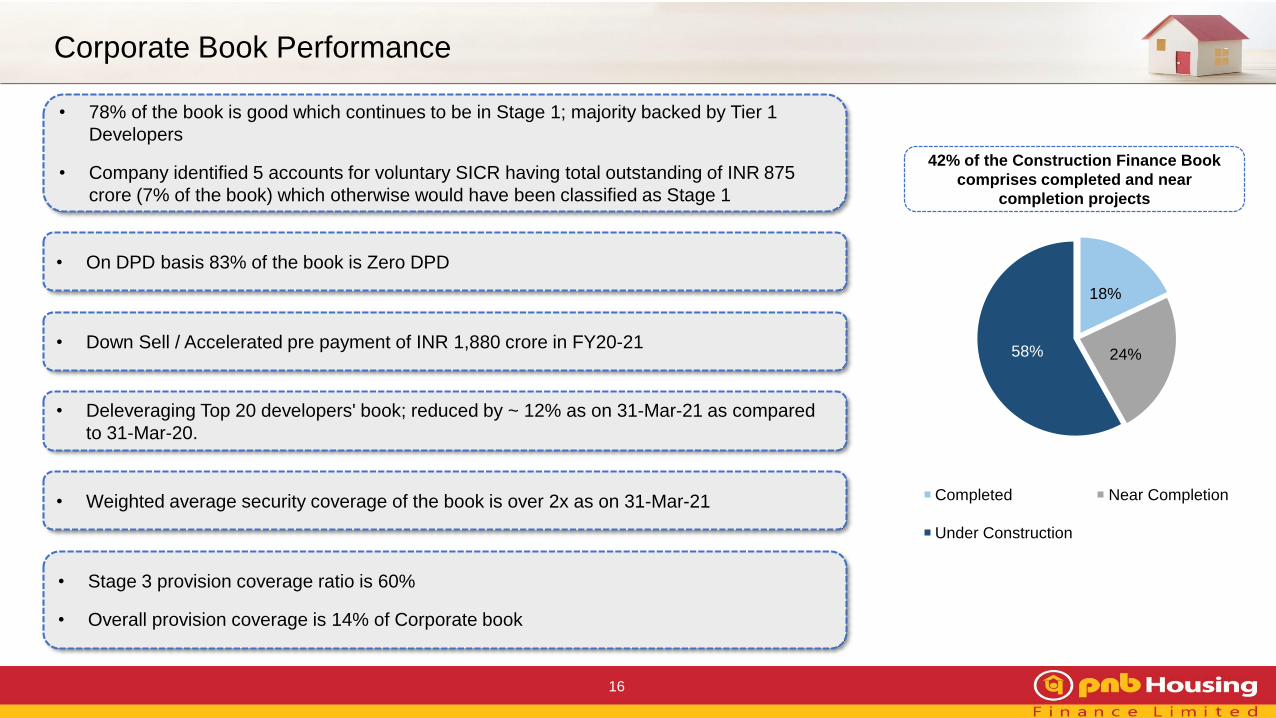
42% of the Construction Finance Book
comprises completed and near
completion projects
18%
24%58%
Completed Near Completion
Under Construction
• Deleveraging Top 20 developers' book; reduced by ~ 12% as on 31-Mar-21 as compared
to 31-Mar-20.
• Stage 3 provision coverage ratio is 60%
• Overall provision coverage is 14% of Corporate book
• Down Sell / Accelerated pre payment of INR 1,880 crore in FY20-21
• 78% of the book is good which continues to be in Stage 1; majority backed by Tier 1
Developers
• Company identified 5 accounts for voluntary SICR having total outstanding of INR 875
crore (7% of the book) which otherwise would have been classified as Stage 1
• Weighted average security coverage of the book is over 2x as on 31-Mar-21
• On DPD basis 83% of the book is Zero DPD
Corporate Book Remedial Actions
17
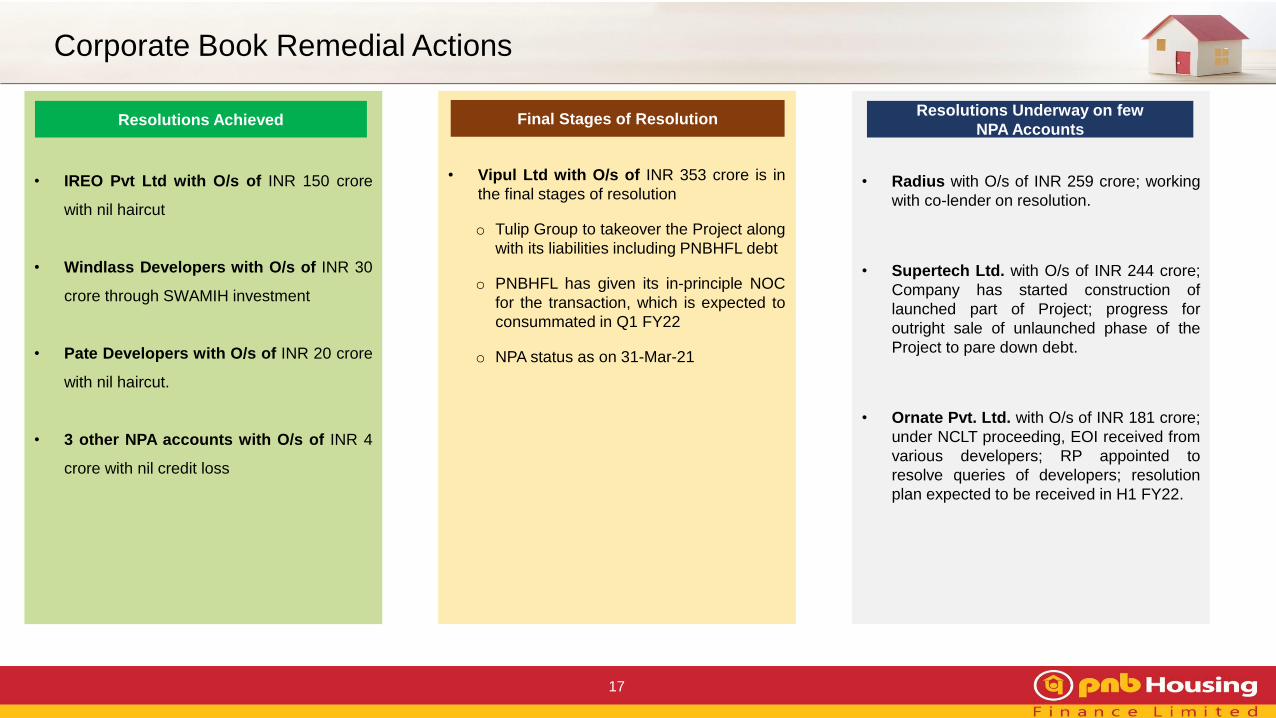
Resolutions Achieved
• IREO Pvt Ltd with O/s of INR 150 crore
with nil haircut
• Windlass Developers with O/s of INR 30
crore through SWAMIH investment
• Pate Developers with O/s of INR 20 crore
with nil haircut.
• 3 other NPA accounts with O/s of INR 4
crore with nil credit loss
• Vipul Ltd with O/s of INR 353 crore is in
the final stages of resolution
o Tulip Group to takeover the Project along
with its liabilities including PNBHFL debt
o PNBHFL has given its in-principle NOC
for the transaction, which is expected to
consummated in Q1 FY22
o NPA status as on 31-Mar-21
Final Stages of ResolutionResolutions Underway on few
NPA Accounts
• Radius with O/s of INR 259 crore; working
with co-lender on resolution.
• Supertech Ltd. with O/s of INR 244 crore;
Company has started construction of
launched part of Project; progress for
outright sale of unlaunched phase of the
Project to pare down debt.
• Ornate Pvt. Ltd. with O/s of INR 181 crore;
under NCLT proceeding, EOI received from
various developers; RP appointed to
resolve queries of developers; resolution
plan expected to be received in H1 FY22.

Gross Non-Performing Assets
18
% of Loan Asset
Figures as on 31-Mar-21 unless mentioned
0.33%
0.23%
Gross NPA
Net NPA
0.48%
0.38%
2.75%
1.75%
4.44%
2.43%
INR Crore
325.0660.9
1,271.1
1,195.4
1,491.2
0.0
0.5
1.0
1.5
2.0
2.5
3.0
3.5
4.0
4.5
0
500
1,000
1,500
2,000
2,500
3,000
3,500
4,000
4,500
31-Mar-18
165.7
0.8%
20.4
0.8%
31-Mar-19
29.9
2.6%
31-Mar-20
4.1%
31-Mar-21
Corporate GNPATotal Provision (as a % of assets) Retail GNPA
As on 31-Mar-21 INR Crore
Gross NPA 2,762
ECL Provision 2,544
Regulatory provision
(as per NHB)863
• The increase in GNPA in FY21 is primarily on account of COVID-19 pandemic; Company has created adequate provisions in the book
• Incremental provision of INR 778 crore created in FY21; total provision to total asst of 4.1%
• Higher provisions created during the year resulting in further strengthening of the Balance Sheet

Expected Credit Loss (ECL) Provisions – Overall
19
Classification of the Assets based on the ECL computation under Ind AS:
Stage 3 Provision Coverage Ratio increased to 45.2% compared to 36.2% as on 31st March 2020
Particulars (INR Crore) 31-Mar-21 31-Dec-20 31-Mar-20
Gross Stage 1 & 2 59,492 61,696 65,715
% portfolio in stage 1 & 2 95.6% 95.5% 97.3%
ECL Provision Stage 1 & 2 1,295 1,107 1,093
Net Stage 1 & 2 58,198 60,589 64,622
ECL Provision % Stage 1 & 2 2.2% 1.8% 1.7%
Gross Stage 3 (GNPA) 2,762 2,887* 1,856
% portfolio in Stage 3 (GNPA%) 4.4% 4.5% 2.8%
ECL Provision Stage 3 1,249 1,136 672
Net Stage 3 1,513 1,751 1,183
Coverage Ratio % Stage 3 45.2% 39.3% 36.2%
Total Assets 62,255 64,583 67,571
% portfolio 100.0% 100.0% 100.0%
ECL Provision 2,544 2,243 1,766
Net Stage 59,711 62,340 65,805
Total ECL Provision % 4.1% 3.5% 2.6%
Total Provision 2,544 2,243 1,766
Total Provision / Total Assets (%) 4.1% 3.5% 2.6%
Provision Coverage Ratio (%) 92.1% 77.7% 95.0%
*includes Proforma NPA in Stage 3
Expected Credit Loss (ECL) Provisions – Retail
20
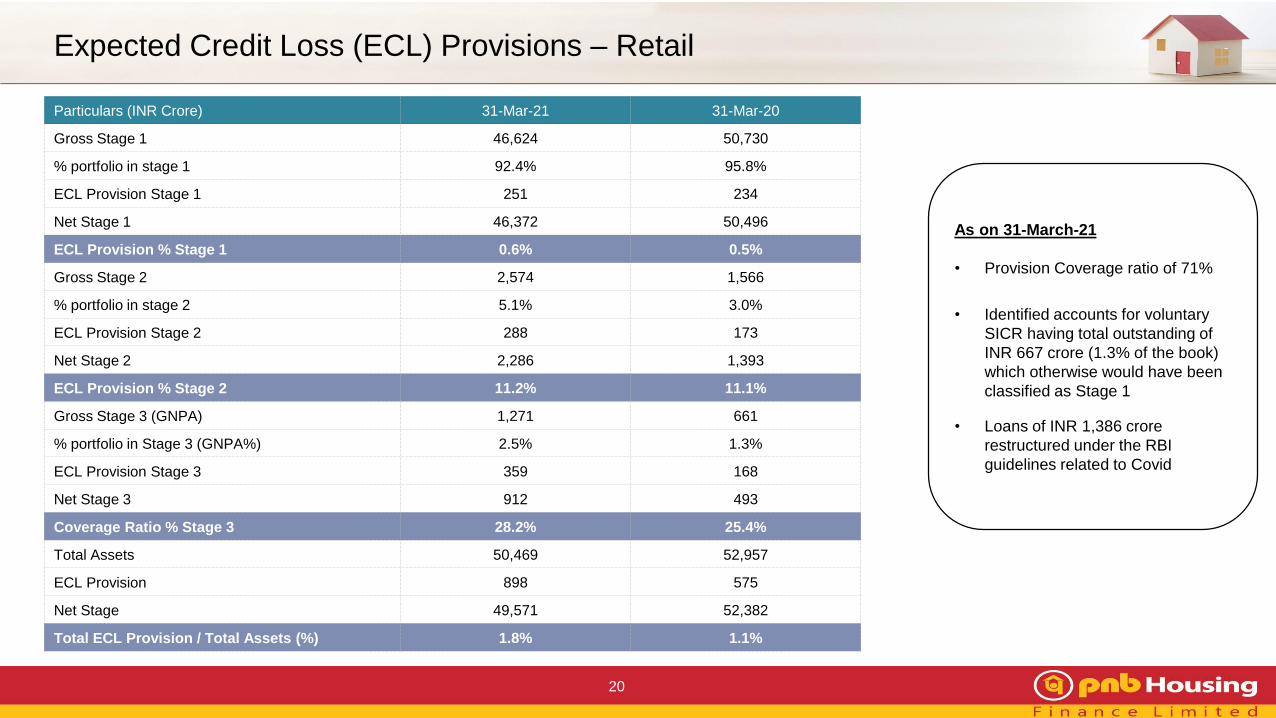
Particulars (INR Crore) 31-Mar-21 31-Mar-20
Gross Stage 1 46,624 50,730
% portfolio in stage 1 92.4% 95.8%
ECL Provision Stage 1 251 234
Net Stage 1 46,372 50,496
ECL Provision % Stage 1 0.6% 0.5%
Gross Stage 2 2,574 1,566
% portfolio in stage 2 5.1% 3.0%
ECL Provision Stage 2 288 173
Net Stage 2 2,286 1,393
ECL Provision % Stage 2 11.2% 11.1%
Gross Stage 3 (GNPA) 1,271 661
% portfolio in Stage 3 (GNPA%) 2.5% 1.3%
ECL Provision Stage 3 359 168
Net Stage 3 912 493
Coverage Ratio % Stage 3 28.2% 25.4%
Total Assets 50,469 52,957
ECL Provision 898 575
Net Stage 49,571 52,382
Total ECL Provision / Total Assets (%) 1.8% 1.1%
As on 31-March-21
• Provision Coverage ratio of 71%
• Identified accounts for voluntary
SICR having total outstanding of
INR 667 crore (1.3% of the book)
which otherwise would have been
classified as Stage 1
• Loans of INR 1,386 crore
restructured under the RBI
guidelines related to Covid
Expected Credit Loss (ECL) Provisions – Corporate
21
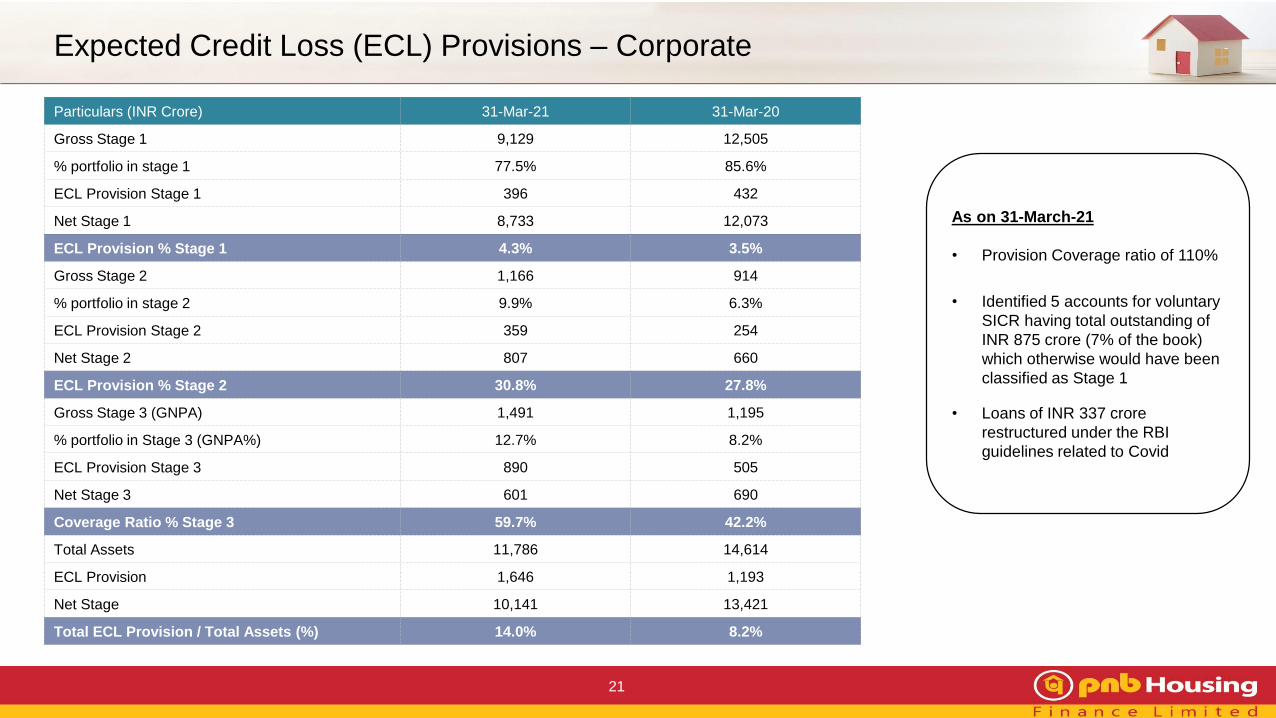
Particulars (INR Crore) 31-Mar-21 31-Mar-20
Gross Stage 1 9,129 12,505
% portfolio in stage 1 77.5% 85.6%
ECL Provision Stage 1 396 432
Net Stage 1 8,733 12,073
ECL Provision % Stage 1 4.3% 3.5%
Gross Stage 2 1,166 914
% portfolio in stage 2 9.9% 6.3%
ECL Provision Stage 2 359 254
Net Stage 2 807 660
ECL Provision % Stage 2 30.8% 27.8%
Gross Stage 3 (GNPA) 1,491 1,195
% portfolio in Stage 3 (GNPA%) 12.7% 8.2%
ECL Provision Stage 3 890 505
Net Stage 3 601 690
Coverage Ratio % Stage 3 59.7% 42.2%
Total Assets 11,786 14,614
ECL Provision 1,646 1,193
Net Stage 10,141 13,421
Total ECL Provision / Total Assets (%) 14.0% 8.2%
As on 31-March-21
• Provision Coverage ratio of 110%
• Identified 5 accounts for voluntary
SICR having total outstanding of
INR 875 crore (7% of the book)
which otherwise would have been
classified as Stage 1
• Loans of INR 337 crore
restructured under the RBI
guidelines related to Covid

Well Diversified Resource Profile
22
Credit Rating
• Fixed Deposit: “FAA+” by CRISIL
and “AA” by CARE.
• Commercial Paper: “A1(+)” by
CARE & CRISIL
• Non-Convertible Debentures: “AA”
by CARE, India Ratings, CRISIL
and ICRA
• Bank Loans (Long Term): “AA” by
CARE and CRISIL
(INR Crore)
• ~70% of the total resource is
floating; giving opportunity for
replacement & repricing
8.8% 12.9%18.8% 16.9%
37.5% 28.0%22.5%
16.5%
17.5%
9.6%
19.5%
17.2%
19.6%23.7%
5.7%6.7% 8.3%
7.7%
18.2% 24.4% 22.2%
6.5% 8.5% 7.4% 10.9%
1.6%
2.5%
31-Mar-18 31-Mar-19
0.5%
31-Mar-20 31-Mar-21
NHB Refinance Loan from Banks ECBs Deposits
CP NCDs Direct Assignment
54,268 72,362 68,216 59,942
59,506 83,061 83,991 72,157
Borrowings
Total
Resource
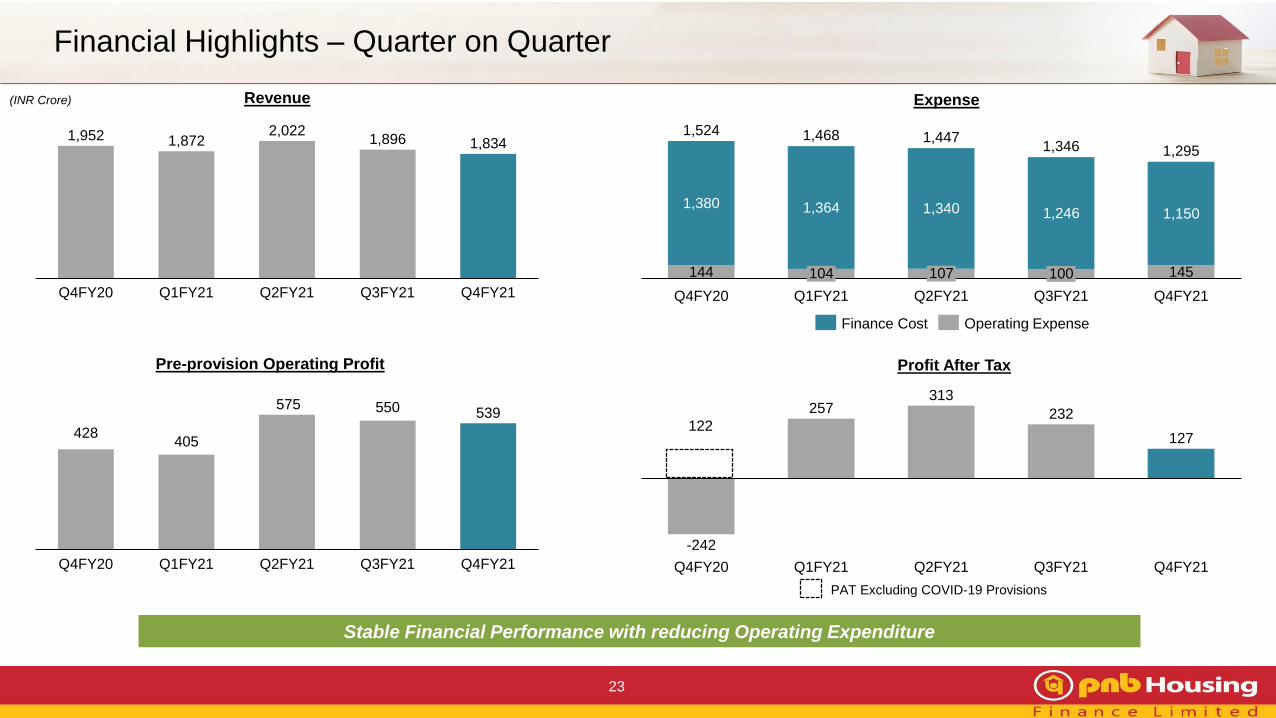
Financial Highlights – Quarter on Quarter
23
Pre-provision Operating Profit Profit After Tax
-242
257313
232
127
Q2FY21 Q3FY21Q4FY20 Q1FY21 Q4FY21
Revenue
1,952 1,8722,022
1,896 1,834
Q3FY21Q4FY20 Q2FY21Q1FY21 Q4FY21
Expense
144 145
1,380 1,364 1,340 1,246 1,150
Q4FY21
104
Q4FY20 Q1FY21
107
Q2FY21
100
Q3FY21
1,524 1,468 1,4471,346 1,295
Finance Cost Operating Expense
122
PAT Excluding COVID-19 Provisions
Stable Financial Performance with reducing Operating Expenditure
428405
575 550 539
Q4FY21Q4FY20 Q1FY21 Q2FY21 Q3FY21
(INR Crore)
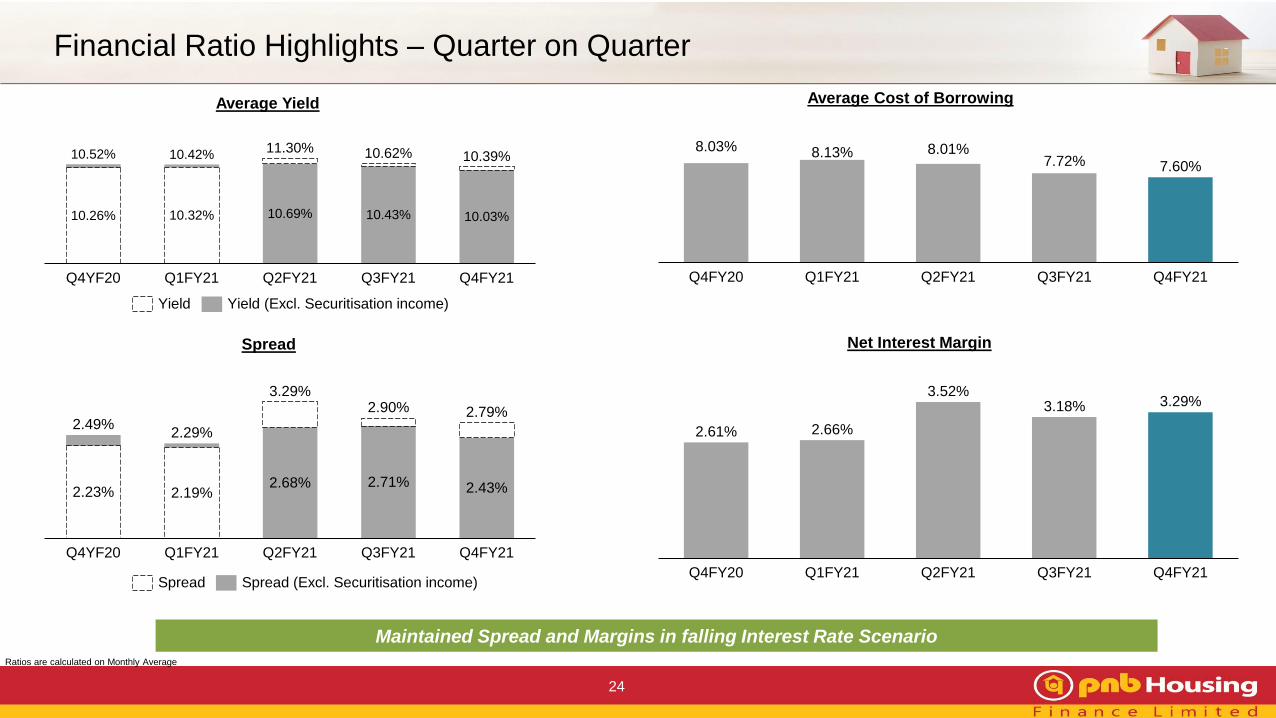
Financial Ratio Highlights – Quarter on Quarter
24
11.30%
Q4YF20 Q3FY21Q1FY21
10.26% 10.32% 10.69%
Q4FY21Q2FY21
10.43% 10.03%
10.52% 10.62%10.42% 10.39%
Q3FY21Q4FY20
8.01%
Q4FY21
7.60%
Q1FY21
8.13%
Q2FY21
8.03%7.72%
Average Cost of BorrowingAverage Yield
Net Interest MarginSpread
Ratios are calculated on Monthly Average
Maintained Spread and Margins in falling Interest Rate Scenario
2.23%
2.29%
Q4YF20 Q3FY21
2.71%2.19%
Q1FY21 Q2FY21
2.68% 2.43%
Q4FY21
2.49%
3.29%2.90% 2.79%
Yield Yield (Excl. Securitisation income)
Spread (Excl. Securitisation income)SpreadQ2FY21Q4FY20 Q3FY21Q1FY21 Q4FY21
3.52%
2.66%2.61%
3.18% 3.29%

Margin Analysis - Annual
25
Average Cost of BorrowingsAverage Yield Spread
10.7%
FY21FY19FY18 FY20
10.2% 10.4% 10.7%
Net Interest Margin
Ratios are calculated on Monthly Average
Gross Margin is net of acquisition cost
Gross Interest Margin
FY19FY18 FY20 FY21
8.2%7.7% 8.0% 7.9%
2.8%
FY20FY18 FY19 FY21
2.4% 2.5%2.5%
3.3%
FY21FY18 FY19 FY20
3.3%3.5%
3.2%
FY20FY19
3.2%
FY18
3.0%
FY21
3.2%2.9%
Return on Asset Return on Equity
FY21
1.2%
FY18 FY20FY19
1.6% 1.6%
0.8%
FY21FY19FY18 FY20
14.2%
17.4%
10.9%
8.1%
0.7%
FY20FY19FY18 FY21
0.6%0.6%
0.5%
Opex to ATA Ratio

Capital Position
26
432594
1,766
2,544
-1
0
1
2
3
4
5
0
500
1,000
1,500
2,000
2,500
3,000
3,500
4,000
0.8%0.8%
31-Mar-2031-Mar-18 31-Mar-19
2.6%
4.1%
31-Mar-21
Total Provision (as a % of assets) Total Provision
Stage 3
Coverage ratio
(%)
28.4% 20.9% 36.2% 45.2%
3.9%
15.2%
31-Mar-19*31-Mar-18*
16.7%
11.0%
12.8%
3.0%
2.8%
31-Mar-20*
3.2%
15.5%
31-Mar-21#
14.0%
18.0%
18.7%**
Tier 2 Tier 1
Capital to Risk Asset Ratio
De-leveraged Balance Sheet with enhanced Provisions
Gearing (x)
8.39.6
8.5
6.7
31-Mar-2131-Mar-18 31-Mar-19 31-Mar-20
Provisions
Ratio is calculated on Monthly Average
*Based on IGAAP#Based on IND-AS
(INR Crore)
**Adjusted for deposits with companies in same group, which gets
deducted from Net owned Funds, the CRAR would have been 20.6%.
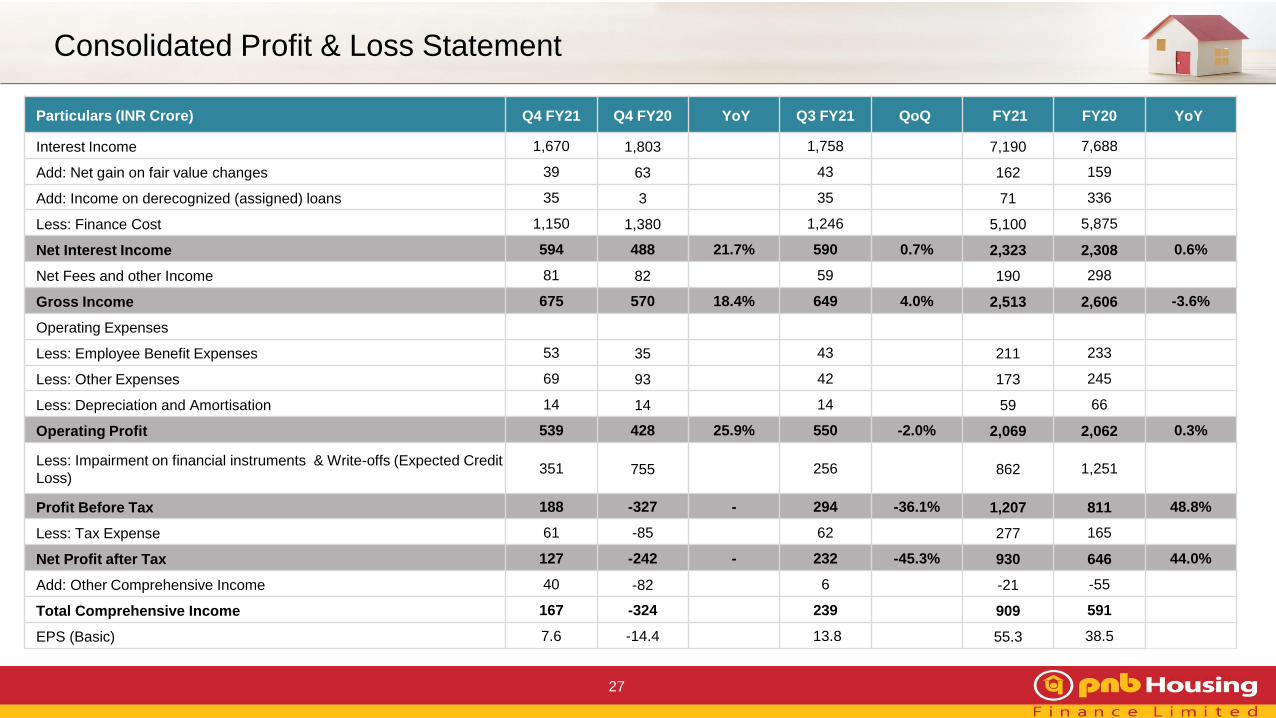
Consolidated Profit & Loss Statement
27
Particulars (INR Crore) Q4 FY21 Q4 FY20 YoY Q3 FY21 QoQ FY21 FY20 YoY
Interest Income 1,670 1,803 1,758 7,190 7,688
Add: Net gain on fair value changes 39 63 43 162 159
Add: Income on derecognized (assigned) loans 35 3 35 71 336
Less: Finance Cost 1,150 1,380 1,246 5,100 5,875
Net Interest Income 594 488 21.7% 590 0.7% 2,323 2,308 0.6%
Net Fees and other Income 81 82 59 190 298
Gross Income 675 570 18.4% 649 4.0% 2,513 2,606 -3.6%
Operating Expenses
Less: Employee Benefit Expenses 53 35 43 211 233
Less: Other Expenses 69 93 42 173 245
Less: Depreciation and Amortisation 14 14 14 59 66
Operating Profit 539 428 25.9% 550 -2.0% 2,069 2,062 0.3%
Less: Impairment on financial instruments & Write-offs (Expected Credit
Loss)351 755 256 862 1,251
Profit Before Tax 188 -327 - 294 -36.1% 1,207 811 48.8%
Less: Tax Expense 61 -85 62 277 165
Net Profit after Tax 127 -242 - 232 -45.3% 930 646 44.0%
Add: Other Comprehensive Income 40 -82 6 -21 -55
Total Comprehensive Income 167 -324 239 909 591
EPS (Basic) 7.6 -14.4 13.8 55.3 38.5

Consolidated Balance Sheet
28
Particulars (INR Crore) 31-Mar-21 31-Mar-20
LIABILITIES
1 Financial Liabilities
(a) Derivative financial instruments 51 -
(b) Debt Securities 11,461 17,837
(c) Borrowings (Other than Debt Securities) 29,746 32,328
(d) Deposits 16,746 16,132
(e) Subordinated Liabilities 1,439 1,439
(f) Other financial liabilities 1,764 1,776
Sub Total - Financial Liabilities 61,208 69,512
2 Non-Financial Liabilities
(a) Current Tax Liabilities 63 -
(b) Provisions 18 19
(c) Other non-financial liabilities 1,180 1,401
Sub Total - Non-Financial Liabilities 1,261 1,420
3 EQUITY
(a) Equity Share capital 168 168
(b) Other Equity 8,755 7,830
Sub Total - Equity 8,923 7,998
TOTAL – EQUITY & LIABILITIES 71,392 78,930
Particulars (INR Crore) 31-Mar-21 31-Mar-20
ASSETS
1 Financial Assets
(a) Cash and cash equivalents 6,969 8,514
(b) Loans 60,645 66,628
(c) Investments 2,045 2,076
(d) Other Financial Assets 952 872
Sub Total - Financial Assets 70,610 78,090
2 Non - Financial Assets
(a) Tax Assets (Net) 430 347
(b) Property, Plant and Equipment 82 105
(c) Right of use assets 78 120
(d) Other Intangible assets 21 25
(e) Other non-financial assets 35 35
(f) Assets held for sale 136 207
Sub Total - Non - Financial Assets 782 839
TOTAL - ASSETS 71,392 78,930
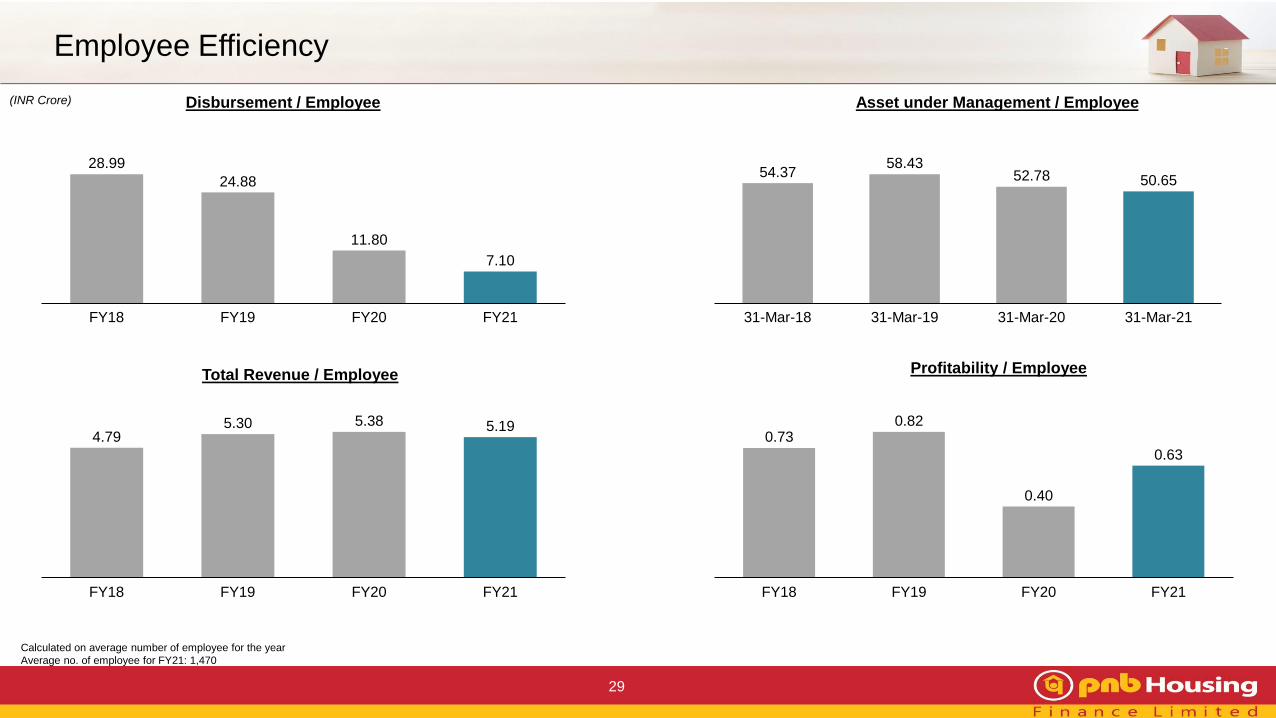
Employee Efficiency
29
Asset under Management / EmployeeDisbursement / Employee
Total Revenue / Employee Profitability / Employee
0.730.82
0.40
0.63
FY18 FY19 FY20 FY21
28.99
24.88
11.80
7.10
FY21FY18 FY19 FY20
54.3758.43
52.78 50.65
31-Mar-2131-Mar-1931-Mar-18 31-Mar-20
4.795.30 5.38 5.19
FY18 FY19 FY20 FY21
Calculated on average number of employee for the year
Average no. of employee for FY21: 1,470
(INR Crore)
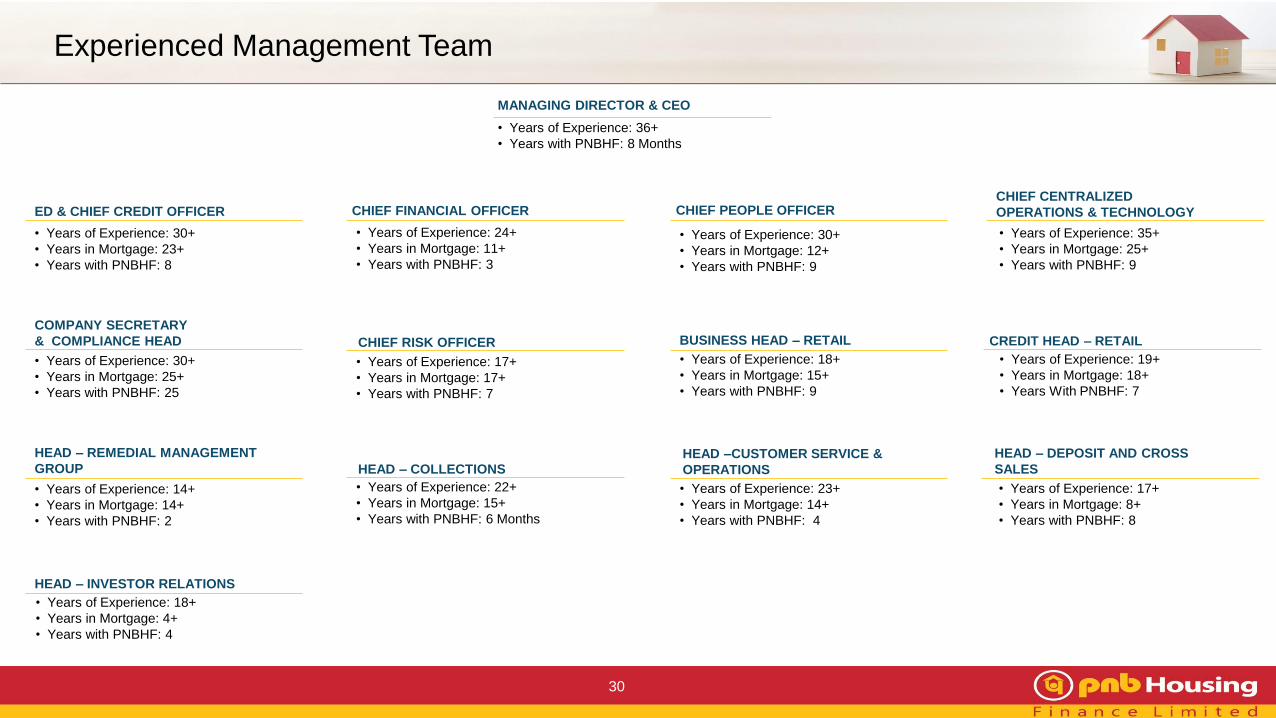
Experienced Management Team
30
• Years of Experience: 36+
• Years with PNBHF: 8 Months
MANAGING DIRECTOR & CEO
• Years of Experience: 30+
• Years in Mortgage: 12+
• Years with PNBHF: 9
CHIEF PEOPLE OFFICER
• Years of Experience: 35+
• Years in Mortgage: 25+
• Years with PNBHF: 9
CHIEF CENTRALIZED
OPERATIONS & TECHNOLOGY
• Years of Experience: 19+
• Years in Mortgage: 18+
• Years With PNBHF: 7
CREDIT HEAD – RETAIL
• Years of Experience: 18+
• Years in Mortgage: 15+
• Years with PNBHF: 9
BUSINESS HEAD – RETAIL
• Years of Experience: 23+
• Years in Mortgage: 14+
• Years with PNBHF: 4
HEAD –CUSTOMER SERVICE &
OPERATIONS
• Years of Experience: 17+
• Years in Mortgage: 8+
• Years with PNBHF: 8
HEAD – DEPOSIT AND CROSS
SALES
• Years of Experience: 24+
• Years in Mortgage: 11+
• Years with PNBHF: 3
CHIEF FINANCIAL OFFICER
• Years of Experience: 17+
• Years in Mortgage: 17+
• Years with PNBHF: 7
CHIEF RISK OFFICER
• Years of Experience: 22+
• Years in Mortgage: 15+
• Years with PNBHF: 6 Months
HEAD – COLLECTIONS
• Years of Experience: 30+
• Years in Mortgage: 25+
• Years with PNBHF: 25
COMPANY SECRETARY
& COMPLIANCE HEAD
• Years of Experience: 14+
• Years in Mortgage: 14+
• Years with PNBHF: 2
HEAD – REMEDIAL MANAGEMENT
GROUP
• Years of Experience: 18+
• Years in Mortgage: 4+
• Years with PNBHF: 4
HEAD – INVESTOR RELATIONS
• Years of Experience: 30+
• Years in Mortgage: 23+
• Years with PNBHF: 8
ED & CHIEF CREDIT OFFICER

Shareholding
31
Outstanding Shares – 16,82,68,123 shares
32.6%
32.2%
24.5%
2.1%6.3%
2.1% 0.2%
Shareholding as on 31-Mar-21
Promoters Quality Investment Holdings Foreign Inst. Investors
Mutual Funds Public & Others Bodies Corporates
Financial Institutions / Banks
Top Shareholders
SSG Capital, General Atlantic Singapore Fund, Franklin Templeton
MF, Malabar Investments, Vanguard, Blackrock (ETFs), United
India Insurance, Edelweiss Trusteeship MF, Reliance Capital MF,
Dimensional Fund Advisors
Index Since
MSCI Emerging Markets IMI ESG Screened Index Mar-21
MSCI ACWI IMI ex Controversial Weapons Index Mar-21
MSCI ACWI IMI Climate Change Index Mar-21
MSCI Global Small Cap Index Nov-18
Inclusions in MSCI Indices

ESG Snapshot
32
Environment
Human Capital Governance
Social
• Team of 1,391 employees as on 31st March 2021
• Young organization with average age of 35 years
• 18% women employees
• Learning & development (FY21):
• 1,532 unique employees trained
• 1,561 number of training programme conducted
• Over 95% reduction in usage of paper for customer communication
• 99% EMI collections through digital mode
• Encouraging adoption of cloud computing technology, virtualisation, data
centre energy optimisation among others
• Introduced ACE for digital customer onboarding and launched Homie a
sales Chat Bot to minimize physical interface
• Over 55% customers on mobile app
• Covid-19: Supported scientific research and health initiatives, contributed
towards PM Relief
• Conducted skill development for 5,000 construction workers and ensured holistic
care to 3,000 children of construction workers
• Continued strengthening various education initiatives – supported operational
and infrastructure support to 9 schools
• Diversified & highly experienced Board of 11 members with 5
independent directors
• Systems in place to address stakeholder’s grievances viz
customers, shareholders’, vendors etc.
• Strong and well experienced senior management team with
extensive industry experience
• Over 90% of customer requests resolved within TAT
• Invested in healthcare programs with an aim to upgrade
primary and tertiary health facilities across the country
• Ensuring livelihood to resource poor women through two
projects in Rajasthan and MP

Key Takeaways
33
Robust Underwriting
Processes
Strong Thrust on
DigitizationFocus on Retail Segment
Resolutions in Corporate
Book
Improving
Cost-to-Income Ratio
Augment Collection
efficiencies
Strengthening digital
presence across the
value chain
Continue to operate in
mass housing and
merchant segment
Focus on affordable
housing including high
yielding Unnati segment
Created Remedial
management
Group to focus on
resolution and
management of
corporate accounts
Operating leverage
playing out, thereby
improving Cost to
Income Ratio
Improve collection
efficiencies through
predictive analytics,
automated workflow,
digital tools etc
Robust and scalable
Hub and Spoke model
Leverage advance
analytics and digital
tools to automate credit
appraisal journey

Growth of Housing Finance Sector
34
Portfolio Growth of HFCs
21%
26% 25%
31% 32%
15%
3%
3% 4%
20%
22% 21% 20%25%
12%
3% 6%
9%
19% 21% 20%
15%
22%
11%
3%
8%11%
Mar-14 Mar-15 Mar-16 Mar-17 Mar-18 Mar-19 Mar-20 Mar-21E Mar-22E
Other Loans Overall Portfolio Home Loans
Source: ICRA Reports
*As on Dec-20
% Change is YoY
Portfolio Composition of HFCs*
63%16%
19%
2%
Home Loans LAP Construction Finance Others
24.5%
10.7%9.5%5.0%
1.7%1.8%
19.6%
4.2%
8.5%
40.5% 37.6%
25.3%
1.7%
18.8%
38.5%
Mar-17
25.7%
1.6%5.9%
11.5%
42.8%
17.4%
37.8%
Mar-18
27.2%
1.7%1.9%
6.9%
19.5%18.0%
Dec-20Mar-16
27.5%
6.0%6.2%
18.6%
Mar-19 Mar-20
23.9%
5.7%6.2%
39.9%
HFCs Share
7.7 9.6Total HFC Loans
(INR trillion)6.4 10.8 11.311.3
HDFC
LICHF
IBHF
Can Fin
PNBHF
Others
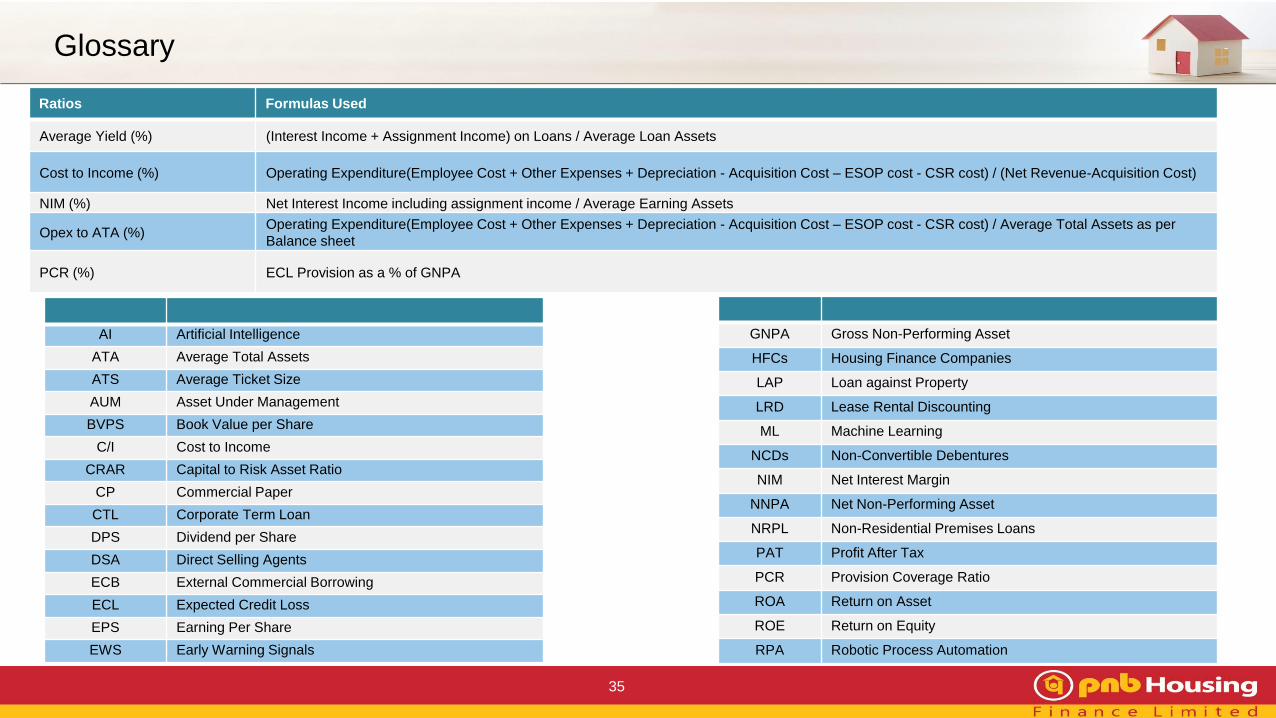
Glossary
35
AI Artificial Intelligence
ATA Average Total Assets
ATS Average Ticket Size
AUM Asset Under Management
BVPS Book Value per Share
C/I Cost to Income
CRAR Capital to Risk Asset Ratio
CP Commercial Paper
CTL Corporate Term Loan
DPS Dividend per Share
DSA Direct Selling Agents
ECB External Commercial Borrowing
ECL Expected Credit Loss
EPS Earning Per Share
EWS Early Warning Signals
GNPA Gross Non-Performing Asset
HFCs Housing Finance Companies
LAP Loan against Property
LRD Lease Rental Discounting
ML Machine Learning
NCDs Non-Convertible Debentures
NIM Net Interest Margin
NNPA Net Non-Performing Asset
NRPL Non-Residential Premises Loans
PAT Profit After Tax
PCR Provision Coverage Ratio
ROA Return on Asset
ROE Return on Equity
RPA Robotic Process Automation
Ratios Formulas Used
Average Yield (%) (Interest Income + Assignment Income) on Loans / Average Loan Assets
Cost to Income (%) Operating Expenditure(Employee Cost + Other Expenses + Depreciation - Acquisition Cost – ESOP cost - CSR cost) / (Net Revenue-Acquisition Cost)
NIM (%) Net Interest Income including assignment income / Average Earning Assets
Opex to ATA (%)Operating Expenditure(Employee Cost + Other Expenses + Depreciation - Acquisition Cost – ESOP cost - CSR cost) / Average Total Assets as per
Balance sheet
PCR (%) ECL Provision as a % of GNPA

Disclaimer
36
This presentation and the accompanying slides (the “Presentation”), which have been prepared by PNB Housing Finance Limited (the “Company”), have been
prepared solely for information purposes and do not constitute any offer, recommendation or invitation to purchase or subscribe for any securities, and shall not form
the basis or be relied on in connection with any contract or binding commitment what so ever. No offering of securities of the Company will be made except by means
of a statutory offering document containing detailed information about the Company.
This Presentation has been prepared by the Company based on information and data which the Company considers reliable, but the Company makes no
representation or warranty, express or implied, whatsoever, and no reliance shall be placed on, the truth, accuracy, completeness, fairness and reasonableness of the
contents of this Presentation. This Presentation may not be all inclusive and may not contain all of the information that you may consider material. Any liability in
respect of the contents of, or any omission from, this Presentation is expressly excluded.
Certain matters discussed in this Presentation may contain statements regarding the Company’s market opportunity and business prospects that are individually and
collectively forward-looking statements. Such forward-looking statements are not guarantees of future performance and are subject to known and unknown risks,
uncertainties and assumptions that are difficult to predict. These risks and uncertainties include, but are not limited to, the performance of the Indian economy and of
the economies of various international markets, the performance of the industry in India and world-wide, competition, natural calamities, inflation, deflation, the
performance of the financial markets in India and globally, changes in Indian laws and regulations, including tax, accounting and housing finance companies
regulations, changes in competition and the pricing environment in India, and regional or general changes in asset valuations, the Company’s ability to successfully
implement its strategy, the Company’s future levels of growth and expansion, technological implementation, changes and advancements, changes in revenue, income
or cash flows, the Company’s market preferences and its exposure to market risks, as well as other risks. The Company’s actual results, levels of activity, performance
or achievements could differ materially from results expressed in or implied by this Presentation. The Company assumes no obligation to update any forward-looking
information contained in this Presentation. Any forward-looking statements and projections made by third parties included in this Presentation are not adopted by the
Company and the Company is not responsible for such third party statements and projections.
37
Thank You
Company:
PNB Housing Finance Limited
CIN: L65922DL1988PLC033856
Ms. Deepika Gupta Padhi (Head-Investor Relations)
Phone: +91 11 23445214
www.pnbhousing.com