INVESTOR PRESENTATION Q1:2019 - Saia Corporation · FORWARD LOOKING STATEMENT During this...
23
INVESTOR PRESENTATION Q1:2019
Transcript of INVESTOR PRESENTATION Q1:2019 - Saia Corporation · FORWARD LOOKING STATEMENT During this...

INVESTOR PRESENTATION Q1:2019

FORWARD LOOKING STATEMENT
During this presentation, some "forward-looking statements" within the meaning of
the Private Securities Litigation Reform Act of 1995, may be made. These "forward-
looking statements" and all other statements that may be made in this presentation
that are not historical facts are subject to a number of risks and uncertainties;
therefore, actual results may differ materially. Please refer to our recent SEC filings
for more information on the factors that could cause actual results to differ.
2

• Saia competes in the domestic less-than-truckload (LTL) market with estimated annual industry revenue of $40 billion
• In the LTL industry, the top 5, 10 and 25 carriers have approximately 50%, 75% and 90% total share of revenue respectively
OUR INDUSTRY
$0
$1,000
$2,000
$3,000
$4,000
$5,000
$6,000
$7,000
$8,000
FEDEXFREIGHT
OLDDOMINION
XPOFREIGHT
UPSFREIGHT
YRCFREIGHT
ABFFREIGHT
ESTESEXPRESSLINE
YRCREGIONAL
R+LCARRIERS
SAIA
Top 10 LTL Carriers – Revenue* (M)
3
* Most recent annual reported revenue

OUR COMPANY
NON-UNIONEMPLOYEES
~10k ~18kTRACTORS, TRAILERS & FORKLIFTS
160TERMINALS
~5/7AVERAGE AGE OF TRACTORS/TRAILERS
SHIPMENTS DELIVERED DAILY
~29K
AND WE’RE STILL GROWING . . .
4

OUR CUSTOMERS
No single customer represents greater than 4% of sales5

SOURCE: CUSTOMER SATISFACTION
SURVEY, MASTIO & COMPANY, DEC 2015
PEOPLE
PROCESS
TOOLS99.1%+
INVOICEACCURACY
99.5%+CLAIMS-FREE
98%+ON-TIMEDELIVERY
99%+ON-TIMEPICKUP
98%+EXCEPTION-
FREE
CUSTOMER SATISFACTION
IS OUR #1 GOAL
WE OFFER A SUPERIOREXPERIENCE AS A TRUSTED CARRIER
CUSTOMER SERVICE INDICATORS
6

OUR SERVICE
• 40-state coverage
• Average LTL shipment weighs 1,322 pounds
• Average length of haul 837 miles
• ~75% of our shipments are delivered within 48 hours
• 2018 Cargo claims ratio of 0.79%
0.0%
0.2%
0.4%
0.6%
0.8%
1.0%
1.2%
2013 2014 2015 2016 2017 2018
Claims Ratio
7
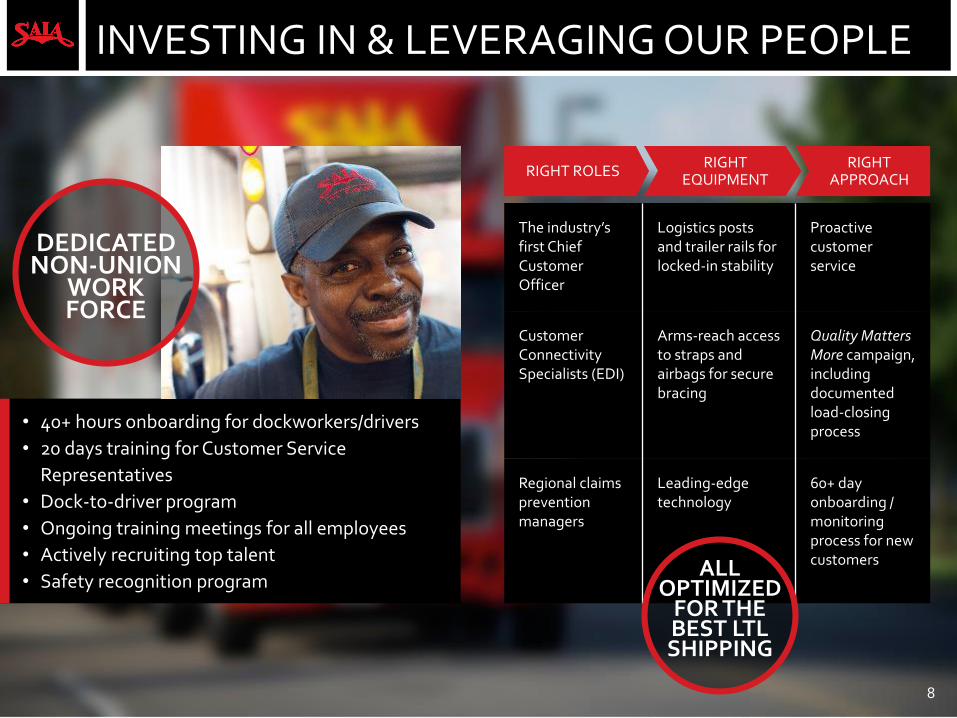
• 40+ hours onboarding for dockworkers/drivers
• 20 days training for Customer Service
Representatives
• Dock-to-driver program
• Ongoing training meetings for all employees
• Actively recruiting top talent
• Safety recognition program
DEDICATED NON-UNION
WORK FORCE
RIGHT ROLESRIGHT
EQUIPMENTRIGHT
APPROACH
The industry’s first Chief Customer Officer
Logistics posts and trailer rails for locked-in stability
Proactive customer service
Customer Connectivity Specialists (EDI)
Arms-reach access to straps and airbags for secure bracing
Quality Matters More campaign, including documented load-closing process
Regional claims prevention managers
Leading-edge technology
60+ day onboarding / monitoring process for new customersALL
OPTIMIZED FOR THE BEST LTL SHIPPING
INVESTING IN & LEVERAGING OUR PEOPLE
8

AS REPORTED BY AN INDEPENDENT THIRD-PARTY SURVEY
1 Hire experienced drivers
2 300+ driver trainers on staff
3Annually certify all drivers in Smith System Defensive Driving
4 Weekly pre-shift safety meetings
5 100% of drivers are HazMat certified
6Tractors equipped with advanced collision avoidance technology
7 Bendix and Lytx – video training
8 Fleet Safety Gap Analysis
PEOPLE
PROCESS
TECHNOLOGY
OUR SAFETY CULTURE
9

IMPROVED RESULTS
• Pricing discipline has led to improved financial results
• Revenue – 7-year CAGR of 7%
• Operating Income – 7-year CAGR of 26%
$1
$21
$41
$61
$81
$101
$121
$141
$161
$400
$600
$800
$1,000
$1,200
$1,400
$1,600
$1,800
2011 2012 2013 2014 2015 2016 2017 2018
Revenue vs Operating Income
Revenue (mil) Operating Income (mil)
10

• Average tractor age has improved to 5 years from 8 years
• Average trailer age has improved to 7 years from 12 years
• Fuel mileage benefit as well as lower emissions across the fleet
• Buying tractors with automatic transmissions to potentially attract new entrants to driver workforce
INVESTMENTS
11
$68$83
$122$112 $113
$152
$217
$252
$(10)
$40
$90
$140
$190
$240
$290
2011 2012 2013 2014 2015 2016 2017 2018
Equipment Properties Technology Maintenance Replacement Level

NORTHEAST EXPANSION
Opened 10 new terminals since May 2017 to serve new markets in the Northeast, with 4-6 additional terminal openings slated for 2019.
TST Partnership to serve Canadian customers
Annual LTL industry revenue in the northeastern US is approximately $8 billion of the total domestic LTL industry estimated at $40 billion
$6 billion
12

GEOGRAPHIC EXPANSION
1 Northeast market expansion was initiated in May 2017
2Saia has looked to supplement existing geographic footprint
3 Building 48 state coverage and density
4Northeastern presence to provide access to Canadian customers – TST Overland Express
5 Leverage infrastructure
6 Attain operating efficiencies “less fringe in network”
7 Supports Yield initiatives
13

4Q18 FINANCIAL RESULTS
• LTL Shipments per workday decreased 0.2%
• LTL Tonnage per workday decreased 0.6%
• LTL Yield increased 12.0%
• Record Revenue and Operating Income
4Q2018 4Q2017 Change
Revenue $407 $360 13%
Operating Income $33.3 $22.9 45%
Operating Ratio (%) 91.8 93.6 180 bps
Diluted Earnings Per Share $0.97 $1.82 NM
Net Debt / Capital (%) 14.8 18.0 NM
EBITDA* $60.2 $45.6 32%*non-GAAP Financial Metric reconcilliation included in Appendix
In $ U.S. millions except per share amounts and %
14

2018 FINANCIAL RESULTS
• LTL Shipments per workday increased 4.4%
• LTL Tonnage per workday increased 6.6%
• LTL Yield increased 10.2%
• Record Revenue and Operating Income
2018 2017 Change
Revenue $1,654 $1,405 18%
Operating Income $141.2 $94.7 49%
Operating Ratio (%) 91.5 93.3 180 bps
Diluted Earnings Per Share $3.99 $3.49 NM
Net Debt / Capital (%) 14.8 18.0 NM
EBITDA* $243.3 $181.8 34%*non-GAAP Financial Metric reconcilliation included in Appendix
In $ U.S. millions except per share amounts and %
15

INVESTMENT SUMMARY
• Unique story in that we are a 90+ year old company, with above-market growth potential
• Investments in our network have us well positioned for volume growth and share gains
• Significant Revenue Growth Opportunities:
On-going yield improvement opportunities
Geographic expansion into additional U.S. markets and Canada
Market penetration opportunities in legacy geography
• Significant operating leverage as 100 basis points of operating margin improvement results in $0.47 per share in earnings
16

APPENDIX
Thank you for your continued interest in Saia!
For more information see our website www.saia.comor contact [email protected]
17

FINANCIAL POSITION
• Solid liquidity position
• Capacity to fund growth
(millions)Borrowings Liquidity
Cash $ - $ 2.2
Capitalized Leases 102.9 -
Senior Fixed Notes - -
Revolving Credit Facility 20.0 202.3
Total $ 122.9 $204.5
Revolving Credit Facility $250.0
Borrowings (20.0)
Letters of Credit Outstanding
(27.7)
Available on Facility $202.3
$157$148
$127$133
$143
$155
$121 $123
$0
$20
$40
$60
$80
$100
$120
$140
$160
$180
3/31/17 6/30/17 9/30/17 12/31/17 3/31/18 6/30/18 9/30/18 12/31/18
Total Debt
18

RECONCILIATION OF NON-GAAP MEASURES
In thousands, except per share amounts
2018 4Q TTM Net debt / total capital: 31-Dec-18Revenue from continuing operations $1,653,849 Total debt $122,859Increase in operating income resulting
from 1% operating ratio improvement $16,538 Less: Cash and cash equivalents $2,194
Marginal tax rate 25.00% Net debt $120,665Increase in net income resulting from 1%
operating ratio improvement $12,404
Shareholders' equity $695,864
Common shares outstanding - Diluted 26,289 Total capital $816,529Increase in earnings per share resulting
from 1% operating ratio improvement $0.47 Net debt / Total capital 14.8%
2018 4Q EBITDA
Income Before Income Taxes $31,698
Interest Expense $1,328
Depreciation and amortization $27,188
EBITDA $60,214
2018 EBITDA
Income Before Income Taxes $135,833
Interest Expense $5,418
Depreciation and amortization $102,153
EBITDA $243,404 19

2019 PLANNED CAPEX
20
($ in thousands) Count Cost
Tractors ~1000 114,000$
Trailers ~1700 61,000
Forklifts 9,000
Net Revenue Equipment 184,000
Properties 72,000
Technology Equipment 19,000
Net Capital Expenditures 275,000$

HISTORICAL TRENDS
Operating Income ($mil) EPS ($)
-
20.0
40.0
60.0
80.0
100.0
120.0
140.0
160.0
2013 2014 2015 2016 2017 2018 -
0.50
1.00
1.50
2.00
2.50
3.00
3.50
4.00
4.50
2013 2014 2015 2016 2017* 2018
*Adjusted EPS – see slide 18 for Reconciliation of this Non-GAAP Measure
21
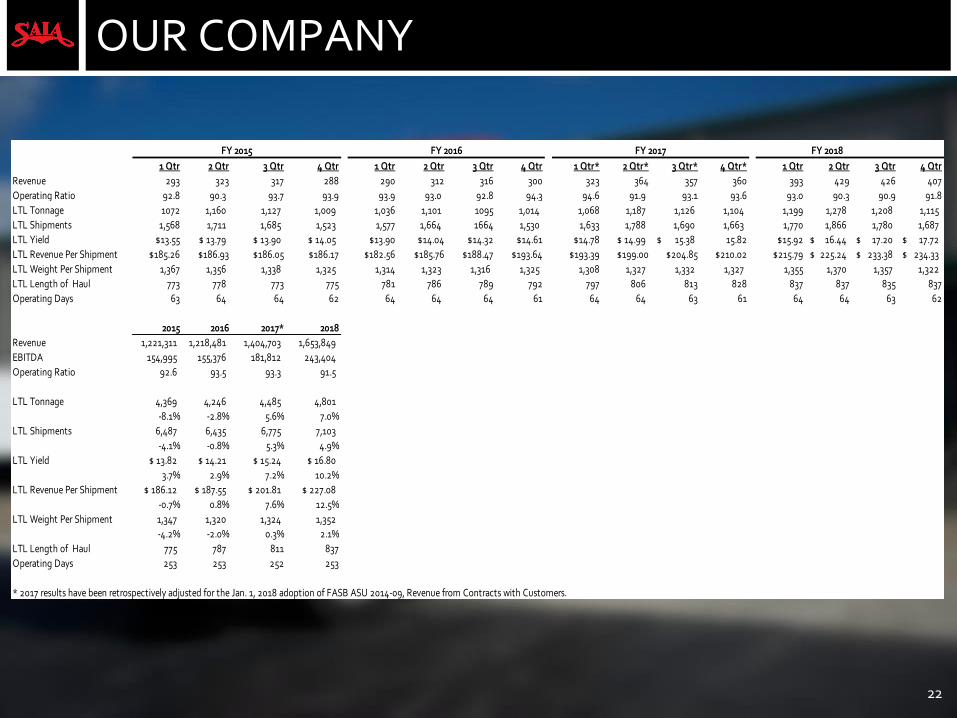
OUR COMPANY
FY 2015 FY 2016 FY 2017
1 Qtr 2 Qtr 3 Qtr 4 Qtr 1 Qtr 2 Qtr 3 Qtr 4 Qtr 1 Qtr* 2 Qtr* 3 Qtr* 4 Qtr* 1 Qtr 2 Qtr 3 Qtr 4 Qtr
Revenue 293 323 317 288 290 312 316 300 323 364 357 360 393 429 426 407
Operating Ratio 92.8 90.3 93.7 93.9 93.9 93.0 92.8 94.3 94.6 91.9 93.1 93.6 93.0 90.3 90.9 91.8
LTL Tonnage 1072 1,160 1,127 1,009 1,036 1,101 1095 1,014 1,068 1,187 1,126 1,104 1,199 1,278 1,208 1,115
LTL Shipments 1,568 1,711 1,685 1,523 1,577 1,664 1664 1,530 1,633 1,788 1,690 1,663 1,770 1,866 1,780 1,687
LTL Yield $13.55 $ 13.79 $ 13.90 $ 14.05 $13.90 $14.04 $14.32 $14.61 $14.78 $ 14.99 15.38$ 15.82 $15.92 16.44$ 17.20$ 17.72$
LTL Revenue Per Shipment $185.26 $186.93 $186.05 $186.17 $182.56 $185.76 $188.47 $193.64 $193.39 $199.00 $204.85 $210.02 $215.79 225.24$ 233.38$ 234.33$
LTL Weight Per Shipment 1,367 1,356 1,338 1,325 1,314 1,323 1,316 1,325 1,308 1,327 1,332 1,327 1,355 1,370 1,357 1,322
LTL Length of Haul 773 778 773 775 781 786 789 792 797 806 813 828 837 837 835 837
Operating Days 63 64 64 62 64 64 64 61 64 64 63 61 64 64 63 62
2015 2016 2017* 2018
Revenue 1,221,311 1,218,481 1,404,703 1,653,849
EBITDA 154,995 155,376 181,812 243,404
Operating Ratio 92.6 93.5 93.3 91.5
LTL Tonnage 4,369 4,246 4,485 4,801
-8.1% -2.8% 5.6% 7.0%
LTL Shipments 6,487 6,435 6,775 7,103
-4.1% -0.8% 5.3% 4.9%
LTL Yield $ 13.82 $ 14.21 $ 15.24 $ 16.80
3.7% 2.9% 7.2% 10.2%
LTL Revenue Per Shipment $ 186.12 $ 187.55 $ 201.81 $ 227.08
-0.7% 0.8% 7.6% 12.5%
LTL Weight Per Shipment 1,347 1,320 1,324 1,352
-4.2% -2.0% 0.3% 2.1%
LTL Length of Haul 775 787 811 837
Operating Days 253 253 252 253
* 2017 results have been retrospectively adjusted for the Jan. 1, 2018 adoption of FASB ASU 2014-09, Revenue from Contracts with Customers.
FY 2018 FY 2019
22

MANAGEMENT OVERVIEW
Management Team
Saia
Tenure
Industry
Experience
Chief Executive Officer 22 33
President,Chief Operating Officer 5 10
EVP, Chief Customer Officer 21 30
EVP, Operations 42 42
V.P. Human Resources 5 17
23