Investor Presentation - Philstocks · RCBC 10.6 DBP 10.5 UBP 9.0 SMPH 18.1 Ayala Land 12.5...
45
Investor Presentation September 2016
Transcript of Investor Presentation - Philstocks · RCBC 10.6 DBP 10.5 UBP 9.0 SMPH 18.1 Ayala Land 12.5...
Investor Presentation
September 2016

2
Table of Contents
• The Philippine Economy 3• About SM Investments 5 • SM Retail 13• Banking 17• SM Prime 18• Land Bank 32• Portfolio Investments 35• Financials 38

3
Philippines: Strong Macroeconomic Fundamentals
• Avg. Inflation rate: 1.3% (Jan-Jun 2016)
• Avg. Real lending rate: 4.33% (Jan-Jun 2016)
• Stable Currency: -0.44% (YE2015 vs End-Jun 2016)
• Debt/GDP: 43.6%• CAR: 16.4%• NPLs: 1.7%• Net lender to the IMF
• Job creation and inclusive growth
• Regional growth – Visayas, Mindanao
• Infrastructure development
• Agriculture, Tourism, Manufacturing
• Foreign Investment
Opportunities
Net External Inflows and ICT ExportsImproving Costs of Doing Business
Healthy Fiscal and Monetary System
Young Workforce with Rising Incomes
Strong GDP Growth
6.9%Consumption Driven
70% of GDP
Per Capita GDP
USD2,932 (+1.8%)Per Capita GNI
USD3,558 (+2.2%)
Population
101M (+1.7%)Median Age
23
S&P BBB Stable
Moody's Baa2 Positive
Fitch BBB- Positive
Current Credit Ratings9.2
3.710.6
26.3
6.2
8.6
5.7
1.6
8.6
28.4
9.6
11.6
7.2
17.7
17.8 19.0
23.8
42.1
52.4
0
10
20
30
40
50
60
Viet Thai (2014) Mal Indo (2014) Phil (2014)
USD
bn
Net FDI Inflows Remittances ICT Export
Source: BSP Selected Economic and Financial IndicatorsRelease as of July 29, 2016
Source: The World BankNotes:• Vietnam: FDI (2014), Remit (2011), ICT Services Export No Data• Malaysia: FDI, and Remit (2014) and ICT Services Export (2013)

4
Current Administration’s 10-point Socio-economic Agenda
Maintain current macroeconomic policies, including fiscal, monetary, and trade policies
Progressive tax management
Pursue investment friendly reforms
Accelerate infrastructure development
Increase agricultural and rural enterprise productivity and rural tourism
Effective land management
Invest in human capital development
Promote science, technology, and the creative arts to enhance innovation and creative capacity
Improve social protection programs for greater social inclusion
Strengthen implementation of the Responsible Parenthood and Reproductive Health Law
Images from PhilStar.com

5
About SM Investments
Strong proxy for the continuing breakout of the Philippine Economy
Consumer-centric businesses
Large cap and diversified market play
Core businesses remain market leaders
Strong business model and excellent management
Prudent financial management
Tightly managed to leverage strengths and extract synergies across the Group
Ongoing focus on good corporate governance and shareholder value creation
Aggressive expansion plans ensure long-term growth
Aggressive expansion plans in all core businesses
China and Portfolio Investments provide additional upside
Funding options available for both organic and acquisition-led expansion
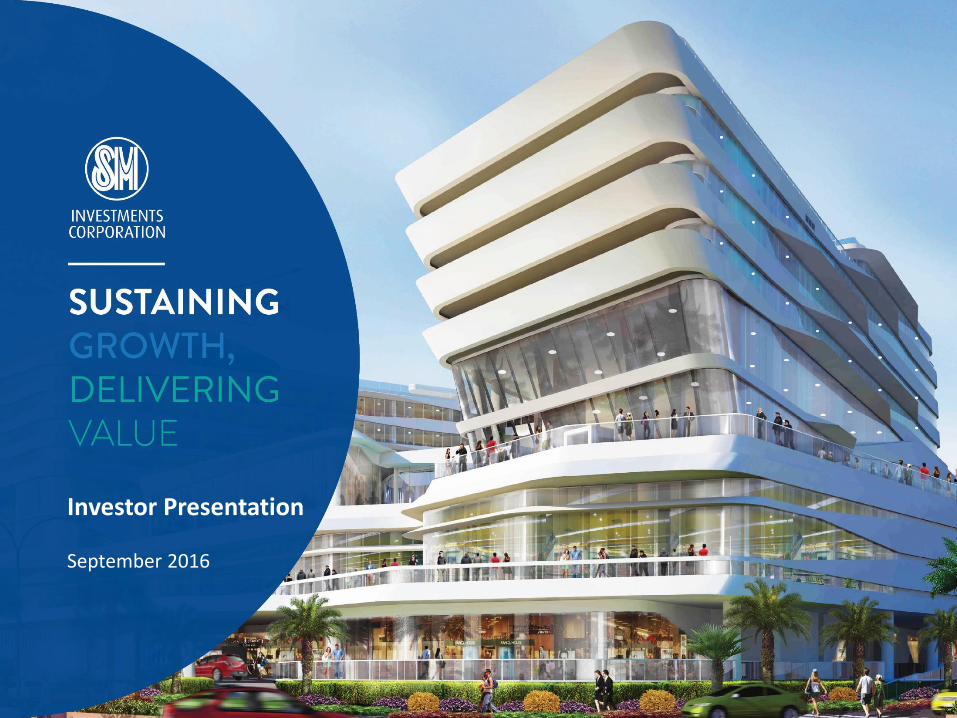
Retail
77.3%SM RETAIL INC.
SPEC
IALT
Y R
ETA
ILER
S
JOIN
T V
ENTU
RES
FOO
D
Banking
44%BANCO DE ORO
20%CHINA
BANKING
CORP.
Property
50%SM PRIME HOLDINGS, INC.
MA
LLS
RES
IDEN
TIA
L
LEIS
UR
E &
TO
UR
ISM
CO
MM
ERC
IAL
HO
TELS
&
CO
NV
ENTI
ON
S
Portfolio Investments
28% BELLE CORP
29% ATLAS
CONSOLIDATED MINING
34% CITYMALL
COMMERCIAL CENTERS
90% NET GROUP
Core Investments
6
Our Investments
THE
SM S
TOR
E
Philippine BanksTotal Resources ($bn)
Philippine RetailersTotal Stores
SM RetailPuregoldRobinsons*
294 281 166
Property DevelopersMarket Cap ($bn)
Philippine ConglosMarket Cap ($bn)
Source: Company Information, 1Q 2016*Supermarkets and Department Stores onlySource: Company Information
Source: Bloomberg; Figures as of July 29, 2016
Source: Bloomberg; Figures as of July 29, 2016
Philippine RetailersTotal Sales ($mn)
SM RetailPuregoldRobinsons*
4,4822,0601,927
*Includes all retail formatsSource: Company Information
7
SM Group Companies’ Rankings
FY 2015
FY 2015
BDO 45.1
Metrobank 36.1
BPI 33.2
Landbank 27.9
PNB 14.5
China Bank 11.7
Security Bank 11.2
RCBC 10.6
DBP 10.5
UBP 9.0
SMPH 18.1
Ayala Land 12.5
Megaworld 3.5
Robinsons Land 2.8
Double Dragon 2.7
Vistaland 1.7
Filinvest 1.0
SMIC 17.8
JG Summit 12.8
Ayala Corp 11.6
Aboitiz Equity 9.3
GT Capital 5.8
Metro Pacific 4.5
SMC 4.2
DMCI 3.7
LT Group 3.6
Alliance Global 3.6

Total Population: 101M
8
Our Business Footprint
16 Cities
Retail Stores GSA
Total 113 830,326
Food 91 469,824
Non-food 22 360,503
Property Buildings GFA
Malls 20 3,297,272
Residential 24
Office Bldgs 5 330,247
Exhibit Halls 3
Banking
BDO
China Bank 238
Metro Manila1 Municipality
Branches
459
38 Provinces
Retail Stores GSA
Total 163 800,437
Food 140 553,636
Non-food 23 246,801
Property Buildings GFA
Malls 29 2,683,723
Residential 2
Hotels 2 32,326
Banking
BDO
China Bank
Luzon55 Cities
Branches
290
174
16 Provinces
Retail Stores GSA
Total 37 218,259
Food 31 138,191
Non-food 6 80,068
Property Buildings GFA
Malls 5 1,088,157
Hotels 1 35,630
Exhibit Halls 2
Banking
BDO
China Bank
Visayas
Branches
112
64
43 Cities 27 Provinces
Retail Stores GSA
Total 15 104,764
Food 11 62,413
Non-food 4 42,351
Property Buildings GFA
Malls 4 491,254
Hotels 1 11,013
Exhibit Hall 1
Banking
BDO
China Bank 41
33 Cities
Mindanao
Branches
167
Metro Manila 44%
Luzon 35%
Visayas 14%
Mindanao 6%
Mall GFA 7,560,406
Metro Manila 42%
Luzon 41%
Visayas 11%
Mindanao 5%
Retail GSA 1,953,786
9
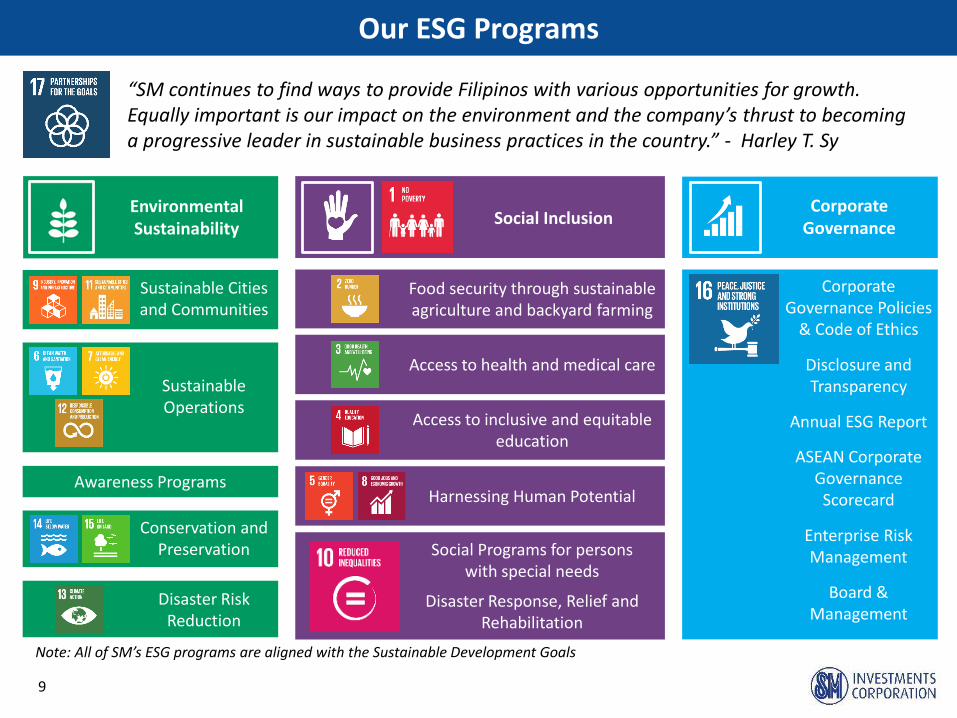
Our ESG Programs
“SM continues to find ways to provide Filipinos with various opportunities for growth. Equally important is our impact on the environment and the company’s thrust to becoming a progressive leader in sustainable business practices in the country.” - Harley T. Sy
Note: All of SM’s ESG programs are aligned with the Sustainable Development Goals
Conservation and Preservation
Sustainable Operations
Sustainable Cities and Communities
Disaster Risk Reduction
Environmental Sustainability
Social Inclusion
Access to inclusive and equitable education
Access to health and medical care
Food security through sustainable agriculture and backyard farming
Harnessing Human Potential
Social Programs for persons with special needs
Disaster Response, Relief and Rehabilitation
Corporate Governance
Annual ESG Report
ASEAN Corporate Governance Scorecard
Corporate Governance Policies
& Code of Ethics
Board & Management
Disclosure and Transparency
Enterprise Risk Management
Awareness Programs

10
Strong Leadership
TOMASA H. LIPANA, Independent Director • HENRY T. SY, JR., Vice Chairperson • TERESITA SY-COSON, Vice Chairperson • HENRY SY, SR., Chairman • HARLEY T. SY, Director and President • JOSE T. SIO, Director, Executive Vice President and Chief Finance Officer • JOSEPH R. HIGDON, Independent Director • AH DOO LIM, Independent Director
From L to R:
Board of Directors
Business Leadership
PropertyBankingRetail
Henry Jr. Hans ElizabethTeresita Hans
SM PrimeBDO China Bank
Teresita HarleyHerbert
Food Non-Food

11
10-Year Performance since PSE Listing
Assets grew at 16.3% p.a.
Revenue grew at 18.6% p.a.
Net Income grew at 13.5% p.a.
Market Cap grew 18.5% p.a.

12
Summary of SMIC Recent Performance
Retail• Completed merger of retail affiliates• Ecommerce agreement with Lazada• Opened 19 stores in 1H, 11 outside Manila• Alfamart operating 146 stores
Banking• TPG invested in ONB to develop microlending• Joint investment in PCIB Securities with Nomura • BDO took full control of its JV with BDO Life.• China Bank forms China Bank Securities
Corporation to service equities-related transactions
Property• Formed an agreement with the local government
to reclaim 1,500 hectares in Cordova, Cebu• Formed a JV with ALI and acquired 26 hectares in
South Road Project (SRP) in Cebu• Opened Conrad Manila and S’Maison in the MOA
Complex• Launched FiveE-Com Center, started construction
of Three and FourE-com Centers
Portfolio Investments• Atlas Mining announced restructuring plan• Belle delivered record recurring net income
Recent EventsFigures in PHP billion except percentages
SM Investments 1H 2016 1H 2015 Change FY 2015
Revenues 151.1 139.2 8.5% 295.9
Net Income* 15.0 13.5 11.1% 28.4
Net Margin 9.9% 9.7% - 9.6%
ROE 10.5% 10.3% - 10.3%
Net Debt:Equity 39:61 38:62 - 36:64
*Recurring Earnings growth of 8%
SM Retail 1H 2016 1H 2015 Change FY 2015
Revenues 106.9 98.4 8.7% 211.4
Net Income 3.5 3.1 13.5% 6.8
Net Margin 3.4% 3.2% - 3.2%
BDO 1H 2016 1H 2015 Change FY 2015
Net Interest Income 31.7 27.1 17.2% 57.0
Non Interest Income 22.1 16.4 34.6% 31.9
Net Income 13.2 11.7 12.9% 25.0
SM Prime 1H 2016 1H 2015 Change FY 2015
Revenues 39.2 35.9 9.4% 71.5
Normalized Net Income 12.6 11.2* 12.0% 20.9*
Net Margin 32.1% 31.4% - 28.0%
*Adjusted for gain on sale of AFS

13
SM Retail: Footprint Expansion Opportunity
Philippine Population: 101M
Visayas19M people
Luzon 45M people
NCR 13M people
Mindanao24M people
• Expand nationwide footprint outside Metro Manila• Deliver excellent customer service• Work with partners to provide best in class modern retail
Retail Strategy
Per Region Stores GSA (sqm) % of Total
Metro Manila (NCR) 113 830,326 42%
Luzon (ex-NCR) 163 800,437 41%
Visayas 37 218,259 11%
Mindanao 15 104,764 5%
Total 328 1,953,786
SM Retail Footprint 1H 2016 (Pre-Merger)
Per Format Stores GSA (sqm) Average
The SM Store 55 729,722 13,268
SM Supermarket 47 327,731 6,973
SM Hypermarket 45 346,788 7,706
SaveMore 147 447,409 3,044
Waltermart 34 102,135 3,004
Alfamart 140 29,280 209
Total* 328 1,953,786
*Alfamart not consolidated
14
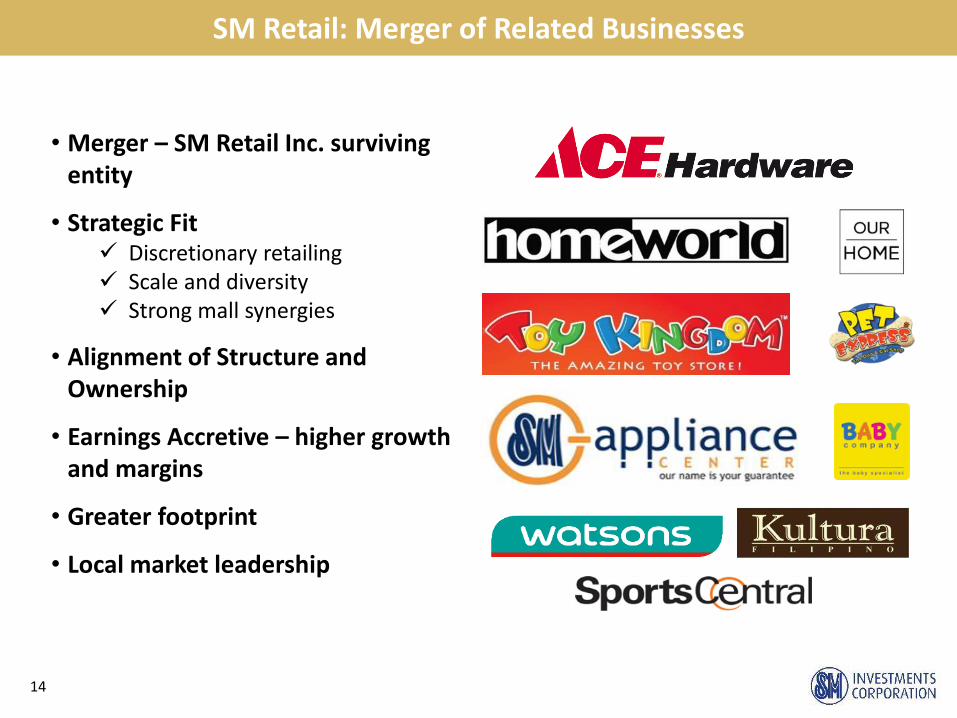
SM Retail: Merger of Related Businesses
• Merger – SM Retail Inc. surviving entity
• Strategic Fit Discretionary retailing Scale and diversity Strong mall synergies
• Alignment of Structure and Ownership
• Earnings Accretive – higher growth and margins
• Greater footprint
• Local market leadership

15
Merger Impact
Net Margin* Revenue Growth
Total Specialty 6.3% 8.3%
SM Retail (Pre-Merger) 3.4% 7.3%
In PHP Billion Revenue Net Income* Outlets
SM Retail Pre-Merger 215 7.2 310
SM Retail Post-Merger 253 TBD 1,700+
*Before minority interestNote: All figures using year-end 2015 data
Specialty Store Outlets
Ace Hardware 123
Homeworld 76
SM Appliance 65
Toy Kingdom and Pet Express
136
Watsons 459
Baby Company 79
Kultura 39
Sports Central 81
Others 371
Total 1,429
Note: Includes outlets in other SM Retail formats
Increased Presence in Discretionary Retailing
Higher Margins and Revenue Growth
Increased Scale

16
SM Retail: Post-Merger Structure
SMIC77.3%
SM Retail
Food Non-Food
SM Store SpecialtyJoint
Ventures
Supermarkets
Hypermarkets
Savemore
WalterMart
• Forever 21• Uniqlo• Sfera• Bata• Uno de 50• Body Shop• L’ Indochine• Joseph• Crate & Barrel• Crocs
• Ace Hardware• Baby Company• Homeworld• Kultura• Our Home• SM Appliances• Sports Central• Toy Kingdom• Watsons• Others
Alfamart

17
Banking
• Diversified and sustainable earning stream
• Client acquisition through branch expansion
• Drive provincial lending and deposit taking initiatives
• Expand fee income
• Operating leverage
• Set up operating platform to support future growth
• Implement digital strategy
• Prudent balance sheet management
• Conservative provisioning for risk assets
• Complement current funding with long term
• Ensure sufficient capital to support growth
Business Strategy• Accelerate Expansion
• Grow Revenue Lines
• Solidify presence in corporate market
• Defend market share for commercial/middle market/SMEs
• Expand menu of consumer products
• Continue diversification of fee-based businesses
• Intensify branding and differentiation
Business Strategy
BDO China Bank
18
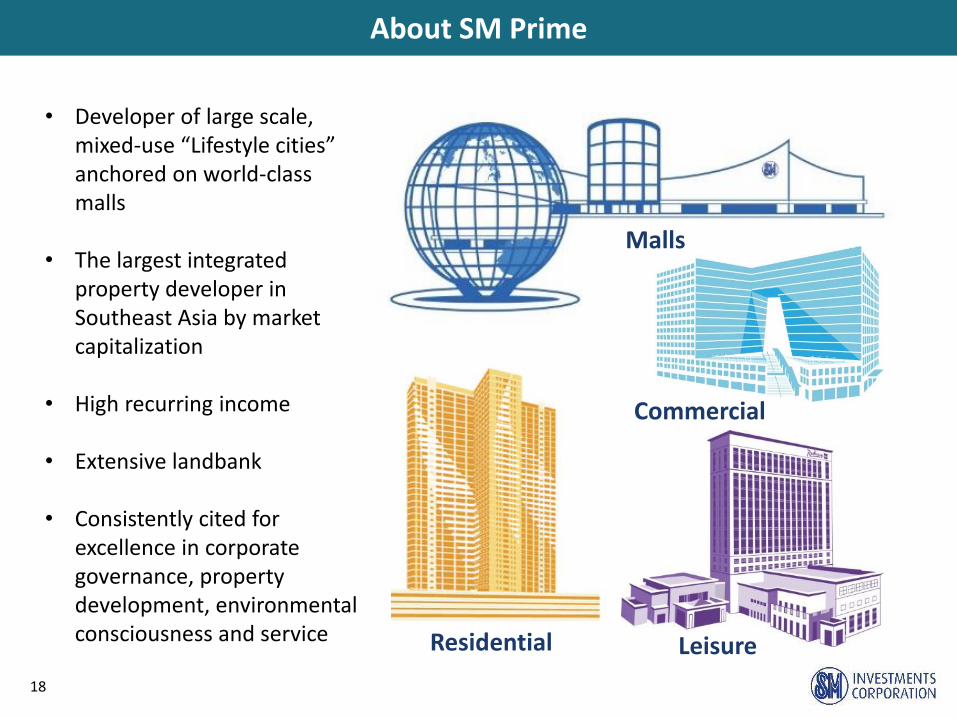
About SM Prime
• Developer of large scale, mixed-use “Lifestyle cities” anchored on world-class malls
• The largest integrated property developer in Southeast Asia by market capitalization
• High recurring income
• Extensive landbank
• Consistently cited for excellence in corporate governance, property development, environmental consciousness and service Residential
Commercial
Leisure
Malls
19
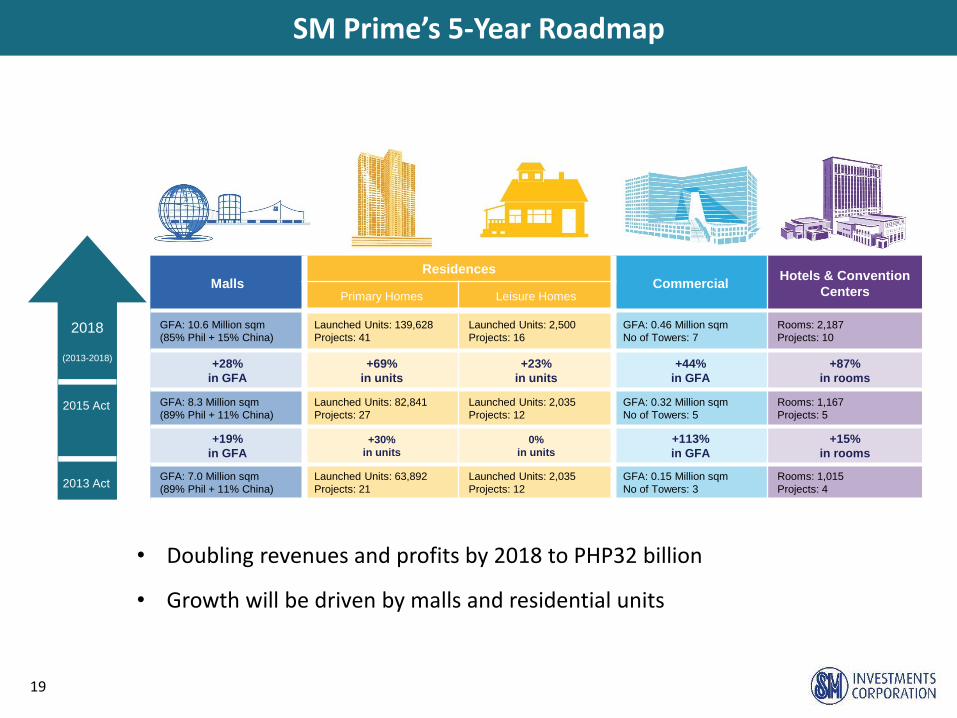
SM Prime’s 5-Year Roadmap
• Doubling revenues and profits by 2018 to PHP32 billion
• Growth will be driven by malls and residential units
A
A
E
(2013-2018)
(2013-2018)
2018
2015 Act
2013 Act
MallsResidences
CommercialHotels & Convention
CentersPrimary Homes Leisure Homes
GFA: 10.6 Million sqm
(85% Phil + 15% China)
Launched Units: 139,628
Projects: 41
Launched Units: 2,500
Projects: 16
GFA: 0.46 Million sqm
No of Towers: 7
Rooms: 2,187
Projects: 10
+28%
in GFA
+69%
in units
+23%
in units
+44%
in GFA
+87%
in rooms
GFA: 8.3 Million sqm
(89% Phil + 11% China)
Launched Units: 82,841
Projects: 27
Launched Units: 2,035
Projects: 12
GFA: 0.32 Million sqm
No of Towers: 5
Rooms: 1,167
Projects: 5
+19%
in GFA
+30%
in units
0%
in units
+113%
in GFA
+15%
in rooms
GFA: 7.0 Million sqm
(89% Phil + 11% China)
Launched Units: 63,892
Projects: 21
Launched Units: 2,035
Projects: 12
GFA: 0.15 Million sqm
No of Towers: 3
Rooms: 1,015
Projects: 4

20
SM Prime vs Peers
Most defensive and least cyclical among Philippine property conglomerates
7.7M
2.0M 1.0M 1.4M
Source: Latest Available Company Information
*Excludes Hotels and Resorts
63%
21
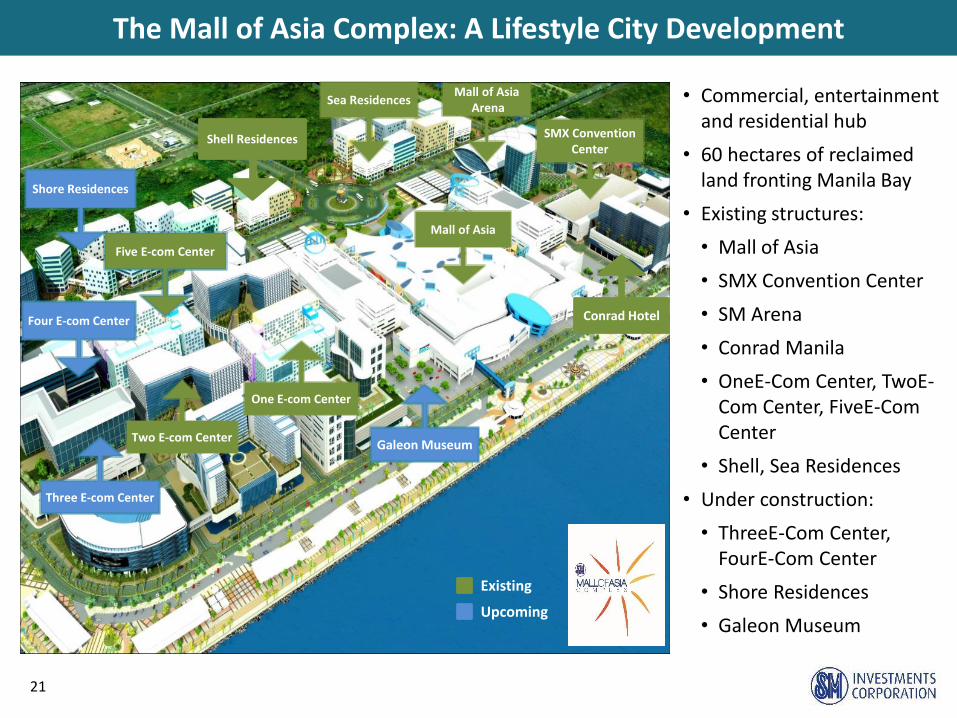
The Mall of Asia Complex: A Lifestyle City Development
• Commercial, entertainment and residential hub
• 60 hectares of reclaimed land fronting Manila Bay
• Existing structures:
• Mall of Asia
• SMX Convention Center
• SM Arena
• Conrad Manila
• OneE-Com Center, TwoE-Com Center, FiveE-Com Center
• Shell, Sea Residences
• Under construction:
• ThreeE-Com Center, FourE-Com Center
• Shore Residences
• Galeon Museum
Two E-com Center
One E-com Center
Mall of Asia
SMX Convention Center
Conrad Hotel
Existing
Upcoming
Five E-com Center
Three E-com Center
Four E-com Center
Sea Residences
Shell Residences
Shore Residences
Mall of AsiaArena
Galeon Museum

22
SM Seaside Cebu: A Lifestyle City Development
• 30 hectares mixed use development on reclaimed land in Cebu
• Integrated development
• Site of Cebu’s largest mall and the fourth largest SM mall in the country with a GFA of 430,000 sqm
• Adjacent to 26 hectares co-owned with Ayala Land
SM Seaside City
Chapel of San Pedro Calungsod
Existing
Upcoming
Observation Tower
SM-ALI JV

23
SM Malls: Overview
Largest mall operator/developer in the Philippines

24
SM Malls: Philippines
SM Seaside City, Cebu
Philippine Population: 101M
Visayas19M people
Luzon 45M people
NCR 13M people
Mindanao24M people
Area Malls GFA (sqm) % of Total
Metro Manila (NCR) 20 3,297,272 44%
Luzon (ex-NCR) 29 2,683,723 35%
Visayas 5 1,088,157 14%
Mindanao 4 491,254 6%
Total 58 7,560,406 100%

25
SM Malls: Philippines Expansion Plans
Projection
End-2016Total Malls 60
Total GFA 7.7 mn sqm
SM Malls: Philippines Expansion Plans
New Opening GFA (sqm)
SM San Jose Del Monte April 2016 114,186
SM Trece Martires May 2016 83,783
SM Cherry Congressional Nov 2016 13,273
SM East Ortigas 2H 2016 80,127
Expansion
SM San Pablo 2H2016 13,359
SM Molino 2H2016 39,674
Total 344,402

26
SM Malls: China
SM Zibo
SM Tianjin
Existing Date Opened GFA (sqm)
SM Xiamen 2001 December 238,125
Jinjiang 2005 November 167,830
Chengdu 2006 October 166,665
Suzhou 2011 September 72,552
Chongqing 2012 December 149,429
Zibo 2015 September 150,600
Total 945,200
Upcoming Target GFA (sqm)
Tianjin (partial) 2016 540,000

27
SM Residences
SMDC Fame SMDC Air
SMDC Shore Amenities
Projects Overview 1H 2016
Total Launched since 2003 88,861
Total Units Sold since 2003 71,438
% Sold to date 80%
Planned Launched in 2016 (units) 11,000-14,000
Reservation Sales (value) PHP22.6B
Reservation Sales (units) 8,078
2016 CAPEX PHP16.3B
Project PHP10.5B
Land banking PHP5.8B
Landbank (Hectares)
Metro Manila 61.9
Outside Metro Manila 187.0
Land for Future Projects 248.9

28
SM Residences Example – Shore Residences
Approx. 27.7 to 29.5 sqm Approx. 58.5 sqm
Two Bedroom with BalconyOne Bedroom with Balcony
29
SM Commercial Properties
Completed Opened GFA (sqm)
SM Cyber Makati One 2008 22,055
SM Cyber Makati Two 2008 16,725
TwoE-com Center 2012 107,682
SM Aura Tower 2013 53,117
SM Cyber West 2014 41,799
FiveE-com Center 2015 129,307
Total 370,685
Under Construction Opening GFA (sqm)
ThreeE-com Center TBA 114,204
FourE-com Center TBA TBA

30
SM Hotels and Convention Centers
Conrad Manila
• Growing tourism market opportunity• SM Hotel expansions complement
existing mall, commercial and residential developments• Iloilo• SM North Edsa• San Fernando, Pampanga• SM Seaside City, Cebu
SMX Convention Center
Mall of Asia Arena

31
SM Hotels and Convention Centers
Venue Location GLA (sqm)
SMX Manila MOA Complex 17,306
SMX Davao SM Lanang 5,200
SMX Aura Premier SM Aura 3,136
SMX Bacolod Bacolod 4,269
Megatrade Hall Megamall 4,214
Cebu Trade Hall Cebu 1,498
Mall of Asia Arena MOA Complex 20,000 seats
Total 35,623
Conrad Manila Lobby
Conrad Manila Diplomatic Suite: Bedroom
Hotel Opened Rooms
Taal Vista, Tagaytay 2003 260
Radisson Blu, Cebu 2010 396
Pico Sands, Hamilo Coast 2011 151
Park Inn, Davao 2013 202
Park Inn, Clark 2015 154
Conrad Manila, Pasay 2016 347
Total 1,510

32
Land Bank
Coastal Zone
1,580 HasInland
Mountain Zone4,200 Has
Companies Land Bank (sqm)
SM Prime 11,405,415
Malls 1,770,793
Residences 3,153,539
Commercial 883,252
Leisure Homes 5,597,831
SMIC 57,801,502
Total 69,206,917

33
Land Bank in Batangas: Hamilo Coast
• Hamilo Coast asset is owned directly by SMIC
• 5,780 hectares
• 31 km of coastline
• 13 coves
• Pristine environment
• 1½ - 2 hours from Manila

34
2016 SM Group CAPEX
Businesses PHP bn Allocation/Projects
Retail 5.2 New stores / Renovations
Banks 7.5 Branch expansion, IT enhancements
Property 60.2
Malls 32.2New SM malls and expansions in
Philippines and China
Residential 20.7 Condominiums and HPI projects
Commercial 4.5 ThreeE-com and FourE-Com
Hotels and Convention Centers 2.7 Conrad Manila
Parent and Others 0.4
Total 73.3

35
Portfolio Investments: Belle Corporation
• 28% ownership; publicly listed
• Developer of high-end entertainment and leisure properties
• Subsidiary, Premium Leisure Corp., holds 1 of 4 gaming licenses in Entertainment City complex in Manila Bay
• US$1.3bn City of Dreams Manila, operated by Melco Crown
• Total gross floor area: 300,000 sqm
• Gaming floor area: up to c.22,000 sqm
• 372 gaming tables
• 1,680 slot machines
• 1,680 electronic table games
• Three hotel brands with 950 keys: Crown, Nobu, Hyatt
(In PHP mn) 1Q 2016 1Q 2015 % Chg
Revenues 1,494.6 1,344.8 11.1%
Operating Costs and
Expenses-638.8 -607.3 5.2%
Net Operating Income 855.8 737.5 16.0%
Net Income 412.8 377.7 9.3%
Net Margin 27.6% 28.1% --
ROE 6.5% 5.6% --
Net Debt (Cash) to
Equity Ratio0.16 : 1.00 0.01 : 1.00 --

36
Portfolio Investments: Atlas Consolidated Mining
• 29% ownership; publicly listed
• Copper mine with 20+ years mine life, over
400m tonnes of proved and probable
reserves
• Average cut-off grade of 0.30% Cu
• Excellent environmental and social record
• Supportive shareholders and other
stakeholders
• Announced restructuring plan to optimize
cash position during copper price downturn
• Optimal 40k tonnes/day production
volumes
• Reduce pre-stripping CAPEX for 2016
and 2017
• Cost reduction and operating efficiency
programme
*Net income after tax adjusted for non-recurring items such as foreign exchange and mark-to-market adjustments.
(In PHP mn) 1H 2016 1H 2015 % Chg
Revenues 6,130 5,262 16.5%
Total Cash Cost 4,515 4,464 1.1%
EBITDA 1,674 981 70.6%
Net Income -325 -611 -46.8%
Core Income* -558 -888 -37.2%

37
Portfolio Investments: CityMalls Commercial Corp.
• 34% ownership of a JV with outstanding local partners
• Rapid growth plans to develop 10k to 20k sqm strip malls in
underserved markets outside Metro Manila
• SM has right of first refusal on supermarket space in malls
• 100 CityMalls by 2020 - 30 targeted by YE2016
38
Financials

24%
71%
5%
43%
21%
36%
Property Retail Banking
39
Financials: SMIC
Revenues +8.5% to PHP151.1bn
Reported Earnings +11%(Recurring Earnings +8%)
Banking business not consolidated
1H 2016 Consolidated ResultsIn PHP Billion
SMIC Parent Debt
Net Debt to Equity 31 : 69 Average Cost of Debt 5.03%
Peso-Foreign Currency Mix 46 : 54 Average Debt Tenure 4.13 years
1H 2016 1H 2015 FY2015 FY2014 FY2013 FY2012
Revenue 151.1 139.3 295.9 276.6 253.3 223.9
Reported Net Income* 15.0 13.5 28.4 28.4 27.5 24.7
Net Margin 9.9% 9.7% 9.6% 10.3% 10.8% 11.0%
Dividends n/a n/a 8.52 8.2 7.4 6.4
Return on Equity 10.5% 10.3% 10.3% 12.0% 13.0% 14.3%
*Recurring Earnings growth of 8% in 1H 2016
Total Capital 1H 2016 1H 2015 FY2015 FY2014 FY2013 FY2012
Cash Equivalents & Short
Term Investments96.0 100.9 122.6 130.5 111.2 126.6
Net Debt 183.5 165.0 158.5 131.2 126.5 93.6
Equity 292.3 270.3 284.5 257.0 219.4 188.1
Net Debt:Equity 39 : 61 38 : 62 36 : 64 34 : 66 37 : 63 33 : 67
Recent Bond Offerings
Issued Amount Currency Due Date Coupon Rate
June 10, 2014 USD350 mn US Dollar June 2024 4.88%
May 19, 2014 PHP15 bn Philippine Peso May 2021/May 2024 5.2958%/5.6125%
July 16, 2012 PHP15 bn Philippine Peso Jul 2019/Jul 2022 6.0%/6.9442%
October 17, 2012 USD500 mn US Dollar October 2019 4.25%
October 13, 2010 USD400 mn US Dollar (Exchange Bonds) October 2017 5.50%

Notes:
1. Excludes net income attributable to
minority interest
2. For BDO press releases, gross
customer loans is the figure quoted
3. Return on Ave. Common Equity,
defined as NI to parent
shareholders less preferred
dividends / ave. common equity
(excluding preferred shares and
minority interests)
4. Per BSP, as seen in the published
statements of condition
Financials: BDO
Financial Highlights (In PHP Bn)
1H 2016 1H 2015 Change FY 2015
Net Interest Income 31.7 27.1 17.2% 57.0
Other Income 22.1 16.4 34.6% 31.9
Net Income113.2 11.7 12.9% 25.0
Assets 2,155.6 1,873.2 15.1% 2,031.3
Deposits 1,771.6 1,520.4 16.5% 1,663.9
Gross Customer Loans21,368.2 1,126.6 21.4% 1,279.4
Net Interest Margin 3.2% 3.1% -- 3.2%
Cost to Income Ratio 64.9% 61.4% -- 62.0%
Return on Common Equity313.1% 13.2% -- 13.6%
Gross Loans to Deposits Ratio 77.2% 74.1% -- 76.9%
Gross NPL to Gross Customer Loans 1.1% 1.3% -- 1.2%
Total CAR413.1% 13.6% -- 13.3%
Tier 1 Ratio 11.6% 11.9% -- 11.7%
CET1 11.3% 11.5% -- 11.3%
Tier 2 Ratio 1.6% 1.7% -- 1.6%
40

41
Financials: BDO
Consistent Growth in Sustainable Sources
Loan and Deposit Growth
Improving Asset Quality
15%
19% 20%17%
21%
16% 16%
20%
14%
18%
2012 2013 2014 2015 2Q 2016
Loan Growth
BDO Industry
592 775 959 1,138 1,230 339 570
533 526 541 932
1,345 1,4921,664 1,772
-
500
1,000
1,500
2,000
2,500
3,000
2012 2013 2014 2015 2Q 2016
PH
P B
n
Deposit GrowthCASA Time Deposits
21.3 14.8 14.2 15.8 17.226.7 25.2 26.8 26.2 26.3
2.8%1.6% 1.3% 1.2% 1.3%
-4.0%
-3.0%
-2.0%
-1.0%
0.0%
1.0%
2.0%
3.0%
4.0%
0.0
10.0
20.0
30.0
40.0
50.0
60.0
2012 2013 2014 2015 2Q 2016
PH
P B
n
Asset Quality
NPL Allow. for Impairment NPL Ratio
CASA YoY∆ 31% 24% 19% 23%
CASA Ratio 58% 64% 68% 69%
NPL Cover 171% 188% 166% 153%
36.2 43.2 51.2 5731.7
13.415.5
1819.4
10.6
8.212.8
7.17.2
2.9
60.6
75.080.7
88.9
53.8
0
10
20
30
40
50
60
70
80
90
100
2012 2013 2014 2015 1H 2016
PH
P B
n
Operating Income
Net Int Inc Fees Trading/FX Others
82%78%
86%86%
79%
YoY∆ Total 24% 8% 10% 24%
YoY∆ NII & Fees 18% 18% 10% 17%

1. Net Income/Average Equity
2. Per BSP, as seen in the
published statements of
condition
42
Financials: China Bank
Financial Highlights (In PHP Bn)
1H 2016 1H 2015 Change FY 2015
Net Interest Income 8.0 7.4 7.1% 15.1
Non-Interest Income 2.9 2.1 41.5% 4.6
Net Income 3.3 2.5 30.3% 5.6
Assets 555.6 479.0 16.0% 527.0
Deposits 462.6 399.2 15.9% 438.7
Gross Customer Loans 329.5 294.5 11.9% 317.5
Net Interest Margin 3.2% 3.4% -- 3.4%
Cost to Income Ratio 61.4% 63.5% -- 62.8%
Return on Equity110.7% 8.7% -- 9.6%
Gross Loans to Deposits Ratio 71.2% 73.8% -- 70.7%
Gross NPL Ratio 2.6% 2.5% -- 2.6%
Total CAR213.2% 14.5% -- 13.5%
Tier 1/CET 1 12.3% 13.6% -- 12.6%

43
Financials: China Bank
82 90 137 179 212 182 222 86 128 146
147 160
148 174
48 54
71 73
67 77
68
216 272
354 399 439 407
464 67% 70% 62%
73% 71% 73% 71%
-74%
-54%
-34%
-14%
6%
26%
46%
66%
(5 0)
50
150
250
350
450
550
2011 2012 2013 2014 2015 2Q 2015 2Q 2016
Funding (PHP bn)
CASA High Cost FCDU LDR
94 109 127 126 120 134
82 89 128 142 133 145 23
30
43 48 43 50
199 228
298 316 296 329
-
50
100
150
200
250
300
350
2012 2013 2014 2015 1H 2015 1H 2016
Gross Loans (PHP bn)
Corporate Commercial Consumer
Loan and Deposit Growth
Steady Asset Quality Stabilizing Cost Income Ratio
3.7%2.2%
3.0% 2.9% 2.9%
2.6% 2.0% 2.2% 2.5% 2.6%
134.9%146.6%
101.3%88.7% 80.5%
0.0 %
20. 0%
40. 0%
60. 0%
80. 0%
100 .0%
120 .0%
140 .0%
160 .0%
180 .0%
0.0 %
1.0 %
2.0 %
3.0 %
4.0 %
5.0 %
6.0 %
7.0 %
8.0 %
9.0 %
10. 0%
2012 2013 2014 2015 1H 2016
Asset Quality
NPA Ratio NPL Ratio Loan Loss Coverage Ratio
59.2% 59.0%
62.2% 62.3%
63.5%
61.4%
56. 0%
57. 0%
58. 0%
59. 0%
60. 0%
61. 0%
62. 0%
63. 0%
64. 0%
2012 2013 2014 2015 1H 2015 1H 2016
Cost to Income Ratio

44
Financials: SM Prime
1H 2016 ResultsIn PHP Billions
Malls Residences Others
Consolidated 1H 2016 1H 2015 % Chg
Revenue 39.2 35.9 9.4%
Normalized Earnings 12.6 11.2 12.0%
Net Margin 32.1% 31.4% -
Return on Equity 11.7% 11.2% -
Malls Group 1H 2016 1H 2015 % Chg
Revenues 23.6 21.7 9.1%
Operating Income 13.2 12.0 9.4%
EBITDA 16.2 14.7 9.9%
EBITDA margin 68.5% 67.9% -
Net Income 8.4 7.7 9.6%
Net margin 35.6% 35.4% -
Philippine Malls 1H 2016 1H 2015 % Chg
Revenues 21.5 19.7 9.2%
Operating Income 12.1 11.1 9.3%
EBITDA 14.7 13.3 9.9%
EBITDA margin 68.1% 67.1% -
Net Income 8.1 7.1 13.5%
Net margin 37.5% 36.1% -China Malls 1H 2016 1H 2015 % Chg
Revenues 2.1 1.9 7.9%
Operating Income 1.1 1.0 10.6%
EBITDA 1.5 1.4 10.1%
EBITDA margin 72.1% 70.6% -
Net Income 0.3 0.5 -40.0%
Net margin 15.7% 28.3% -
Commercial 1H 2016 1H 2015 % Chg
Revenues 1.1 0.7 50.8%
Operating Income 0.8 0.4 111.4%
EBITDA 1.0 0.5 86.4%
EBITDA margin 84.5% 68.3% -
Net Income 0.6 0.3 127.9%
Net margin 53.4% 35.4% -
Residences 1H 2016 1H 2015 % Chg
Revenues 13.2 12.5 6.1%
Operating Income 3.9 3.7 4.8%
EBITDA 4.0 3.8 4.5%
EBITDA margin 30.2% 30.7% -
Net Income 3.2 3.0 6.9%
Net margin 23.8% 23.6% -

45
Contact Information and Disclaimer
Investor Relations Office
Office Number: +63 2 857-0100Email Address: [email protected] Official Website: www.sminvestments.comOfficial Facebook Account: www.facebook.com/sminvestments.irOfficial Twitter Account: @SM_INVESTMENTS
PSE Ticker SMADR Ticker SMIVYBloomberg Ticker SM PM EquityReuters Ticker SM.PH
DisclaimerExcept for historical financial and operating data and other information in respect of historical matters, the statements contained herein are “forward-looking statements”. Any such forward-looking statement is not a guarantee of future performance and involves a number of known and unknown risks, uncertainties, and other factors that could cause the actual performance, financial condition or results of operation of SM and its subsidiaries to be materially different from any future performance, financial condition or results of operation implied by such forward-looking statement.