INVESTOR PRESENTATION November 2015 - Grupa...
30
INVESTOR PRESENTATION November 2015
Transcript of INVESTOR PRESENTATION November 2015 - Grupa...

INVESTOR PRESENTATION
November 2015
2
ONE OF MAJOR
EUROPEAN
CHEMICAL
PRODUCERS
NO. 1 IN POLAND
IN FERTILIZERS,
POLYAMIDES, OXO
PRODUCTS
MELAMINE, AND
TITANIUM WHITE
NO. 2 IN THE EU
IN MINERAL
FERTILIZERS
NO. 3 IN THE EU
IN COMPOUND
FERTILIZERS
GROWTH IN SCALE
THROUGH M&A
ACTIVITY
BALANCED
GEOGRAPHICAL
PRESENCE
GRUPA AZOTY
ON BOARDS OF
IFA AND FE
STABLE FINANCIAL
POSITION
LISTED ON THE
WARSAW STOCK
EXCHANGE SINCE
2008
GRUPA AZOTY IN
FTSE EMERGING
MARKETS AND
MSCI INDICES
CONTINUED
PRESENCE IN THE
RESPECT INDEX
GRUPA AZOTY AT A GLANCE
GRUPA AZOTY AT A GLANCE
3
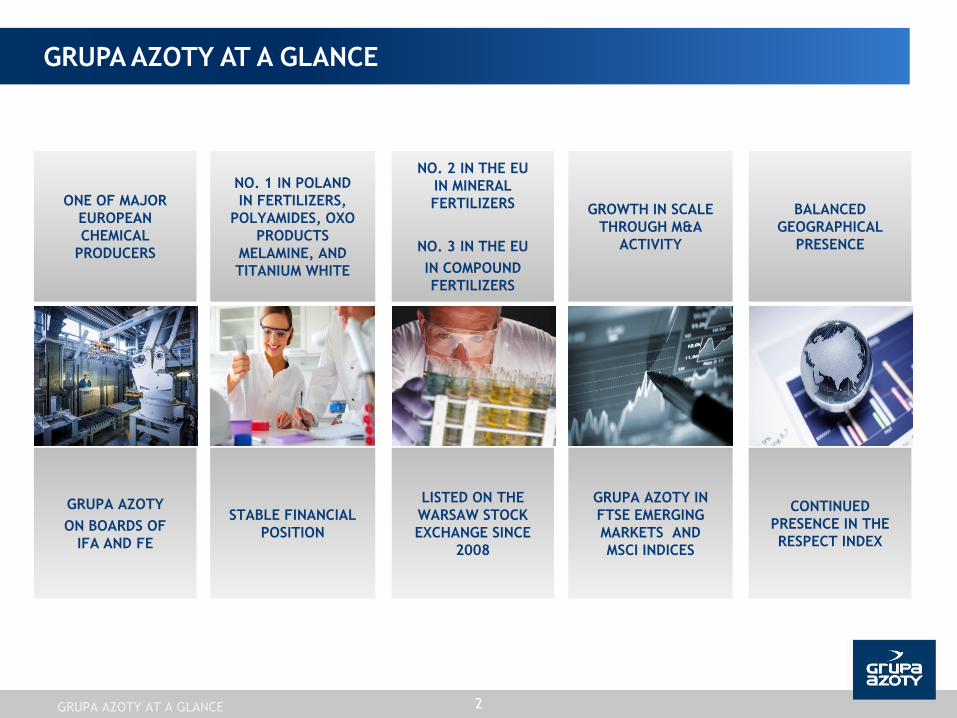
CORE BUSINESS
GRUPA AZOTY AT A GLANCE
Logistics
Production
ZMPP Port
Grupa Azoty Police Urea, NPK, NP, NS, Ammonia, TiO2
BBM Terminal
Fosfory NPK, P
Grupa Azoty
ATT Polymers PA 6
Grupa Azoty Puławy AN, UAN, Urea, Melamine, CPL
Grupa Azoty Siarkopol Sulfur
Grupa Azoty S.A. AN, CAN, ASN, AS, CPL, PA 6, POM
Compounding
AfriG S.A. Phosphorites
Grupa Azoty Kędzierzyn AN, CAN, Urea, OXO, Plasticizers
Z. A. Chorzów S.A. NPK, N, P, K
GRUPA AZOTY AT A GLANCE
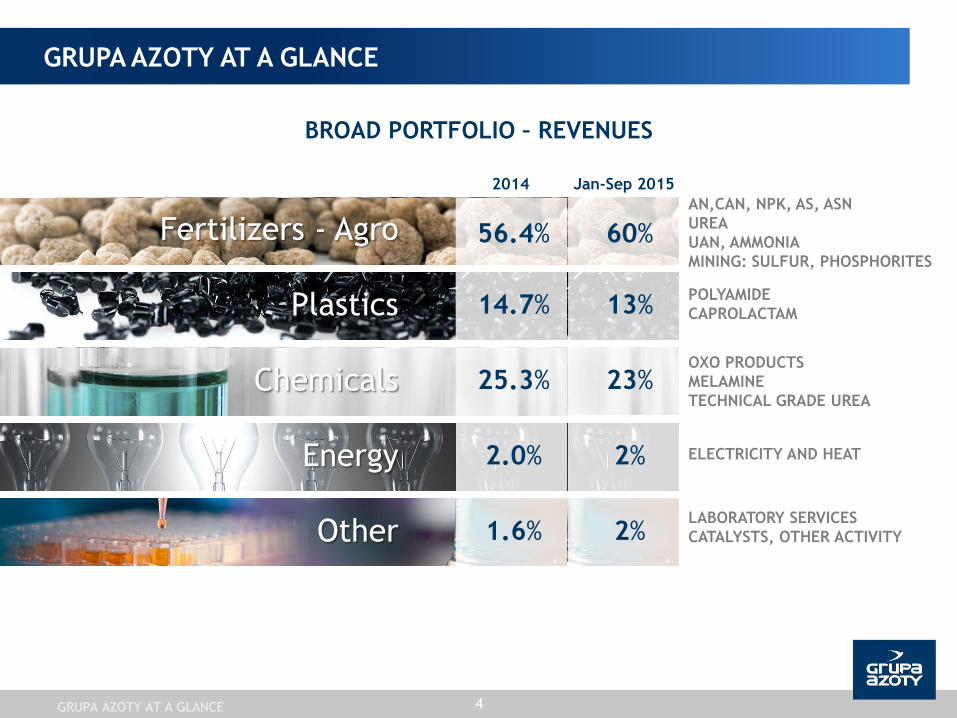
56.4% Fertilizers - Agro
4
BROAD PORTFOLIO – REVENUES
GRUPA AZOTY AT A GLANCE
AN,CAN, NPK, AS, ASN
UREA
UAN, AMMONIA
MINING: SULFUR, PHOSPHORITES
POLYAMIDE
CAPROLACTAM
OXO PRODUCTS
MELAMINE
TECHNICAL GRADE UREA
ELECTRICITY AND HEAT
LABORATORY SERVICES
CATALYSTS, OTHER ACTIVITY 1.6% Other
14.7% Plastics
25.3% Chemicals
2.0% Energy
GRUPA AZOTY AT A GLANCE
2014 Jan-Sep 2015
60%
13%
23%
2%
2%

90% of revenue derived from sales to EU markets
5
Poland
54%
+2%
Jan-Sep 2014
Jan-Sep 2015
South America
4%
+0.1%
Africa
2%
+0.1%
European Union 1
34%
-1% Asia
5%
-0.1%
Other Europe
1%
-1%
North America
0.3%
+0.1%
1 Excluding Poland
5
STRONG POSITION IN TARGET MARKETS
GRUPA AZOTY AT A GLANCE

BUSINESS
7
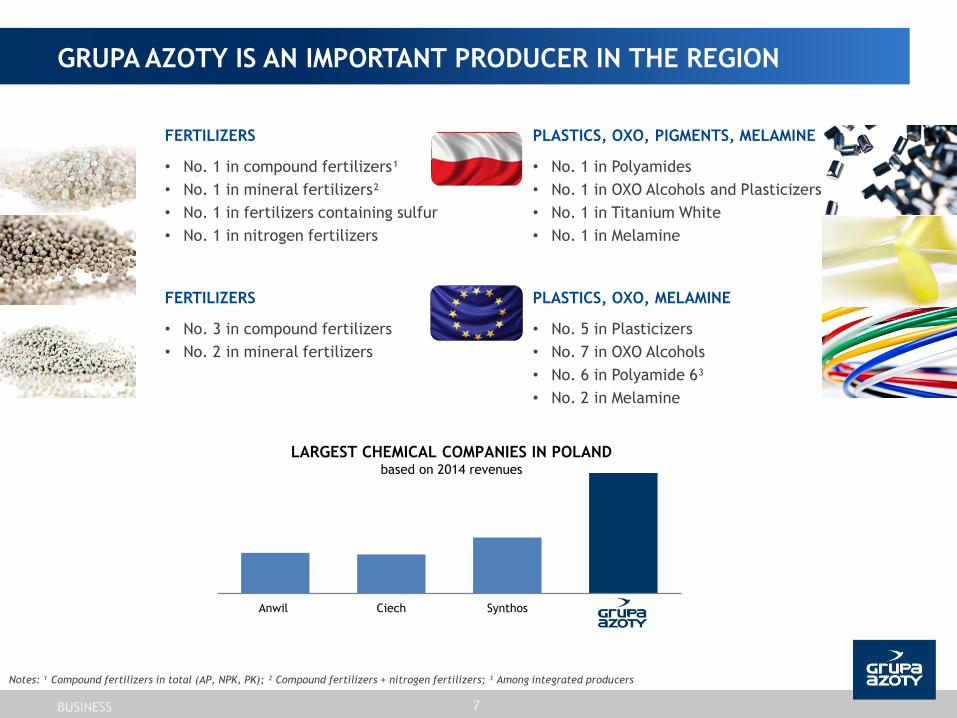
Notes: ¹ Compound fertilizers in total (AP, NPK, PK); ² Compound fertilizers + nitrogen fertilizers; ³ Among integrated producers
GRUPA AZOTY IS AN IMPORTANT PRODUCER IN THE REGION
Anwil Ciech Synthos
LARGEST CHEMICAL COMPANIES IN POLAND based on 2014 revenues
FERTILIZERS
• No. 1 in compound fertilizers¹
• No. 1 in mineral fertilizers²
• No. 1 in fertilizers containing sulfur
• No. 1 in nitrogen fertilizers
FERTILIZERS
• No. 3 in compound fertilizers
• No. 2 in mineral fertilizers
PLASTICS, OXO, PIGMENTS, MELAMINE
• No. 1 in Polyamides
• No. 1 in OXO Alcohols and Plasticizers
• No. 1 in Titanium White
• No. 1 in Melamine
PLASTICS, OXO, MELAMINE
• No. 5 in Plasticizers
• No. 7 in OXO Alcohols
• No. 6 in Polyamide 6³
• No. 2 in Melamine
BUSINESS

15
17
19
21
23
25
27
29
31
EUR/MWh
PGNiG tariff Average natural gas price paid by the Group TTF DA*
GAS PRICES (EUR/MWh)
NATURAL GAS DEMAND
(BCM)
2015 Q3 2015
2.1 0.4
FROM OUTSIDE THE SYSTEM
Q3 2014 Q3 2015
60% 47%
8
PGNIG'S NEW PRICING POLICY
The PGNiG Tariff sets a maximum gas price
The new discount scheme is linked to quoted
market prices of gas
Increased pricing differentiation, with prices
depending on the volumes and stability of gas
consumption over a gas year, reduces
diversification of gas sources
Source: ICIS.
* Day Ahead prices at Title Transfer Facility, a virtual trading point for natural gas in the Netherlands, no transfer costs.
GAS DIVERSIFICATION
BUSINESS
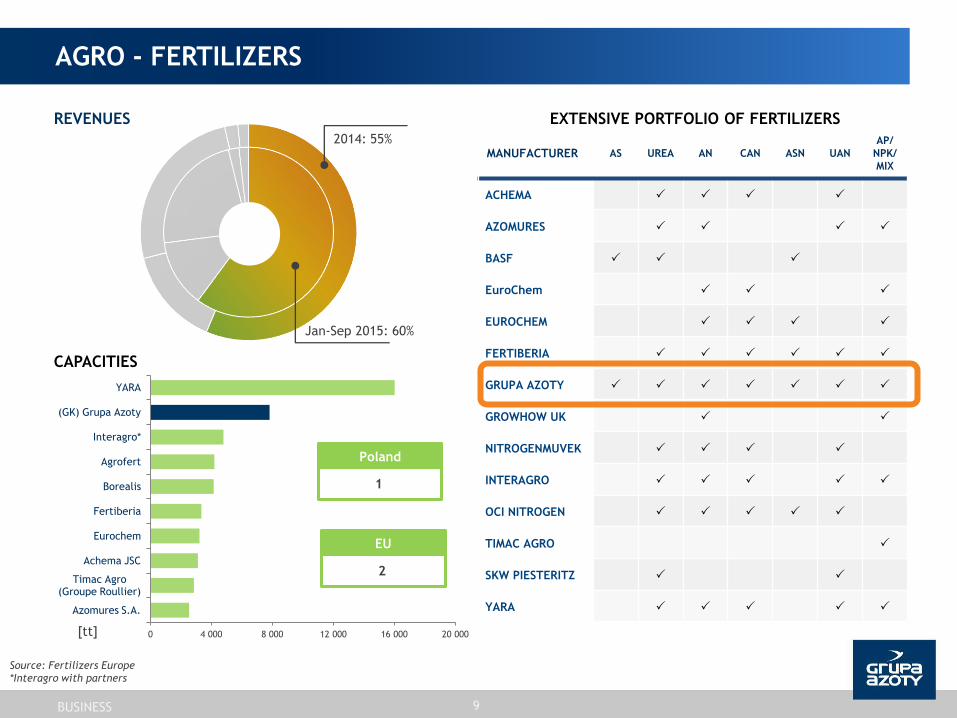
0 4 000 8 000 12 000 16 000 20 000
Azomures S.A.
Timac Agro (Groupe Roullier)
Achema JSC
Eurochem
Fertiberia
Borealis
Agrofert
Interagro*
(GK) Grupa Azoty
YARA
9
AGRO - FERTILIZERS
MANUFACTURER AS UREA AN CAN ASN UAN
AP/
NPK/
MIX
ACHEMA
AZOMURES
BASF
EuroChem
EUROCHEM
FERTIBERIA
GRUPA AZOTY
GROWHOW UK
NITROGENMUVEK
INTERAGRO
OCI NITROGEN
TIMAC AGRO
SKW PIESTERITZ
YARA
EXTENSIVE PORTFOLIO OF FERTILIZERS REVENUES
[tt]
CAPACITIES
EU
2
Poland
1
2014: 55%
Jan-Sep 2015: 60%
Source: Fertilizers Europe
*Interagro with partners
BUSINESS

10
PLASTICS
REVENUES
Source: PCI Nylon, YellowBook 2015
*Integrated
[tt]
POLYAMIDE 6
Poland
1
EU
5*
APPLICATIONS IN KEY SEGMENTS
0 5 10 15 20 25 30 35 40
Automotive
Films and coatings
Machine building
Electrical and electronic applications
Consumer goods
Household appliances
Other
%
Jan-Sep 2015: 13%
2014: 15%
• Polyamide 6 (PA6)
• Polyacetal (POM)
• Caprolactam
• Cyclohexanone
BUSINESS
0 50 100 150 200 250
Savinesti
Caffaro FP
Nexis Fibers
Nurel
Ube
Beaulieu Nylon
Rhodia
Julon
Aquafil
Grupa Azoty
Domo
Radici
DSM
Lanxess
BASF

0 100 200 300 400 500
INEOS …
DEZA
Perstorp
Oltchim
OXEA
Grupa Azoty
Polynt
Evonik
BASF
Exxon Mobil
11
CHEMICALS
0 100 200 300 400 500
Oltchim
Grupa Azoty
Perstorp
Oxochimie (j.v. Arkema i INEOS)
OXEA
BASF
Melamine
0 20 40 60 80 100 120 140 160
Azomures S.A.
BASF SE
Grupa Azoty
Borealis Group
OCI Melamine
OXO** Plasticizers*
Poland
1
EU
3
Poland
1
EU
5
Poland
1
EU
5
REVENUES
2014: 25%
Jan-Sep 2015: 23%
[tt]
[tt]
[tt]
Source: Plasticizers Alkohols 2013 and Plasticizers (UE) 2013
* Production capacities for phthalate plasticizers and terephthalate plasticizers
** Production capacities for 2-EH, N-butanol, isobutanol
BUSINESS
Oxochimie (j.v. of Arkema
and INEOS)

12
Natural Gas Oxygen Nitrogen
Methanol
Phenol
Benzene Sulfur
Ammonia
Nitric Acid
AS
CAN
ASN
Ammonium
Sulfate
Mixed Acid
Caprolactam
PA 6
POM
Trioxane
Compounded
Polymers
C-none
Oleum
Dolomite Stone
Production of
Synthesis Gas
Formalin
Ilmenite Titanium Slag Titanium
White
Phosphorites
Potassium Salt
Phosphoric
Acid
NP
Fertilizers
NPK / PK
Fertilizers
Ortoxylene
Napthalene Maleic
Anhydride
Phtalic
Anhydride
Plasticizers
OXO
Alcohols
Urea Propylene
Aldehydes
Melamine
UAN
Sulfuric Acid
BUSINESS
RAW MATERIALS TO PRODUCTS - GRUPA AZOTY

STRATEGY
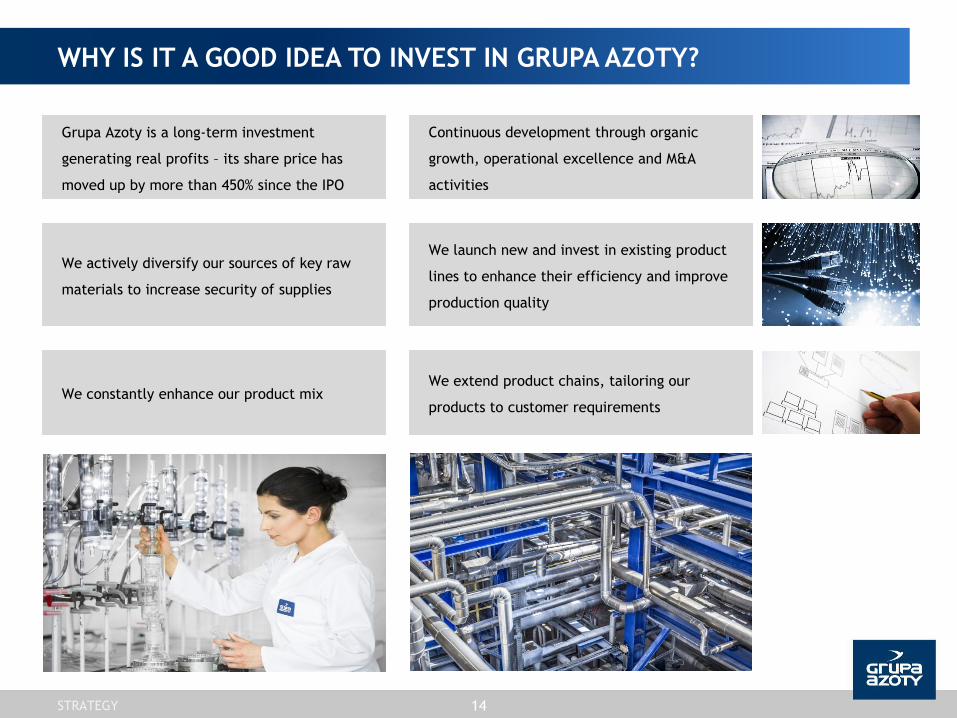
Grupa Azoty is a long-term investment
generating real profits – its share price has
moved up by more than 450% since the IPO
Continuous development through organic
growth, operational excellence and M&A
activities
We launch new and invest in existing product
lines to enhance their efficiency and improve
production quality
We constantly enhance our product mix We extend product chains, tailoring our
products to customer requirements
We actively diversify our sources of key raw
materials to increase security of supplies
14
WHY IS IT A GOOD IDEA TO INVEST IN GRUPA AZOTY?
STRATEGY

DIVIDEND POLICY
The Management Board will
recommend to the General Meeting
dividend distributions of 40%-60% of
the Company’s net profit.
Dividend
for the
year
Net profit
(PLN '000)
Dividend amount
(PLN '000)
Dividend
per share
Payout
ratio
2008 61,935 39,899 PLN 1.02 64%
2012 250,692 148,793 PLN 1.50 59%
2013 44,117 19,839 PLN 0.20 45%
The guiding principle behind Grupa Azoty’s dividend policy is to make
distributions proportionate to the Company’s earnings and financial
standing
Any decisions on dividend payment
will take account of a number of
factors concerning the Company and
the Grupa Azoty Group, including
business outlook, future profits, cash
requirements, financial standing,
growth plans, and legal
requirements.
15
Exchange rate s as at November18th 2015
• EUR 1 = PLN 4.2509
• USD 1 = PLN 3.9802
STRATEGY

STRATEGY 16
REMITS OF THE GRUPA AZOTY MANAGEMENT BOARD MEMBERS
President of the Management
Board
P. Jarczewski
Vice-President of the Management
Board
A. Skolmowski
Vice-President of the Management
Board
W. Szczypiński
Vice-President of the Management
Board
K. Jałosiński
Vice-President of the Management
Board
M. Kapłucha
Vice-President of the Management
Board
M. Rybak
Member of the Management
Board
A. Kopeć
Corporate Affairs and HR
Finance Tarnów Police Supply Chain Puławy Social Dialogue
Audit, Risks and Compliance
Planning and Controlling Plastics
Feedstock Supply Integration and
Maritime Logistics
Investments Technical Safety
and Environmental Protection
Communication IT Organic Synthesis
Strategy and Development
Agro Business IR Production Integration
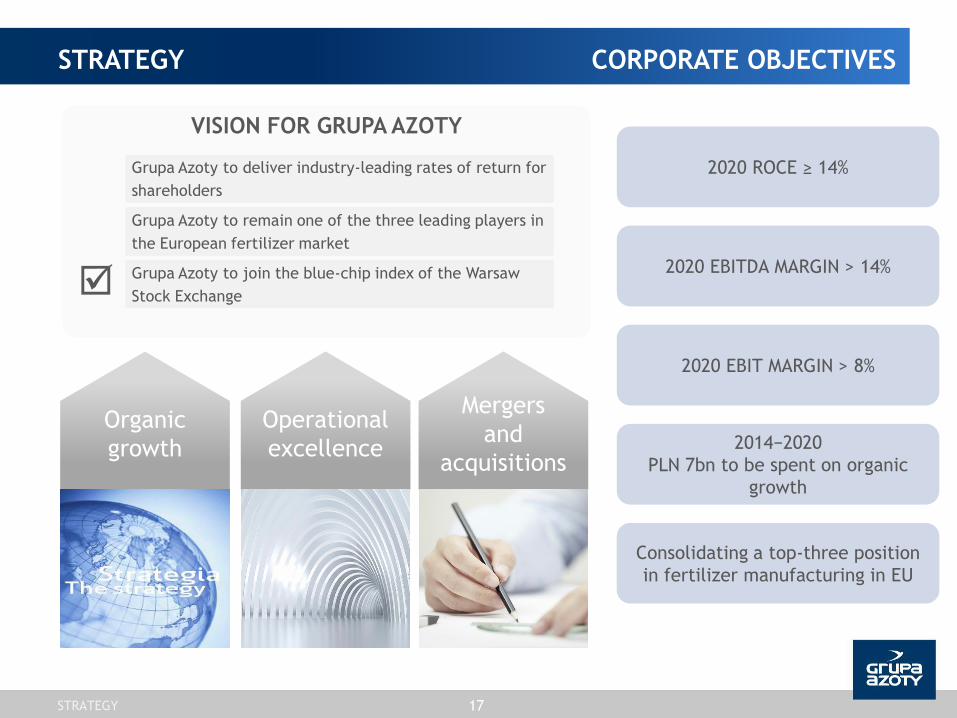
VISION FOR GRUPA AZOTY
Organic
growth
Operational
excellence
Mergers
and
acquisitions
Grupa Azoty to remain one of the three leading players in
the European fertilizer market
Grupa Azoty to deliver industry-leading rates of return for
shareholders
STRATEGY 17
Grupa Azoty to join the blue-chip index of the Warsaw
Stock Exchange
STRATEGY
2020 ROCE ≥ 14%
2014−2020
PLN 7bn to be spent on organic
growth
Consolidating a top-three position
in fertilizer manufacturing in EU
2020 EBIT MARGIN > 8%
2020 EBITDA MARGIN > 14%
CORPORATE OBJECTIVES

STRATEGY 18
32%
PLN 7bn
2014−2020
CORPORATE
PROJECTS
68 CAPEX PROJECTS
11% 19% 30% 4% 2% 2%
PLASTICS ENERGY FERTILIZERS OXOPLASTS MELAMINE PIGMENTS
ORGANIC GROWTH
Exchange rate s as at November18th 2015
• EUR 1 = PLN 4.2509
• USD 1 = PLN 3.9802
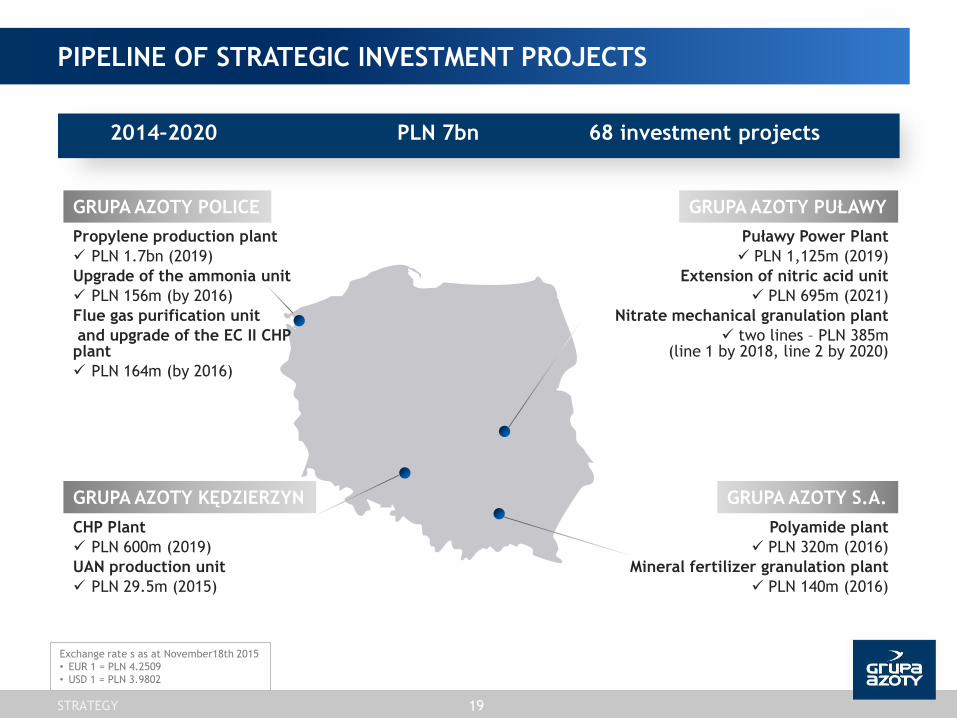
PIPELINE OF STRATEGIC INVESTMENT PROJECTS
CHP Plant
PLN 600m (2019)
UAN production unit
PLN 29.5m (2015)
Polyamide plant
PLN 320m (2016)
Mineral fertilizer granulation plant
PLN 140m (2016)
Puławy Power Plant
PLN 1,125m (2019)
Extension of nitric acid unit
PLN 695m (2021)
Nitrate mechanical granulation plant
two lines – PLN 385m (line 1 by 2018, line 2 by 2020)
Propylene production plant
PLN 1.7bn (2019)
Upgrade of the ammonia unit
PLN 156m (by 2016)
Flue gas purification unit
and upgrade of the EC II CHP plant
PLN 164m (by 2016)
2014–2020 PLN 7bn 68 investment projects
19
GRUPA AZOTY POLICE
GRUPA AZOTY KĘDZIERZYN
GRUPA AZOTY PUŁAWY
GRUPA AZOTY S.A.
Exchange rate s as at November18th 2015
• EUR 1 = PLN 4.2509
• USD 1 = PLN 3.9802
STRATEGY
STRATEGY 20
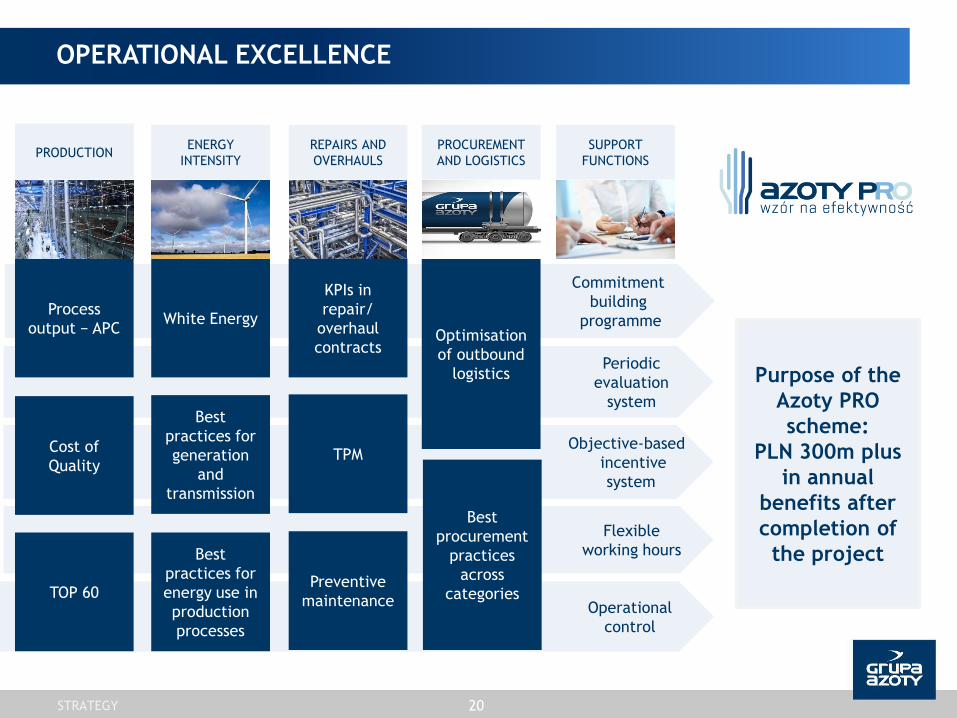
Commitment
building
programme
Periodic
evaluation
system
Objective-based
incentive
system
Flexible
working hours
Operational
control
Process
output − APC
Cost of
Quality
TOP 60
White Energy
Best
practices for
generation
and
transmission
Best
practices for
energy use in
production
processes
KPIs in
repair/
overhaul
contracts
TPM
Preventive
maintenance
Optimisation
of outbound
logistics
Best
procurement
practices
across
categories
PRODUKCJA ENERGY
INTENSITY
REPAIRS AND
OVERHAULS
PROCUREMENT
AND LOGISTICS
SUPPORT
FUNCTIONS
OPERATIONAL EXCELLENCE
Purpose of the
Azoty PRO
scheme:
PLN 300m plus
in annual
benefits after
completion of
the project
PRODUCTION
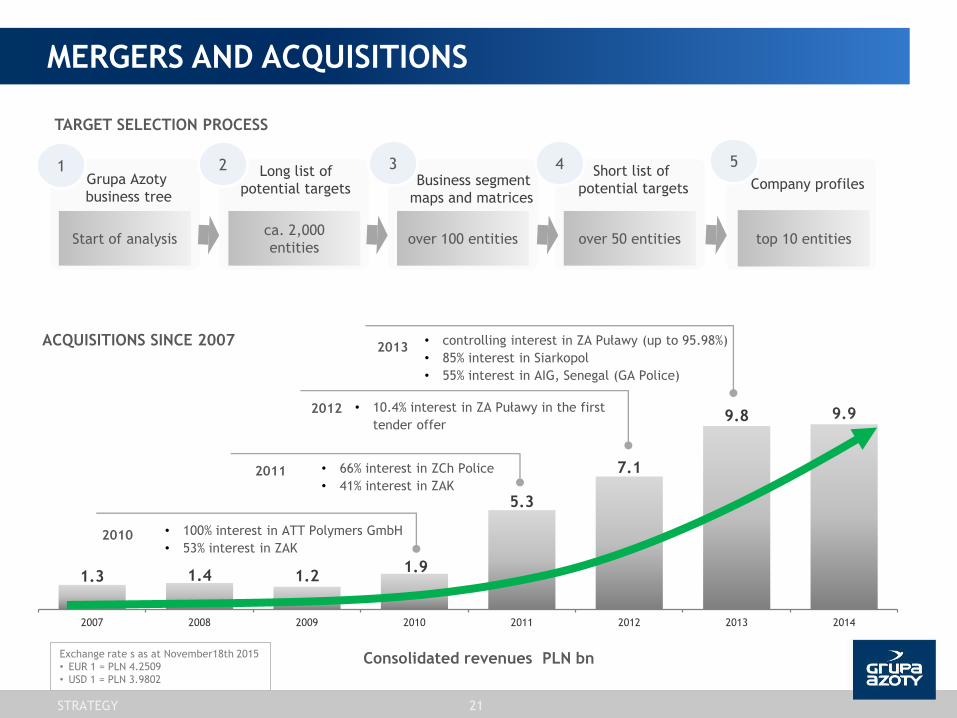
• 100% interest in ATT Polymers GmbH
• 53% interest in ZAK 2010
1.3 1.4 1.2 1.9
5.3
7.1
9.8 9.9
2007 2008 2009 2010 2011 2012 2013 2014
STRATEGY 21
MERGERS AND ACQUISITIONS
Consolidated revenues PLN bn
• controlling interest in ZA Puławy (up to 95.98%)
• 85% interest in Siarkopol
• 55% interest in AIG, Senegal (GA Police)
2013
• 10.4% interest in ZA Puławy in the first
tender offer
2012
2011 • 66% interest in ZCh Police
• 41% interest in ZAK
TARGET SELECTION PROCESS
Grupa Azoty
business tree
Start of analysis
1
ca. 2,000
entities
Long list of
potential targets
2
over 100 entities
Business segment
maps and matrices
3
over 50 entities
Short list of
potential targets
4
top 10 entities
Company profiles
5
ACQUISITIONS SINCE 2007
Exchange rate s as at November18th 2015
• EUR 1 = PLN 4.2509
• USD 1 = PLN 3.9802
FINANCIAL HIGHLIGHTS

23
REPORTED FINANCIAL DATA
2013 2014 Jan-Sep 2014 Jan-Sep 2015
Revenues 9,821 9,898 7,342 7,521
EBIT 703 302 294 639
EBITDA 1,253 822 695 1 001
Net profit 714 265 250 540
Equity 6,271 6,488 6,488 6,998
Net debt 627 527 455 410
PLNm
0% 10% 20% 30% 40% 50% 60% 70% 80% 90% 100%
Grupa Azoty S.A. Grupa Azoty ZAK Group Grupa Azoty POLICE Group Grupa Azoty PUŁAWY Group Other
STRUCTURE OF THE GROUP'S CONSOLIDATED REVENUES IN 2014
FINANCIAL HIGHLIGHTS
Exchange rate s as at November18th 2015
• EUR 1 = PLN 4.2509
• USD 1 = PLN 3.9802
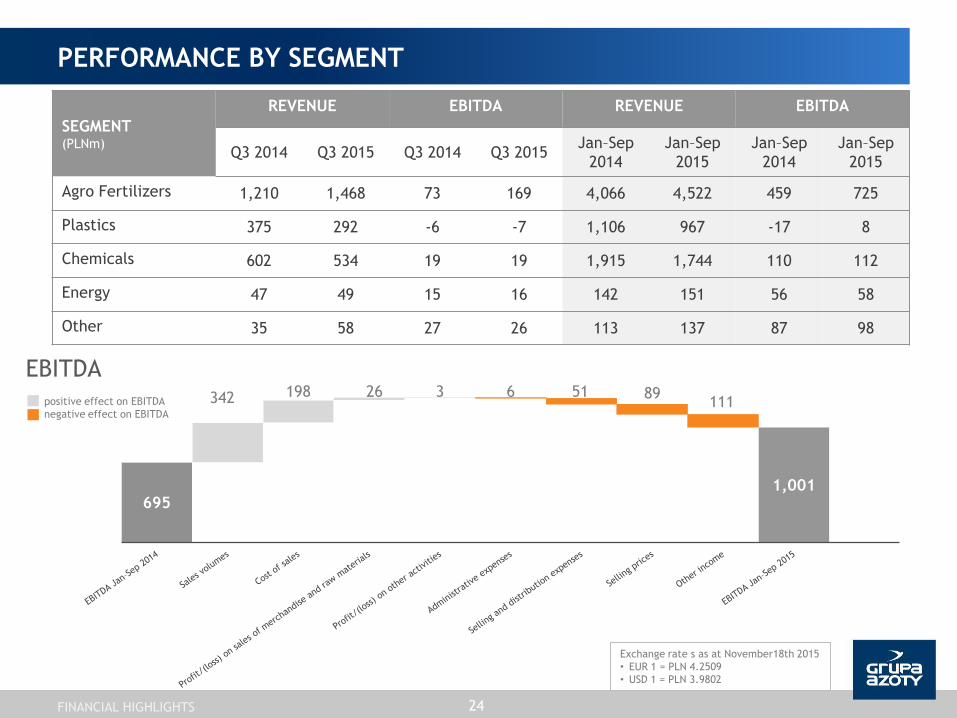
695 1,001
342 198 26 3 6 51 89 111
PERFORMANCE BY SEGMENT
24
EBITDA
FINANCIAL HIGHLIGHTS
Exchange rate s as at November18th 2015
• EUR 1 = PLN 4.2509
• USD 1 = PLN 3.9802
SEGMENT (PLNm)
REVENUE EBITDA REVENUE EBITDA
Q3 2014 Q3 2015 Q3 2014 Q3 2015 Jan–Sep
2014
Jan–Sep
2015
Jan–Sep
2014
Jan–Sep
2015
Agro Fertilizers 1,210 1,468 73 169 4,066 4,522 459 725
Plastics 375 292 -6 -7 1,106 967 -17 8
Chemicals 602 534 19 19 1,915 1,744 110 112
Energy 47 49 15 16 142 151 56 58
Other 35 58 27 26 113 137 87 98
positive effect on EBITDA
negative effect on EBITDA
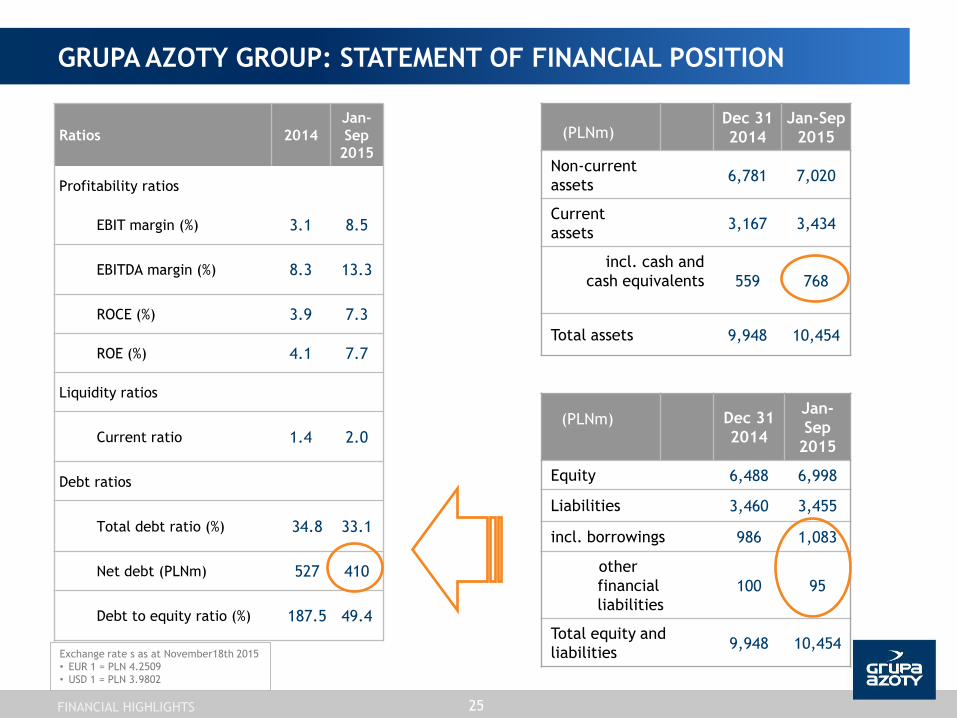
Ratios 2014
Jan-
Sep
2015
Profitability ratios
EBIT margin (%) 3.1 8.5
EBITDA margin (%) 8.3 13.3
ROCE (%) 3.9 7.3
ROE (%) 4.1 7.7
Liquidity ratios
Current ratio 1.4 2.0
Debt ratios
Total debt ratio (%) 34.8 33.1
Net debt (PLNm) 527 410
Debt to equity ratio (%) 187.5 49.4
Dec 31
2014
Jan-Sep
2015
Non-current
assets 6,781 7,020
Current
assets 3,167 3,434
incl. cash and
cash equivalents
559 768
Total assets 9,948 10,454
GRUPA AZOTY GROUP: STATEMENT OF FINANCIAL POSITION
Dec 31
2014
Jan-
Sep
2015
Equity 6,488 6,998
Liabilities 3,460 3,455
incl. borrowings 986 1,083
other
financial
liabilities
100 95
Total equity and
liabilities 9,948 10,454
(PLNm)
(PLNm)
25
FINANCIAL HIGHLIGHTS
Exchange rate s as at November18th 2015
• EUR 1 = PLN 4.2509
• USD 1 = PLN 3.9802

26
COST STRUCTURE
Pro-forma data, including Grupa Azoty PUŁAWY and Grupa Azoty SIARKOPOL
RAW MATERIALS
0
2 000
4 000
6 000
8 000
10 000
12 000
2013* 2014 Raw material and consumables used Services
Labour costs Depreciation and amortisation
Other
-4%
40%
9% 4% 5%
5%
7%
7%
23%
Natural gas
Propylene
Phosphate
Potassium salt
Phenol
Coal
Electricity
Other
Lower costs of raw materials and consumables
attributable to lower prices of energy
resources and petroleum raw materials, as well
as procurement synergies
FINANCIAL HIGHLIGHTS
Exchange rate s as at November18th 2015
• EUR 1 = PLN 4.2509
• USD 1 = PLN 3.9802
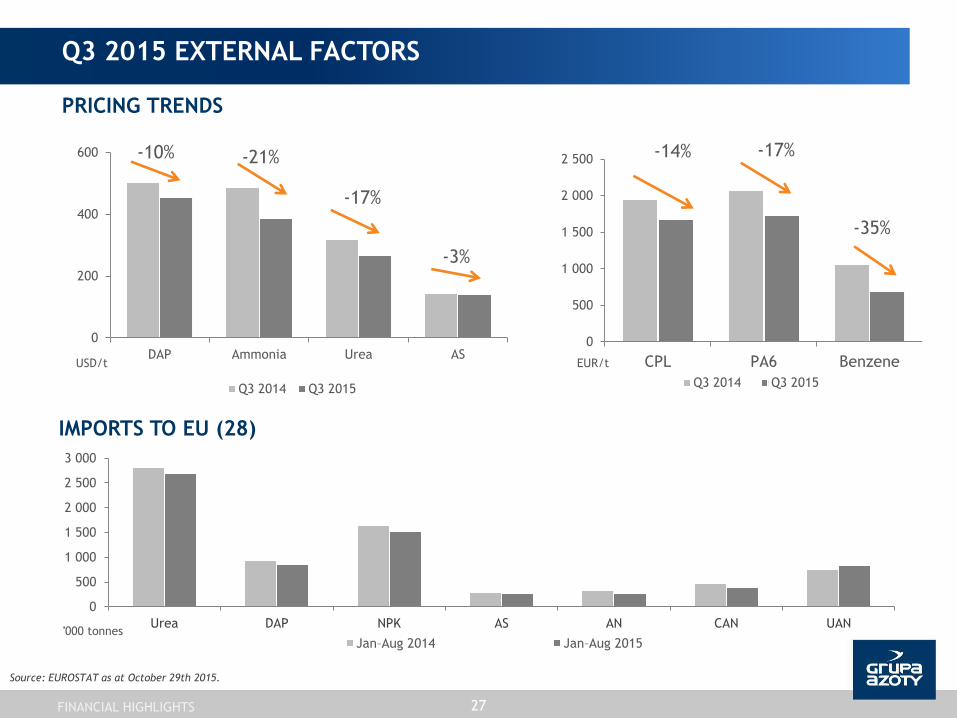
Q3 2015 EXTERNAL FACTORS
PRICING TRENDS
0
200
400
600
DAP Ammonia Urea AS USD/t
Q3 2014 Q3 2015
-10% -21%
-17%
-3%
0
500
1 000
1 500
2 000
2 500
CPL PA6 Benzene EUR/t
Q3 2014 Q3 2015
-14% -17%
-35%
Source: EUROSTAT as at October 29th 2015.
0
500
1 000
1 500
2 000
2 500
3 000
Urea DAP NPK AS AN CAN UAN '000 tonnes
Jan–Aug 2014 Jan–Aug 2015
IMPORTS TO EU (28)
27 FINANCIAL HIGHLIGHTS
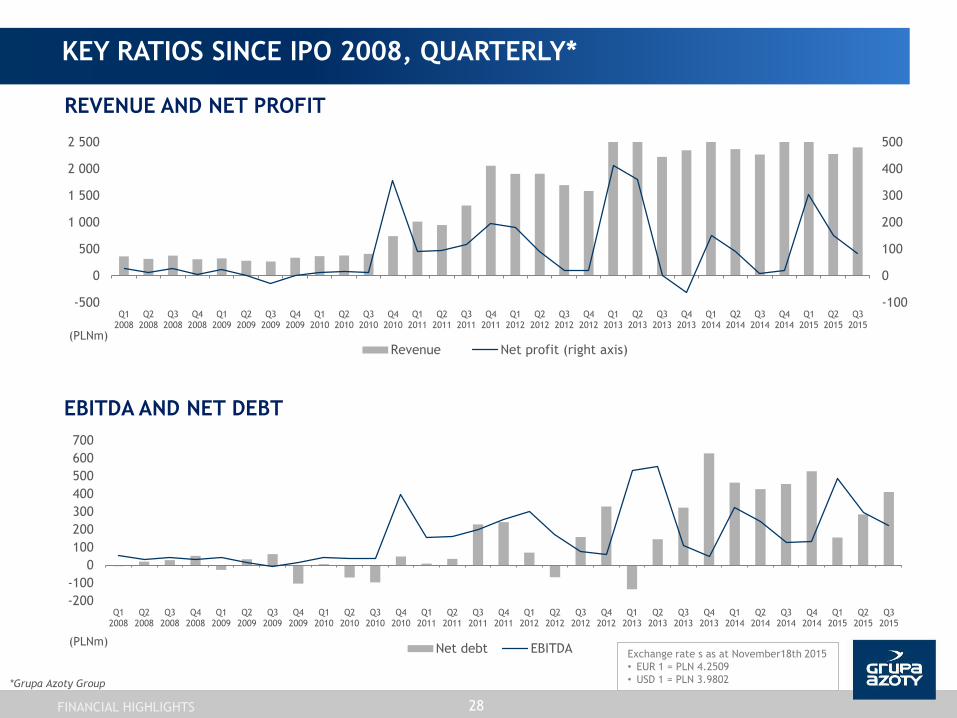
-200
-100
0
100
200
300
400
500
600
700
Q1 2008
Q2 2008
Q3 2008
Q4 2008
Q1 2009
Q2 2009
Q3 2009
Q4 2009
Q1 2010
Q2 2010
Q3 2010
Q4 2010
Q1 2011
Q2 2011
Q3 2011
Q4 2011
Q1 2012
Q2 2012
Q3 2012
Q4 2012
Q1 2013
Q2 2013
Q3 2013
Q4 2013
Q1 2014
Q2 2014
Q3 2014
Q4 2014
Q1 2015
Q2 2015
Q3 2015
EBITDA AND NET DEBT
Net debt EBITDA
*Grupa Azoty Group
-100
0
100
200
300
400
500
-500
0
500
1 000
1 500
2 000
2 500
Q1 2008
Q2 2008
Q3 2008
Q4 2008
Q1 2009
Q2 2009
Q3 2009
Q4 2009
Q1 2010
Q2 2010
Q3 2010
Q4 2010
Q1 2011
Q2 2011
Q3 2011
Q4 2011
Q1 2012
Q2 2012
Q3 2012
Q4 2012
Q1 2013
Q2 2013
Q3 2013
Q4 2013
Q1 2014
Q2 2014
Q3 2014
Q4 2014
Q1 2015
Q2 2015
Q3 2015
REVENUE AND NET PROFIT
Revenue Net profit (right axis) (PLNm)
(PLNm)
28
KEY RATIOS SINCE IPO 2008, QUARTERLY*
FINANCIAL HIGHLIGHTS
Exchange rate s as at November18th 2015
• EUR 1 = PLN 4.2509
• USD 1 = PLN 3.9802
DISCLAIMER 29
DISCLAIMER
The information contained herein has been prepared by the Grupa Azoty Group (“the Group”) solely for the purpose of presentation to investors (“the
Presentation”). By participating in the meeting at which this Presentation is given or by referring to this Presentation you agree to the restrictions and
disclaimers presented below.
This Presentation does not constitute, or form any part of, and should not be considered as, an offer to sell or invitation to subscribe for, or as a guarantee
of purchase or other acquisition of any securities of any of the Group companies. Neither this presentation nor any part hereof may form the basis of, or be
relied upon in connection with, any subscription for or acquisition of any securities of the Group companies. Neither this Presentation nor any part hereof
may form the basis of, or be relied upon in connection with, any contract or commitment or investment decision relating to any securities of the Group
companies. This Presentation does not constitute a recommendation regarding any securities of the Group companies.
No statement or assurance, express or implied, has been made by or on behalf of the Group or any of its shareholders, members of its bodies, officers,
employees, agents or advisers or any other person as to the accuracy, completeness or reliability of the information or opinions contained in this
Presentation. The discussion of various subjects in this Presentation may include forward-looking statements. Forward-looking statements are different from
statements of historical fact. They can be identified by the use of such words as "expect", "intend", "plan", "believe", "anticipate", "will", "aim", "can",
"would", "could", "continue" or similar expressions. Forward-looking statements include statements about the financial performance, business strategy, plans
and objectives of the Group (including development plans relating to the Group). All forward-looking statements contained in this Presentation relate to
matters involving known and unknown risks, issues that are impossible to predict, and other factors. Actual results and achievements of the Group may
materially differ from those given in past declarations, and from the Company’s past performance and achievements. Forward-looking statements are made
based on various assumptions about future events, including assumptions regarding the current and future business strategies of the Group and its future
business environment. Although the Group believes that its estimates and assumptions are reasonable, they may prove to be incorrect. The information,
opinions and forward-looking statements contained herein are valid only on the date of this Presentation and are subject to change without notice. Unless
required by law, the Group and its advisors are not obliged to publish any updates or modify any information, data or statements contained in this
Presentation in the event of a change to the Group’s strategy or plans or the occurrence of any facts or circumstances that will have an effect on the
Group’s strategy or plans. Please note that the only reliable source of data on the Group's and Group companies’ financial performance, as well as
forecasts, events and indicators relating to the Group and the Group companies, are the current and periodic reports released by the Group companies to
comply with the applicable disclosure requirements under Polish law.
Neither the Group nor any of its shareholders, members of its bodies, officers, employees, agents or advisers nor any other person shall be liable for any
loss arising due to the use of this Presentation or its contents, or otherwise in connection with this Presentation.
Neither the Group nor any of its shareholders, members of its bodies, officers, employees, agents or advisers nor any other person is required to provide the
recipients of this Presentation with any additional information or to update this Presentation.
This Presentation contains information on the chemical industry in Poland and abroad, including information on the market share of the Company and some
of its competitors. In each case the source of such information is provided, and such information has not been subject to independent verification by or on
behalf of the Group.
This Presentation is not for distribution to or use by any person or entity in any jurisdiction where such distribution or use would be contrary to local law or
would oblige the Group or any of its affiliates to obtain an authorisation, license or exemption from the registration requirements under applicable laws.
Neither this Presentation nor any part hereof may be copied or transmitted into the United States, and cannot be disseminated, directly or indirectly in the
United States. Failure to comply with this restriction may constitute a violation of US securities laws. Persons who come into possession of this Presentation
should observe all the above limitations. Any securities referred to herein have not been and will not be registered under the US Securities Act of 1933. Any
such securities may not be offered or sold in the United States, except pursuant to an exemption or in a transaction not subject to the registration
requirements of the Act.
THANK YOU FOR YOUR ATTENTION For more information visit www.grupaazoty.com
Contact: [email protected]