Investor Presentation - Microsoft · Investor Presentation 23 •Tüpraş generated 29.8 million...
51
Investor Presentation January 2020
Transcript of Investor Presentation - Microsoft · Investor Presentation 23 •Tüpraş generated 29.8 million...

Hizmete Özel / Confidential
Investor Presentation
January 2020
Hizmete Özel / Confidential
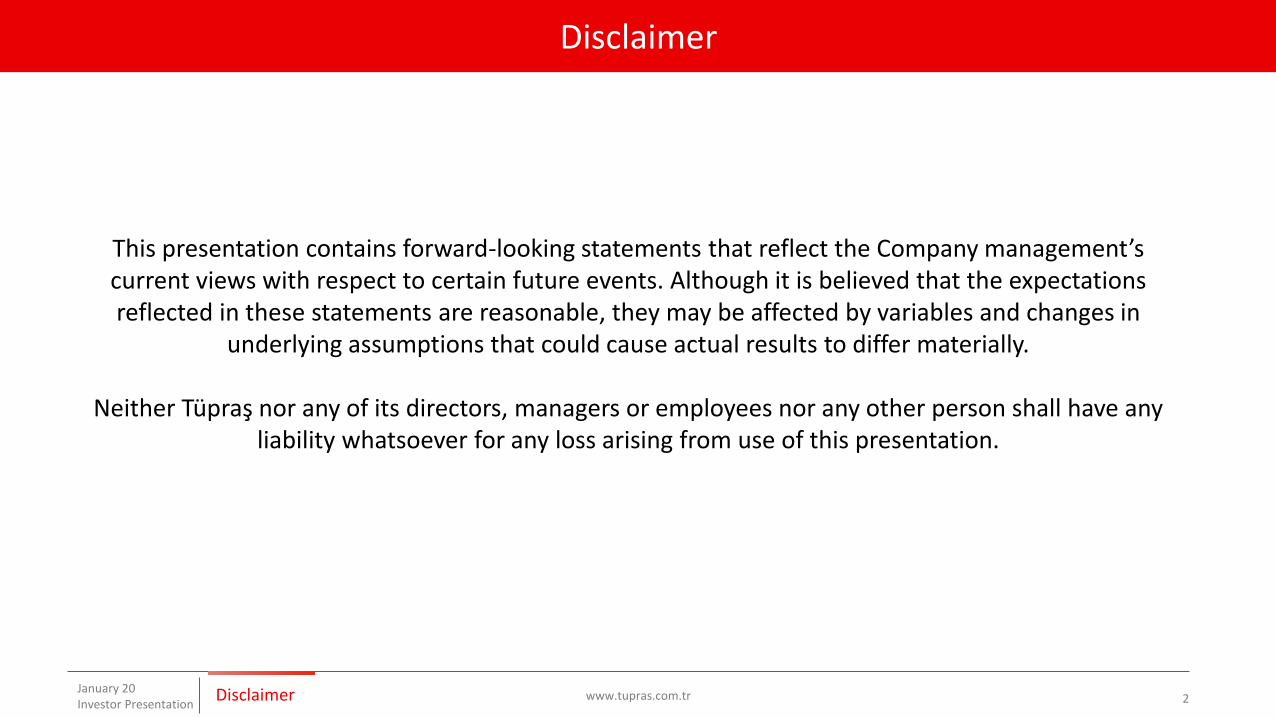
This presentation contains forward-looking statements that reflect the Company management’s current views with respect to certain future events. Although it is believed that the expectations reflected in these statements are reasonable, they may be affected by variables and changes in
underlying assumptions that could cause actual results to differ materially.
Neither Tüpraş nor any of its directors, managers or employees nor any other person shall have any liability whatsoever for any loss arising from use of this presentation.
www.tupras.com.trJanuary 20Investor Presentation 2
Disclaimer
Disclaimer

Hizmete Özel / Confidential
Refining Market

Hizmete Özel / Confidential
Brent Crude Prices
www.tupras.com.trJanuary 20Investor Presentation 4Refining Market
$/bbl
+ OPEC and its allies increasing output cuts+ Impact of Iran & Venezuela sanctions+ Escalating regional tension
- Concerns on global economic development- China's purchases to slow as approaching long-term
reserve targets
2016 ave.43.7 $/bbl
2017 ave.54.3 $/bbl
2018 ave.71.0 $/bbl
2019 ave.64.3 $/bbl
All waivers expired on Iran
OPEC Production Cut Decision
Iran Sanctions
DroneAttack toSaudiFields30.7
81.2
67.0
20
26
32
38
44
50
56
62
68
74
80
86
Jan
-16
Feb
-16
Mar
-16
Ap
r-1
6
May
-16
Jun
-16
Jul-
16
Au
g-1
6
Sep
-16
Oct
-16
No
v-16
Dec
-16
Jan
-17
Feb
-17
Mar
-17
Ap
r-1
7
May
-17
Jun
-17
Jul-
17
Au
g-1
7
Sep
-17
Oct
-17
No
v-17
Dec
-17
Jan
-18
Feb
-18
Mar
-18
Ap
r-1
8
May
-18
Jun
-18
Jul-
18
Au
g-1
8
Sep
-18
Oct
-18
No
v-18
Dec
-18
Jan
-19
Feb
-19
Mar
-19
Ap
r-1
9
May
-19
Jun
-19
Jul-
19
Au
g-1
9
Sep
-19
Oct
-19
No
v-19
Dec
-19
Jan
-20

Hizmete Özel / Confidential
Refinery Capacity Changes
www.tupras.com.trJanuary 20Investor Presentation 5Refining Market
Expectations until 2024:
• ~80% of net capacity additions will come from Asia & Middle East
• Net capacity and demand in Europe will remain roughly unchanged
2.10
0.98
1.68
0.49
1.30
-0.95
0.22
-1.41
-2 -1 0 1 2 3
China
India
Middle East
Other Asia
Other
Japan
N. America
Europe
2012-2018 Net Capacity Additions by Region
2.0
0.9
1.71.3
0.9
0.2
1.97
0.89
1.93 1.96
1.50
0.51
-0.5
0.0
0.5
1.0
1.5
2.0
2.5
2019 2020 2021 2022 2023 2024
2019-2024 Net Capacity Additions
Asia & Middle East Other Total

Hizmete Özel / Confidential
Middle Distillate Cracks
www.tupras.com.trJanuary 20Investor Presentation 6Refining Market
14.9
16.2
15.0
12.2
12.9
11.4
14.1
16.216.6
17.9
13.9
11.3
13.7
5
10
15
20
1 2 3 4 5 6 7 8 9 10 11 12
Diesel
5yr range 2019 2020 5 yr ave
14.4 13.8
13.2
10.3
10.9 11.2
14.8
16.4
17.0 17.4
12.5
9.3
12.0
5
10
15
20
1 2 3 4 5 6 7 8 9 10 11 12
Jet Fuel
5yr range 5 yr ave 2019 2020
5 yr between 2015-2019, data as of 6 Jan 2020
$/bbl

Hizmete Özel / Confidential
Gasoline and High Sulphur Fuel Oil Cracks
www.tupras.com.trJanuary 20Investor Presentation 7Refining Market
$/bbl
7.0
1.72.9
9.0
12.1
10.09.4
14.7
12.010.6
11.0
9.9
4.3
0
5
10
15
20
25
1 2 3 4 5 6 7 8 9 10 11 12
Gasoline
5yr range 2020 2019 5 yr ave
-26.6
-7.0
-5.0 -5.5
-8.6
-11.3-9.8
-6.9
-13.4-16.9
-22.5
-31.6
-32.9-35
0
1 2 3 4 5 6 7 8 9 10 11 12
High Sulphur Fuel Oil
5yr range 2020 2019 5 yr ave
5 yr between 2015-2019, data as of 6 Jan 2020

Hizmete Özel / Confidential
-12
-10
-8
-6
-4
-2
0
2Q
1 2
016
Q2
20
16
Q3
20
16
Q4
20
16
Q1
20
17
Q2
20
17
Q3
20
17
Q4
20
17
Q1
20
18
Q2
20
18
Q3
20
18
Q4
20
18
Q1
20
19
Q2
20
19
Q3
20
19
Q4
20
19
ArabHeavy
BasrahHeavy
Kirkuk
Kuwait
Ural
¹Average
Crude Price Differentials to Brent
www.tupras.com.trJanuary 20Investor Presentation 8Refining Market
¹Simple average of listed differentials
•Iran Sanctions
•Venezuela Sanctions
•OPEC+ Cut decision and over-compliance
•Druzhba contamination
•Drone attack to Saudi fields
Supply Shocks on Heavy Crude
A total of ~4 mbd is missing from heavy crude pool since December
2018, leading to price increases and narrowing differentials

Hizmete Özel / Confidential
Taking a Look at 2019…
www.tupras.com.trJanuary 20Investor Presentation 9Refining Market
January February March April May June July August September October November December
Weak Crack Margin Environment in 1HDiesel +5% Jet -9% Gasoline -36% HSFO -37% IMO Impact on Cracks
Elevated Concerns on Global Slowdown
Sanctions on Iran crude
OPEC Supply Cut <100% Compliance
Venezuela Crude Exports
Drone Attack to Aramco Oil Fields
Druzba Pipeline Contamination
OPEC Supply Cut >%120 Compliance
All waivers expired on Iran
IMO Impact on Differentials
Cra
cks
Dif
fere
nti
als
OPEC Supply Cut 100-120% Compliance

Hizmete Özel / Confidential
Turkish Market

Hizmete Özel / Confidential
Turkish Consumption 2015-2018
www.tupras.com.trJanuary 20Investor Presentation 11Turkish Market
Source: Tüpraş and EMRA ¹Bunker excluded
20.60
22.30
24.2023.60
2015 2016 2017 2018
DieselMillionTons
+8.5%
+8.5%
-2.4%
4.58
4.404.52
4.99
2015 2016 2017 2018
Jet Fuel
+10.4%
+2.7%-3.9%
2.10
2.23
2.302.34
2015 2016 2017 2018
Gasoline
+1.8%
+3.1%
+6.5%
0.6 0.58
0.49
0.39
2015 2016 2017 2018
Fuel Oil¹
-20.1%
-15.7%
-3.5%
Hizmete Özel / Confidential
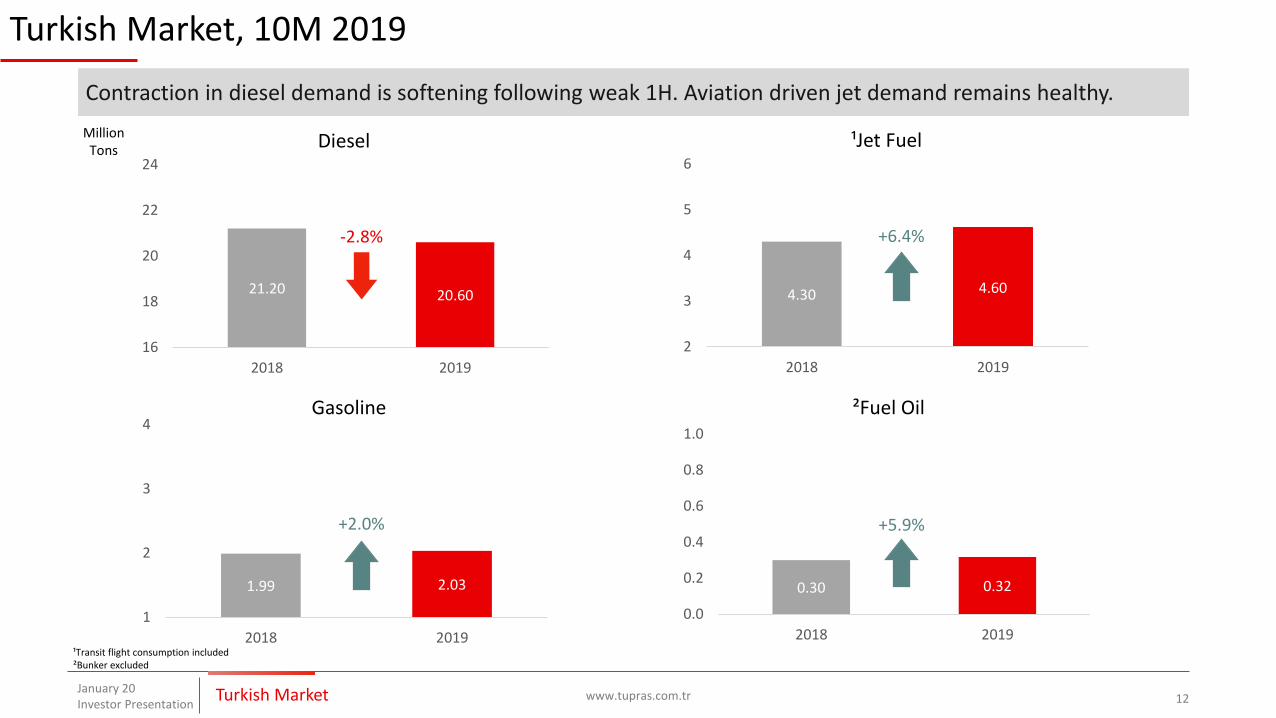
0.30 0.32
0.0
0.2
0.4
0.6
0.8
1.0
2018 2019
²Fuel Oil
1.99 2.03
1
2
3
4
2018 2019
Gasoline
4.30 4.60
2
3
4
5
6
2018 2019
¹Jet Fuel
21.20 20.60
16
18
20
22
24
2018 2019
Diesel
Turkish Market, 10M 2019
www.tupras.com.trJanuary 20Investor Presentation 12Turkish Market
MillionTons
Contraction in diesel demand is softening following weak 1H. Aviation driven jet demand remains healthy.
¹Transit flight consumption included²Bunker excluded
-2.8% +6.4%
+5.9%+2.0%
Hizmete Özel / Confidential
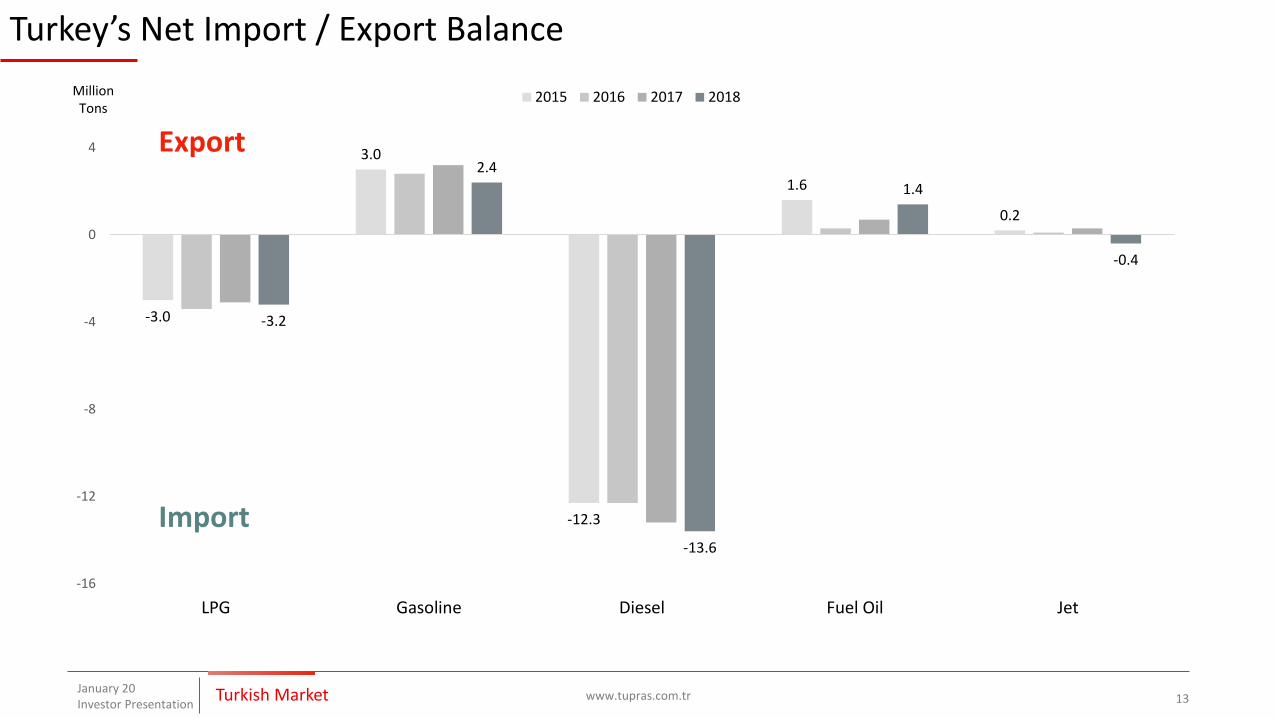
Turkey’s Net Import / Export Balance
www.tupras.com.trJanuary 20Investor Presentation 13Turkish Market
-3.0
3.0
-12.3
1.6
0.2
-3.2
2.4
-13.6
1.4
-0.4
-16
-12
-8
-4
0
4
LPG Gasoline Diesel Fuel Oil Jet
2015 2016 2017 2018
Export
Import
MillionTons

Hizmete Özel / Confidential
Company Overview

Hizmete Özel / Confidential
Domestic Ownership
17%
Foreign Ownership
83%
Tüpraş Shareholder Structure
www.tupras.com.trJanuary 20Investor Presentation 15Company Overview
¹As of September 30th,2019
Koç Holding77%
Aygaz20%
Opet3%
Ditaş79.98%
Opet40%
Körfez Ulaştırma100%
Publicly Traded
¹Distribution of Domestic-Foreign Ownership of Tüpraş
Shares
Free Float49%
Tüpraş is Turkey’s biggest industrial company and leading refiner.
Energy Investments Inc. (SPV)51%

Hizmete Özel / Confidential
Tüpraş’s Refining Assets & Distribution Network
www.tupras.com.trJanuary 20Investor Presentation 16Company Overview
İzmit
• 11.3 MT Capacity• NC: 14.5• Storage Capacity: 2.99 mn m3
İzmir
• 11.9 MT Capacity• NC: 7.66• Storage Capacity:2.51 mn m3
Kırıkkale
• 5.4 MT Capacity• NC: 6.32• Storage Capacity: 1.27 mn m3
Batman
• 1.4 MT Capacity• NC: 1.83• Storage Capacity:0.27 mn m3
Turkey‘s Storage Capacity
Tüpraş & Opet
57%
Others 43%
Railway
Iraq-Turkey Oil Pipeline
Baku-Tbilisi-Ceyhan Oil Pipeline
+ Tüpraş supplies ~60% of Turkey’s petroleum product needs
+ Tüpraş benefits from an integrated system optimization with its high complexity, procurement and logistics flexibility
Total Capacity
30 mntons
Nelson Complexity
9.5
Tüpraş Storage Cap.
7 mnm3

Hizmete Özel / Confidential
Nelson Complexity of Refining Companies
www.tupras.com.trJanuary 20Investor Presentation 17Company Overview

Hizmete Özel / Confidential
Tüpraş Subsidiaries
www.tupras.com.trJanuary 20Investor Presentation 18Company Overview
OPET, Distribution, Tüpraş Share: 40%
• 1,640 stations as of 30 September 2019• As of August 2019 Market share: 18.9% in white products; 31.7% in
black products
DİTAŞ, Marine Transport, Tüpraş Share: 79.98%
• 3 Crude Oil Tanker: 479,765 DWT• 1 Crude Oil - Product Tanker: 51,532 DWT• 9 Product Tanker: 155,478 DWT“
Körfez Ulaştırma, Railway Transport, Tüpraş Share: 100%
• ~7% share in Turkish rail freight market• ~1.4 mn ton of product and semi-product carried in 9M 2019.• Operates with 10 diesel locomotives and over 600 cistern wagons
Tüpraş Trading UK, Trading, Tüpraş Share: 100%
• Trading Office in London will be an important step into wider integration with the global energy landscape by allowing to:
Closely monitor international market opportunities Support import and export operations Create additional value from supply chain and sales activities

Hizmete Özel / Confidential
Operations

Hizmete Özel / Confidential
6 610
2 2 33 3 1 0
12 13 1310 10 10
2
17 1511
14 14
7
14
65 6763
7176
7981
2012 2013 2014 2015 2016 2017 2018
Africa America Europe CIS Middle East
Main Crude Suppliers in 2018
Crude Suppliers of Tüpraş
www.tupras.com.trJanuary 20Investor Presentation 20
In 2018, Tüpraş purchased 20 different types of crude from 12 countries with gravities ranging between 19-47 API.
Operations
Crude Oil Imports by Region (%)

Hizmete Özel / Confidential
LPG4%
Gasoline19%
Naphtha1%
Jet18%
Gasoil37%
Other2%
Kok3%
Fuel Oil7%
Asphalt9%
LPG Gasoline Naphtha Jet Gasoil
Other Kok Fuel Oil Asphalt
Light Distil.20%
Mid. Distil.55%
Other White 4%
Black Prod.20%
Q3 Product Yields
www.tupras.com.trJanuary 20Investor Presentation 21
LPG4%
Gasoline19%
Naphtha1%
Jet19%
Gasoil32%
Other2%
Kok3%
Fuel Oil7%
Asphalt13%
LPG Gasoline Naphtha Jet Gasoil
Other Kok Fuel Oil Asphalt
Light Distil.21%
Mid. Distil.51%
Other white4%
Black Prod.24%
2018 Q3
White Product Yield (%) 75.8%
Production 7.7 mn tons
API 30.7
2019 Q3
White Product Yield (%) 79.5%
Production 7.5 mn tons
API 31.49
Operations
Hizmete Özel / Confidential
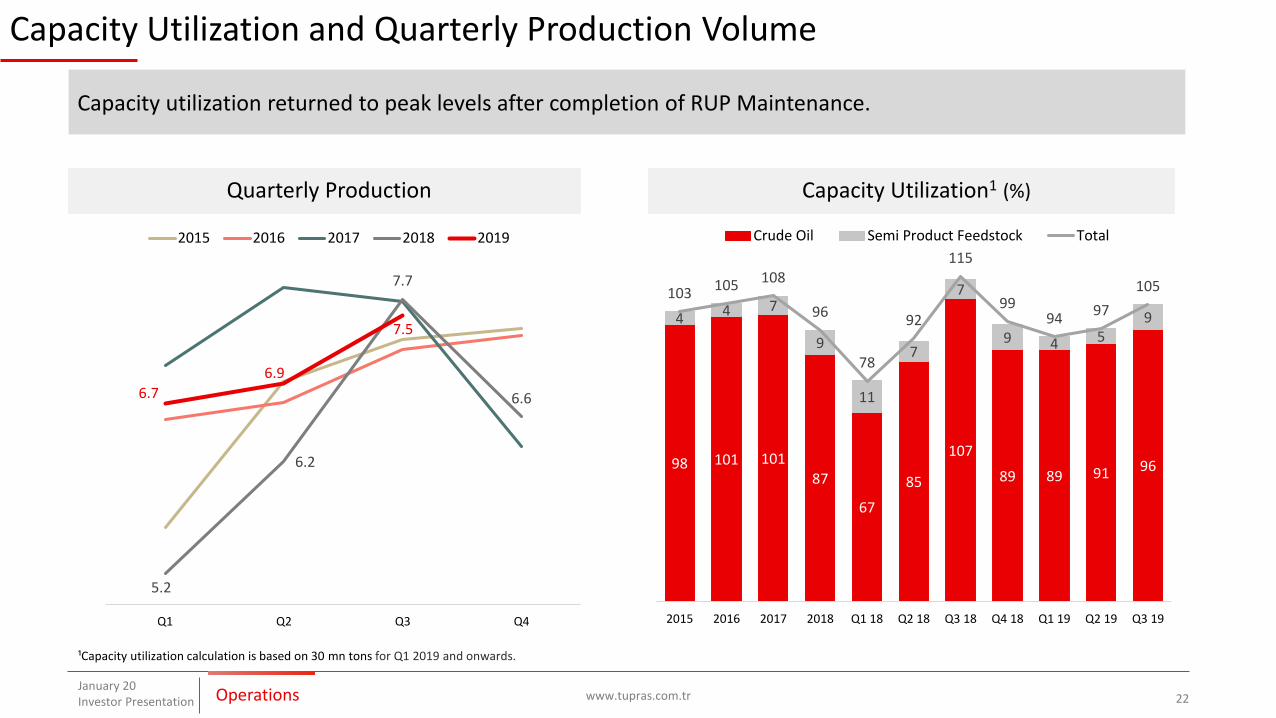
98 101 10187
67
85
107
89 89 91 96
4 4 7
9
11
7
7
9 4 59
103 105 108
96
78
92
115
9994
97
105
2015 2016 2017 2018 Q1 18 Q2 18 Q3 18 Q4 18 Q1 19 Q2 19 Q3 19
Crude Oil Semi Product Feedstock Total
5.2
6.2
7.7
6.66.7
6.9
7.5
Q1 Q2 Q3 Q4
2015 2016 2017 2018 2019
Capacity Utilization1 (%)Quarterly Production
Capacity Utilization and Quarterly Production Volume
www.tupras.com.trJanuary 20Investor Presentation 22
¹Capacity utilization calculation is based on 30 mn tons for Q1 2019 and onwards.
Capacity utilization returned to peak levels after completion of RUP Maintenance.
Operations
Hizmete Özel / Confidential
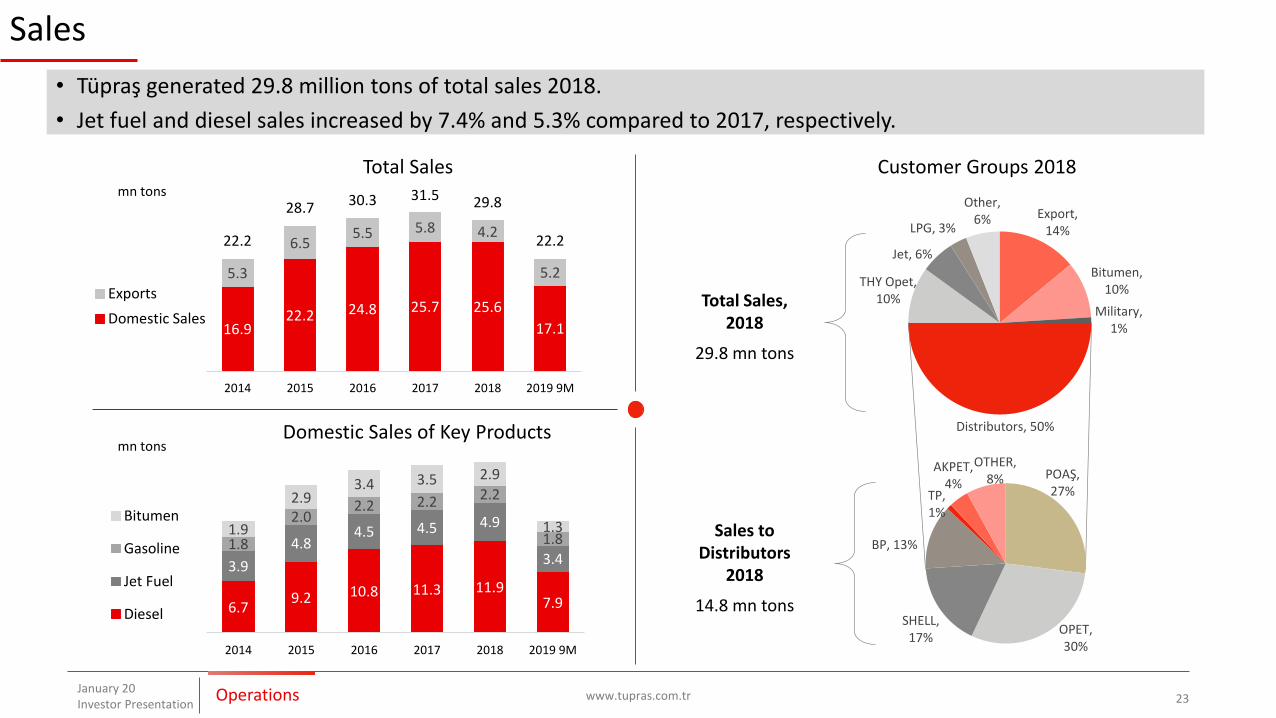
Distributors, 50%
THY Opet, 10%
Jet, 6%
LPG, 3%
Other, 6% Export,
14%
Bitumen, 10%
Military, 1%
Sales
www.tupras.com.trJanuary 20Investor Presentation 23
• Tüpraş generated 29.8 million tons of total sales 2018.
• Jet fuel and diesel sales increased by 7.4% and 5.3% compared to 2017, respectively.
16.922.2 24.8 25.7 25.6
17.1
5.3
6.55.5 5.8 4.2
5.2
22.2
28.7 30.3 31.5 29.8
22.2
2014 2015 2016 2017 2018 2019 9M
Exports
Domestic Sales
6.79.2 10.8 11.3 11.9
7.9
3.9
4.84.5 4.5 4.9
3.41.8
2.02.2 2.2 2.2
1.81.9
2.93.4 3.5 2.9
1.3
2014 2015 2016 2017 2018 2019 9M
Bitumen
Gasoline
Jet Fuel
Diesel
Total Sales
Domestic Sales of Key Products
Customer Groups 2018
POAŞ, 27%
OPET, 30%
SHELL, 17%
BP, 13%
TP, 1%
AKPET, 4%
OTHER, 8%
Operations
mn tons
mn tons
Sales to Distributors
2018
14.8 mn tons
Total Sales, 2018
29.8 mn tons

Hizmete Özel / Confidential
Key FinancialsFinancials

Hizmete Özel / Confidential
Margin Environment
www.tupras.com.trJanuary 20Investor Presentation 25
Tüpraş’ 3.7 $/bbl Net Refining Margin in 9M 2019 was higher than 2.9 $/bbl Med Complex margin.
2.53.2
6.56.0
8.1
9.3
3.7
1.71.9
4.84.0
5.34.6
2.9
2013 2014 2015 2016 2017 2018 9M 2019
Tüpraş Net Margin Mediterranean
Premium to the benchmark Mediterranean peers’ refining margin due to:
• Refined products deficit characteristic to the Turkish
market
• Access to cheaper sources of crude oil
• Ability to use heavier and sour crudes
• Close proximity to major suppliers reduces
transport costs
• Lower cost basis and more efficient energy usage
• Ability to produce higher value added range
of refined products
• Direct pipeline connections with domestic clients
• High export capability
5.5
2.02.9
1.2
4.2
1.7 2.0
4.84.0
5.44.6
2.9
Jan-08 Jan-09 Jan-10 Jan-11 Jan-12 Jan-13 Jan-14 Jan-15 Jan-16 Jan-17 Jan-18 Jan-19
Med Complex
Month Annual
Financials
$/bbl
$/bbl

Hizmete Özel / Confidential
Tüpraş and Med Margins
www.tupras.com.trJanuary 20Investor Presentation 26Financials
6.9
4.6
8.5
10.7
3.7
5.3
3.6
5.8
4.5
2.9
2015 2016 2017 2018 2019
9M Margins
Tüpraş Net Med Margin
($/bbl) Gross Margin Inventory Effect Clean Gross Margin Clean NET Margin Med Margin
2019 Q3 9.1 -1.4 10.6 5.4 3.3
2019 9M 9.0 -0.1 9.1 3.8 2.9
2018 Q3 17.6 3.1 14.5 10.4 5.1
2018 9M 16.0 2.5 13.6 8.3 4.5
$/b
bl

Hizmete Özel / Confidential
Income Statement
www.tupras.com.trJanuary 20Investor Presentation 27
Tüpraş recorded 956 mn TL EBITDA in Q3 2019.
*On CMB reports. EBIT includes extra items such as FX impacts of trade receivables and payables. In our EBITDA calculation. FX related items are excluded from EBIT as customary in international practices.
Million TLQ3 Q3
%9M 9M
%2019 2018 2019 2018
Net Sales 23,309 30,247 -23 67,970 63,749 7
COGS -22,152 -26,337 -16 -64,150 -56,549 13
Gross Profit 1,157 3,910 -70 3,820 7,200 -47
Operating Expenses -451 -324 39 -1,244 -870 43
Income/Loss from other operations -98 -2,783 -407 -3,771
Operating Profit 608 802 -24 2,169 2,559 -15
Income/Loss from equity investment 63 47 34 172 185 -7
Operating Profit Before Fin. Income/Loss 671 849 -21 2,341 2,743 -15
Financial Income /Expense -817 -171 -2,214 -668
Profit Before Tax -146 678 127 2,075
Net Profit (excluding minority interest) -155 542 340 1,947
EBITDA *(mn.TL) 956 3,778 -75 3,301 7,021 -53
Inventory Gain/Loss -692 1,667 283 2,950 -90
EBITDA* (mn. TL) CCS 1,648 2,111 -22 3,018 4,071 -26
Financials

Hizmete Özel / Confidential
Financial Highlights
www.tupras.com.trJanuary 20Investor Presentation 28
Tüpraş recorded 3,301 MTL EBITDA in 9M 2019.
367 3351,575 1,033 851
1,080 688
1,542 2,2101,4951,144
867
1,528
3,778
9561,2081,505
1,237
1,887
2015 2016 2017 2018 2019
EBITDAQ1 Q2 Q3 Q4
3,799 3,301
27579
869378
-375
710331
1,457
1,027870
750
581
992
542
-155
815
803
493
1,766
2015 2016 2017 2018 2019
¹Net Income
Q1 Q2 Q3 Q4
1.8 1.8
1.1
1.3
1.7
1.01.1 1.2
1.3
1.1
2015 2016 2017 2018 Sep. 2019
Current Ratio & Net Debt / R. EBITDA
Net Debt / R. EBITDA Current Ratio
35%
22%
41%37%
21%
2015 2016 2017 2018 Sep. 2019
²Return on Average Equity
1) Excluding minority interest 2) Calculation based on rolling net income
3,396
5,882
8,908
2,550
1,793
3,8123,713
340
Financials
Mn TL Mn TL

Hizmete Özel / Confidential
Balance Sheet Analysis
www.tupras.com.trJanuary 20Investor Presentation 29
Strong balance sheet maintained.
3.9
6.8
1.5 1.50.9
4.2
1 year 1-2 years 2-3 years 3-4 years 4-5 years Over 5 years
Redemption Schedule
Loan Eurobond TL bond Total
0.8
-0.2
2.1
4.7
1.6
-0.7
-2.3
Dec-15 Dec-16 Dec-17 Dec-18 Mar-19 Jun-19 Sep-19
Working Capital Requirement
6.96.1 6.2
12.010.6 10.1
8.7
Dec-15 Dec-16 Dec-17 Dec-18 Mar-19 Jun-19 Sep-19
Net Debt
Proactive Financial Management
• Delevering continues despite operational headwinds
• Dynamic liquidity management ensures optimal cash and receivables management
Billion TL Billion TL
Billion TL
Financials

Hizmete Özel / Confidential
Q3 Profit Before Tax Bridge (2018-2019)
www.tupras.com.trJanuary 20Investor Presentation 30
Decline in profit before tax was driven by narrow differentials and natural gas price hikes.
Million TL
FX
Inventory
+2,473
-2,384
Financials

Hizmete Özel / Confidential
Annual Profit Before Tax Bridge (2017-2018)
www.tupras.com.trJanuary 20Investor Presentation 31
2018 PBT was lower mainly due to Crude Oil Differential and Crack Margin impacts. With the help of FX based pricing, FX losses incurred from payables were recovered with Inventory Gains.
Million TL
Financials

Hizmete Özel / Confidential
Dividend (TL)
www.tupras.com.trJanuary 20Investor Presentation 32
3.2 2.9
5.05.8
4.85.8
10.2
7.2
15.2 14.8
2.5 3.03.9 3.9
1.6
6.5 6.2
13.615.2
77%
101%
79%
66%
33%
0%
64%
87%89%
102%
0%
40%
80%
120%
0
2
4
6
8
10
12
14
16
18
20
2009 2010 2011 2012 2013 2014 2015 2016 2017 2018
Earnings per Share Gross Dividend Dividend Payout
Financials

Hizmete Özel / Confidential
Investments (Million $)
www.tupras.com.trJanuary 20Investor Presentation 33
274355
400
186 177
628
974
1213
959
344
213 185138 112
2006 2007 2008 2009 2010 2011 2012 2013 2014 2015 2016 2017 2018 20199M
Ongoing Projects
• Revamp of Crude Units
• FCC Modernization
• New Sulphur Units
• Energy Saving Projects
• Optimization of conversion
units
• 6.5 bn USD investments since privatization
• Reached 9.5 Nelson Complexity
• Capability to process heavier and more sour crude
Avg. 278 Mn$
Avg. 943 Mn$
Avg. 220 Mn$
Financials

Hizmete Özel / Confidential
9M 2019 Results
www.tupras.com.trJanuary 20Investor Presentation 34
3.7
2.9
0 1 2 3 4 5 6
9M
Refining Margins ($/bbl)
Med Margin Tüpraş Net Margin
98.3% total capacity utilization in 9M 2019
21.2 22.228 30
Production Sales
Operationals9M 2019 Target
22.2 mn tons of sales and 21.2 m tons of production in 9M 2019
112150
9M 2019 Target
Capex (mn $)
112 mn$ refining CAPEX in 9M 2019
98.3
0 20 40 60 80 100
9M
Capacity Utilization (%)
3.7 $/bbl net refining margin in 9M 2019
Med FY Exp
Tüpraş FY Target
Financials

Hizmete Özel / Confidential
Tüpraş Balance Sheet (Million TL)
www.tupras.com.trJanuary 20Investor Presentation 35
30.09.2019 31.12.2018 Diff. Diff. (%)Current Assets 28,945 20,962 7,983 38
Cash & C. Equivalents 10,106 5,983 4,123 69Trade Receivables 6,063 5,429 635 12
Derivatives 350 176 174 99Inventories 9,489 6,765 2,724 40
Pre-paid expenses 231 109 122 113Other Current Assets 2,707 2,502 205 8
Long Term Assets 26,735 19,074 7,662 40Financial Assets & Subsidiaries 1,368 1,271 97 8
Fixed Assets 20,290 12,397 7,893 64Derivatives 122 168 -46 -28
Pre-paid expenses 349 378 -29 -8Deferred Tax 3,114 3,566 -452 -13
Other Long Term Assets 1,492 1,293 199 15
Total Assets 55,681 40,036 15,645 39Short Term Liabilities 27,358 15,950 11,408 72
Financial Loans 3,860 4,113 -253 -6Trade Payables 17,834 7,496 10,337 138
Derivatives 288 236 52 22Provisions 201 80 120 150
Other ST Liabilities 5,175 4,024 1,152 29Long Term Liabilities 15,323 14,140 4,237 8
Financial Loans 14,990 13,836 1,154 8Payables & Provisions 278 257 21 8
Derivatives 46 42 4 10Other LT Liabilities 8 5 4 84
Total equity attr. to equity holders of the parent 12,839 9,825 3,014 31Minority Interests 161 121 40 33
Total Liabilities & Equity 55,681 40,036 15,645 39
Financials
Hizmete Özel / Confidential
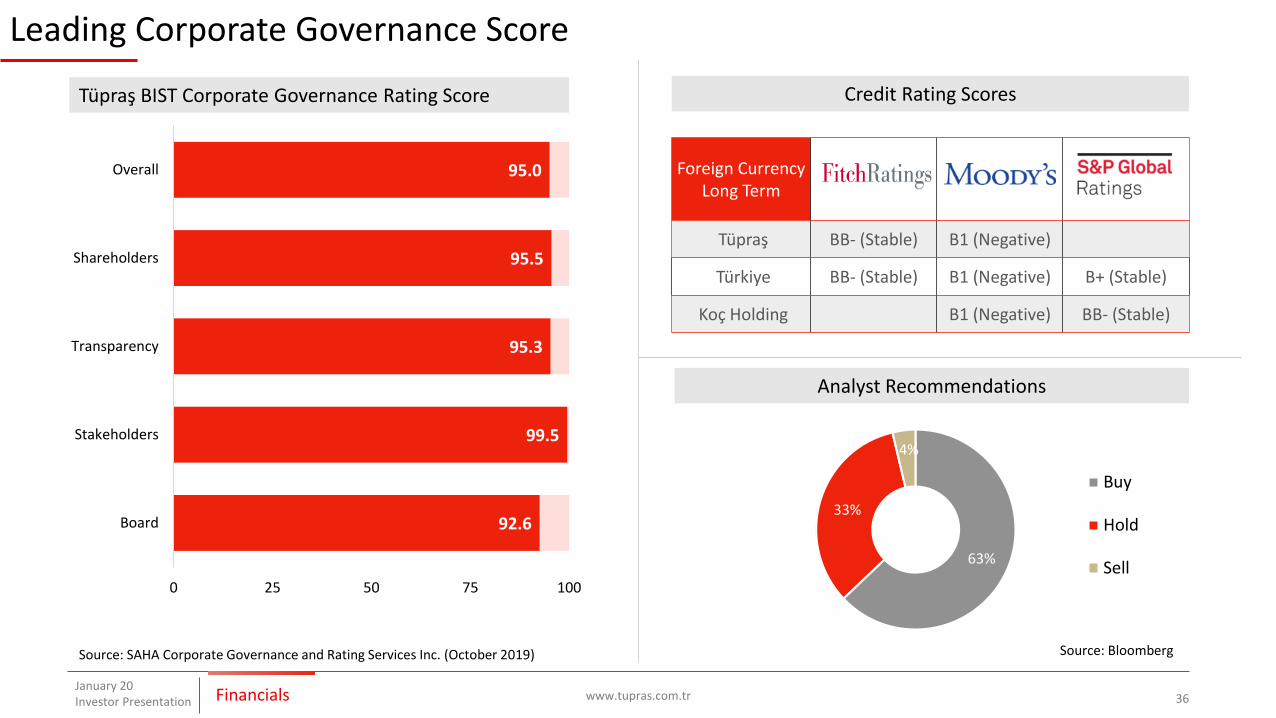
Foreign Currency Long Term
Tüpraş BB- (Stable) B1 (Negative)
Türkiye BB- (Stable) B1 (Negative) B+ (Stable)
Koç Holding B1 (Negative) BB- (Stable)
Leading Corporate Governance Score
www.tupras.com.trJanuary 20Investor Presentation 36
92.6
99.5
95.3
95.5
95.0
0 25 50 75 100
Board
Stakeholders
Transparency
Shareholders
Overall
Tüpraş BIST Corporate Governance Rating Score
Source: Bloomberg
63%
33%
4%
Buy
Hold
Sell
Analyst Recommendations
Credit Rating Scores
Source: SAHA Corporate Governance and Rating Services Inc. (October 2019)
Financials

Hizmete Özel / Confidential
Proactive in liquidity risk management & targets/limits for financial ratios:
• Net financial debt/EBITDA
• Net financial debt/Equity
Financial Policy
www.tupras.com.trJanuary 20Inestor Presentation 37
Financial Discipline: Risk management policies focusing on areas such as leverage, liquidity, counterparty risk, commodity, interest rate and currency exposure.
Leverage & Liquidity
• Current ratio
• Share of long term debt
Deposit is kept within bank-based limits:
• Credit rating assessment and strong capital base.
• Cap on the maximum deposit allocated to a single bank.
• Threshold for deposits subject to banks shareholders’ equity.
Counterparty Risk Policy
• The fixed/floating profile of financial debt.
• Proactive management of FX risk with derivative instruments
• Zero FX exposure target.
Interest Rate & Fx
Inventory Hedging Policy:• Operational hedge: Optimum stock policy & forward pricing mechanism.• Financial hedge: Expected inventory exposure for the year end is hedged by using derivatives.• Hedging ratio increasing throughout the year.
Crack Margin Hedging Policy:• Financial hedge: Crack margin (gasoline, diesel, jet fuel, fuel oil) risk mitigation by using derivatives.• Hedge ratio between %0-%50 with up to 1 year hedge tenor
CommodityHedging
Policy
Financials

Hizmete Özel / Confidential
FX Exposure Management (30 September 2019)
www.tupras.com.trJanuary 20Investor Presentation 38
Cash
342
Forward & CFH2,463
Stock1,682
Receivables & Other Assets
98
Payables2,252
ST Financial Loans533
• RUP: 191• Other: 342
LT Financial Loans1,789
• RUP: 707• Eurobond: 700• Other Loans: 382
Consolidated Hard Currency Assets
Consolidated Hard Currency Liabilities
Million $
+11 mn $
* Cash flow hedge accounting : 864 mn $
• A significant portion of the Group's crude oil and refined
product purchases are denominated in US Dollars. In
addition, the Group finances its capital expenditures
mostly through borrowings denominated in US Dollars.
• Natural Hedge: The Group is able to mitigate some of
the impact of volatility in exchange rates through
natural hedges: crude oil and refined product
inventories are US Dollar denominated assets.
• Cash flow Hedge: RUP Facility financing loans
designated as hedging instruments of highly probable
export revenues.
• As a general Koç Holding financial policy, Group
companies are allowed to keep foreign exchange
positions within certain limits.
Tüpraş continues to employ strict FX policies to mitigate currency risks stemming from volatility.
Financials

Hizmete Özel / Confidential
Appendix

Hizmete Özel / Confidential
2019 Refinery Maintenance Schedule
www.tupras.com.trJanuary 20Investor Presentation 40
Refinery Unit QuarterDuration(weeks)
Reason Status
İzmir
Plt 100 CDU Q4 2-3 Periodic
Plt-8200 Hydrocracker Q4 2-3 Periodic
Plt-8100 Vacuum Q4 2 Periodic
Plt 9200 CCR Q1 3 Completed
İzmit
RUP Q1&Q2 11 Completed
Plt 2 Crude Oil & Vacuum Q4 7-8 Periodic
Plt 7 FCC Q4 5-6 Periodic
Kırıkkale
Batman Plt 100/1100 Crude Oil & Vacuum Q1 10 Completed
Appendix
Hizmete Özel / Confidential
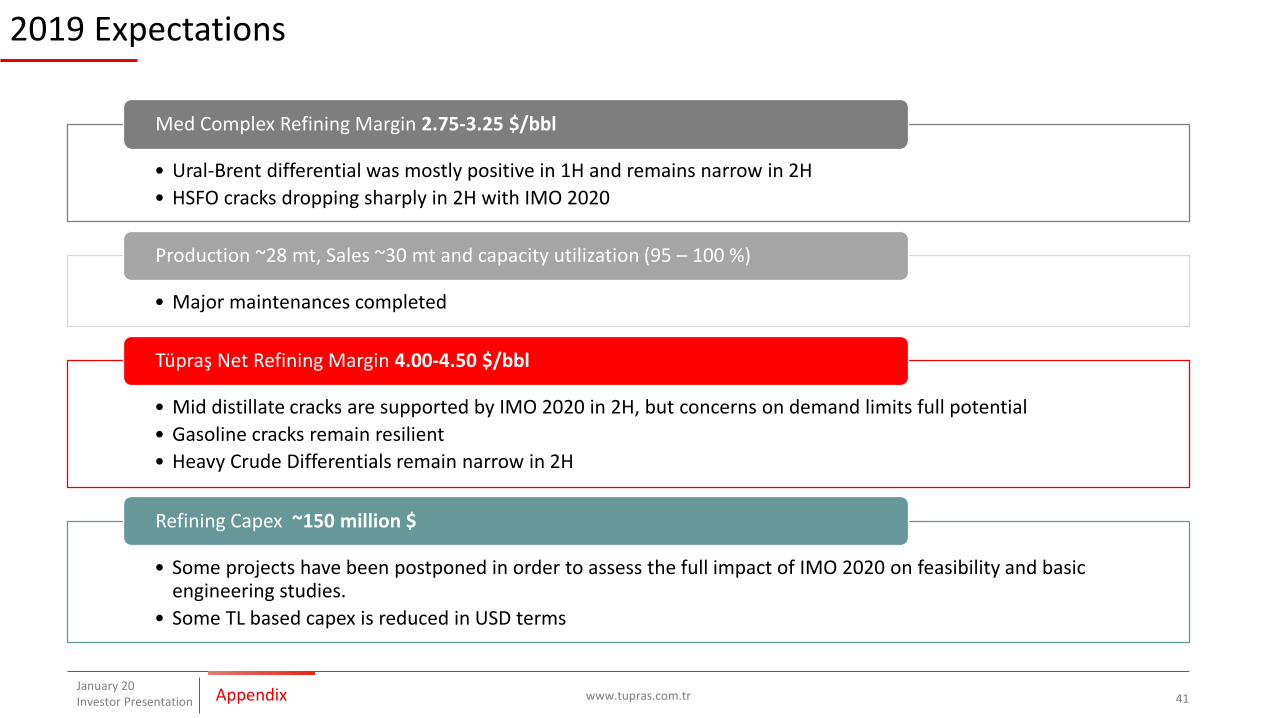
2019 Expectations
www.tupras.com.trJanuary 20Investor Presentation 41
• Ural-Brent differential was mostly positive in 1H and remains narrow in 2H
• HSFO cracks dropping sharply in 2H with IMO 2020
Med Complex Refining Margin 2.75-3.25 $/bbl
• Major maintenances completed
Production ~28 mt, Sales ~30 mt and capacity utilization (95 – 100 %)
• Mid distillate cracks are supported by IMO 2020 in 2H, but concerns on demand limits full potential
• Gasoline cracks remain resilient
• Heavy Crude Differentials remain narrow in 2H
Tüpraş Net Refining Margin 4.00-4.50 $/bbl
• Some projects have been postponed in order to assess the full impact of IMO 2020 on feasibility and basic engineering studies.
• Some TL based capex is reduced in USD terms
Refining Capex ~150 million $
Appendix
Hizmete Özel / Confidential
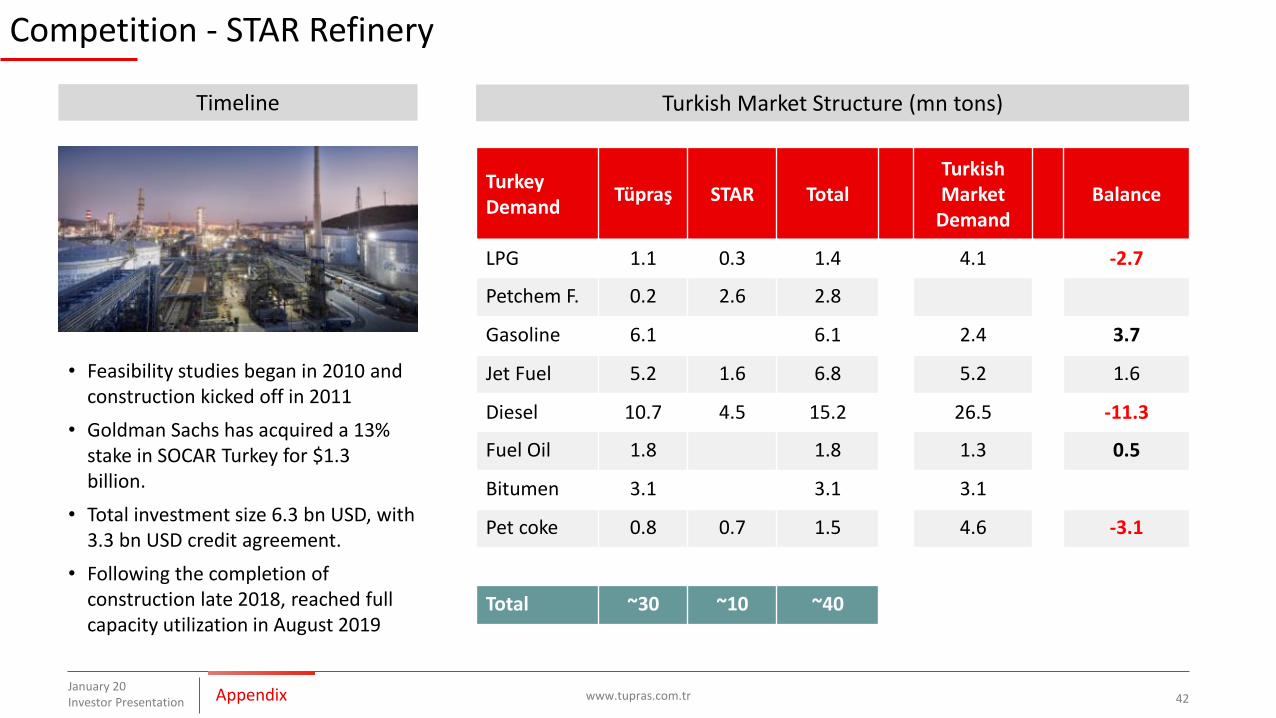
Competition - STAR Refinery
www.tupras.com.tr 42January 20Investor Presentation
• Feasibility studies began in 2010 and construction kicked off in 2011
• Goldman Sachs has acquired a 13% stake in SOCAR Turkey for $1.3 billion.
• Total investment size 6.3 bn USD, with 3.3 bn USD credit agreement.
• Following the completion of construction late 2018, reached full capacity utilization in August 2019
Turkish Market Structure (mn tons)Timeline
Turkey Demand
Tüpraş STAR TotalTurkishMarket
DemandBalance
LPG 1.1 0.3 1.4 4.1 -2.7
Petchem F. 0.2 2.6 2.8
Gasoline 6.1 6.1 2.4 3.7
Jet Fuel 5.2 1.6 6.8 5.2 1.6
Diesel 10.7 4.5 15.2 26.5 -11.3
Fuel Oil 1.8 1.8 1.3 0.5
Bitumen 3.1 3.1 3.1
Pet coke 0.8 0.7 1.5 4.6 -3.1
Total ~30 ~10 ~40
Appendix

Hizmete Özel / Confidential
Competition - Regional Competition
www.tupras.com.tr 43January 20Investor Presentation
• Tüpraş competes with 71 refineries in the Mediterranean and Black Sea markets.• Mediterranean regional product balance is also affected from Middle East, North West Europe and Asia flows
17 Refineries ~1.8mbd
Mediterranean Black Sea
54 Refineries ~7.8mbd
Appendix

Hizmete Özel / Confidential
IMO 2020: Changes in Bunker Specification and Its Effects
www.tupras.com.trJanuary 20Investor Presentation 44
Current compliant fuels
Cu
rren
t O
utl
oo
kB
eyo
nd
20
20
Demand shift beyond 2020
HSFO replacement expectations
Long term outlook for marine fuels
• Marine Gasoil (Diesel): Easiest solution as it is already available
• Very Low Sulphur Fuel Oil (VLSFO): Either through FCC with sweet crudes or by blending
• Scrubbers: As of 01/11/19, ~2.8K vessels are either fitted or scheduled to be fitted and ~0.6K vessels are on order book to be delivered with scrubbers
• LNG: requires significant investments at ports
0
1
2
3
4
5
6
2016 2017 2018 2019 2020 2021 2022 2023 2024 2025
Compliant HSFO Non-compliant HSFO ULSFO MGO LNG
• MGO is expected to be the initial choice in 2020• VLSFO becomes more widespread through the years as
availability & compatibility issues get resolved• Compliant HSFO use grows as scrubber numbers rise
from ~2K after Jan 1st, 2020 (some ports started bans on open-loop scrubbers thus this projection might change)
Source: Market Reports
Appendix

Hizmete Özel / Confidential
Tüpraş Production Flow and Yield Breakdown
www.tupras.com.trJanuary 20Investor Presentation 45
• Residuum Upgrade Plant (RUP) was completed in 2015 and it is the main conversion unit of Tüpraş.
• First periodic maintenance was completed in Q2 2019.
Appendix
Key Units# of
UnitsCapacity(m3/d)
CRUDE OIL 8 99,420
VACUUM DIST. 8 42,752
HYDROCRACKER 4 18,032
ISOMERATION 3 7,804
UNIFINER REFORMER
5 16,225
KERO/DIESEL (HDS)
9 37,265
FCC 2 4,650
COKER 1 9000
NAPHTASPLITTER
8
LPG MEROX 6
Flow Diagram
LPG MEROX
NAPHTHASPLITTER
ISOMER.
VACUUMDIST.
UNIFINERREFORMER
KERO/DIESEL (HDS)
FCC
HYDROCRACKER
COKER
Bitumen
Lube Oil
FCCGasolineHDS
BenzenSaturation
Multiple distillation
and production
units
Other, 3.8%
Bitumen & Fuel Oil, 19.9%
Lube Oil, 0.5%
Diesel,
33.9%
Jet Fueloil, 16.5%
GasolineNaphtha,
22.0%
LPG, 3.5%

Hizmete Özel / Confidential
RUP Feedstock and Production
www.tupras.com.trJanuary 20Investor Presentation 46
• Residium Upgrade Plant (RUP) was completed in 2015 and it is the main conversion unit of Tüpraş.
• First periodic maintenance was completed in Q2 2019.
Total Output ~4.25mn tonsTotal Processing ~4.50 mn tons
Appendix

Hizmete Özel / Confidential
European Pump Price Comparison
www.tupras.com.trJanuary 20Investor Presentation 47
2.833.93
2.373.02
3.562.79
3.722.73
0.70
0.00
0.870.54
0.000.96
0.000.95
3.45
4.55 5.696.14 5.86
6.15 6.64 6.60
0
2
4
6
8
10
12
TR Spa. Ger UK Eu19 Fra. Gre. Ita.
Gasoline (TL/Lt)
Refinery Price Dist. Margin Tax
3.174.10
2.893.94
4.52
3.02 3.05 3.18
0.760.00
0.910.00
0.00
0.92 0.80 0.73
2.58
3.85 4.374.78
4.49 5.55 5.756.21
0
2
4
6
8
10
12
TR Spa. Ger. EU19 Gre. Fra. Ita. UK
Diesel (TL/Lt)
Refinery Price Dist. Margin Tax
European prices as of 16th December - Turkeys prices as of 24th December
Turkish fuel prices are highly competitive with other European countries.
Appendix

Hizmete Özel / Confidential
Tüpraş - ESG - Over a Decade of Dedication
www.tupras.com.trJanuary 20Investor Presentation 48Appendix
Tüpraş kicked off its sustainability
program back in 2008 and achieved
many milestones in a decade
~480 energy efficiency
projects leading to
~35,000 TJ saving and
2.4 mt CO2 reduction
31%increase in solid waste recovery
20 points drop in Energy
Intensity
36% decrease in fresh
water usage
~205 MTL donations and sponsorships
75% increase in female
employee numbers
~1mn workhours dedicated to
OHS training
+1.3 points increase in Corporate
Governance rating
17% female representation in senior and mid-level
management
See our Sustainability Report for details

Hizmete Özel / Confidential
Tüpraş - ESG - 2018 Achievements
www.tupras.com.tr 49
• Kırıkkale Refinery won the first place, İzmit Refinery the second and Batman Refinery the third in the Industrial Energy Efficiency Project Competition.
• İzmit Refinery won the first prize in the Sustainable Business Awards -Water Management Category.
• Achieved 69.5% water recycle ratio
• Achieved 88.6% solid waste recovery
Environmental Responsibility
• Signed agreement to supportHeForShe (Global cooperation with UN Women and Fenerbahçe Sports Club)
• 62% of ex-crude procurement activities were conducted through local businesses.
Social Support
• 9.50 Corporate Governance Rating
• 13% Female Representation at the Board,
• 17% Female Representation in Upper and Mid-Level Management.
Governance Excellence
AppendixJanuary 20Investor Presentation

Hizmete Özel / Confidential
Koç Holding
www.tupras.com.tr 50
• Koç Holding is Turkey’s largest industrial and services group in terms of revenues, exports, employees, taxes paid and market capitalization
• The only Turkish company in Fortuna 5001.• 20% CAGR in consolidated profit2 the last five years
Turkey’s Leading Investment Holding Company
• Leading positions with clear competitive advantages in sectors with long-term growth potential such as energy, automotive, consumer durables and finance.
Pioneer in its Sectors
8%
Combined Revenues /
GDP
10%
Total Exports / Turkey’s Exports
16%
Total Market Cap in Borsa
Istanbul
Notes : Data as of YE18, 2018 GDP reflects the projection of Turkish government’s New Economic Program.(1) 2018 Report(2) In TL terms between 2014-18
AppendixJanuary 20Investor Presentation
Hizmete Özel / Confidential
Investor Presentation
Latest Webcast
Sustainability Report
contact us: [email protected]