Investor presentation march_2017
43
TENNANTCO.COM REINVENTING the future of cleaning. INVESTOR PRESENTATION March 2017
-
Upload
tennantcorporation -
Category
Investor Relations
-
view
130 -
download
0
Transcript of Investor presentation march_2017
TENNANTCO.COM
REINVENTINGthe future of cleaning.
INVESTOR PRESENTATIONMarch 2017
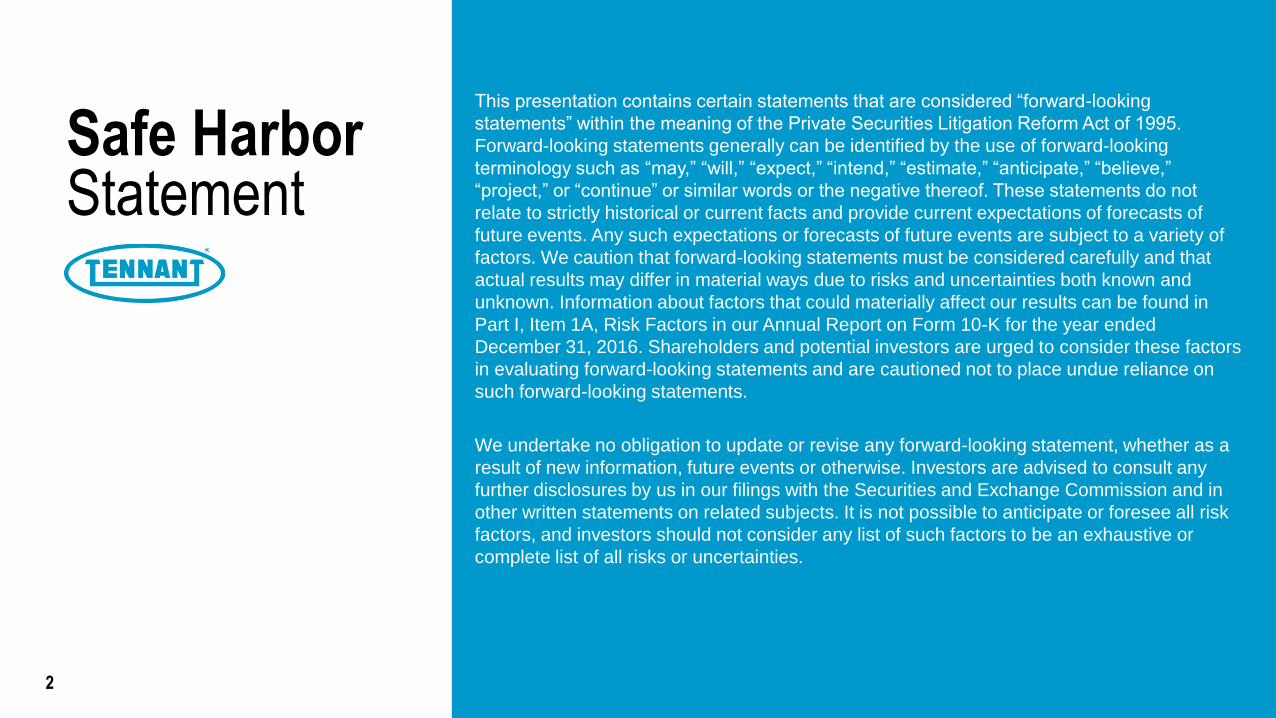
Safe HarborStatement
2
This presentation contains certain statements that are considered “forward-looking
statements” within the meaning of the Private Securities Litigation Reform Act of 1995.
Forward-looking statements generally can be identified by the use of forward-looking
terminology such as “may,” “will,” “expect,” “intend,” “estimate,” “anticipate,” “believe,”
“project,” or “continue” or similar words or the negative thereof. These statements do not
relate to strictly historical or current facts and provide current expectations of forecasts of
future events. Any such expectations or forecasts of future events are subject to a variety of
factors. We caution that forward-looking statements must be considered carefully and that
actual results may differ in material ways due to risks and uncertainties both known and
unknown. Information about factors that could materially affect our results can be found in
Part I, Item 1A, Risk Factors in our Annual Report on Form 10-K for the year ended
December 31, 2016. Shareholders and potential investors are urged to consider these factors
in evaluating forward-looking statements and are cautioned not to place undue reliance on
such forward-looking statements.
We undertake no obligation to update or revise any forward-looking statement, whether as a
result of new information, future events or otherwise. Investors are advised to consult any
further disclosures by us in our filings with the Securities and Exchange Commission and in
other written statements on related subjects. It is not possible to anticipate or foresee all risk
factors, and investors should not consider any list of such factors to be an exhaustive or
complete list of all risks or uncertainties.
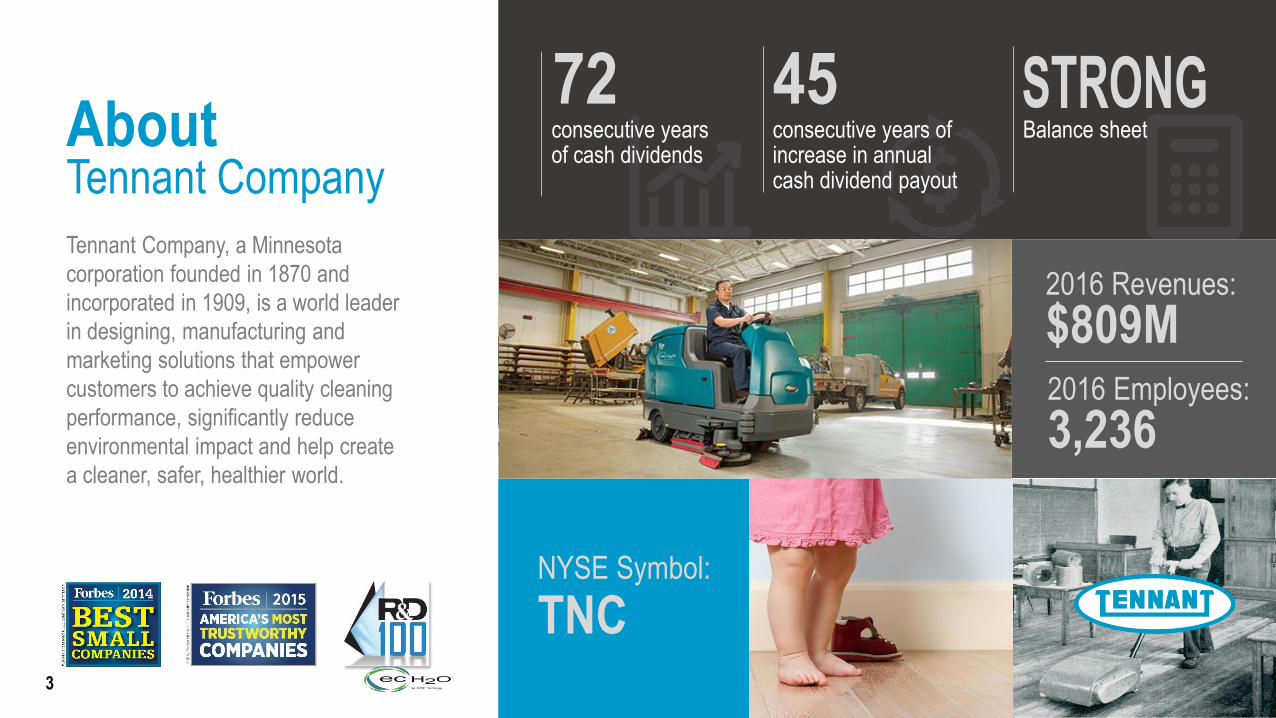
AboutTennant Company
Tennant Company, a Minnesota
corporation founded in 1870 and
incorporated in 1909, is a world leader
in designing, manufacturing and
marketing solutions that empower
customers to achieve quality cleaning
performance, significantly reduce
environmental impact and help create
a cleaner, safer, healthier world.
72consecutive years of cash dividends
45consecutive years of increase in annual cash dividend payout
Balance sheet
NYSE Symbol:
TNC
2016 Revenues:
$809M
3
2016 Employees:
3,236
OUR VISION
We will lead our global industry in
sustainable cleaning innovation that
empowers our customers to create a
cleaner, safer and healthier world.
4
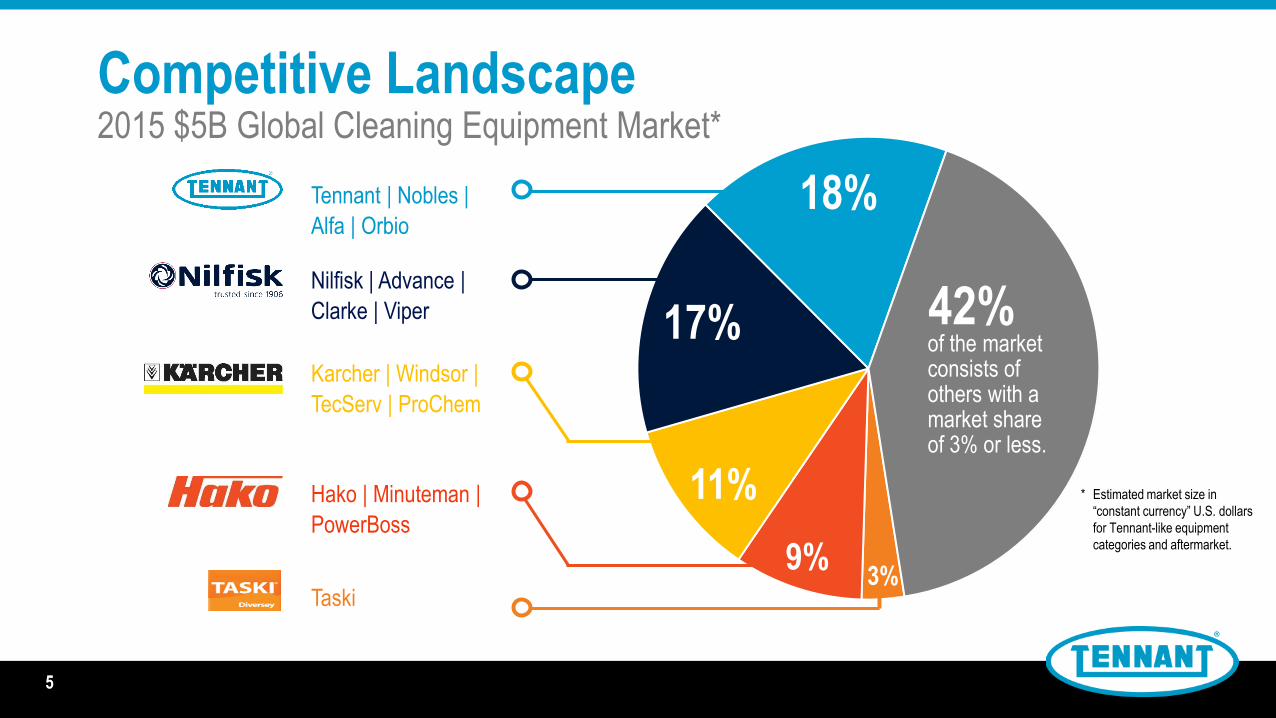
Competitive Landscape2015 $5B Global Cleaning Equipment Market*
18%Tennant | Nobles |
Alfa | Orbio
Nilfisk | Advance |
Clarke | Viper
Hako | Minuteman |
PowerBoss
Karcher | Windsor |
TecServ | ProChem
Taski
of the market consists of others with a market share of 3% or less.
17%
11%
9%3%
42%
* Estimated market size in
“constant currency” U.S. dollars
for Tennant-like equipment
categories and aftermarket.
5
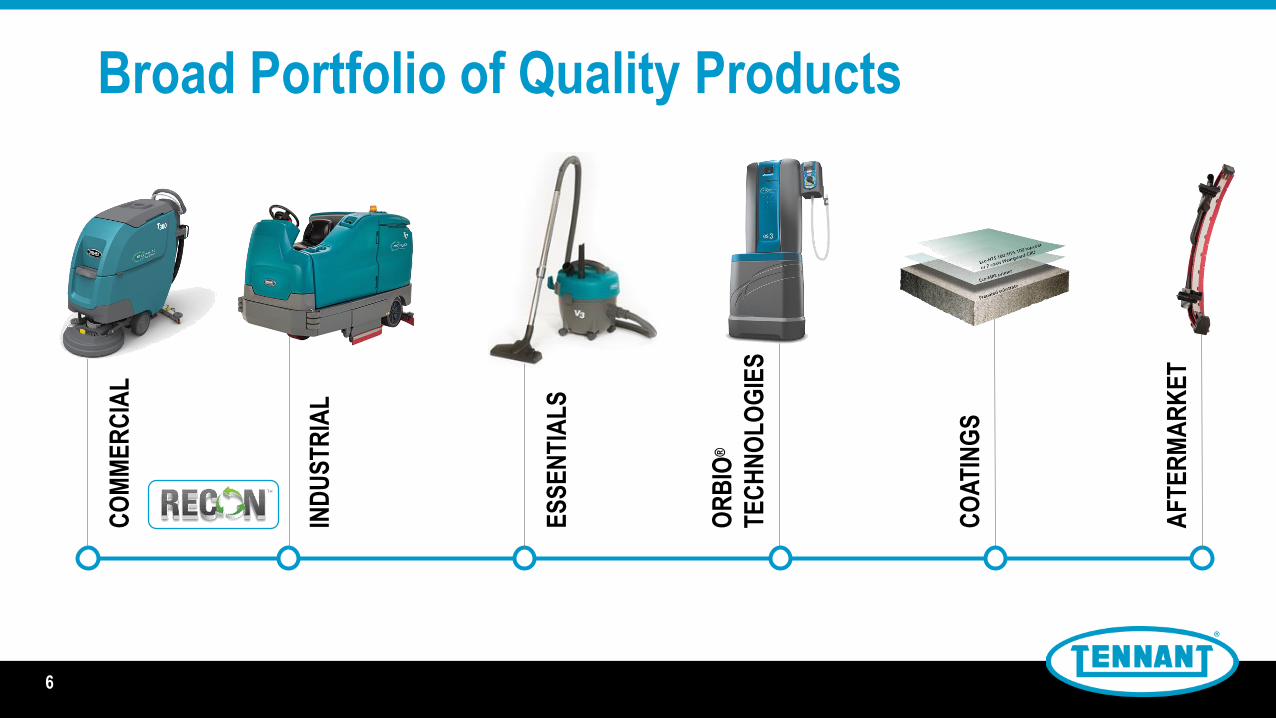
Broad Portfolio of Quality ProductsC
OM
ME
RC
IAL
IND
US
TR
IAL
AF
TE
RM
AR
KE
T
ES
SE
NT
IAL
S
OR
BIO
®
TE
CH
NO
LO
GIE
S
CO
AT
ING
S
6
STRONG DIRECT SALES& SERVICE ORGANIZATIONS
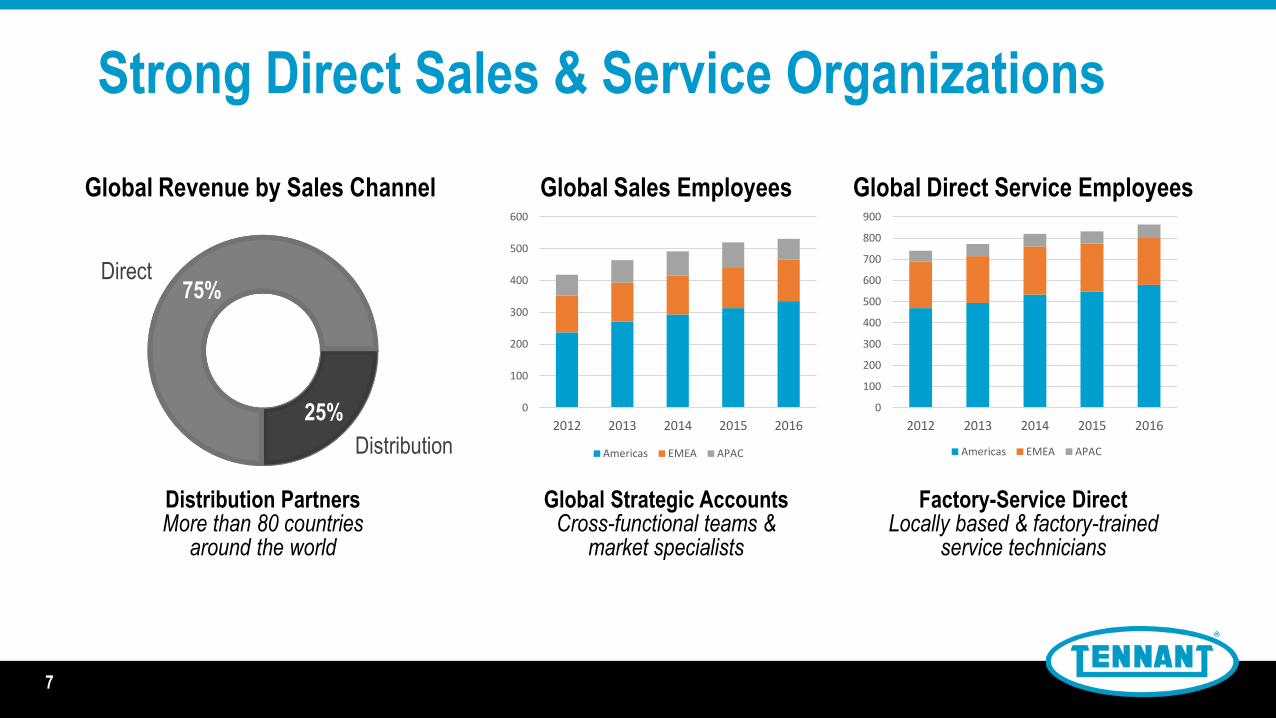
Strong Direct Sales & Service Organizations
Global Sales Employees Global Direct Service EmployeesGlobal Revenue by Sales Channel
25%
75%
Distribution
Direct
Distribution PartnersMore than 80 countries
around the world
Global Strategic AccountsCross-functional teams &
market specialists
Factory-Service DirectLocally based & factory-trained
service technicians
7
0
100
200
300
400
500
600
700
800
900
2012 2013 2014 2015 2016
Americas EMEA APAC
0
100
200
300
400
500
600
2012 2013 2014 2015 2016
Americas EMEA APAC
8
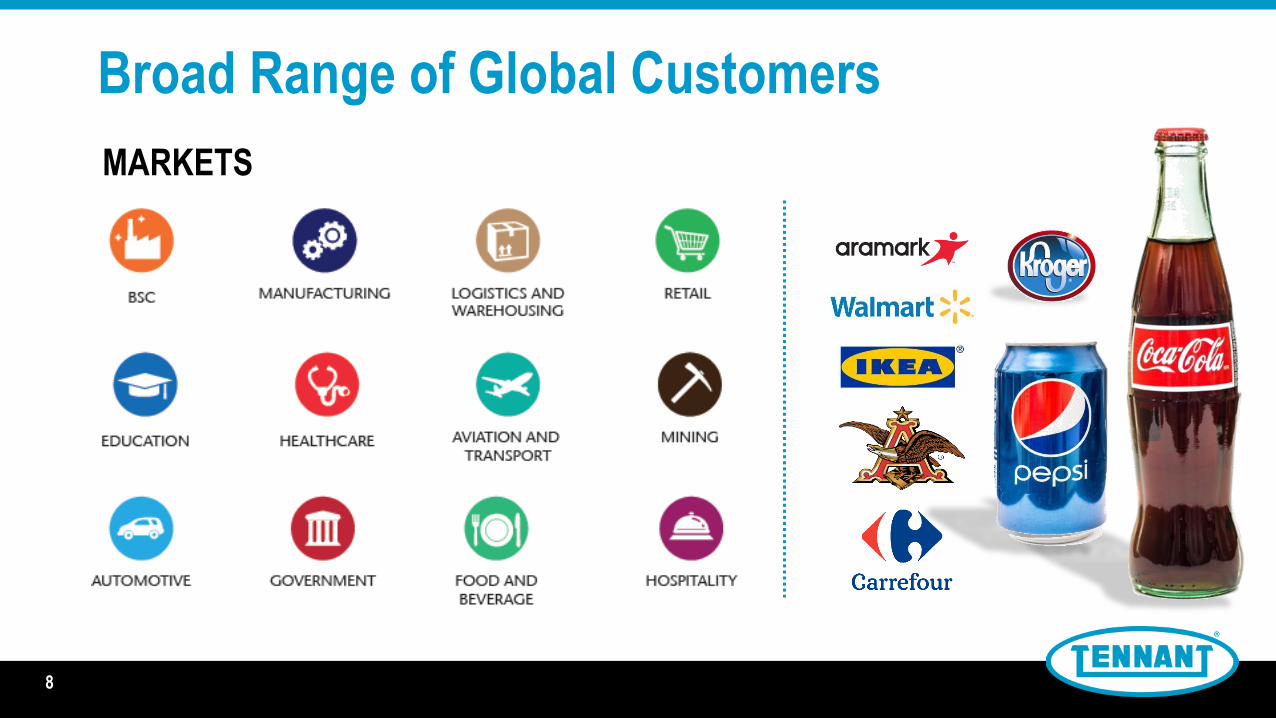
Broad Range of Global Customers
MARKETS
8
9
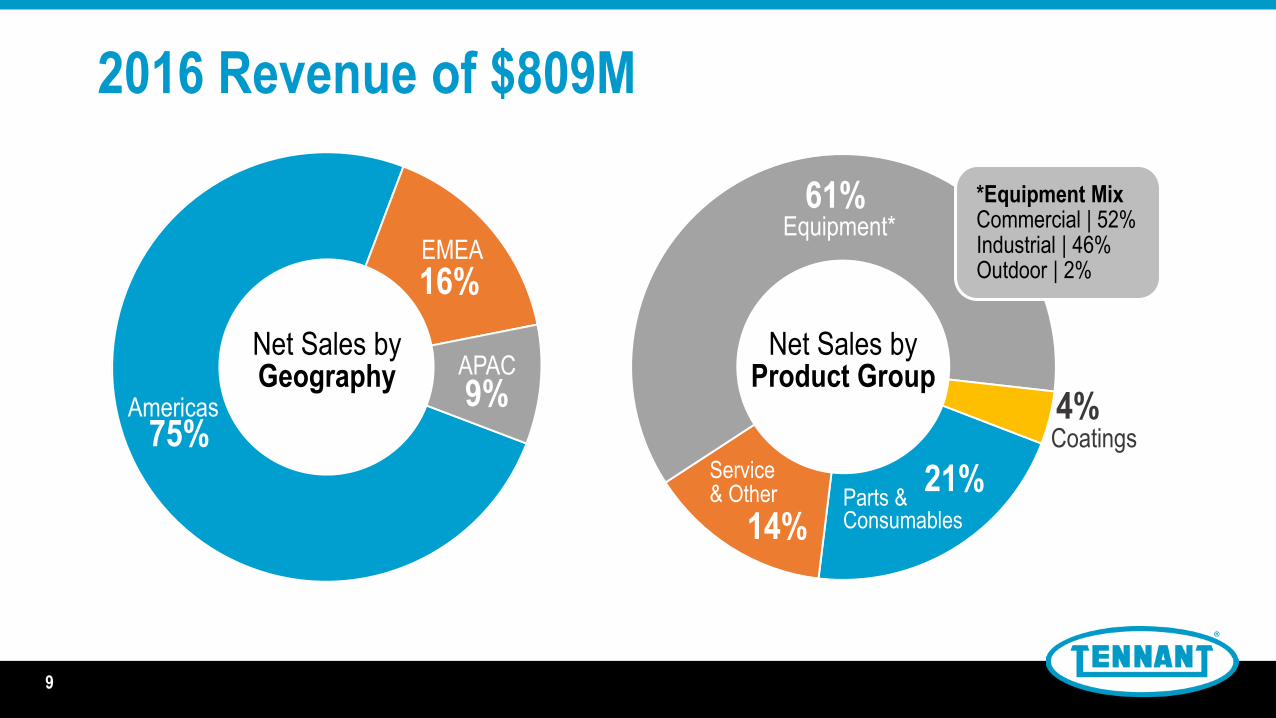
2016 Revenue of $809M
75%
16%
9%Americas
EMEA
APACNet Sales by Geography
21%
14%
61%
4%
Service & Other
Equipment*
Coatings
Net Sales by Product Group
Parts & Consumables
*Equipment MixCommercial | 52%Industrial | 46%Outdoor | 2%
9
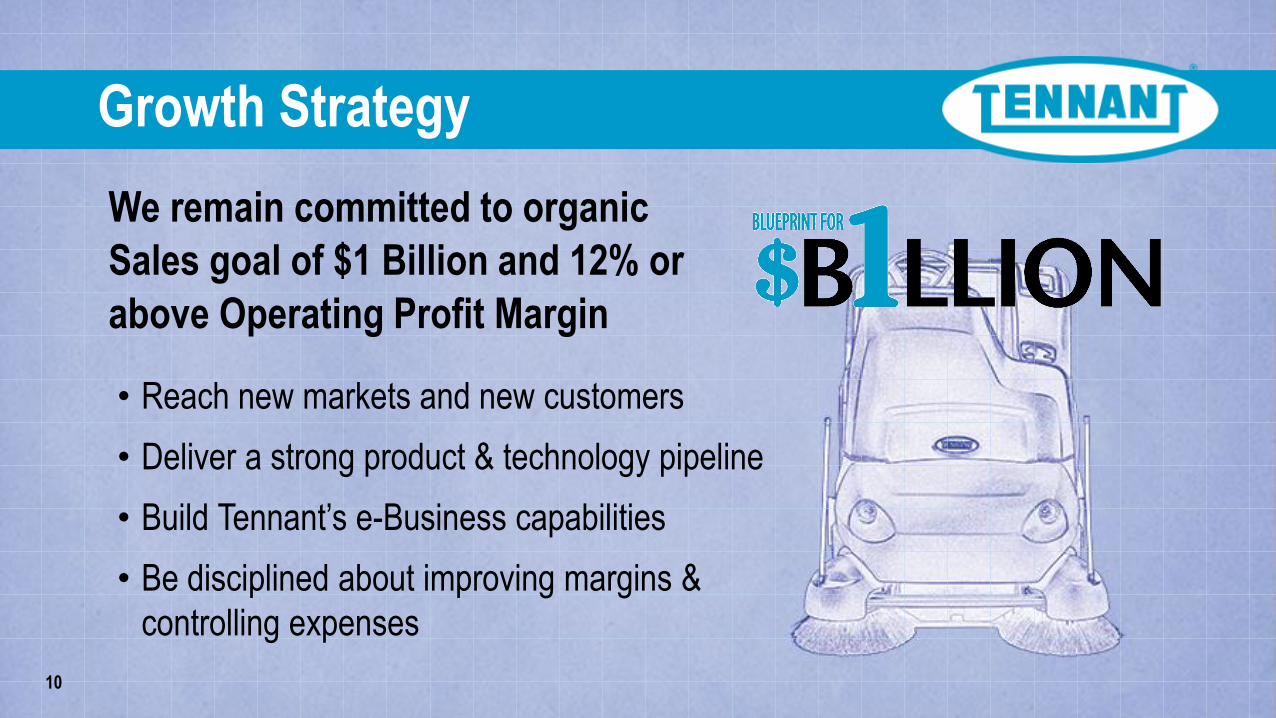
We remain committed to organic
Sales goal of $1 Billion and 12% or
above Operating Profit Margin
Growth Strategy
10
• Reach new markets and new customers
• Deliver a strong product & technology pipeline
• Build Tennant’s e-Business capabilities
• Be disciplined about improving margins &
controlling expenses
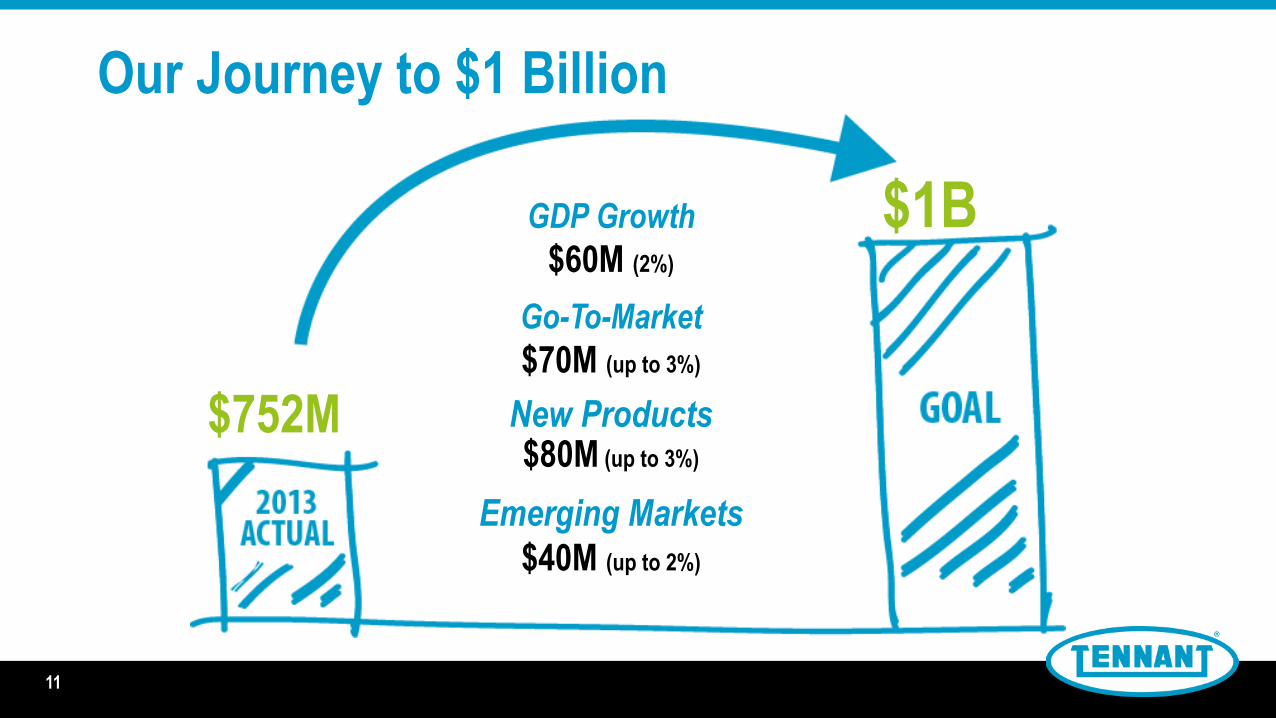
$1B
$752M
GDP Growth
$60M (2%)
Go-To-Market
$70M (up to 3%)
New Products$80M (up to 3%)
Emerging Markets
$40M (up to 2%)
11
Our Journey to $1 Billion
11
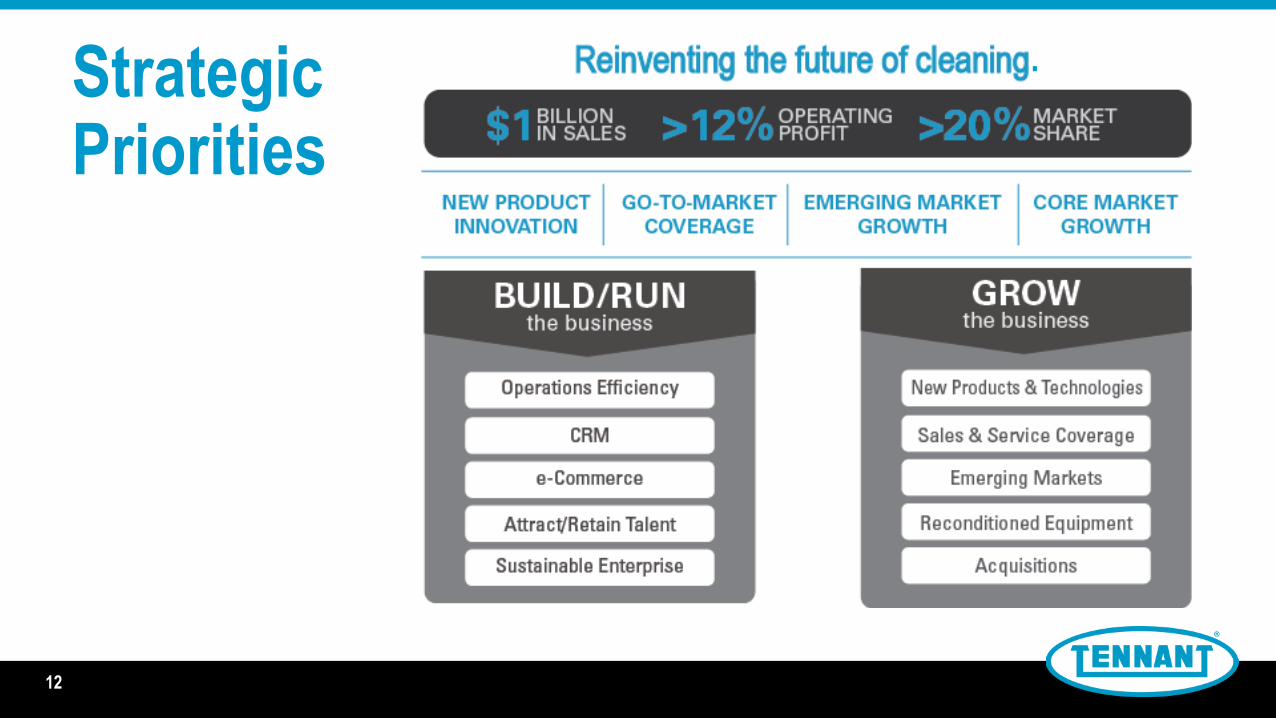
Strategic Priorities
12
.

Sales & Service CoverageIncreasing our Presence
×Education Healthcare
Industrial Retail
ENHANCEDGO-TO-MARKET STRATEGY3 COMPONENTS OF
MARKET SHARE
Product Portfolio
Market Coverage(Presence)
HitRate
VERTICAL MARKETS & MARKETING ANALYTICS
13
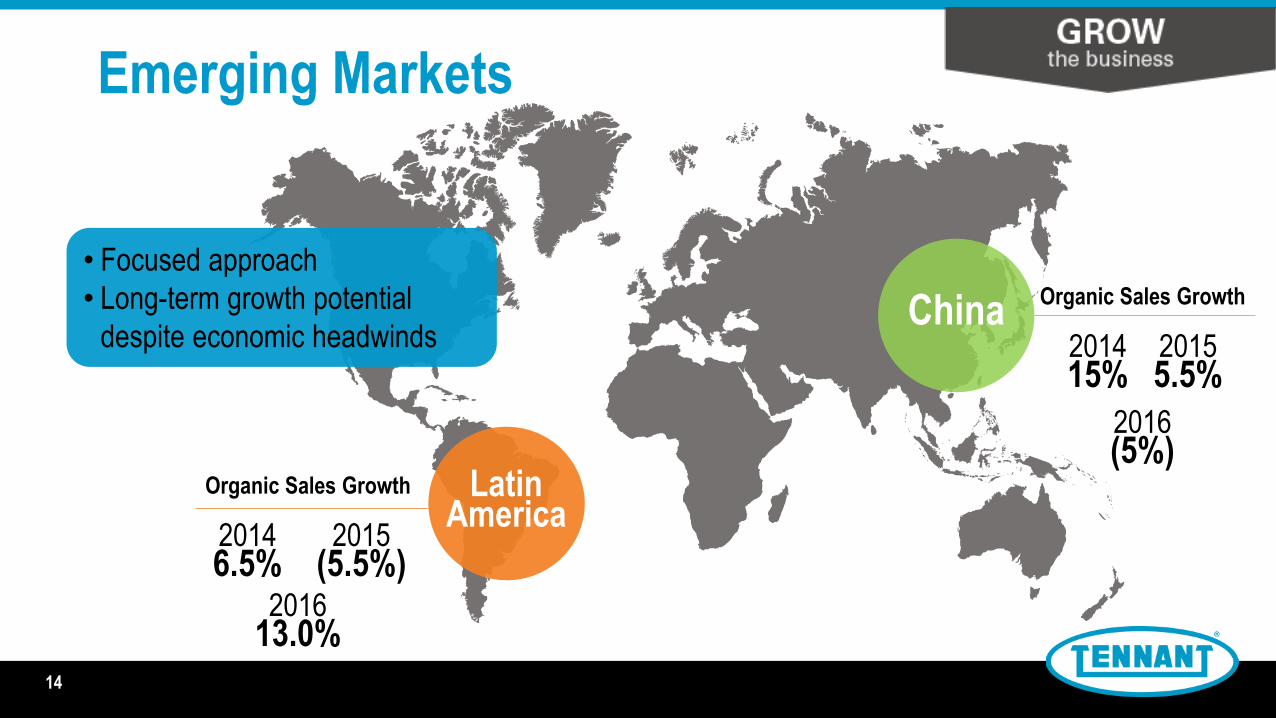
Emerging Markets
China
Latin America
• Focused approach
• Long-term growth potential
despite economic headwinds
Organic Sales Growth
14
20146.5%
2015(5.5%)
201415%
20155.5%
Organic Sales Growth
2016(5%)
201613.0%
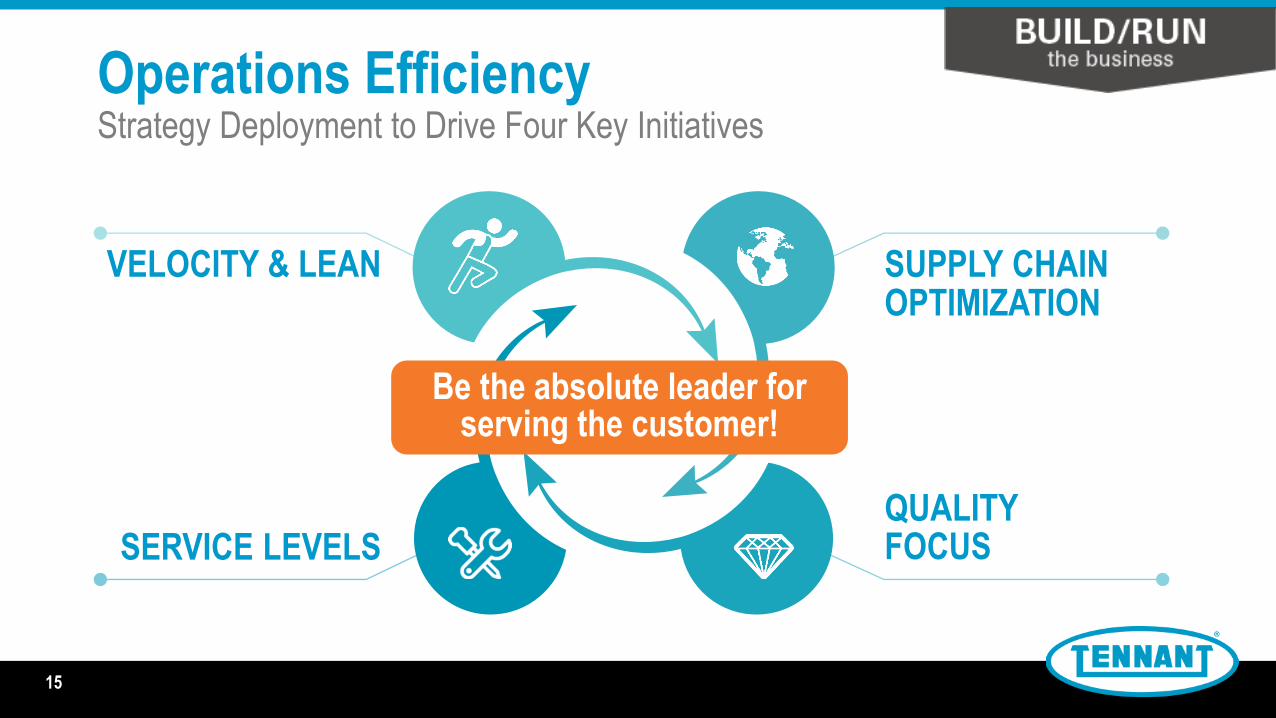
Operations EfficiencyStrategy Deployment to Drive Four Key Initiatives
VELOCITY & LEAN
Be the absolute leader for serving the customer!
SERVICE LEVELS
SUPPLY CHAIN OPTIMIZATION
QUALITY FOCUS
15
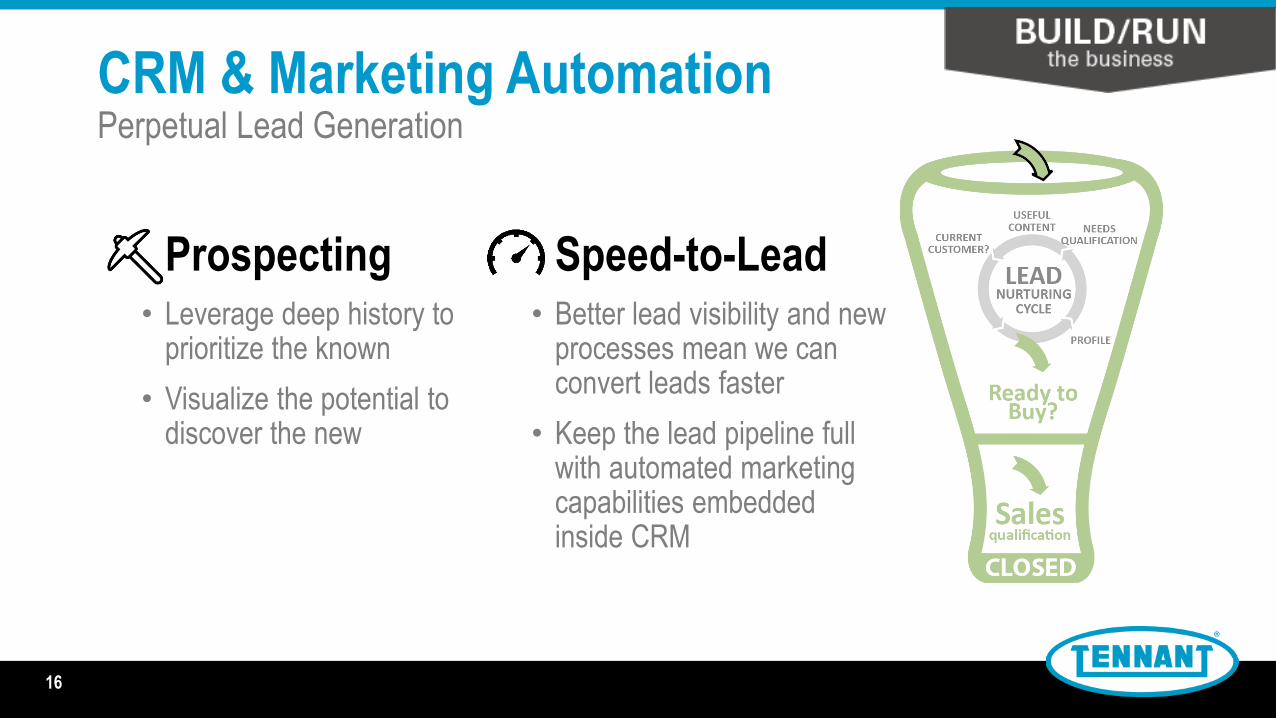
CRM & Marketing AutomationPerpetual Lead Generation
Speed-to-Lead• Better lead visibility and new
processes mean we can convert leads faster
• Keep the lead pipeline full with automated marketing capabilities embedded inside CRM
Prospecting• Leverage deep history to
prioritize the known
• Visualize the potential to discover the new
16
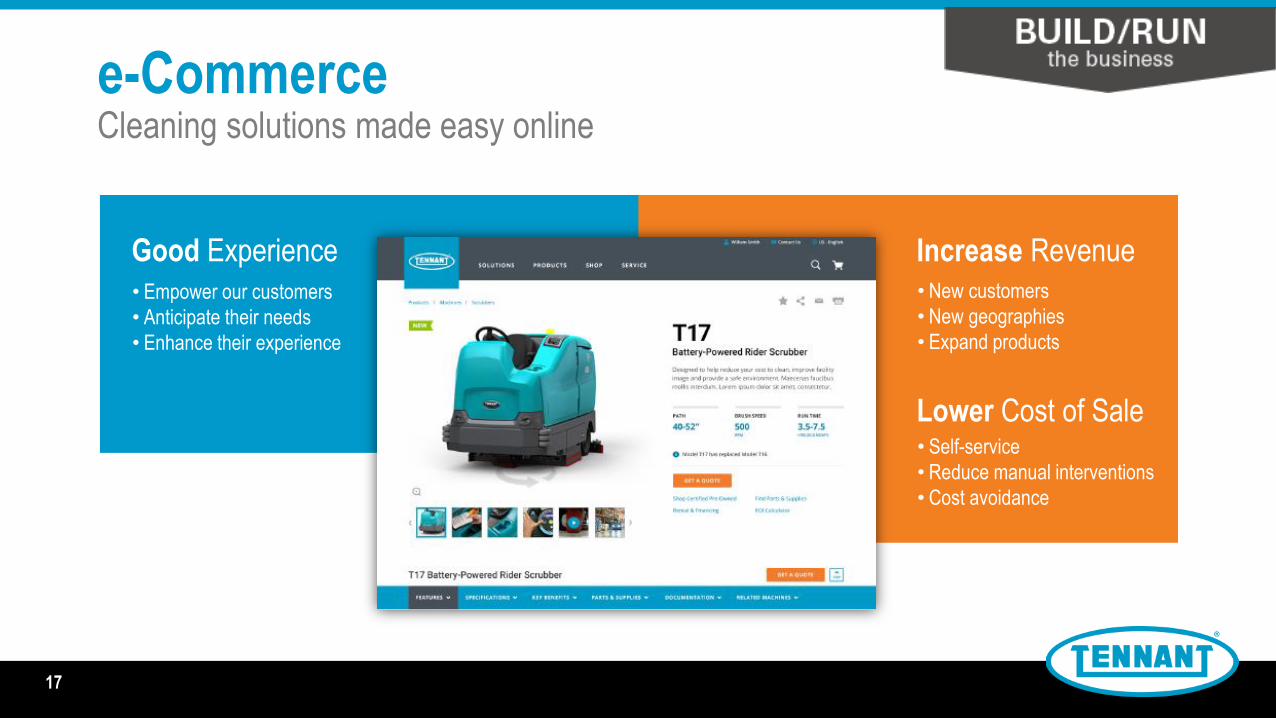
e-CommerceCleaning solutions made easy online
• Empower our customers
• Anticipate their needs
• Enhance their experience
Good Experience Increase Revenue• New customers
• New geographies
• Expand products
Lower Cost of Sale• Self-service
• Reduce manual interventions
• Cost avoidance
17

Reconditioned EquipmentAttracting a New Set of Customers
18
New Commercial Recon Facility New e-Commerce Website
18
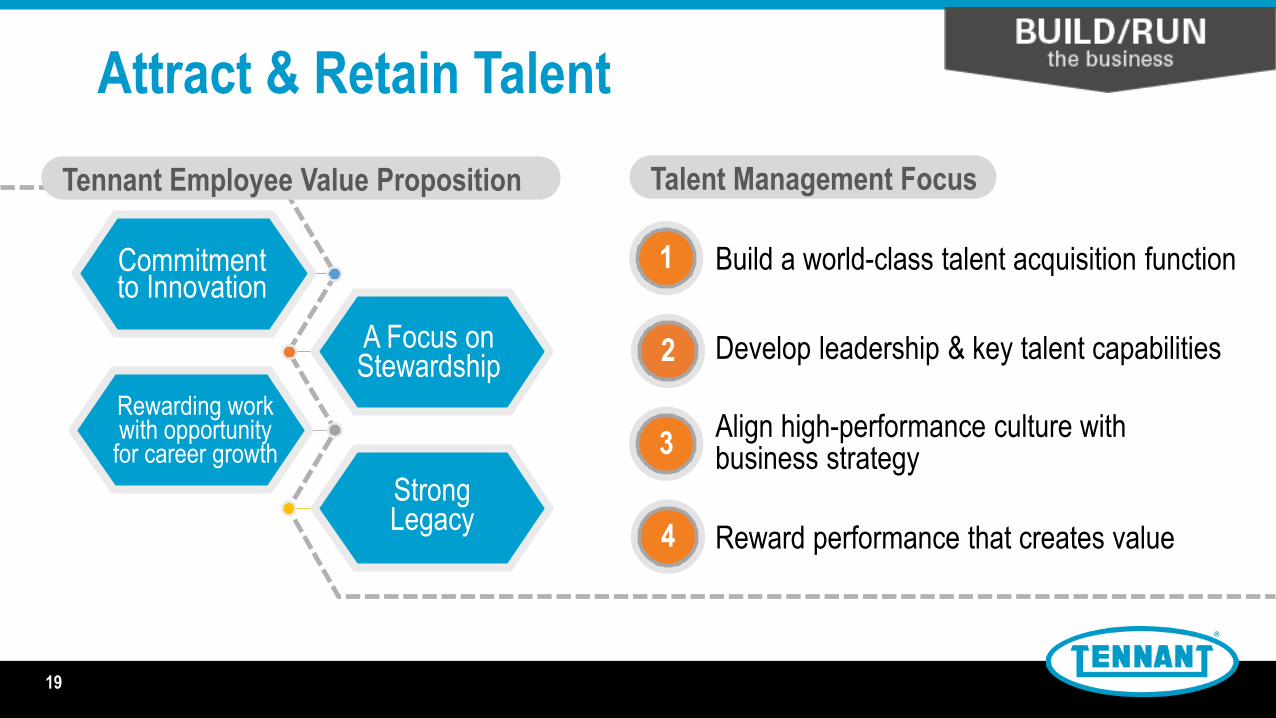
Attract & Retain Talent
Tennant Employee Value Proposition
1
2
3
Build a world-class talent acquisition function
Develop leadership & key talent capabilities
Align high-performance culture with business strategy
Talent Management Focus
A Focus on Stewardship
Strong Legacy
Rewarding work with opportunity
for career growth
4 Reward performance that creates value
Commitment to Innovation
19
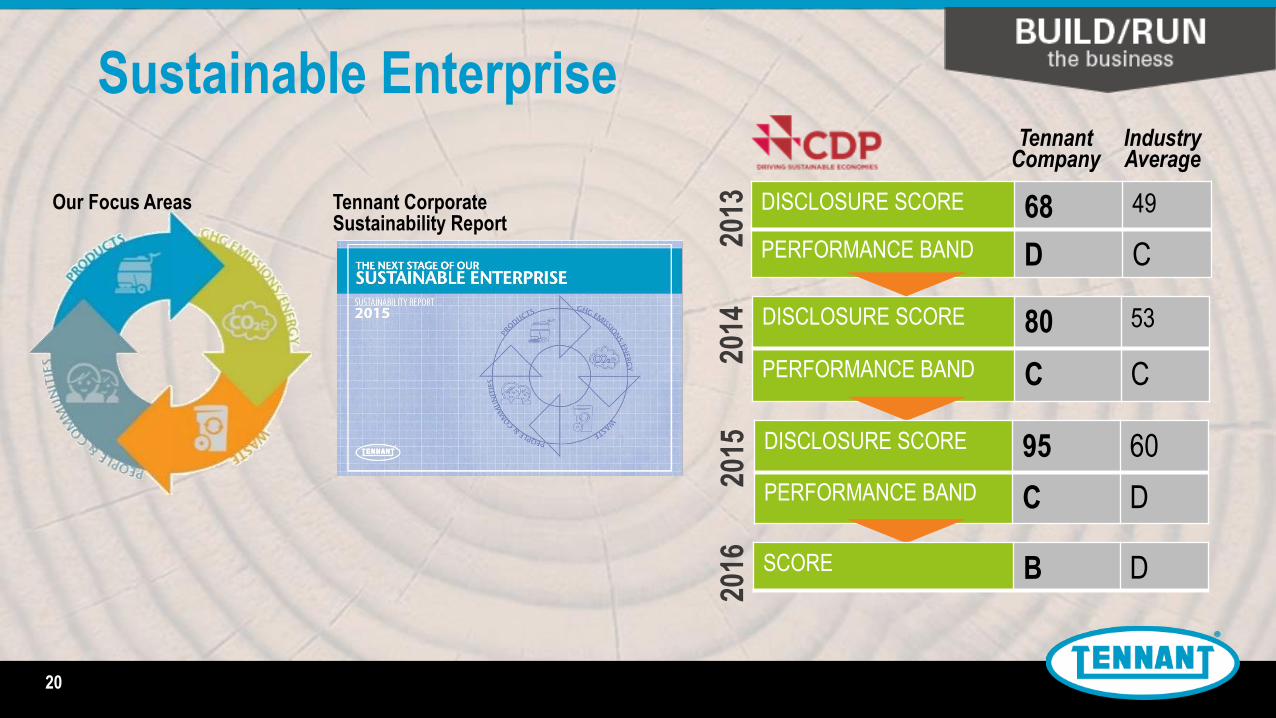
Sustainable Enterprise
20
Tennant Corporate Sustainability Report
DISCLOSURE SCORE 80 53
PERFORMANCE BAND C C
DISCLOSURE SCORE 68 49
PERFORMANCE BAND D C
2013
2014
2015 DISCLOSURE SCORE 95 60
PERFORMANCE BAND C D
2016 SCORE B D
Tennant Company
Industry Average
Our Focus Areas
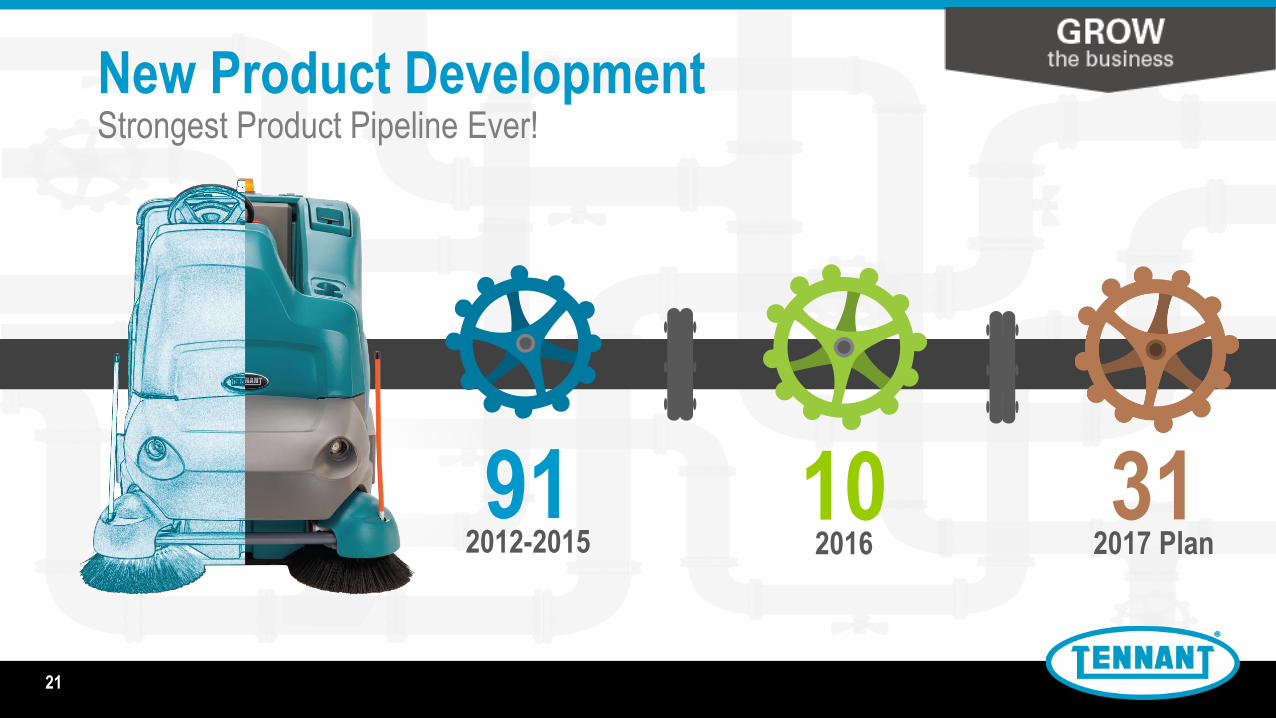
912012-2015
102016
New Product DevelopmentStrongest Product Pipeline Ever!
312017 Plan
21
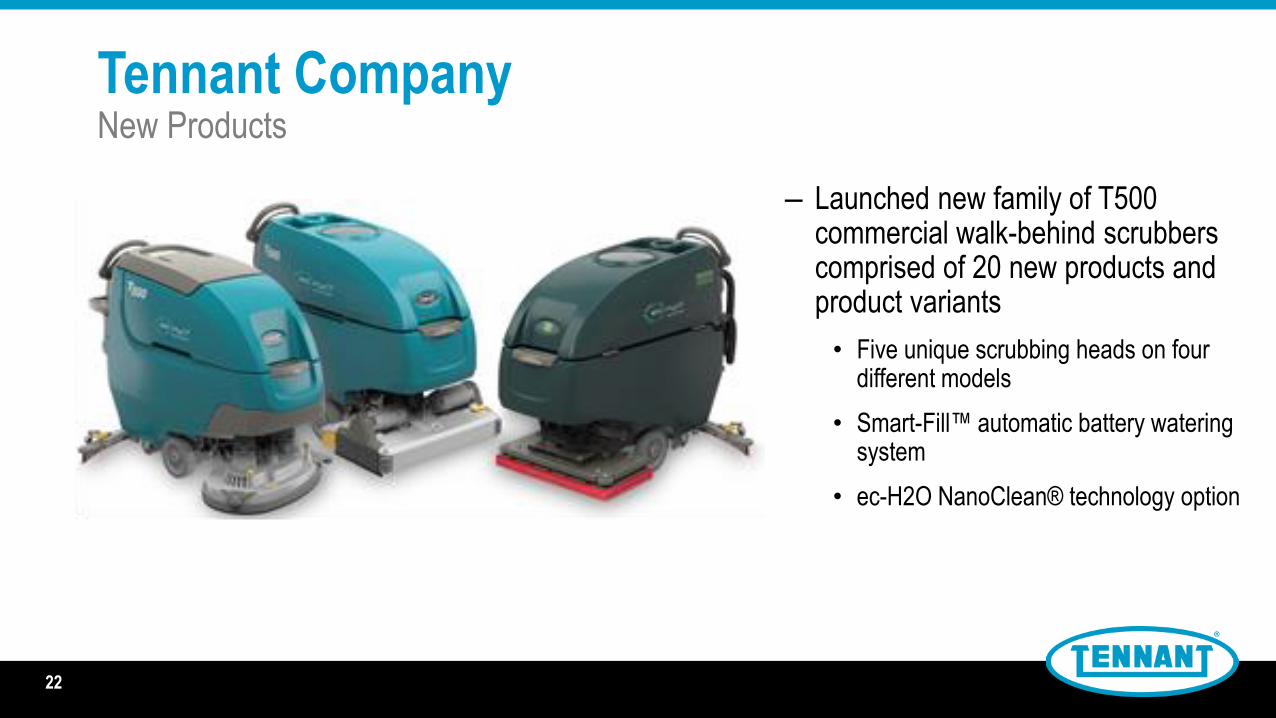
– Launched new family of T500 commercial walk-behind scrubbers comprised of 20 new products and product variants
• Five unique scrubbing heads on four different models
• Smart-Fill™ automatic battery watering system
• ec-H2O NanoClean® technology option
22
Tennant CompanyNew Products

IRIS®
Web-based Fleet Management System
23
– Launched enhanced system
• Monitor and manage machines with full visibility of user’s fleet
• Track machine productivity and maintenance needs
• Lower cost to clean
• Pro-Panel™ LCD touch screen with on-demand tutorials
• Zone Settings™ to help deliver predictable cleaning results
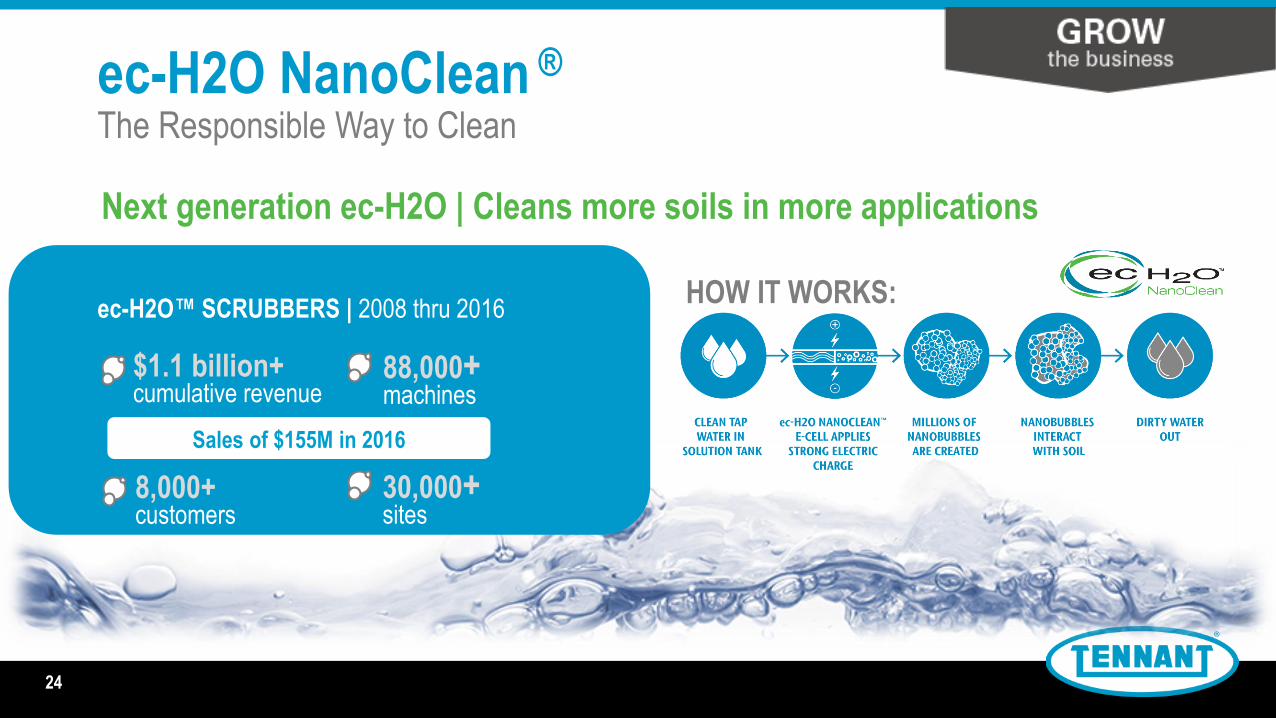
ec-H2O NanoClean ®
The Responsible Way to Clean
Next generation ec-H2O | Cleans more soils in more applications
HOW IT WORKS:ec-H2O™ SCRUBBERS | 2008 thru 2016
$1.1 billion+cumulative revenue
8,000+customers
30,000+ sites
88,000+machines
24
Sales of $155M in 2016
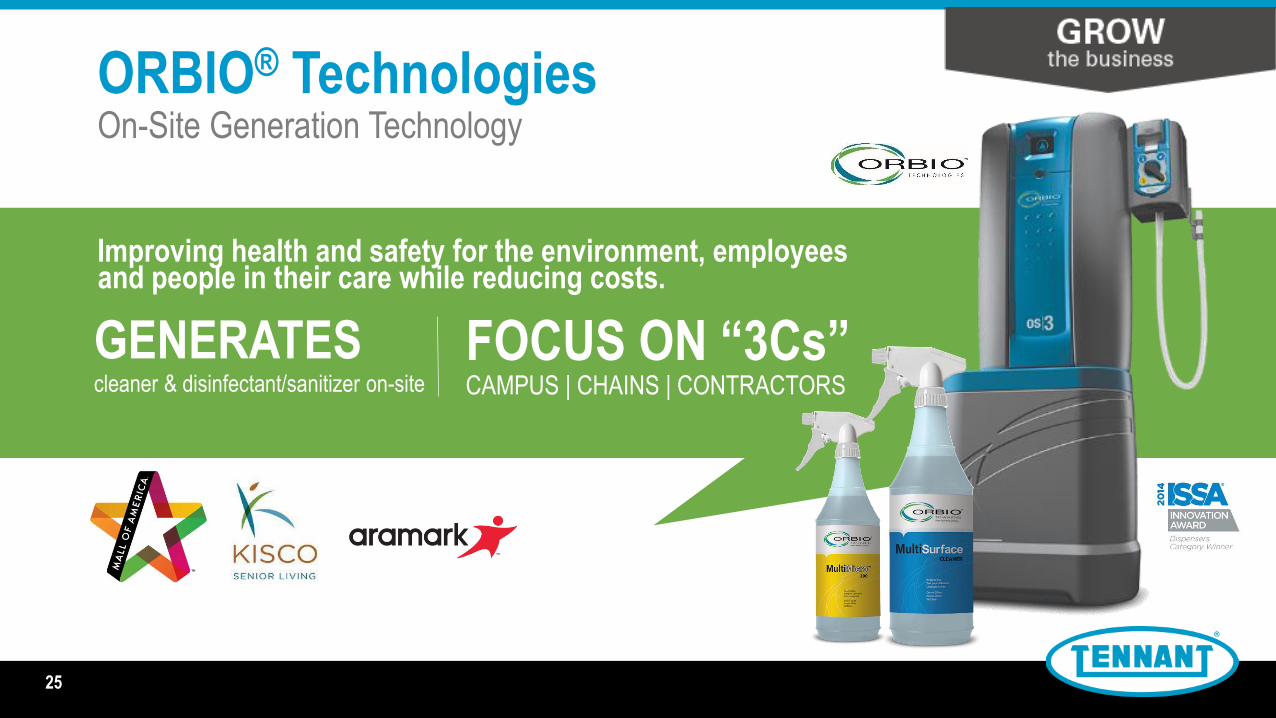
ORBIO® TechnologiesOn-Site Generation Technology
FOCUS ON “3Cs”CAMPUS | CHAINS | CONTRACTORS
Improving health and safety for the environment, employees and people in their care while reducing costs.
GENERATEScleaner & disinfectant/sanitizer on-site
25

Customer InsightsReinventing the Way the World Cleans
EMOTIONAL BENEFITS
FUNCTIONAL BENEFITS
FEATURES & BENEFITS
PRODUCTS SOLUTIONS
Traditional ApproachVoice of customer & needs
identification to shape new
product development
NEW Thinking• Acknowledge the reality of our customer’s business
• Deploy new tools for better insights
• Think solutions, not just products
• Objective research from innovation experts
• Challenge status quo – new lens for opportunities
• Embrace a holistic view of our customers
26
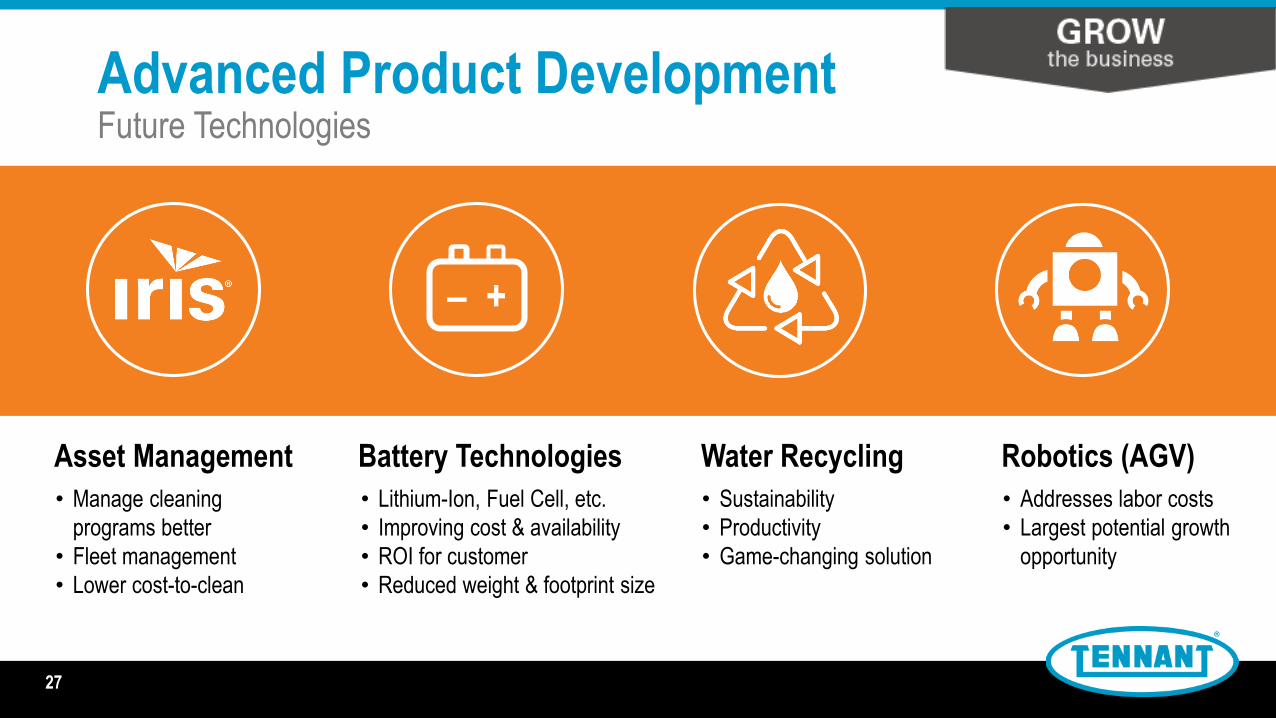
• Lithium-Ion, Fuel Cell, etc.
• Improving cost & availability
• ROI for customer
• Reduced weight & footprint size
• Sustainability
• Productivity
• Game-changing solution
– +
Water RecyclingBattery Technologies Robotics (AGV)Asset Management
• Manage cleaning
programs better
• Fleet management
• Lower cost-to-clean
• Addresses labor costs
• Largest potential growth
opportunity
Advanced Product DevelopmentFuture Technologies
27
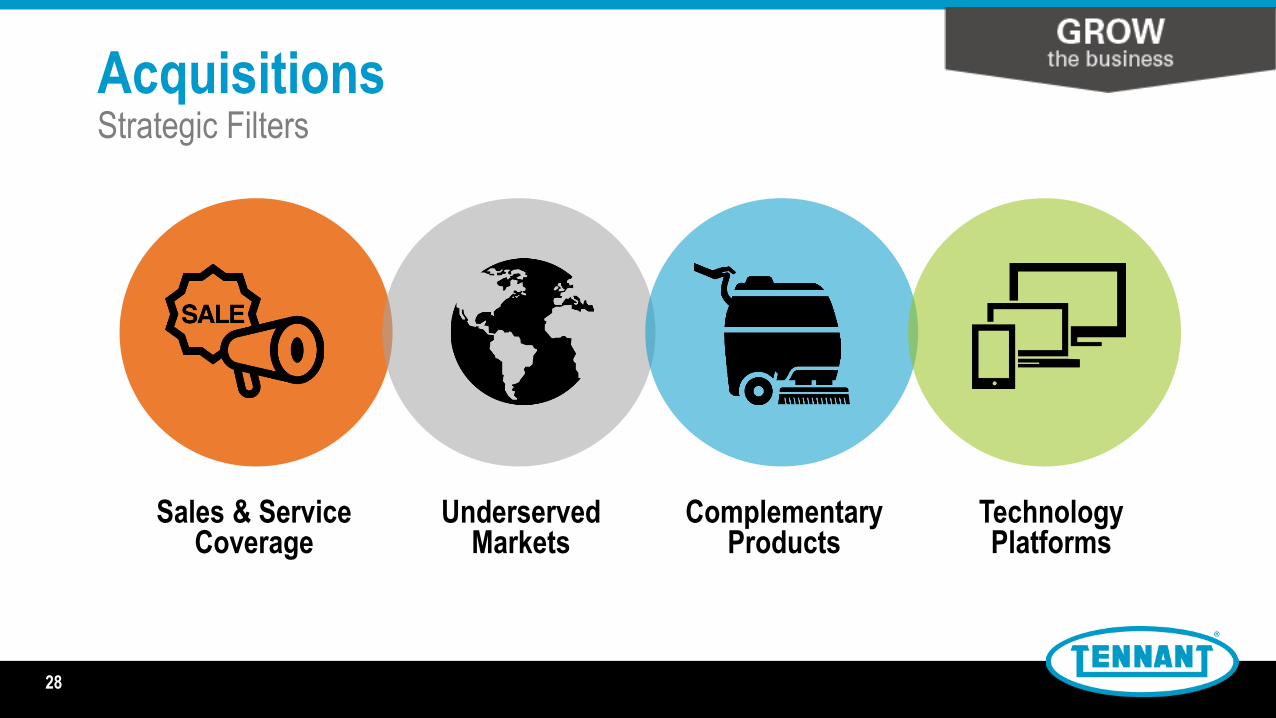
AcquisitionsStrategic Filters
Sales & Service Coverage
Technology Platforms
Complementary Products
Underserved Markets
28
• Acquired Florock® Brand
• Expanded our commercial floor coatings business
• Combination of Tennant Coatings and Florock opens new markets and strengthens value proposition
• Acquired Assets of Dofesa Barrido Mecanizado
• Long-time distributor of Tennant equipment in central Mexico
• Acquisition is a key investment for growth in Latin America
• Enhances Tennant’s sales and service capabilities
2016 Third Quarter Acquisitions
29
• Signed definitive agreement with private equity fund Ambienta
• All-cash transaction $350M or €330M
• IPC Group – privately held designer and manufacturer of innovative professional cleaning equipment, tools and other solutions, based in Italy
• IPC Group 2016 annual sales of about $203M or €192M
• Largest acquisition in Tennant Company history
• Anticipate acquisition will be accretive to 2018 full year earnings per share
Pending 2017 Acquisition of IPC Group
30
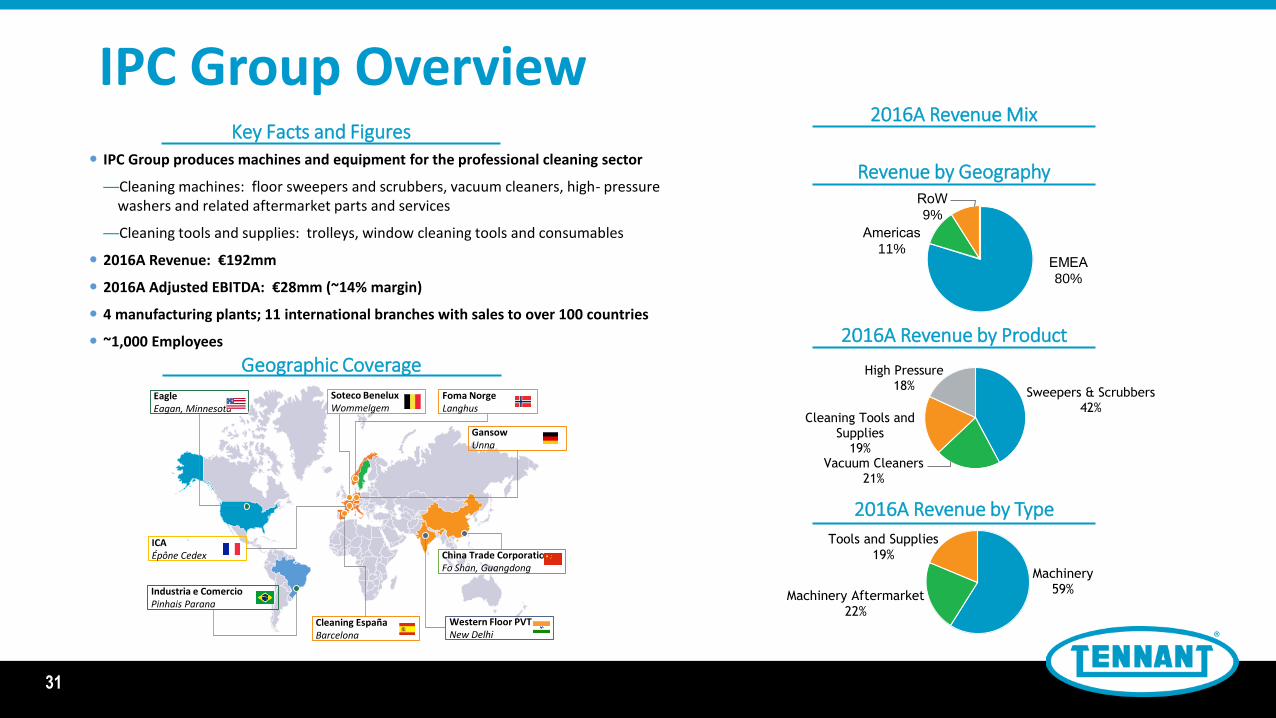
IPC Group Overview
Revenue by Geography
Key Facts and Figures
Geographic Coverage
IPC Group produces machines and equipment for the professional cleaning sector
—Cleaning machines: floor sweepers and scrubbers, vacuum cleaners, high- pressure washers and related aftermarket parts and services
—Cleaning tools and supplies: trolleys, window cleaning tools and consumables
2016A Revenue: €192mm
2016A Adjusted EBITDA: €28mm (~14% margin)
4 manufacturing plants; 11 international branches with sales to over 100 countries
~1,000 Employees
EagleEagan, Minnesota
Industria e ComercioPinhais Parana
Cleaning EspañaBarcelona
ICAÉpône Cedex
Soteco BeneluxWommelgem
GansowUnna
Foma NorgeLanghus
China Trade CorporationFo Shan, Guangdong
Western Floor PVTNew Delhi
2016A Revenue Mix
2016A Revenue by Product
2016A Revenue by Type
Sweepers & Scrubbers42%
Vacuum Cleaners21%
Cleaning Tools and Supplies
19%
High Pressure18%
Machinery59%
Machinery Aftermarket22%
Tools and Supplies19%
EMEA
80%
Americas
11%
RoW
9%
31
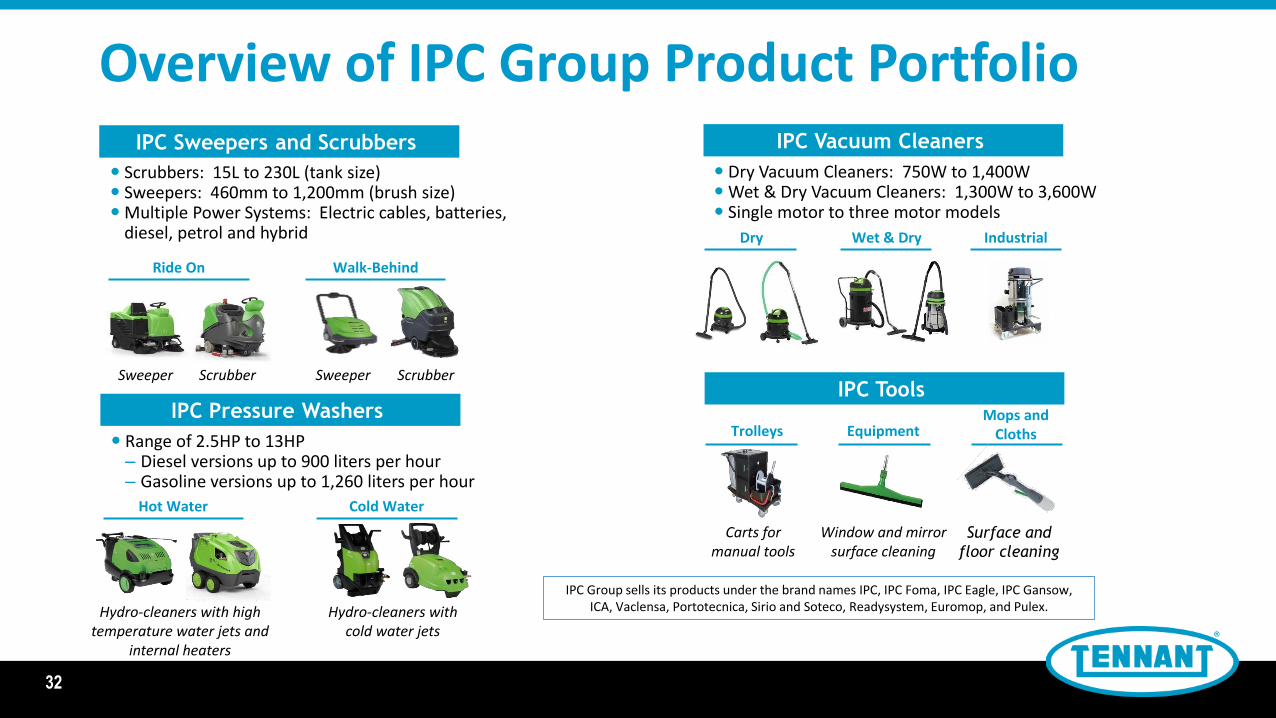
Overview of IPC Group Product Portfolio
Equipment
IPC Sweepers and Scrubbers
IPC Pressure Washers
IPC Vacuum Cleaners
IPC Tools
Ride On Walk-Behind
ScrubberSweeperScrubberSweeper
Dry Wet & Dry Industrial
Hot Water Cold Water
Hydro-cleaners with high temperature water jets and
internal heaters
Hydro-cleaners with cold water jets
TrolleysMops and
Cloths
Carts formanual tools
Window and mirrorsurface cleaning
Surface and
floor cleaning
Dry Vacuum Cleaners: 750W to 1,400W Wet & Dry Vacuum Cleaners: 1,300W to 3,600W Single motor to three motor models
Scrubbers: 15L to 230L (tank size) Sweepers: 460mm to 1,200mm (brush size) Multiple Power Systems: Electric cables, batteries,
diesel, petrol and hybrid
Range of 2.5HP to 13HP– Diesel versions up to 900 liters per hour– Gasoline versions up to 1,260 liters per hour
IPC Group sells its products under the brand names IPC, IPC Foma, IPC Eagle, IPC Gansow, ICA, Vaclensa, Portotecnica, Sirio and Soteco, Readysystem, Euromop, and Pulex.
32
FINANCIALSummary
Reinventing the future of cleaning.
33

34
Q4’16
SALES
GROSS MARGIN
R&D EXPENSE (% of sales)
Adjusted*S&A EXPENSE (% of sales)
Adjusted*
OPERATING PROFITAdjusted*
OPERATING PROFIT MARGINAdjusted*DILUTED EPS
Q4’15 CHANGE
$211.7 M
44.2%
4.7%
28.8%
$22.6 M
10.7%
$0.85
$205.9 M
42.4%
3.9%
28.9%
$19.7 M
9.6%
$0.78
+2.9%
+180 bps
+80 bps
(10 bps)
+14.5%
$110 bps
+9.0%
*Q4’15 results are adjusted to exclude restructuring charge in S&A of $2.0M pre-tax ($0.09 loss per diluted share) and asset impairment favorable tax true-up of $0.7M ($0.04 per diluted share).
2016 Fourth QuarterOrganic Sales Growth 3.2% | Organic Sales up 4.8% in Americas, up 3.7% in EMEA
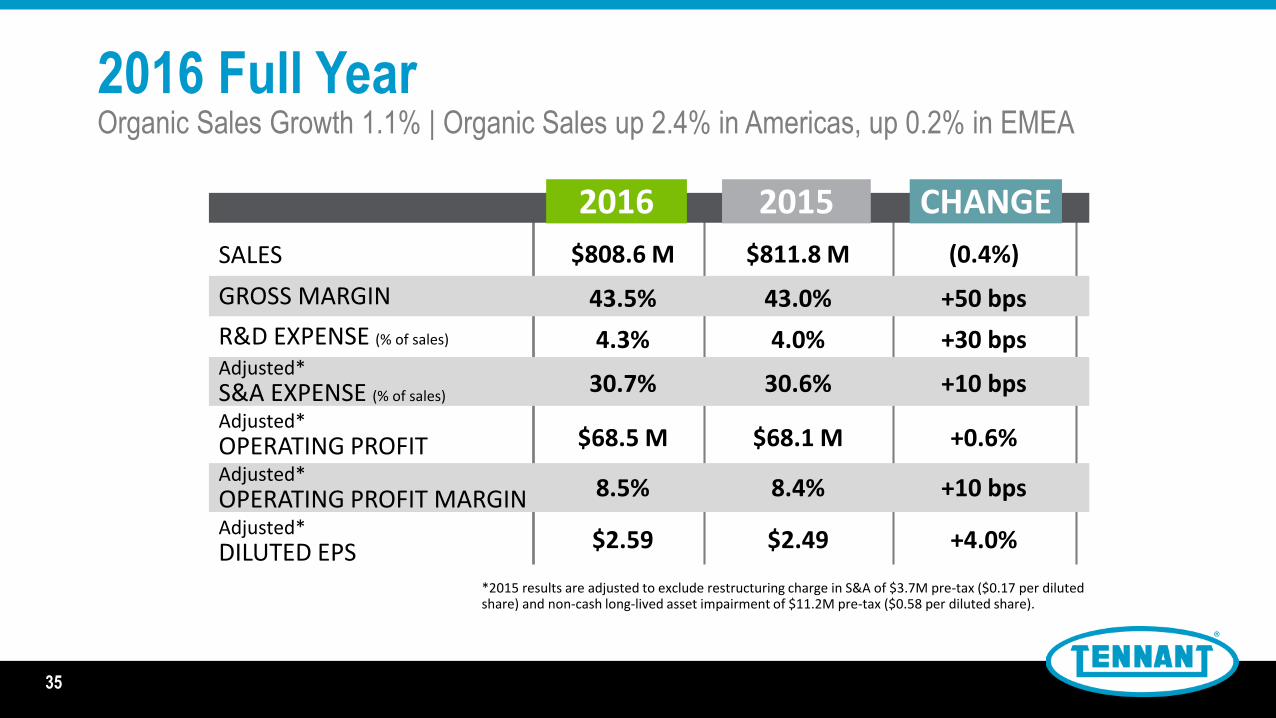
2016
SALES
GROSS MARGIN
R&D EXPENSE (% of sales)
Adjusted*S&A EXPENSE (% of sales)
Adjusted*
OPERATING PROFITAdjusted*
OPERATING PROFIT MARGINAdjusted*DILUTED EPS
2015 CHANGE
$808.6 M
43.5%
4.3%
30.7%
$68.5 M
8.5%
$2.59
$811.8 M
43.0%
4.0%
30.6%
$68.1 M
8.4%
$2.49
(0.4%)
+50 bps
+30 bps
+10 bps
+0.6%
+10 bps
+4.0%
*2015 results are adjusted to exclude restructuring charge in S&A of $3.7M pre-tax ($0.17 per diluted share) and non-cash long-lived asset impairment of $11.2M pre-tax ($0.58 per diluted share).
2016 Full YearOrganic Sales Growth 1.1% | Organic Sales up 2.4% in Americas, up 0.2% in EMEA
35
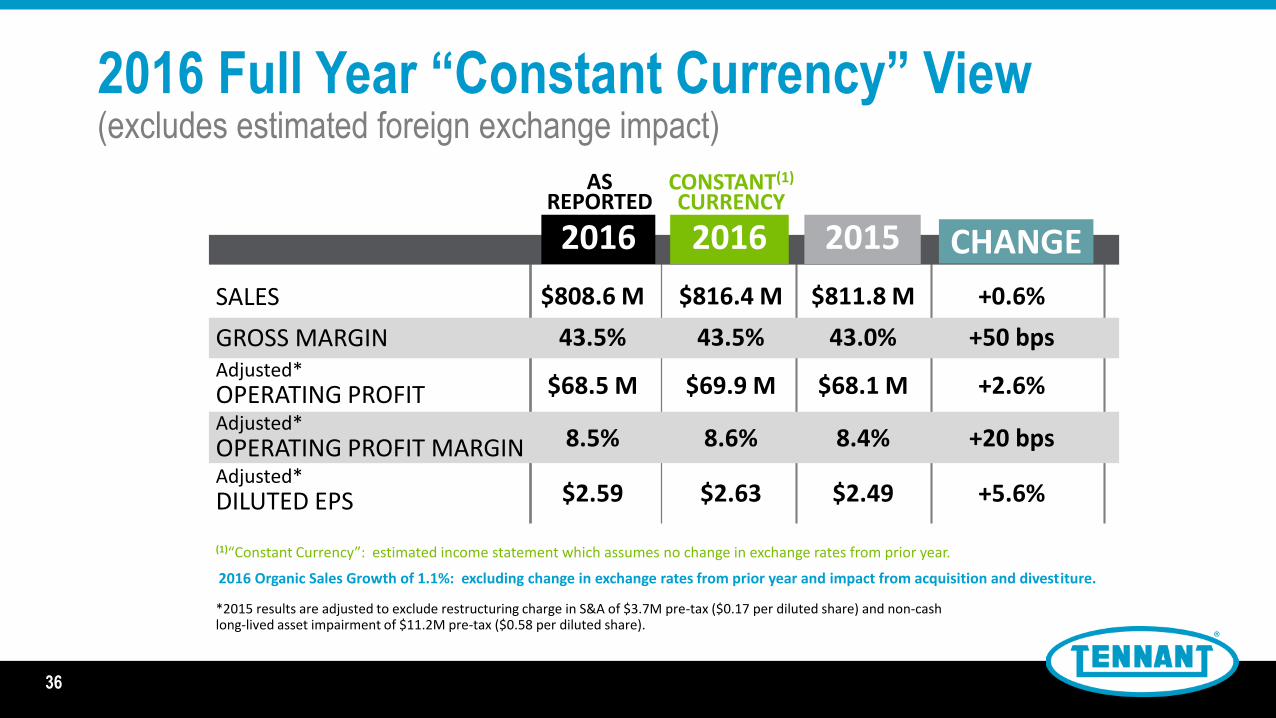
SALES
GROSS MARGINAdjusted*OPERATING PROFITAdjusted*
OPERATING PROFIT MARGINAdjusted*
DILUTED EPS
2016 2015 CHANGE
CONSTANT(1)
CURRENCY
2016
AS REPORTED
(1)“Constant Currency”: estimated income statement which assumes no change in exchange rates from prior year.
*2015 results are adjusted to exclude restructuring charge in S&A of $3.7M pre-tax ($0.17 per diluted share) and non-cash long-lived asset impairment of $11.2M pre-tax ($0.58 per diluted share).
$816.4 M
43.5%
$69.9 M
8.6%
$2.63
$811.8 M
43.0%
$68.1 M
8.4%
$2.49
+0.6%
+50 bps
+2.6%
+20 bps
+5.6%
$808.6 M
43.5%
$68.5 M
8.5%
$2.59
2016 Full Year “Constant Currency” View(excludes estimated foreign exchange impact)
36
2016 Organic Sales Growth of 1.1%: excluding change in exchange rates from prior year and impact from acquisition and divestiture.
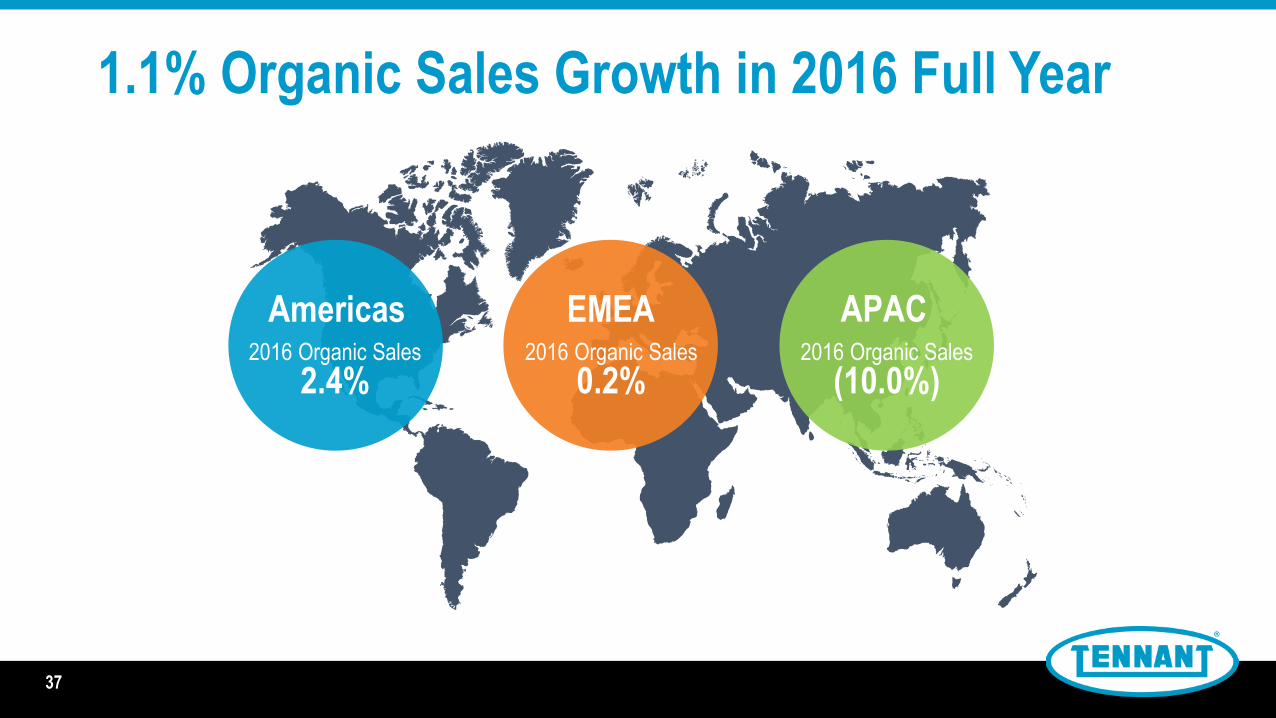
1.1% Organic Sales Growth in 2016 Full Year
APACEMEAAmericas2016 Organic Sales
2.4%2016 Organic Sales
0.2%2016 Organic Sales
(10.0%)
37

38
TENNANT COMPANY
Strong Balance Sheet

39
History of Sales Growth2010-2016 Average Organic Sales Growth of 6%
39
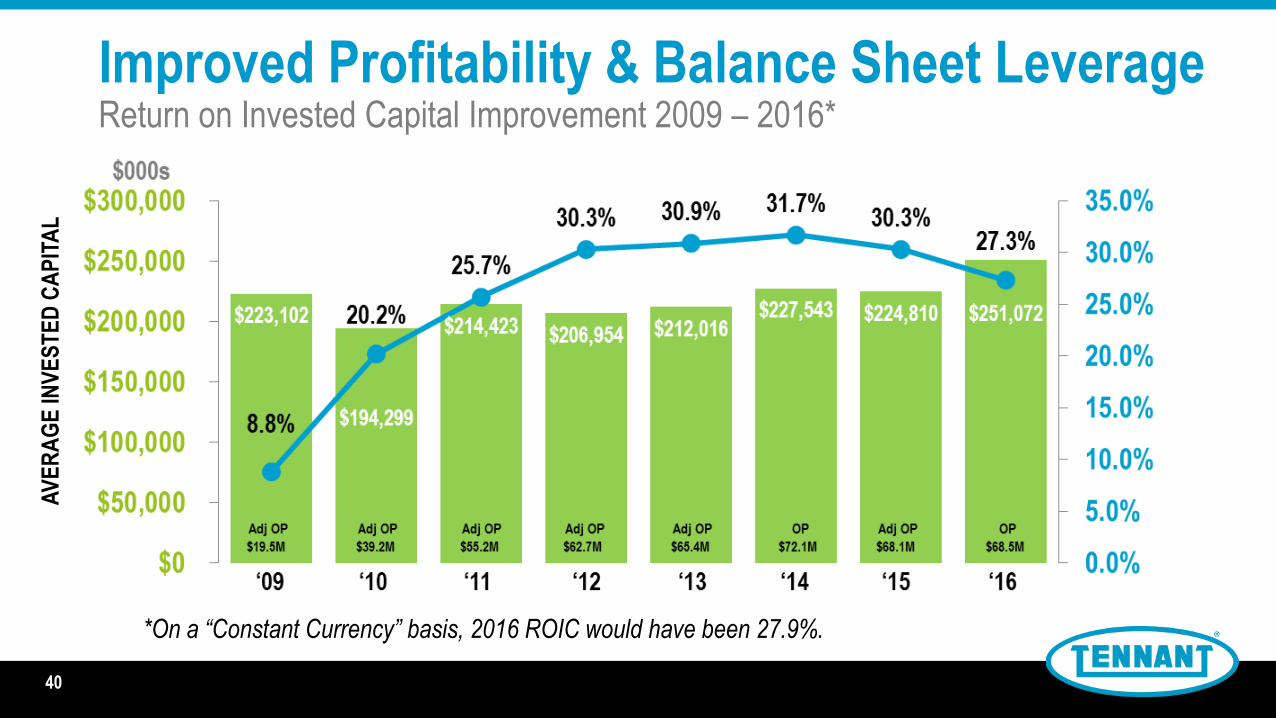
40
Improved Profitability & Balance Sheet LeverageReturn on Invested Capital Improvement 2009 – 2016*
*On a “Constant Currency” basis, 2016 ROIC would have been 27.9%.
40
AV
ER
AG
E IN
VE
ST
ED
CA
PIT
AL

Operating Profit Margin Goal
Drive organic revenue growth in mid- to high-
single digits
41
Remain committed to at least 12% OP Margin
Hold fixed costs essentially flat in
manufacturing as volume rises
Strive for zero net inflation
at gross profit line
Standardize & simplify
processes to improve
scalability of business model
Continue to invest in
innovative new products
& technologies
S, G & A Expense
27-28%
R&D
3-4%
Gross Margins
43-44%
Sales Growth
5-9%

2017 EPS & Sales Guidance
42
2016ACTUAL
As Reported$2.59 EPS
$808.6M SALES
2017 Financial OutlookAs Adjusted “Constant Currency” $2.60 to $2.80/$817M to $832M
As Reported $2.20 to $2.43/$810M to $830M
KEY EXPECTATIONS FOR 2017 (does not yet include the impact of the IPC Group acquisition)
• Net sales in the range of $810M to $830M versus $808.6M in 2016.• Stable economy in North America, modest improvement in Europe, and challenging environment in
APAC.• Unfavorable foreign currency impact on sales in the range of 1% to 2%.• Sales increase from 2016 Florock acquisition of approximately 0.8%.• Organic sales growth, excluding foreign currency exchange impact and acquisition, in the range of
1% to 3%.• Foreign currency exchange headwinds estimated to negatively impact operating profit by
approximately $2.5M, or approximately $0.10 EPS.• Restructuring Actions in 1Q17 in the range of $7M to $8M pre-tax, or $0.27 to $0.30 EPS.• Gross margin performance in the range of 43% to 44%. • R&D expense of approximately 4% of sales.• Effective tax rate of approximately 31%.• Capital expenditures in the range of $20M to $25M.
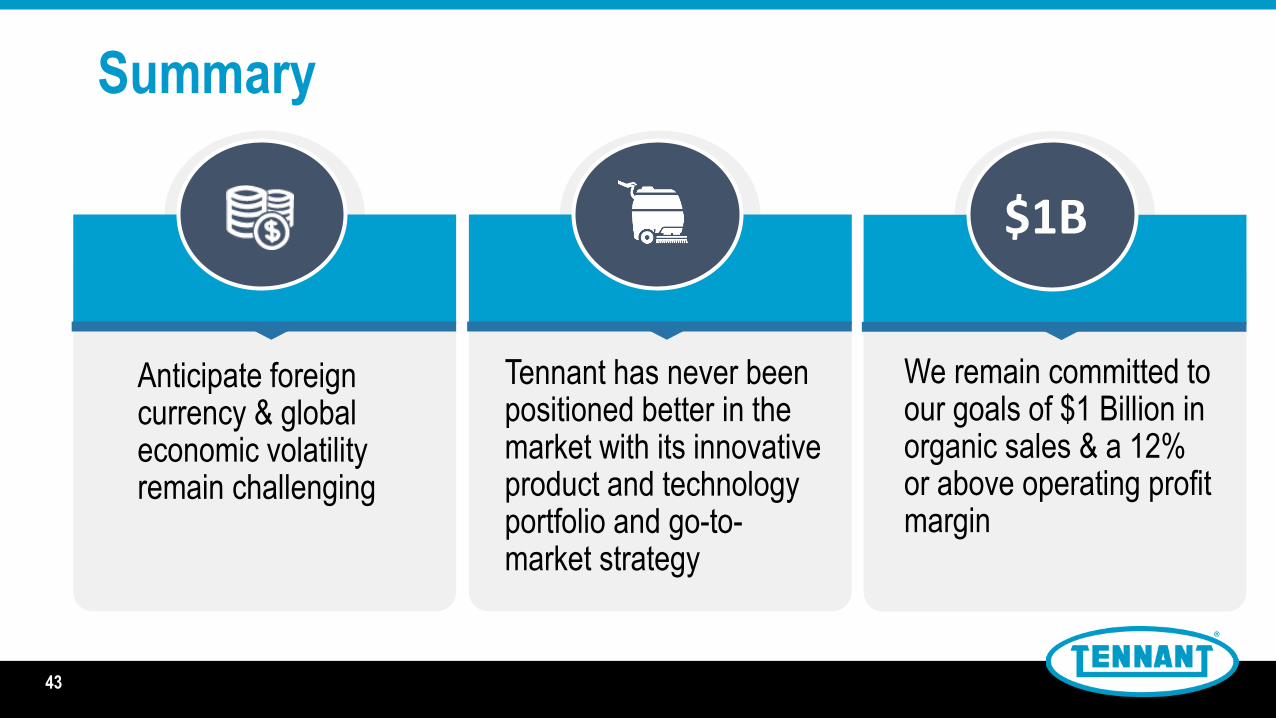
Summary
43
Anticipate foreign currency & global economic volatility remain challenging
Tennant has never been positioned better in the market with its innovative product and technology portfolio and go-to-market strategy
We remain committed to our goals of $1 Billion in organic sales & a 12% or above operating profit margin
$1B