Investor Presentation...Investor Presentation May 2020 2 Disclaimer The information contained herein...
48
Investor Presentation May 2020
Transcript of Investor Presentation...Investor Presentation May 2020 2 Disclaimer The information contained herein...

Investor PresentationMay 2020

2
Disclaimer
The information contained herein has been prepared by First Abu Dhabi Bank P.J.S.C (“FAB”). FAB relies on information obtained from sources
believed to be reliable but does not guarantee its accuracy or completeness.
This presentation has been prepared for information purposes only and is not and does not form part of any offer for sale or solicitation of any offer
to subscribe for or purchase or sell any securities nor shall it or any part of it form the basis of or be relied on in connection with any contract or
commitment whatsoever.
Some of the information in this presentation may contain projections or other forward-looking statements regarding future events or the future
financial performance of FAB. These forward-looking statements include all matters that are not historical facts. The inclusion of such forward-
looking information shall not be regarded as a representation by FAB or any other person that the objectives or plans of FAB will be achieved. FAB
undertakes no obligation to publicly update or publicly revise any forward-looking statement, whether as a result of new information, future events
or otherwise.
Please note that rounding differences may appear throughout the presentation.
Comparative figures have been reclassified where appropriate to conform to the presentation and accounting
policies adopted in the consolidated financial statements.

Economic and banking sector review

A cosmopolitan country~10.4Mn people (2018e)1
Expatriates ~85%
2nd largest economy in GCC(30th largest in the world)
USD 414Bn 2018e Nominal GDP1
USD 39,709 GDP per capita
6th largest proven oil reserves
~98Bn boe (~8% of global oil reserves)2
~3.0Mn barrels/day (2018 crude oil production)
One of the highest rated sovereigns
Aa2 (Moody’s)
GDP growth expectations
Diversified & competitiveeconomy
4
UAE economic overview
1 IMF World Economic Outlook - October 2019 3 IMF World Economic Outlook – April 2020 5 Federal Competitiveness and Statistics Authority, 2018 Nominal GDP
UAE
74%non-oil sectorcontribution
to nominal GDP5
16th
ease of doing business rankings,
11th in 20196
UAE federation established in 1971 comprising 7 EmiratesOne of the 6 GCC (Gulf Cooperation Council) states
2 OPEC Annual Statistical Bulletin 2019; boe (barrel of oil equivalent)4 WAM (Emirates News Agency)6 World Bank’s Ease of Doing Business Rankings 2020
0.5%1.7% 1.3%
-3.5%
3.3%
2017 2018 2019e 2020f 2021f
Real GDP Growth3
• The UAE’s policy response to the COVID-19 pandemic was proactive and decisive in the form of fiscal and monetary stimulus packages, including a AED 256Bn (USD 69.7Bn) stimulus plan launched by the UAE Central Bank (more details on slide #8)
• According to the IMF, UAE real GDP is expected to contract by 3.5% in 2020 before rebounding 3.3% in 2021 as the COVID-19 situation is expected to normalise and lead to a strong recovery in key economic sectors including transportation, logistics, tourism and hospitality

5
Abu Dhabi - the capital
Ajman
Umm al Quwain
Ras al Khaimah
Fujairah
Ajman
Dubai
Sharjah
87% of UAE land area4
Estimated population4 : 2.9 Mn
1 National Accounts (SCAD) website as of 3rd May 2019, preliminary estimates2 After Luxembourg - IMF World Economic Outlook, October 2019; GDP per capita based on 2019e Nominal GDP, 2016 Population (SCAD)3 Fitch Ratings (31 October 2019)4 Abu Dhabi 2019 Bond Prospectus
Highest sovereign ratings in MENA
Aa2 / AA / AAMoody’s / S&P / Fitch
Major contributor to UAE GDPUSD 249Bn 2019e Nominal GDP1
61% of UAE’s 2018 Nominal GDP
2nd highest GDP per capita in the world
USD 85,6842
Strong fiscal positionSovereign foreign assets – 185% of GDP3
Government debt – only 11% of GDP3
On clear path to economic diversification
60% non-oil sector contribution to
nominal GDP1 , up from 45% in 2013
Abu Dhabi
AA credit rating was reaffirmed by S&P on 26 March 2020 with a stable outlook:
Extract from S&P report: “Abu Dhabi's net asset position (…) alongside proactive policymaking comfortably cushions it from the sharp fall in oil prices and other external shocks.”
“The stable outlook reflects our expectation that Abu Dhabi's fiscal position will remain strong over the next two years, although structural and institutional weaknesses will likely persist.”
Dubai
In the context of COVID-19, Abu Dhabi announced that previously budgeted capital expenditure plans would be maintained, and that oil production would be proactively managed to stabilise oil prices and revenues
Long term vision to transform the Emirate into a knowledge-based economy and reduce its dependence on the oil sector (2030 Economic Vision, Ghadan 2021)

10.4
4.2
3.2
1.5
0.3
(2.2)
UAE
Oman
SaudiArabia
Bahrain
Kuwait
Qatar
0
5
10
15
20
Q1'16 Q1'17 Q1'18 Q1'19 Q1'20
Abu Dhabi Dubai Other Emirates
6
UAE - other indicators
UAE PMI indicates a contraction in the private sector economy3
2019e Nominal GDP(USD Bn)
2020f Fiscal Balance1B
(% GDP)2019e Gross Debt
(% GDP)
A robust and diversified economy1A
Uptick in projects awarded, led by Govt4
(USD Bn)
779
406
192
138
77
38
SaudiArabia
UAE
Qatar
Kuwait
Oman
Bahrain
(12.6)
(11.1)
5.2
(11.3)
(16.9)
(15.7)
23.2
20.1
53.2
15.2
59.9
101.7
UAE remains top FDI destination in GCC2
44.1
40
45
50
55
60
Apr-15 Apr-16 Apr-17 Apr-18 Apr-19 Apr-20
1 IMF World Economic Outlook 1A - October 2019 , 1B – April 20202 World Investment Report 2019 - UNCTAD Federal Competitiveness and Statistics Authority 3 Markit Economics-PMI (Purchasing Manager Index), Bloomberg (Apr 2020)
4 Meed Projects, Apr 20205 Abu Dhabi, Department of Culture and Tourism ; Dubai, Department of Tourism and
Commerce Marketing
(USD Bn)
• Projects awarded in Q1’20 jump 91% QoQ (based on value) led by Government of Abu Dhabi
Hotel guests + occupancy - Abu Dhabi & Dubai5
90 79 72 69 73 120 108 104 96 85
75%73% 72% 72% 73%
77% 78% 78%76% 75%
-
50
100
150
2015 2016 2017 2018 2019
RevPAR - Abu Dhabi (LHS) RevPAR - Dubai (LHS)Occupancy rate - Abu Dhabi (RHS) Occupancy rate - Dubai (RHS)
17.5%8.1% 9.3%
3.7%
2.1%7.6% 4.7% 6.2% 0.8%
5.1%
Abu Dhabi Tourist Growth(YoY) Dubai Tourist Growth(YoY)
(USD)
• Subdued economic growth and COVID-19 push PMI to an all-time low
14%
40%
7%
6%
8%
24%
Construction and RealEstate
Mining and quarrying
Manufacturing
Trade, Restaurants &Hotels
Finance
Others
14%
26% 9%
13%
9%
29%
-8.8%
-6.8%
-20%
-10%
0%
10%
20%
30%
40%
50%
Mar'14 Mar'15 Mar'16 Mar'17 Mar'18 Mar'19 Mar'20
Abu Dhabi - All Properties (YoY Change)
Dubai - All Properties (YoY Change)
7
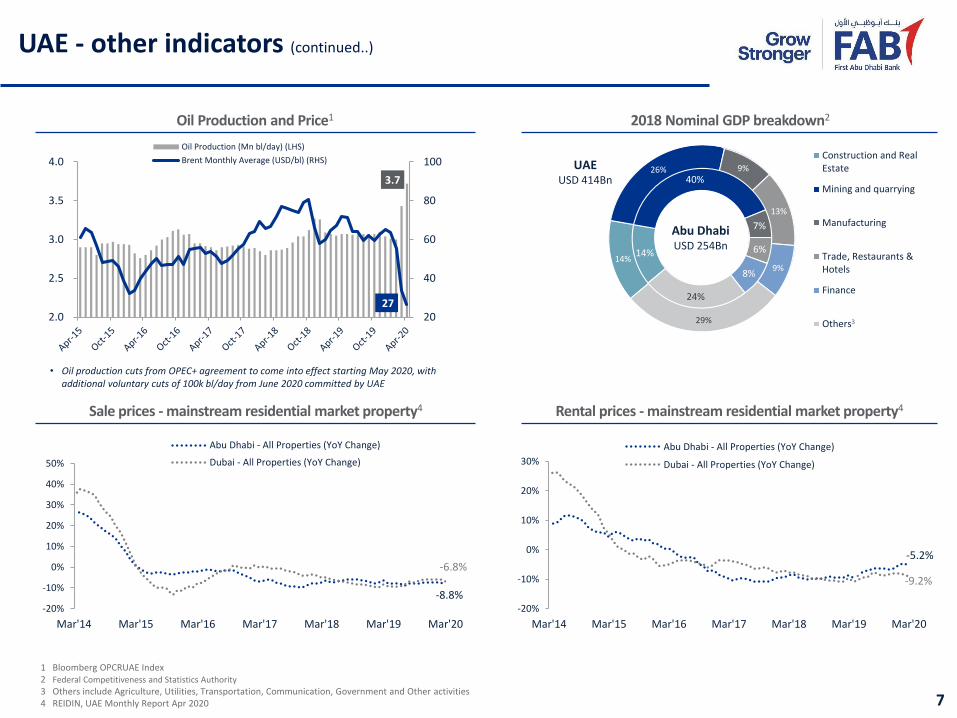
UAE - other indicators (continued..)
1 Bloomberg OPCRUAE Index2 Federal Competitiveness and Statistics Authority
3 Others include Agriculture, Utilities, Transportation, Communication, Government and Other activities4 REIDIN, UAE Monthly Report Apr 2020
Oil Production and Price1
Sale prices - mainstream residential market property4 Rental prices - mainstream residential market property4
-5.2%
-9.2%
-20%
-10%
0%
10%
20%
30%
Mar'14 Mar'15 Mar'16 Mar'17 Mar'18 Mar'19 Mar'20
Abu Dhabi - All Properties (YoY Change)
Dubai - All Properties (YoY Change)
2018 Nominal GDP breakdown2
3.7
27 20
40
60
80
100
2.0
2.5
3.0
3.5
4.0
Oil Production (Mn bl/day) (LHS)
Brent Monthly Average (USD/bl) (RHS) UAEUSD 414Bn
Abu Dhabi USD 254Bn
• Oil production cuts from OPEC+ agreement to come into effect starting May 2020, with additional voluntary cuts of 100k bl/day from June 2020 committed by UAE
3

93% 93% 90% 87% 87% 88%
8
Sound and highly capitalised banking sector
• UAE banking sector : 21 Local and 38 Foreign banks (Incl. 11 wholesale banks)
• FAB is one of the 4 Domestic Systematically Important Banks (DSIBs) in UAE
Key Highlights UAE Banking Sector Key Indicators1
Loan and deposit growth trend1
Market Share (UAE listed banks & FIs)4
LDR1
8.0%
5.8%1.7% 4.3%
5.7%4.9%
3.5%
6.2%
4.1%
7.9%6.5% 5.9%
2015 2016 2017 2018 2019 Mar'20
Credit growth, net (YoY) Deposits growth (YoY)
As of 31 Mar’20
• Credit growth yoy (Mar’20) led by Govt sector (+16%) and GREs (+17%)• Deposit growth yoy (Mar’20) led by GREs (+34%) and Private sector (+4%)
31%
29%
28%
Assets
Gross Loans
Deposits
1 Source: UAE Central Bank, UAE Banking Indicators 2 Net of provisions3 Total advances (net lending + net financial guarantees & stand-by LC+ Interbank placements more than 3 months)/ sum of (net free capital funds + total other stable resources)4 Source: Bloomberg, data available for 9 listed banks as of 12 May 2020
FAB733
Listed Banks total USD Bn
438
476
Figures in USD Bn Mar’20 YTD YoY
Total Assets, net2 813 1.3% 7.8%
Loans and Advances, net2 443 0.3% 4.9%
Customer Deposits 504 -1.0% 5.9%
LDR2 88% +113bps -84bps
Lending to Stable Resources Ratio3 82% +130bps -40bps
CAR (Basel III) 16.9% -70bps -100bps
CET1 (Basel III) 13.9% -70bps -70bps
Monetary measures by UAE Central Bank
• AED 50Bn (USD 13.6Bn) TESS facility to provide zero interest rate collateralised loans to banks (until 31 Dec 2020) – 77% utilised by banks as of 16th May 2020
• AED 61Bn (USD 16.6Bn) from reduction in cash reserve requirements ratio on demand deposits to 7% from 14%
• AED 95Bn (USD 25.9Bn) Liquidity Buffer - flexibility to maintain a minimum LCR of 70% (reduced from 100%) and a minimum ELAR of 7% (reduced from 10%)
• AED 50Bn (USD 13.6Bn) Relaxation in capital buffers – 60% of CCB (capital conservation buffer) and 100% of D-SIB buffer (until 31 Dec 2021)
• Application of prudential filter by banks to incremental IFRS9 expected loss provisions (5-year phasing period ending 31 Dec 2024)
AED 256Bn (USD 69.7Bn)

9
FAB is taking decisive actions in response to COVID-19
We activated a robust Business Continuity Plan, enabling the bank’s functions to operate with speed and efficiency while limiting exposure
• Activation of Work From Home in UAE and across international locations for 80% of our staff (ex critical functions)
• Use of cloud based virtual desktop capabilities
• Restrictions on travel
• Limiting physical meetings, availing video and tele-conferencing
• IT infrastructure scaled up to accommodate WFH
• Enhanced cybersecurity, fraud prevention and monitoring
We took care of our employees, to safeguard their health and safety
• Extensive internal communication, health tips reminders
• Tele/Video doctor consultations
• Employee wellbeing programmes
• Medical/testing support for reported cases
• Extensive sanitisation measures across our facilities
• Front line staff provided with masks, gloves, thermal scanning, etc
As the leading UAE Bank, it is our duty to support our customers and communities through these challenging times
• Financial relief measures for individual, SME and corporate customers inline with TESS1 (payment deferments, reductions of charges, fee waivers etc.)
• Leveraging our digital platform to deliver uninterrupted banking services, with a multitude of products and services accessed through online and mobile channels and available 24x7
• 31 branches (40% of UAE network) remained open with reduced hours for essential banking needs
• Continued to actively engage with clients and support their specific needs while conservatively managing liquidity
• Facilitated UAE’s first ever virtual General Assembly Meetings (6 conducted so far)
• AED 1Mn to the Emirates Foundation to provide food boxes to people in need during the Holy Month of Ramadan
• AED 2Mn to Emirates Red Crescent (ERC) to provide meals for frontline health professionals and meal boxes to support people in need to safely break their Ramadan fasts
• AED 5Mn to provide laptops to students for distance learning, in partnership with the Ministry of Education
1 TESS – Targeted Economic Support Scheme by UAE CB, April 2020

FAB in Brief

11
The largest bank in the UAE by total assets and market capitalisation, with the strongest combined credit ratings of any other bank in MENA
A dominant and diversified banking franchise with market-leading corporate and personal banking businesses, and a presence across 5 continents
Robust foundation with a strong balance sheet and solid fundamentals
On a clear path to deliver superior and sustainable shareholder returns
227USD Bn
Assets
29USD Bn
Market Cap
13.0per cent
RoTE
29.1per cent
CI ratio(ex-integration costs)
12.2per cent
CET1
AA-and equivalent by
Moody’s/ S&P / Fitch
1 #22 - Safest commercial banks worldwide ranking by Global Magazine; #86 - Tier 1 capital strength ranking by The Bankers’2 All figures as on 31 March 2020
One of the safest and strongest banks globally1

12
FAB at a glance
All figures as on 31 March 2020 ӏ 1 Full Time Employees, excludes outsourced staff ӏ 2 includes Ratibi (Wages Protection System) and E-dirham customersThe above map summarises market presence for FAB and its subsidiaries, where the Group currently has active operations; For information about legal presence please refer to Notes #3 and #29 of March-end 2020 financial statements
Europe, Americas, Middle East & Africa(EAMEA)
France
UK
Switzerland
USA
Brazil
Asia Pacific (APAC)
China/Hong Kong
India
Labuan (Malaysia)
Singapore
South Korea
UAE
Bahrain
Egypt
Kuwait
Libya
Oman
Saudi Arabia
FAB is the result of the historic mergerbetween two iconic Abu Dhabi-basedfranchises (FGB and NBAD) in 2017
Largest UAE bank and one of thelargest in MENA by total assets(AED 835Bn, USD 227Bn) and marketcapitalisation (AED 105Bn, USD 29Bn)
Offers an extensive range of productsand services via market-leadingCorporate and Investment Banking(CIB) and Personal Banking (PB)franchises
5Continents 75 528 5,345 >3 Million
Global presence Branches/Cash offices in UAE
ATMs/CDMsin UAE
Employees globally (FTEs1)
UAE Customers2

LT Aa3 AA- AA-
ST P-1 A-1+ F1+
Outlook Stable Negative Stable
13
The safest and strongest bank in the Middle East
Strongest combined credit ratings
amongst any other bank in MENA
Recognised as one of the safest and strongest banks worldwide
in UAE & Middle East
in Emerging Markets
Safest Commercial Bank Worldwide
#1
#4
#22
1 Global Finance Magazine safest bank rankings, September 2019 2 The Banker’s 2019 Top 1000 World Banks Rankings, July 2019
#1in UAE
by Tier 1 capital strength
#86Worldwide
by Tier 1 capital strength
Safest banks’ rankings by Global Finance1 Top 1000 banks’ rankings by The Banker2
#2in Middle East
by Tier 1 capital strength
#108Worldwideby Total Assets

A+AA-AA
14
Globally outstanding rating and returns
Notes: Based on the available financials on Bloomberg, RoTE for peer banks are estimated as: {net attributable profit less Tier-1 interest or Coupon payable on capital securities} / [average tangible equity]; ^Banks in the above peer group have different financial year endings; FY ending other than 31-Dec are highlighted with special characters: * for 31-Mar; ** for 30-Jun; *** for 30-Sep & **** for 31-Oct; Source: Bloomberg
FAB is amongst the most profitable AA- rated banks globally
AA+ A A- BBB+ BBB BB+BBB- BB
Composite Rating
Ret
urn
on
Tan
gib
le E
qu
ity
(%)
Western banksGCC banksAPAC banks

ADIC PJSC, 33.36%
Mamoura Diversified
Global Holding PJSC,
3.68%Other UAE companies
and individuals,
46.24%
GCC (ex-UAE)1.34%
Foreigners (ex-GCC)15.43%
Mubadala Investment
Company37.04%
15
Share Profile
Strong shareholding3
• Listed on Abu Dhabi Securities Exchange (ADX)
• Symbol: FAB, ISIN: AEN000101016
• Market cap: AED 105Bn (USD 29Bn)
• No. of shares issued: 10,920Mn
• Foreign Ownership Limit (FOL): 40%
• Free Float2: 43%
• Valuation multiples (based on Q1’20 financials)
P/TE 11.8xP/TB 1.7xD/Y 7.7% (2019 dividend)
Overview1
Abu Dhabi Securities Market Index ADSMI 38.99%
Bloomberg EMEA Banks Index BEUBANK 2.84%
MSCI EM MXEF 0.15%
MSCI EM Banks MXEF0BK 0.95%
FTSE Emerging Index FTAG01 0.26%
MSCI EM ESG Leaders5 M1EFES 0.43%
Index Weightings1 :
4
1 Based on closing prices as of 31 March 2020 and Q1’20 financials2 Free float designates FAB shares available for purchase in public equity markets which
are not strategic in nature
3 Shareholding percentage based on outstanding shares (net of 18.7Mn treasury shares) as of Mar-end 2020 4 Through its 100% owned subsidiaries ADIC PJSC and Mamoura Diversified Global Holding PJSC (formerly
known as Mubadala Development Company PJSC); MIC is 100% owned by the Emirate of Abu Dhabi
5 As of Nov 2019
FAB is the largest constituent on ADX, contributing 22% of turnover on ADX & DFM (combined) in 2019

16
Leading UAE and regional bank
1 Central Bank information as of 31 March 2020; as of 29 Feb 2020 for Bahrain2 Company information as of 31 March 2020, except as stated otherwise3 Defined as the largest bank in the country by total assets4 Based on 31 March 2020; Source Bloomberg
852
724
432
232
208
93
UAE
Qatar
KSA
Kuwait
Oman
Bahrain
Banking sector assets1
(USD Bn)
National champion2,3
0.66
0.75
0.97
1.32(FY’19)
0.73(FY’19)
0.09
Q1’20 Net Profit2
(USD Bn)
227
142
262
97(FY’19)
32
25.6
17.3
24.1
14.1(FY’19)
4.9
Total Assets2
(USD Bn)
Equity2
(USD Bn)
Market Cap4
(USD Bn)
28.7
27.6
42.2
15.6
6.5
2.7
Credit Ratings4
(Moody’s/S&P/Fitch)
Aa3 / AA- / AA-
A1 / BBB+ / A-
Aa3 / A / A+
Aa3 / A / AA-
NA / BBB / BBB-
Ba2 / BB- / BB
40(FY’19)
5.4(FY’19)
NCB
QNB
NBK
AUB
Bank Muscat
FAB

17
Key financials at a glanceBalance sheet & Income Statement
TOTAL ASSETS (AED Bn) LOANS & ADVANCES (AED Bn) CUSTOMER DEPOSITS (AED Bn)
TANGIBLE EQUITY1 (AED Bn) OPERATING INCOME (AED Bn) NET PROFIT (AED Bn)
1 Post-dividend
669.0
743.9
822.0
Dec'17
Dec'18
Dec'19
CAGR 2017-2019: 11%
330.5
353.0
407.9
Dec'17
Dec'18
Dec'19
CAGR 2017-2019: 11%
395.8
465.2
519.2
Dec'17
Dec'18
Dec'19
CAGR 2017-2019: 15%
71.1
71.2
77.4
Dec'17
Dec'18
Dec'19
CAGR 2017-2019: 4%Dividends
AED Bn
8.08
8.06
7.63 19.5
19.4
20.2
Dec'17
Dec'18
Dec'19
CAGR 2017-2019: 2%
10.9
12.0
12.5
Dec'17
Dec'18
Dec'19
CAGR 2017-2019: 7%

18
Key financials at a glanceKey ratios
NIM - YTD (%) NPL RATIO1 (%) PROVISION COVERAGE1 (%)COST-TO-INCOME RATIO - YTD (%) (EX-INTEGRATION COSTS)
ROTE3 - YTD (%) RORWA - YTD (%)NON-INT INC / REVENUES (%) CET1 & CAR2 (%)
1 2017 figures are pre-IFRS9 implementation2 Capital ratios are post dividend as per UAE CB’s Basel III framework 3 Return on Average Tangible Equity, annualised; based on attributable profit to equity shareholders' excl Tier 1 notes coupon Ratios annualised, based on actual/365 day count, where relevant
2.48 2.362.11
FY'17 FY'18 FY'19
12.8 12.4 13.5
16.2 15.7 16.9
Dec'17 Dec'18 Dec'19
CET1 CAR
3.09 3.15 3.23
Dec'17 Dec'18 Dec'19
120 11093
Dec'17 Dec'18 Dec'19
27.7 25.8 26.8
FY'17 FY'18 FY'19
32.9 33.036.9
FY'17 FY'18 FY'19
14.616.2 16.1
FY'17 FY'18 FY'19
2.26 2.46 2.56
FY'17 FY'18 FY'19

19
Our strategy is based on 5 pillars
1 2 3 4 5
Mobile-centric digitisation
Growth and leadership in PBG
Regional dominance and international relevance
in CIB
Talent mobilisation
Drive value from scale
Digitise customer journeys
Launch digital ventures and new business models
Become a data-drivencompany throughadvanced analytics, AI
Build a modern and flexible technology foundation
Enhance value proposition across key segments and products
Digital investments:acquisition and servicing capabilities
Accelerate international growth (KSA, Egypt, private banking)
Strengthen leadership position in UAE
International: grow in KSA and Egypt, dominate MENA trade flows
Expand product offering, focus on flow business and cross-sell
Elevate customer convenience through digital
Strengthen and evolve unified culture
Acquire new talent to support transformation and cultural shift
Enable employees to acquire new skills and capabilities
Drive organic growth across segments and geographies
Opportunisticallypursue transactions that create significant value
“Creating value for our customers, employees, shareholders and communities to grow stronger through differentiation, agility and innovation”
Our Vision

20
Our CIB franchise
CIB contribution to Group FY’19 metrics
Client led franchise with global connectivity
Market leading capabilities
Preferred banking partner for
Govt/GREs/Corporates
Strong and diversified liability franchise
63%
55%
Profit After Tax
Revenue
81%
76%
CustomerDeposits
Loans &advances
Dominant CIB franchise
Best InvestmentBank in the UAE
2018, 2019
Best Bank for Cash Management
in the UAE 2019
Best Bank for Financing in the
MEA 2019
Middle East’s Best Banks for Asia
2018, 2019
Best Loan Arranger in the
ME 2019

21
Our PBG franchise
branches and pay offices in UAE with a presence across all 7 emirates 3Mn
PBG contribution to Group FY’19 metrics
Largest bank in the UAE
75 More than Customers1
Serve all types of customers
Full suite of products
Large distribution network
Trustedbrand
Strong Government Relationships
28%
37%
Profit After Tax
Revenue
19%
24%
CustomerDeposits
Loans &advances
1 includes Ratibi (WPS) and E-dirham customers

22
Our commitment to sustainability
Voluntary initiatives and public commitments in alignment with national and global frameworks
FAB’s robust framework is anchored on 4 strategic pillars
Note: Please refer to the Sustainability section of our corporate website to learn more about FAB’s sustainability practices and disclosures (including FAB’s Corporate ESG, Green Bond and Equator Principles Reports)
Governance, Integrity and Risk Management
Sustainable Banking Responsible Employer Positive Societal Impact
In 2016, we committed to facilitate financingUSD 10 Billion of sustainable projects over 10 years
Exceeded in 2019, 6 years ahead of schedule

23
Our commitment to sustainability
Our Green Bond Framework
Our ESG Ratings
Note: Please refer to the Sustainability section of our corporate website to learn more about FAB’s sustainability practices and disclosures (including FAB’s Corporate ESG, Green Bond and Equator Principles Reports)
AMSCI ESG Carbon Disclosure Project (CDP) Score
B
With the FAB Green Bond, we are playing a key role in developing the green bond market in the Middle East and helping drive the UAE toward achieving its national sustainability targets and its intentions to be a leader in renewable energy through sustainable environment and infrastructure.
Our latest published reports
To access our latest reports, please refer to the sustainability section of our corporate website:https://www.bankfab.com/en-ae/about-fab/sustainability/reports
2019 Highlights
1st Financial Institution in the MENA region to commit to implementing the recommendations of the Task Force on
Climate Related Financial Disclosures (TCFD)
In 2019 we trialed our financial literacy pilot with People of Determination. We strive to be a respected community partner that continues to improve the financial wellbeing of our customers, our employees, our stakeholders and our communities.
Sole mandated lead arranger, lender and facility agent for the MENA region’s first SDG loan and the first SDG facility availed by a commercial airline globally, providing funding to Etihad in support of their long term lease of the Etihad
Eco-Residence located in Masdar City
FAB issued the first Green bond from the MENA region in 2017; followed with 1st two private placements from the
MENA in 2019
Drafted one of the first Group Policies for the removal of single use plastics within the region to support our
commitment on becoming single use plastic free
FAB is the highest scoring bank in the region, strengthening our commitment to continue to improve our position in the years ahead.

• 70% yoy increase in mobile registrations and engagement
• Consistently high NPS scores and usage of our mobile app
• Successful migration of key services to mobile – c.90% transactions performed digitally for migrated services For eg. All card activations migrated to mobile banking channel
• New functionalities introduced on our mobile app and digital wallet (Pay-it)
• Customers can now join FAB and open an account or credit card though our mobile app without visiting Branch
• Substantial increase in clients adopting electronic channels in GTB: (>90% vs. ~60% a year ago), introduction of Blockchain for Trade Finance (UAE trade connect)
• Process efficiencies through RPA implementation, AI
• Leveraging data analytics to offer value-add solutions to clients
• Instilling a tangible culture of innovation through various initiatives
24
Significantly progress in digital transformation

Q1’20 financial performance review

We have witnessed unprecedented market disruption due to the COVID-19 pandemic
We delivered a resilient performance in Q1’20 with a net profit of AED 2.4Bn, despite
rate cuts, adverse market conditions and prudent provisioning
We maintained a strong balance sheet, with solid liquidity, funding, capital and
healthy asset quality
As the leading UAE bank, FAB is taking decisive actions in order to support its
employees, customers, and communities navigate challenging times
Our competitive strengths and strategy, position us well to continue to deliver
sustainable returns to our shareholders
26
Q1’20 performance key highlights

3,107
2,408
+47
(376)
(39) (331)
Q1'19 NPAT OperatingIncome
OperatingCosts
Impairmentcharges,net
Taxes &MinorityInterest
Q1'20 NPAT
27
We delivered a resilient performance in Q1 2020
Net profit bridge (AED Mn)
Q1’20 4,566 1,353 738 67 2,408
YoYchange
-8% +3% +81% -41% -22%
QoQchange
-10% -4% +48% -22% -22%
NPAT was lower 22% yoy due to:
• Lower revenue on the back of rate cuts and adverse market conditions, partly offset by continued momentum in PBG, and positive underlying trends in strategic areas, particularly fee-generating businesses and flow products
• Higher impairment charges include management overlays in light of a more challenging operating environment
• Cost discipline despite ongoing investments in key strategic initiatives

28
Flight-to-safety benefits FAB in the current environment
1 Excluding short-term government outflows early in the quarter, deposits grew 2% qoq2 Rated Aa3 / AA-/ AA- by Moody’s / S&P / Fitch3 USD or equivalent
Strong
Liquidity & Funding
profile
AA- rating2
Deposits up 2% qoq1
Int’l franchise provides liquidity diversification
LCR > 100%LDR < 80%
Strong cash balances and liquid assets
HQLAs of AED 239Bn
UAE CB TESS facility and liquidity relief
measuresFAB was allocated
AED 8Bn
USD 1.2Bn3
maturities remaining in 2020
USD 1.8Bn3 Maturedin Q1’20
USD 2Bn3
wholesale funding raised in Q1’20

161.6 173.1 176.3 174.0 181.0
271.2 289.2 300.4 345.2 316.1
432.8 462.2 476.8
519.2 497.1
Mar'19 Jun'19 Sep'19 Dec'19 Mar'20
Notice,Time &Others
CASA
29
Underlying business momentum continues
Loans and advances, net (AED Bn)
Customer deposits (AED Bn) QoQ↓4%, YoY↑15%
263.1 269.6 282.2 310.1 285.0
94.9 95.5 95.4 97.7
96.8 1.0 0.8
0.1 0.2 359.0 366.0 377.8
407.9 381.8
Mar'19 Jun'19 Sep'19 Dec'19 Mar'20
Others
PB
CIB
LCR (%) 117 137 146 129 110
LDR (%) 83 79 79 79 77
Minimum regulatory LCR requirement is 100% effective Jan’19; relaxed to 70% until 31 Dec 2020 under TESS by UAE CB
QoQ↓6%, YoY↑6%
• Loans and advances (net) were up 6% yoy (+23Bn), down 6% qoq due to a large short-term facility which was fully repaid in early January. Excluding this one-off, loans and advances are up 1% reflecting continued momentum across core businesses, despite COVID-19 disruption
• Customer deposits were up 15% yoy (+64Bn). Theywere down 4% sequentially due to short-termgovernment outflows earlier in the quarter, however up2% (+8Bn) on an adjusted basis driven by strongincrease in corporate and private sector deposits
• FAB’s International network is a key differentiator tosource liquidity and funding; international depositswere up 13% (AED 14Bn) qoq, and up 21% yoy
• FAB continued to attract liquidity from its global clientfranchise, owing to its safe haven status and flight-to-safety in periods of market turmoil
• CASA balances grew 4% (+7Bn) sequentially and 12%(+19Bn) yoy to AED 181Bn, representing 36% ofcustomer deposits

10%
46%
16%
7%
21%
30
A high-quality and diversified asset mix
Total Assets - Mar’20
AED 835.4Bn
44% of Assets in cash & liquid assets
Cash & CB Balances
Due from Banks and Reverse Repos
Investments
Loans and Advances, net
Other Assets
• AED 145Bn – cash and balances with CBs1
• 82% of investments are investment-grade
28% exposure to high quality Government & GREs
with minimal or no default history
Another 3% of corporates closely linked or backed by
the Government
8% short-term trade loans
Diversified economic sector exposure
1 excluding cash reserve deposits
FAB is in a unique position in the UAE banking landscape with a loan portfolio geared towards high-quality assets in light of the bank’s privileged position as the strategic partner to the Abu
Dhabi government and related entities

407467 469 499
738
50 49 50 48
70
Q1'19 Q2'19 Q3'19 Q4'19 Q1'20
Net impairment charges CoR (L&A) (bps)
12.1 11.6 12.013.5 13.9
12.9 12.8 13.1 12.613.2
Mar'19 Jun'19 Sep'19 Dec'19 Mar'20
NPLs
Provisions
31
A more challenging credit environment
106 111 109 93 95
3.33.1 3.1 3.2
3.5
Provision Coverage (%)
NPL Ratio (%)
Impairment charges, net (AED Mn) & CoR1
1 Annualised2 For further details, refer to note #4 of Q1’20 financial statements Use of estimates and judgements – Impact of COVID-19Note: Gross loans and advances and NPLs are net of interest in suspense; see Note #5 Credit Risk in financials for more details on IFRS9 exposures and ECL
NPLs and Provisions (AED Bn)
- NPLs = Stage 3 exposure + adjusted POCI (Purchase or originally impaired credit) of AED 4,667Mn as of Mar’20 considered as par to NPLs, net of IIS
- ECL/ Provisions = ECL on loans & advances (AED 11.6Bn) + ECL on unfunded exposures (AED 623Mn) + IFRS9 impairment reserve (AED 959Mn)
• NPLs were AED 13.9Bn compared to AED 13.5Bn as of Dec-end 19, with no material deterioration in asset quality during the period
• Asset quality remained healthy with NPL ratio at 3.5%, stable sequentially, when adjusting for the large short-term facility in Q4’19
• Impairment charges of AED 738Mn include management overlays reflecting prudent provisioning in light of a more challenging operating environment
• Assessment of COVID-19 impact on SICR and ECL is ongoing in light of the high degree of uncertainty surrounding recent events2
• Annualised CoR stands at 70bps, up from 48bps in FY19; with provision coverage at 95%
• Our high quality portfolio, in addition to regulatory relief measures, underpin the resilience of our risk metrics in the current environment
Key highlights

32
Cost discipline maintained
Opex drivers yoy (AED Mn)
1,245 1,299 1,339 1,352 1,283
24 21 20 18 24 45 45
46 46 45
1,314 1,365 1,405
1,415 1,353
Q1'19 Q2'19 Q3'19 Q4'19 Q1'20
Amortisation of intangibles(merger-related)Integration costs
Operating expenses (BAU)
Operating expenses trend (AED Mn) and Cost-income ratio (ex-integration) (%)
26.1 26.1 27.3 27.5
29.1
Change in BAU Opex:
Q1’20 vs. Q4’19 – ↓5%
Q1’20 vs. Q1’19 – ↑3%
C/I ratio (ex-integration)
• xxx
1,314
1,353
+24 +60 (46)
Q1'19 Staff Costs Depreciation &Amortisation
Other G&A Q1'20
• Operating expenses well under control, down4% qoq (AED 63Mn), reflecting cost disciplineamidst continued strategic and digitalinvestments
• Q1’20 C/I ratio at 29.1% from 26.1% , mainlydue to lower revenue
• AED 1.5Bn cost synergy run-rate was fullyachieved in January, with further scope forfuture savings
• Cost discipline to be maintained through thecycle, with initiatives underway to partiallymitigate revenue and risk headwinds

15.2%
13.5%
12.2%
+0.5%-1.67%
-0.38% -1.47%
CET1Dec'19
FY'19Dividends
CET1Dec'19
(post-dvd)
Change inRWA
Q1'20 profits Othermovements
CET1Mar'20
33
Solid capital position
1 Return on Average Tangible Equity, annualised; based on attributable profit to equity shareholders' excl Tier 1 notes coupon2 UAE CB has reduced the minimum CET1, Tier 1 and CAR requirement to 8%, 9.5% and 11.5% respectively until 31 Dec 2021 under TESS (previous minima of 11%, 12.5% & 14.5%, respectively)3 CET1 and capital ratios updated post Q1’20 results announcement to reflect the application of prudential filter (incremental S1 & S2 ECL added back to CET1) in accordance with UAE CB guidelines
CET11 ratio progression qoq
• CET1 was 12.2%, 135bps lower sequentially mainly due to adverse movement in AFS reserves reflecting market dislocations
• CET1 comfortably above Basel III minimum regulatory requirement of 11.0%
• Temporary capital relief buffers prescribed by the UAE CB under TESS, allow banks to use up to 60% of CCB and up to 100% of D-SIB buffers until 31 Dec 2021, freeing up 3% of capital ratio requirement, if necessary2
DPS: 74 fils8.08Bn
Dec’19 YoY change Mar’20
CET1 AED 65.6Bn -8.2% AED 60.6Bn
RWAs AED 485.1Bn +2.6% AED 497.4Bn
Tier 1 15.7% -148bps 14.3%2
CAR 16.9% -148bps 15.5%2
17.4 17.2 16.716.1
13.0
Q1'19 H1'19 9M'19 FY'19 Q1'20
RoTE trend (ytd)
Min req UAE CB2: 11%

• Q1’20 NII was up 1% qoq driven by lower funding costs
• NIM is up 1bps over Q4’19 as headwinds from rate cuts in H2’19were offset by the positive impact of lower placements withcentral banks (offering negative interest)
• P&L impact from a +/-25bps parallel movement in interest ratesis estimated at ~+/-AED 270Mn1, if no offsetting action is takenby management
• Rate headwinds to be partly offset by volume growth, loanrepricing in a lenders market, and optimal balance sheetmanagement
34
NII and margin trends
Key highlights
3,114 3,301 3,329
3,031 3,061
Q1'19 Q2'19 Q3'19 Q4'19 Q1'20
Net interest income (AED Mn)
QoQ↑1%, YoY↓2%
1 For further details, please refer to Market Risk note 5(c) of FY’19 financial statements
2.16 2.25
2.17 1.89
1.90 2.21
2.19 2.11
Quarterly YTD
4.80 5.04
4.70 4.37
4.14 4.92
4.84 4.72
1.54
1.47 1.35 1.28 1.12
1.50 1.45 1.41
Q1'19 Q2'19 Q3'19 Q4'19 Q1'20
Note: All percentage figures are annualised
Net
inte
rest
mar
gin
(%)
Perf
orm
ing
loan
yie
lds
(%)
Cos
t of
cust
omer
dep
osit
s (%
)

FX & investment income down 36% yoy due to lowerALM revenue and negative MTM revaluations oninvestments and trading portfolios reflectingheightened risks and widening of credit spreads. Thiswas partly offset by higher flow income as significantmarket volatility led to a spike in demand for hedgingsolutions across IR, FX and commodity space.
Fees & commissions up 3% yoy on the back of higherasset management-related fees; up 7% sequentially asa result of higher loan-related fees
41 41 45 71 45
971 1,053 886
1,196
622
816 758 813
783
839
1,828 1,852 1,744
2,050
1,505
Q1'19 Q2'19 Q3'19 Q4'19 Q1'20
Net F&C income Net FX & Investment inc Other income
35
Non-interest income
Non-interest income (AED Mn)
QoQ↓27%, YoY↓18%
37% 36% 34% 40% 33%
Non-interest income % (of Group revenue)
Key drivers

21%
5%
50%
16%
8%21%
7%
46%
16%
10% Cash & CB Balances
DFB and ReverseRepos
Loans and Advances
Investments
Others
Overdrafts6%
Term Loans75% Trade related loans
9%
Personal Loans8%
Credit Cards1%
Vehicle financing loans
0.3%
Agriculture0.1%
Energy9%
Manufacturing6%
Construction3%
Real Estate21%
Trading7%
Transport and communication
7%Banks6%
Other financial institutions 9%Services 5%
Government 9%
Personal - Loans & Credit Cards
13%
Personal - Retail Mortgage
5%
16% 9%
18%19%
43% 47%
17% 19%6% 6%
Dec'19 Mar'20
Banks
Personal/ Retail
Corporate/ Private
Public Sector
Government
36
Asset & loan mix
AED 396.6BnMar’20
AED 381.8BnMar’20
AED 396.6BnMar’20
396.6421.7
Asset Mix Gross loans by counterparty (AED Bn)
Gross loans by economic sector Net loans by geography2 Gross loans by product
1
1 Real Estate by geography: Abu Dhabi 45%, Dubai 26%, Other UAE 3%, UK 17%, Other Intl 9%2 Based on loan origination / coverage
Mar’20AED 835.4Bn
Dec’19AED
822.0Bn
UAE73%
GCC7%
Asia9%
Europe7%
MENA2%
America2%

FVTPL - Debt13% FVTPL - Equity &
Funds2%
Amortised Cost (Debt Inv)
3%
FVOCI - Equity0.4%
FVOCI - Debt82%
Sovereign47%
GREs18%
Covered Bonds(Banks & FIs)
3%
Banks24%
Corporate/ Pvt Sector
6%
Supranational2%Europe
20%
GCC15%
MENA (ex-GCC&UAE)
3%USA10%Others incl A&NZ
3%
Asia19%
UAE30%
AAA10%
AA29%
A32%
BBB11%
BB & below10%
Unrated - Debt6%
Equity & Funds2%
37
Investments breakdown
AED 132.7BnMar’20
AED 132.7BnMar’20
AED 132.7BnMar’20
AED 132.7BnMar’20
Investments by type Investments by ratings
Investments by geography Investments by counterparty
Note: All totals are Gross investments before ECLSovereign bonds include sovereign guaranteed bonds issued by GREs, banks & FIs
82% of investments are
investment grade
FVTPL – Fair value through profit or loss (previously HFT)Amortised cost – previously HTMFVOCI – Fair value through other comprehensive income (previously AFS)

29% 21%
17%18%
32% 41%
16% 16%6% 4%
Dec'19 Mar'20
Government sector Public SectorCorporate / private sector Personal/retail sectorCertificates of deposits
59% 59%
32% 34%2% 2%6% 4%
1% 1%
Dec'19 Mar'20
Notice and time deposits Current AccountsSaving Accounts Certificates of depositsMargin Accounts
UAE75%
GCC 4%
Asia 2%
Europe10%
MENA2%
America7%
38
Customer deposits
AED 497.1BnMar‘20
37% 37% 37% 34% 36%
432.8 462.2 476.8 519.2 497.1
Mar'19 Jun'19 Sep'19 Dec'19 Mar'20
Total Customer Deposits CASA
1 Based on deposit origination / coverage2 Current, savings and call accounts; prior periods reclassified to include call accounts earlier grouped with notice and time deposits
Customer deposits (AED Bn) Customer deposits by account type (AED Bn)
Customer deposits by Counterparty (AED Bn) Customer deposits by geography1
2
519.2 497.1
519.2 497.1

176
52
108
37
228
146
Cash &AAA/AA bonds
ST WholesaleFunding
Cash & Bal with CBs AAA & AA bonds
DTB & Repos CDs & CPs
39
Liability mix and funding profile
Medium Term Notes 48.1
Sukuks 9.1
Subordinated debt 0.4
Total 57.6
4.22.5
8.25.4 6.9
2.3
18.62.5
4.9
1.7
0.4
2020 2021 2022 2023 2024 2025 2026 &Beyond
MTNs
Sukuks
Subordinated debt
Cash & AAA/AA bonds vs. ST wholesale
Note: Debt at final maturity date rather than next call date
Medium-term wholesale funding (AED Bn)
(AED Bn)
* FAB has access to place deposits with ECB & FED
Due to Banks & Repos15%
Commercial Paper
2%
Customer Deposits
67%
Term Borrowings & Sub Debt
8%
Others8%
Liability Mix
AED 741.3BnMar’20
• 30yr multi-callable USD 485Mn Formosa
• 5yr USD 500Mn public Sukuk at 2.5%
• 5yr AUD 350Mn public Kangaroo at BBSW +110bps
• 3yr GBP 450Mn public Sterling at 1.375%
• 2-5yr USD 190Mn equivalent of private placements
Issuances USD
equivalent 2.0Bn
in Q1’20
Maturities USD
equivalent 1.8Bn
in Q1’20
• 5yr USD 750Mn public bond at 2.250%
• 5yr USD 900Mn public bond at 2.625%
• USD 150Mn equivalent of private placements issued 2014-2018

53%
40
Segmental performance (by business)
Corporate & Investment Banking (CIB)
41%Personal Banking Group (PBG)
of Group Revenue
of Group Revenue
In AED Mn Q1’20 YoY %
Revenues 2,423 (13)
Operating expenses (541) 9
Impairment charges, net (177) (47)
Profit after taxes 1,657 (13)
Loans (AED Bn) 285.1 8
Deposits (AED Bn) 402.7 20
In AED Mn Q1’20 YoY %
Revenues 1,864 7
Operating expenses (738) 4
Impairment charges, net (351) 169
Profit after taxes 751 (15)
Loans (AED Bn) 96.8 2
Deposits (AED Bn) 91.7 (2)
• CIB Revenue delivered a resilient performance during an unprecedented period marked by heightened volatility that also saw erosion of market liquidity and widening of spreads across asset classes. CIB revenue was down 13% yoy driven by:
› Global Markets (-5%), on the back of negative MTM revaluations, offset partially by higher trading gains and increased client activity and cross-sell; GM sales revenue +16% yoy
› Global Transaction Banking (-11%), primarily due to rate cuts in H2’19; partly offset by higher CASA balances; non-interest income was nevertheless up 1% yoy
› Global Corporate Finance (-16%), performance was impacted by rate cuts, subdued market volumes and margin compression; robust balance sheet growth yoy led by Govt/GRE lending in UAE, and strong liquidity position
• PBG delivered a resilient performance in Q1’20 growing balance sheet and revenue in a competitive market
• Operating income grew 7% yoy on the back of higher non-interest income, driven by 36% increase in net fees and commissions from higher lending related fees and asset management fees
• Enhanced product offerings, new partnerships and ongoing process improvements supported business growth in Q1’20, although sales were partially impacted due to COVID-19 towards the end of the month
• Increase in loans and advances yoy in Q1’20 was mainly driven by growth in mortgages

41
Segmental performance (by geography)
84%UAE
International (Europe, Americas, Middle East & Africa and Asia-Pacific)
of Group Revenue
• Revenues were significantly impacted due to rate cuts in H2’19 and negative MTMrevaluations in the AFS portfolio
• Revenues declined 9% yoy, contributing 84% to Group revenue, while operatingexpenses were flat you on the back of cost discipline and synergy realisation
• Impairment charges, net increased 86% yoy as the Bank took pre-emptive provisionsin light of a more challenging environment
• Loan book grew faster than market, led by government/ GRE lending andhighlighting FAB’s position as the preferred banking partner to the Abu DhabiGovernment and GREs
• Liquidity position remains strong, with customer deposits inflows up 13% yoy
• FAB’s international business remains a key differentiator supporting revenue andrisk diversification, contributing 16% to Q1’20 Group revenue (14% - FY’19)
• International revenue grew 3% yoy, led by higher contributions from Saudi Arabia,Egypt, Hong Kong and India
• Increase in expenses reflects growth initiatives in targeted markets
• As of end-Q1’20, international loans and deposits represent 27% and 25% of Grouploans and deposits, respectively
In AED Mn Q1’20 YoY %
Revenues 3,836 (9)
Operating expenses (1,068) ↔
Impairment charges, net (641) 86
Profit after taxes 2,127 (25)
Loans (AED Bn) 278.3 8
Deposits (AED Bn) 374.0 13
In AED Mn Q1’20 YoY %
Revenues 730 3
Operating expenses (285) 16
Impairment charges, net (97) 53
Taxes (76) 7
Profit after taxes 272 (18)
Loans (AED Bn) 103.5 3
Deposits (AED Bn) 123.1 21
of Group Revenue
16%

Despite downside risks in the near term, our strategic actions position us well to continue to maintain balance sheet strength in the current environment, and deliver sustainable returns
42
Looking ahead
Our priorities
• Protect and raise liquidity leveraging our competitive strengths and flight-to-safety status
• Conservatively manage our balance sheet and deploy liquidity in a disciplined manner
• Extend support to our customers inline with CB UAE TESS
• Leverage market-leading product capabilities to offer best-in-class advice and execution to clients in a uncertain environment
• Ensure cost and risk discipline, and prudent provisioning in light of the evolving dynamics of COVID-19
2020 Outlook Expected outcome
Loan growthEconomic slowdown to be mitigated by government spending and a pick-up in demand in a lenders’ market
Mid/high single digit ex. large one-off in
Q4’19
Revenue Growth
Downward pressure from rate cuts and markets, to be partially offset by continued momentum in strategic areas and other initiatives
C/I Ratio (ex-integ. costs)
Cost optimisation initiatives to support operating efficiency
<30%
Cost of RiskDeteriorating operating environment to put pressure on risk metrics, partly mitigated by regulatory relief measures
NPL ratio
CET1 CET1 expected to remain above regulatory requirementsReiterating medium term CET1 floor guidance of 13.5% (pre-dividend)

43
Wrapping up
Our Q1’20 performance reflects an unprecedented environment
We are focused on maintaining a robust foundation through solid liquidity,funding and capital ratios
Our competitive strengths, in addition to the various relief measuresimplemented by local authorities, underpin our resilient profile in thecurrent environment
As the leading UAE bank, FAB will continue to take decisive actions in orderto support employees, customers, and communities navigate challengingtimes
Despite significant headwinds in the near term, we remain confident in ourability to deliver sustainable shareholder returns
Appendix

45
Q1’20 Key financials
In AED Bn Mar’20 Mar’19 YoY% Dec’19 YoY%
Total assets 835 733 14 822 2
Loans and advances 382 359 6 408 (6)
Customer deposits 497 433 15 519 (4)
Equity (incl Tier 1 capital notes) 94 98 (4) 108 (13)
% Q1’20 Q1’19 YoY% Q4’19 QoQ%
C/I ratio (ex-integ costs) 29.1 26.1 299 27.5 159
RoTE 13.0 17.4 (445) 15.5 (258)
NPL ratio 3.5 3.3 26 3.2 30
Provision coverage 95 106 lge 93 175
Liquidity Coverage Ratio (LCR) 110 117 (751) 129 lge
CET1 ratio (post dividend) 12.2 12.7 (54) 13.5 (135)
P&L summary
Key ratios
In AED Mn Q1’20 Q1’19 YoY% Q4’19 QoQ%
Revenue 4,566 4,942 (8) 5,081 (10)
Operating expenses (1,353) (1,314) 3 (1,415) (4)
Impairment charges (738) (407) 81 (499) 48
Net profit (after minority interest) 2,408 3,107 (22) 3,081 (22)
Balance Sheet summary

46
Executed landmark transactions in Q1 2020
Debt Capital MarketLoan Capital Market
First Abu Dhabi BankUSD 500 million
Senior Sukuk 2.5% due 2025
Jan 2020
Joint Bookrunner
Boubyan BankUSD 750 million
Senior Sukuk2.593% due 2025
Feb 2020
Joint Bookrunner
First Abu Dhabi BankGBP 450 million
Senior Unsecured 1.375% due 2023
Feb 2020
Joint Bookrunner
Gulf International BankUSD 90 million
Senior Unsecured3M Libor + 1.45% due 2025
Jan 2020
Sole Bookrunner
Mazoon Electricity CompanyUSD 155 million
Bridge Loan
Mar 2020
Bookrunner & Mandated Lead Arranger
Bajaj Finance LimitedUSD 575 million equivalent
Term Loan Facilities
Jan 2020
Bookrunner, Mandated Lead Arranger
Topaz Energy & Marine LimitedUSD 392 million
Term Loan Islamic & Conventional
Feb 2020
Mandated Lead Arranger , Global and Conventional
Facility Agent
Bakkavor FinanceUSD 455 million
Term Loan & RCF
Mar 2020
Mandated Lead Arranger
Islamic Development BankCNY 1.0 billion
Senior Unsecured Sukuk2.85% due 2023
Feb 2020
Sole Bookrunner
Riyad BankUSD 1.5 billion
Tier2 Trust certificates3.174% 10NC5 due 2030
Feb 2020
Joint Bookrunner
Novelis CorpUSD 1.6 billion
Senior Unsecured4.75% due 2030
Febl 2020
Joint Bookrunner
Tata Steel NetherlandsEURO 1,750 millionTerm Loan Facility
Jan 2020
Bookrunner, Mandated Lead Arranger & Facility Agent
ONGC Videsh LimitedUSD 1 billion
Term Loan Facility
Mar 2020
Bookrunner, Mandated Lead Arranger & Facility Agent
Oman Gas Company USD 800 million
Term Loan Facility
Feb 2020
Bookrunner & Mandated Lead Arranger
Bank MuscatUSD 650 million
Term Loan
Mar 2020
Bookrunner, Mandated Lead Arranger & Facility Agent
Telecom Egypt CompanyUSD 428 million
Term Loan
Jan 2020
Bookrunner, Mandated Lead Arranger, Facility Agent &
Security Agent
Altitude BorrowerUSD 621 million
Term Loan
Jan 2020
Bookrunner, Mandated Lead Arranger, Facility Agent &
Security Agent
First Abu Dhabi BankUSD 485 million
Senior Unsecured Multi-callable Zero Coupon due 2050
Feb 2020
Structuring Agent
First Abu Dhabi BankAUD 350 million
Senior Unsecured FRN due 2025
Feb 2020
Joint Bookrunner

47
Prestigious awards highlight FAB’s strength and industry expertise
Euromoney• Best Investment Bank in the United Arab Emirates
• Best Bank for Transformation in Middle East
The Banker • Most Innovative Investment Bank from the Middle East
Global Capital• Best Fixed Income of the Year
• Most Impressive Middle East Bank Issuer
Global Trade Review
• Best Trade Finance Bank in MENA
Global Custodian Magazine
• Best UAE Custodian
Bonds, Loans & Sukuk
• Best FI Deal of the Year 2018
• Financial Institution Funding Team of the year
CMD Portal • Best Sukuk Issuer
International Finance Magazine
• Best Cash Management Bank in the UAE
Asia Money • Middle East’s Best Banks for Asia
FinX Awards • Digital Transformation Leader of the Year
WealthbriefingGCC AWARDS
• Fund Manager (Regional Reach)
Global Finance
• Best Bank in UAE
• Best Equity Bank in the Middle East 2018-20
• Best Debt Bank in the Middle East
• Best Investment Bank in the UAE 2018-20
• Best FX provider in UAE
• Best Bank for Cash Management in the Middle East
• Best Bank for Liquidity Management in the Middle East
• Safest Bank in the UAE
• Safest Bank in the Middle East
• Top 50 Safest Bank in Emerging Markets
• Top 50 Safest Commercial Bank
• Top 50 Safest Bank in the World
• The Innovators 2019 for Cash Management
• Best Trade Finance Provider in UAE
EMEA Finance• Best Equity House in the Middle East
• Best M&A House in the Middle East
Seamless • Best Seamless Government Experience
The M&A Atlas Awards
• Emerging Markets M&A Deal of the Year
The Asian Banker • Strongest bank in the UAE and Middle East
Asset Asian Awards
• Sukuk House of the Year - UAE
• Best Islamic Deal of the Year
• Best Islamic Structured Trade Finance Deal of the Year
MENA Fund Manager
• Best Fixed Income of the Year
• UAE Asset Manager of the Year

Scan to download
For more information, please visit www.bankfab.com or contact FAB Investor Relations team at [email protected]
You can also download FAB’s Investor Relations App from App Store /Google Play to access latest corporate updates
THANK YOU!