Accretive Health - Physician Advisory Services - Medical Coding

November 2018
Investor Presentation

2
Disclaimer
Forward-Looking Statements: This presentation contains forward-looking statements which are made pursuant to the safe harbor provisions of Section 27A of the Securities Act of 1933, as amended, and Section 21E of the Securities Exchange Act of1934, as amended.
The forward-looking statements in this presentation do not constitute guarantees of future performance. Investors are cautioned that statements in this presentation, which are not strictly historical statements, including, without limitation, statements by our Executives, and statements concerning our expected future performance, plans, objectives and strategies, constitute forward-looking statements. Such forward-looking statements are subject to a number of risks and uncertainties that could cause actual results to differ materially from those anticipated by the forward-looking statements, including, without limitation, risks associated with our ability to develop and market new products and services that meet customer demands and generate acceptable margins; our reliance on several large customers; our ability to negotiate and enter into acceptable contract terms with our suppliers; our ability to attract and retain qualified management and other personnel; competition in the industry in which we do business; failure of the third-party communications networks on which we depend; legislation or regulatory environments, requirements or changes adversely affecting the businesses in which we are engaged; our ability to maintain our databases, management systems and other intellectual property; our ability to maintain adequate liquidity and produce sufficient cash flow to fund our capital expenditures and debt service; our ability to obtain capital to grow our business; technological developments and changes in the industry; our ability to complete acquisitions or divestures and to integrate any business or operation acquired; general economic condition and other risks detailed in our filings with the Securities and Exchange Commission. Weundertake no obligation to update any forward-looking information contained in this presentation.
Additionally, this presentation may contain various non-GAAP financial measures as defined by the SEC’s Regulation G. More information on the non-GAAP financial measures used in this presentation can be found in the appendix.

3
Expansive
Global Reach
Tier 1 global network able to reach any location
in the world and any application in the cloud
Comprehensive Cloud
Networking Services
WAN & SD-WAN, Managed Services, Internet,
Transport, Infrastructure & Voice
Outstanding
Client Experience
Differentiated service built on our core values
of simplicity, speed and agility
GTT delivers cloud networking
services to multinational clients
Strong
Growth Profile
LQA Revenue: $1.8B (71% 5-year CAGR)
LQA Adj. EBITDA: $434M (86% 5-year CAGR)
GTT Overview
4
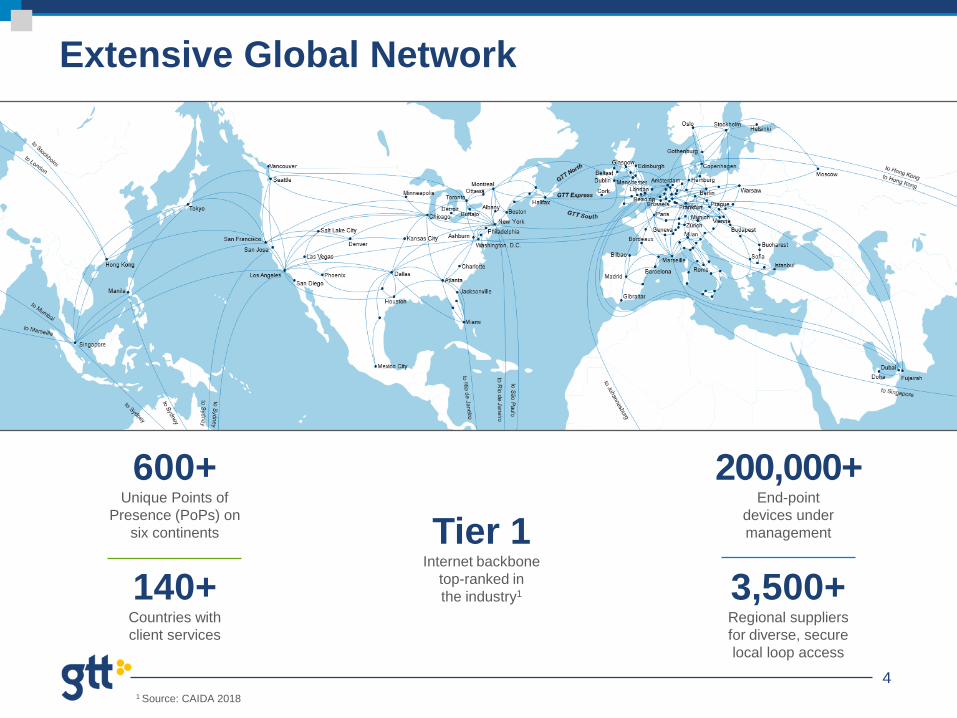
3,500+Regional suppliers
for diverse, secure
local loop access
1 Source: CAIDA 2018
Extensive Global Network
600+ Unique Points of
Presence (PoPs) on
six continents Tier 1Internet backbone
top-ranked in
the industry1
200,000+End-point
devices under
management
140+Countries with
client services

5
Any Location. Any Application.
Voice
InternetWide Area
Networking
Tier 1 Global IP
Network
GTT
PoP
GTT
PoP
Client
Branch Office
GTT
PoP
Client
Headquarters/
Data Center
Public
Internet
Cloud Service Providers
Private
Connection
Security
SD-WAN
Cable
EoC or DSL
3G/4G Wireless
FiberGTT
PoP
Client
Branch Office
Client
Branch Office
Diverse, Secure Last Mile Access
• Leased Ethernet/Broadband connections
• Typically purchased back-to-back with client
contracts
• Substantial majority of monthly network spend
Core Network Connectivity
• Points of Presence (PoPs) in most major carrier neutral data
centers worldwide
• PoPs are connected via wavelengths; utilize owned routes where
available, typically on 1-yr terms to maintain flexibility and
leverage
• Not specific to client contracts; based on aggregate traffic demand
Complete network and device management

6
Key Trends Driving Demand Growth
Apps &
Data per App
• CRM / ERP
• Point of Sale
• IoT
• AI
• Blockchain
• Social media
• Collaboration
Cloud
Adoption
• Compute
• Storage
• Security
• IaaS, PaaS,
BPaaS, SaaS
Virtualization
• Data warehousing
• Big data analytics
• Business
intelligence
• SDN, NFV
Mobility
• Video
• eCommerce
• Payments
• Sharing economy
• Remote workforce
Visibility
& Control
• Application
awareness
• Network access
control
• Network intelligence
• APIs
• SD-WAN, uCPE
Each of these trends generate demand for more network services
GTT helps CIO’s connect people across their organizations
around the world to any application in the cloud

7
Growth Strategy
Balanced approach including rep-driven growth and accretive acquisitions
Next Financial Objectives:
$3B Revenue, $900M Adjusted EBITDA, $5+/share Adjusted FCF
• Rep-Driven
• Grow sales force across GTT’s Divisions
• Upsell / cross-sell to grow wallet share
• Lower churn via superior client service
• Acquisitions
• Small (several per year)
• Large (less frequent)
• ‘Capex Light’ model allows for global
reach and rapid deployment of
bandwidth to meet client needs
• Global scale and Tier 1 IP backbone
enable superior services and value
• Internally developed software platform
(CMD) to handle all aspects of client
lifecycle and profitability
Drivers Differentiators

8
0
200
400
600
800
1,000
1,200
1,400
2009 2010 2011 2012 2013 2014 2015 2016 2017 2018
Transformation Through Strategic M&AAnnualized Revenue
($ in millions)
• Strong strategic fit
– Expand services/reach
– Add clients/sales talent
• Rapid integration of organization, systems and networks
• Highly accretive based on multiple of post-synergy EBITDA
Proven Approach
Adds enterprise-grade voice
services
Adds strategic transatlantic fiber network
Adds managed network services
Completes transformation to Tier 1 IP network
Adds scale & low-cost last-mile
access
Adds scale & strategic
European fiber network
2,000

9
Financial Highlights($ in Millions)
Notes: Financial results are as reported, not including constant currency adjustments and only including acquisitions after their respective close dates;
3Q18 Adjusted EBITDA excludes $95 million of remaining expected annualized cost synergies
Adjusted EBITDA
Capex Adjusted Free Cash Flow
Revenue
Adjusted Free Cash Flow
Adjusted Unlevered Free Cash Flow

10
Liquidity & Leverage
($ in Millions)
(1) Includes $38 million of capitalized building leases from Interoute acquisition; (2) See Slide 18 for more detail regarding pro forma adjustments;
(3) Total Debt less Cash divided by PF 3Q18 TTM Adjusted EBITDA
Cash 48
Available Revolver 179
3Q18 Total Liquidity 226
USD Term Loan 1,766
EUR Term Loan 868
7.875% Due 2024 575
Other Secured Debt (1) 72
3Q18 Total Debt 3,281
Pro Forma 3Q18 TTM Adjusted EBITDA (2) 568
Pro Forma 3Q18 Net Leverage (3) 5.7x
Credit Metrics

11
Investment Highlights
Significant Market
Opportunity
Focused Business
Strategy
Experienced
Leadership Team
Unique Value
Proposition
Compelling
Financial Profile
• Multi-hundred billion dollar growing TAM; GTT market share <1%
• Enterprise bandwidth requirements / IP & cloud traffic / SD-WAN forecast to grow rapidly
• Strongly positioned to win clients underserved by incumbents for high performance solutions
• Deep expertise managing high-growth communications businesses
• Long tenured and experienced board of directors
• Significant management and board ownership
• Exclusively focused on serving national and multinational enterprises and organizations
• Deliver mission-critical services to large, diversified, blue-chip clients with simplicity, speed, agility
• Organic growth engine built; proven ability to identify, close and integrate accretive acquisitions
• Top ranked global Tier 1 IP network with extensive fiber footprint and 3500+ network suppliers
• Flexible commercial model aligning with client requirements in cloud paradigm
• Single business and operating support system efficiently manages all aspects of the client lifecycle
• Significant growth; 71% Revenue CAGR and 86% Adjusted EBITDA CAGR from 2014 - 2018
• MRR of 90%+, expanding margins with low (<7% revenue) capital expenditures drives cash flow
• Strong balance sheet to fund growth

12
Appendix

13
Non-GAAP Financial InformationGTT GAAP to Non-GAAP Reconciliation
In addition to financial measures prepared in accordance with accounting principles generally accepted in the United States (“GAAP”), from time to time GTT may use or publicly
disclose certain "non-GAAP financial measures" in the course of its financial presentations, earnings releases, earnings conference calls, and otherwise. For these purposes, the
U.S. Securities and Exchange Commission (“SEC”) defines a "non-GAAP financial measure" as a numerical measure of historical or future financial performance, financial
positions, or cash flows that (i) exclude amounts, or is subject to adjustments that effectively exclude amounts, included in the most directly comparable measure calculated and
presented in accordance with GAAP in financial statements, and (ii) include amounts, or is subject to adjustments that effectively include amounts, that are excluded from the
most directly comparable measure so calculated and presented.
Non-GAAP financial measures are provided as supplemental information to investors to provide an alternative method for assessing GTT’s financial condition and operating
results. GTT believes that these non-GAAP measures, when taken together with its GAAP financial measures, allow the Company and its investors to better evaluate its
performance and profitability. These measures are not in accordance with, or a substitute for, GAAP, and may be different from or inconsistent with non-GAAP financial
measures used by other companies. These measures should be used in addition to and in conjunction with results presented in accordance with GAAP, and should not be relied
upon to the exclusion of GAAP financial measures.
Pursuant to the requirements of Regulation G, whenever GTT refers to a non-GAAP financial measure it will also present the most directly comparable financial measure
calculated and presented in accordance with GAAP, along with a reconciliation of the differences between the non-GAAP financial measure GTT references with such
comparable GAAP financial measure.
Adjusted Earnings before Interest, Taxes, Depreciation and Amortization (“Adjusted EBITDA”)
Adjusted EBITDA is defined by GTT as net income/(loss) before interest and other expense, net, income tax (benefit) expense and depreciation and amortization ("EBITDA")
adjusted to exclude severance, restructuring and other exit costs, acquisition-related transaction and integration costs, losses on extinguishment of debt, share-based
compensation, and from time to time, other non-cash or non-recurring items. The Pro Forma EBITDA and Pro Forma Adjusted EBITDA in this presentation represent GTT’s
EBITDA and Adjusted EBITDA, respectively, after giving effect to the Global Capacity and Interoute acquisitions as of the first day of the period presented and adding anticipated
estimated cost savings synergies from the Global Capacity and Interoute acquisitions and Adjusted EBITDA from individually immaterial acquisitions after giving effect to such
acquisitions as if each had occurred on January 1, 2017. GTT uses Adjusted EBITDA to evaluate operating performance, and this financial measure is among the primary
measures we use for planning and forecasting future periods. GTT further believes that the presentation of Adjusted EBITDA is relevant and useful for investors because it
allows investors to view results in a manner similar to the method used by management and makes it easier to compare GTT’s results with the results of other companies that
have different financing and capital structures. However other companies may define Adjusted EBITDA differently than GTT does, so its Adjusted EBITDA may not be fully
comparable with those of other companies. In addition, the Company has debt covenants that are based on a leverage ratio which utilizes a modified EBITDA calculation, as
defined in its credit agreement. The modified EBITDA calculation in GTT’s credit agreement is similar to its definition of Adjusted EBITDA; however it includes the pro forma
Adjusted EBITDA of and expected cost synergies from the companies acquired by GTT during the applicable reporting period. Finally, Adjusted EBITDA results, along with other
quantitative and qualitative information, are utilized by management and GTT’s compensation committee for purposes of determining bonus payouts to its employees.
14
Non-GAAP Financial InformationAdjusted Free Cash Flow and Adjusted Unlevered Free Cash Flow
Adjusted Free Cash Flow is defined as net cash provided by operating activities less purchases of property and equipment, adjusted to exclude cash paid for severance,
restructuring and other exit costs, and acquisition related transaction and integration costs. Adjusted Unlevered Free Cash Flow is defined as Adjusted Free Cash Flow before
interest. Adjusted Free Cash Flow and Adjusted Unlevered Free Cash Flow are not a measurement of our financial performance under GAAP and should not be considered in
isolation or as alternatives to net cash flows provided by operating activities, total net cash flows, or any other performance measure derived in accordance with GAAP.
Pro Forma Financial Information
In addition to financial measures prepared in accordance with GAAP, from time to time we may use or publicly disclose certain "pro forma” financial measures. We believe
certain pro forma financial measures provide a more comparable view of our results relative to prior periods, particularly given the number of acquisitions we have completed in
the past. The following unaudited pro forma financial information and related notes present the historical financial information of GTT as if the acquisition of Hibernia had
occurred on the first day of the applicable period presented, and do not include any add-backs for expected post-acquisition cost synergies in pre-acquisition periods. Note: pro
forma information is only prepared for material acquisitions.
Constant Currency
We evaluate our results of operations both as reported and on a constant currency basis. The constant currency presentation, which is a non-GAAP measure, excludes the
impact of fluctuations in foreign currency exchange rates. We believe providing constant currency information provides valuable supplemental information regarding our results of
operations, consistent with how we evaluate our performance. We calculate constant currency results by converting our current period local currency financial results using prior
period exchange rates and comparing these adjusted amounts to our prior period reported results.

15
Non-GAAP Reconciliation (Annual)($ in Millions, except price per share)
Adjusted EBITDA 2014 2015 2016 20173Q18
Annualized
Net Income (loss) (23.0)$ 19.3$ 5.3$ (71.5)$ (93.6)$
Income tax (benefit) expense 2.1 (34.1) 3.9 17.3 (6.4)
Other (income) loss, net 8.6 1.2 0.6 (0.2) (32.4)
Loss on debt extinguishment 3.1 3.4 1.6 8.6 -
Interest expense, net 8.5 13.9 29.4 71.2 190.4
Depreciation and amortization 24.9 46.7 62.8 132.6 234.0
Severance, restructuring and other exit costs 9.4 12.7 0.9 22.4 62.0
Transaction and integration costs - 6.1 4.8 19.1 42.8
Non-cash compensation 2.4 7.9 15.8 22.2 36.8
Adjusted EBITDA 36.1$ 77.0$ 125.1$ 221.7$ 433.6$
Adjusted Free Cash Flow 2014 2015 2016 2017 3Q18 TTM
Net cash provided by operating activities (6.5)$ 24.6$ 60.4$ 63.4$ 66.3$
Purchase of property and equipment (5.8) (14.1) (24.2) (42.0) (76.5)
Severance, restructuring and other exit costs 6.0 8.0 4.5 15.9 28.8
Transaction and integration costs - 6.1 4.8 19.1 30.8
Adjusted Free Cash Flow (6.3)$ 24.6$ 45.5$ 56.4$ 49.4$
Cash paid for interest 8.0 13.1 26.3 47.2 110.6
Adjusted Unlevered Free Cash Flow 1.7$ 37.7$ 71.8$ 103.6$ 160.0$

16
Non-GAAP Reconciliation (Quarterly)($ in Millions, except price per share)
Adjusted EBITDA 4Q17 1Q18 2Q18 3Q183Q18
Annualized
Net Income (loss) (49.5)$ (30.7)$ (136.3)$ (23.4)$ (93.6)$
Income tax (benefit) expense 40.0 1.6 (1.1) (1.6) (6.4)
Other (income) loss, net (0.1) 17.4 97.6 (8.1) (32.4)
Loss on debt extinguishment - - 13.8 - -
Interest expense, net 20.5 20.9 30.2 47.6 190.4
Depreciation and amortization 37.9 39.8 48.2 58.5 234.0
Severance, restructuring and other exit costs 0.5 1.9 5.3 15.5 62.0
Transaction and integration costs 5.3 6.0 8.4 10.7 42.8
Non-cash compensation 6.2 5.9 8.8 9.2 36.8
Adjusted EBITDA 60.8$ 62.7$ 74.9$ 108.4$ 433.6$
Adjusted Free Cash Flow 4Q17 1Q18 2Q18 3Q18 3Q TTM
Net cash provided by operating activities 16.3$ 12.2$ 15.6$ 22.2$ 66.3$
Purchase of property and equipment (15.1) (13.2) (19.3) (28.9) (76.5)
Severance, restructuring and other exit costs 6.5 4.7 6.9 10.7 28.8
Transaction and integration costs 6.1 3.9 9.9 10.9 30.8
Adjusted Free Cash Flow 13.8$ 7.6$ 13.1$ 14.9$ 49.4$
Cash paid for interest 8.2 31.3 30.0 41.1 110.6
Adjusted Unlevered Free Cash Flow 22.0$ 38.9$ 43.1$ 56.0$ 160.0$

17
Pro Forma Adjusted EBITDA
(1) Pro forma adjustments include (i) net adjustments in deferred revenue and deferred costs from acquired company and (ii) adjustments related
to converting operating results from IFRS to U.S. GAAP
(2) Includes pre-close reported Adjusted EBITDA for Custom Connect and ACI
(3) Synergies from all acquisitions not realized during the reporting period
($ in Millions)