Investor Presentation - first-resources.com fileInvestor Presentation Aug 2015 . 2 Table of Contents...
23
First Resources Limited Delivering Growth and Returns Investor Presentation Aug 2015
Transcript of Investor Presentation - first-resources.com fileInvestor Presentation Aug 2015 . 2 Table of Contents...

First Resources Limited
Delivering Growth and Returns
Investor Presentation Aug 2015

2
Table of Contents
Group Overview 3
6M/2Q2015 Financial Performance 8
6M/2Q2015 Operational Performance 14
Group Updates 19

Group Overview

4
A Fast-Growing Plantation Group…
198,694 ha of plantations
Nucleus: 144,740 ha
Plasma: 53,954 ha
13 palm oil mills
Capacity of 4.32 million
tonnes of FFB p.a.
Processing facilities
Refinery, fractionation &
biodiesel plants (combined
capacity of 850,000 tonnes p.a.)
Kernel crushing plant (capacity
of 105,000 tonnes p.a.)
Plantations are located in the Riau, East Kalimantan and West Kalimantan
provinces of Indonesia
Locations
Assets
Profile
Established in 1992; listed on
Singapore Exchange in Dec 2007
Market Capitalization of ~ S$2.4
billion as at end Aug 2015
Data as at 30 June 2015

5
With a Strong Growth Profile
Strong growth expected from existing plantation assets due to young age profile
FFB Yield vs. Tree Age
(tonnes/ha)
Expected Growth from Existing Asset Base
CPO Production
(‘000 tonnes)
Estimated production potential based on
current planted hectarage
Prime Production from 8th – 17th year
Data as at 30 June 2015
Young Plantation Profile

6
Upstream Agri-
Business Focus
Active Cost
Containment
Responsible
Cultivation
Maintain our low-cost structure through best-in-class operational
efficiency and stringent cost management
To achieve superior margins and greater resilience to price cycles by
being at the low end of the industry cost curve
Continuously strengthen our multi-faceted sustainability policy across
the Group’s entire operations
To maximise market access through sustainable palm oil production
Growth Strategy: Building on our Core Expertise
Develop and maintain high-quality plantation assets, and ensure
optimal milling capacity in line with FFB production growth
To achieve sustainable production growth

7
A Leading Plantation Group with Integrated
Operations Throughout the Value Chain
Plantations Milling Processing
Fresh Fruit Bunches RBDPO
PFAD
RBD Olein
RBD Stearin
Biodiesel
Crude
Glycerine
PKE
PKO
Crude Palm Oil
Palm Kernel
Ac
tivit
y
As
se
ts
Pro
du
cts
198,694 ha of plantations
• Nucleus : 144,740 ha
• Plasma : 53,954 ha
13 CPO mills
Capacity of 4.32 million tonnes
of FFB p.a.
Refinery, fractionation &
biodiesel plants (with combined
capacity of 850,000 tonnes p.a.)
Kernel crushing plant (capacity
of 105,000 tonnes p.a.)
Note: Data as at 30 June 2015

6M/2Q2015 Financial Performance

9
Income Statement Highlights
US$’ million 6M2015 6M2014 Change 2Q2015 2Q2014 Change
Sales 215.1 290.1 (25.9%) 118.8 112.2 5.9%
Cost of sales (97.0) (154.4) (37.2%) (58.8) (51.2) 14.7%
Gross profit 118.1 135.7 (13.0%) 60.0 60.9 (1.5%)
EBITDA(1) 108.1 125.7 (14.0%) 54.7 58.3 (6.2%)
Net profit attributable to owners of
the Company 56.3 71.1 (20.8%) 28.6 26.1 9.8%
46.8
(1) Profit from operations adjusted for depreciation and amortisation
Gross profit margin 54.9% 46.8% 50.5% 54.3%
EBITDA margin 50.3% 43.3% 46.0% 51.9%
The increase in sales in 2Q2015 was mainly due to higher sales volumes of palm based products. However, the
persistent weakness in palm oil prices continued to impact sales in 2Q2015 and 6M2015.
Cost of sales increased in 2Q2015 in line with the higher sales volumes, while margins were impacted by lower
average selling prices.
For 6M2015, the lower cost of sales and margin improvements were due to reduction in purchases of FFB and
palm oil products from third parties.

10
Segmental Results
(1) Inter-segment elimination of EBITDA relates to the elimination of unrealised profit on inter-segment sales
US$’ million 6M2015 6M2014 Change 2Q2015 2Q2014 Change
Sales
Plantations and Palm Oil Mills 226.3 244.5 (7.4%) 118.6 108.8 9.0%
• Crude Palm Oil 193.9 215.0 (9.8%) 101.0 92.9 8.7%
• Palm Kernel 28.7 27.3 5.2% 15.8 13.7 15.2%
• Fresh Fruit Bunches 3.7 2.2 68.5% 1.8 2.2 (18.9%)
Refinery and Processing 100.1 174.4 (42.6%) 76.8 74.2 3.5%
Inter-segment elimination (111.3) (128.8) (13.6%) (76.6) (70.8) 8.2%
215.1 290.1 (25.9%) 118.8 112.2 5.9%
EBITDA
Plantations and Palm Oil Mills 111.9 108.8 2.9% 59.0 44.4 32.9%
Refinery and Processing 2.3 18.4 (87.6%) 0.8 15.5 (94.8%)
Inter-segment elimination(1) (6.1) (1.5) 296.9% (5.2) (1.7) 209.5%
108.1 125.7 (14.0%) 54.7 58.3 (6.2%)

11
Segmental Sales and EBITDA – 6M2015
Sales EBITDA
Note : Sales and EBITDA by business segment is stated before inter-segment elimination
The Group’s Plantations and Palm Oil Mills segment remains the main contributor to EBITDA.

12
6M2015 6M2014 Change 2Q2015 2Q2014 Change
Sales Volume (tonnes)
Plantations and Palm Oil Mills(1)
• Crude Palm Oil 317,871 297,288 6.9% 170,304 132,417 28.6%
• Palm Kernel 73,521 61,494 19.6% 39,929 27,663 44.3%
Refinery and Processing 165,529 226,814 (27.0%) 123,681 98,444 25.6%
Overall increase in sales volumes of CPO and PK was driven by higher production volumes.
Higher sales volumes of processed palm based products in 2Q2015 was due to increased utilisation at the
Group’s processing plants.
Sales volumes for 6M2015 was also impacted by a net inventory buildup of ~ 22,000 tonnes (6M2014: net
drawdown of ~ 4,000 tonnes).
(1) Sales volume include inter-segment sales
Segmental Sales Volume

13
Balance Sheet Highlights
US$’ million 30 June 2015 31 Dec 2014
Total Assets 1,913.1 1,997.9
Cash and bank balances 291.2 350.9
Total Liabilities 856.2 882.1
Borrowings and debt securities(1) 530.6 583.1
Total Equity 1,056.9 1,115.8
Net Debt 239.4 232.2
Net Debt(2)/Total Equity 0.23x 0.21x
Net Debt(2)/EBITDA(3) 1.11x 0.77x
EBITDA/Interest Expense(4) 9.4x 15.5x
(1) Sum of Islamic MTNs and borrowings from financial institutions
(2) Borrowings and debt securities less cash and bank balances
(3) Annualised
(4) Total interest/profit distribution paid/payable on borrowings and debt securities

6M/2Q2015 Operational Performance

15
6M2015 6M2014 Change 2Q2015 2Q2014 Change
Production
FFB harvested (tonnes) 1,212,833 1,026,287 18.2% 632,270 525,213 20.4%
• Nucleus 1,090,631 923,110 18.1% 571,381 476,659 19.9%
• Plasma 122,202 103,177 18.4% 60,889 48,554 25.4%
FFB purchased (tonnes) 156,794 163,627 (4.2%) 87,820 87,310 0.6%
CPO (tonnes) 304,011 266,212 14.2% 158,791 134,738 17.9%
PK (tonnes) 71,214 62,116 14.6% 37,774 30,963 22.0%
Efficiency
FFB Yield (tonnes/ha) 8.4 7.8 4.4 4.0
CPO Yield (tonnes/ha) 1.9 1.8 1.0 0.9
CPO Extraction Rate (%) 22.8 22.7 22.5 22.3
PK Extraction Rate (%) 5.3 5.3 5.4 5.1
Production Highlights
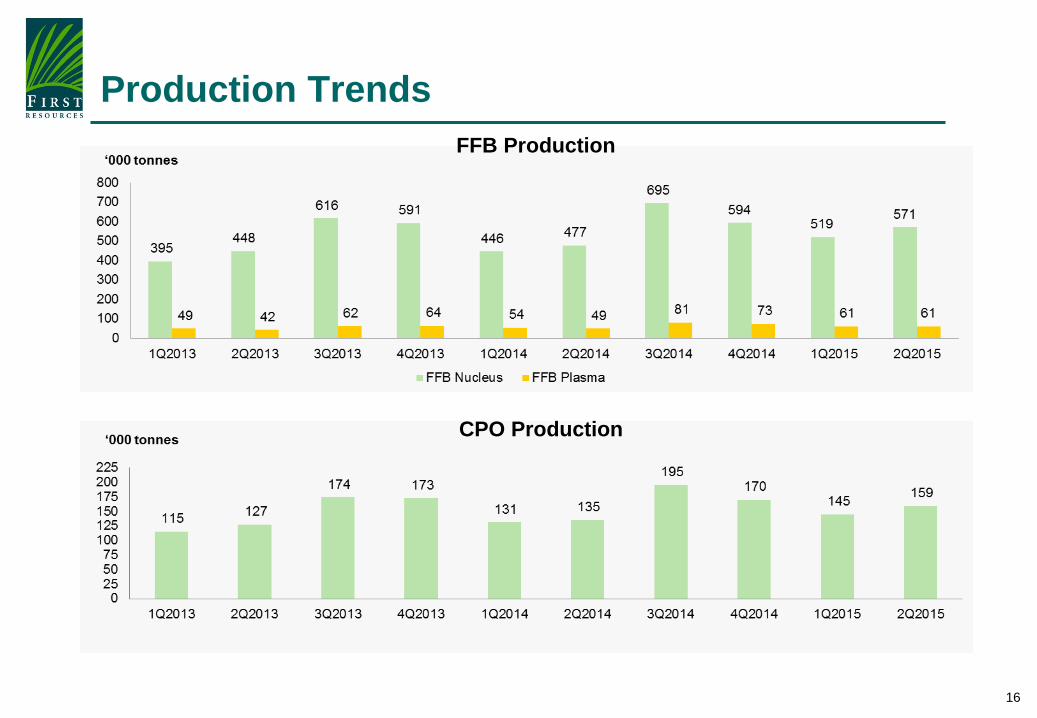
FFB production increased due to contribution from newly mature hectarage as well as yield recovery of plantations.
Overall yields improvement due to yield recovery experienced in Riau estates.
16
Production Trends
FFB Production
CPO Production
17
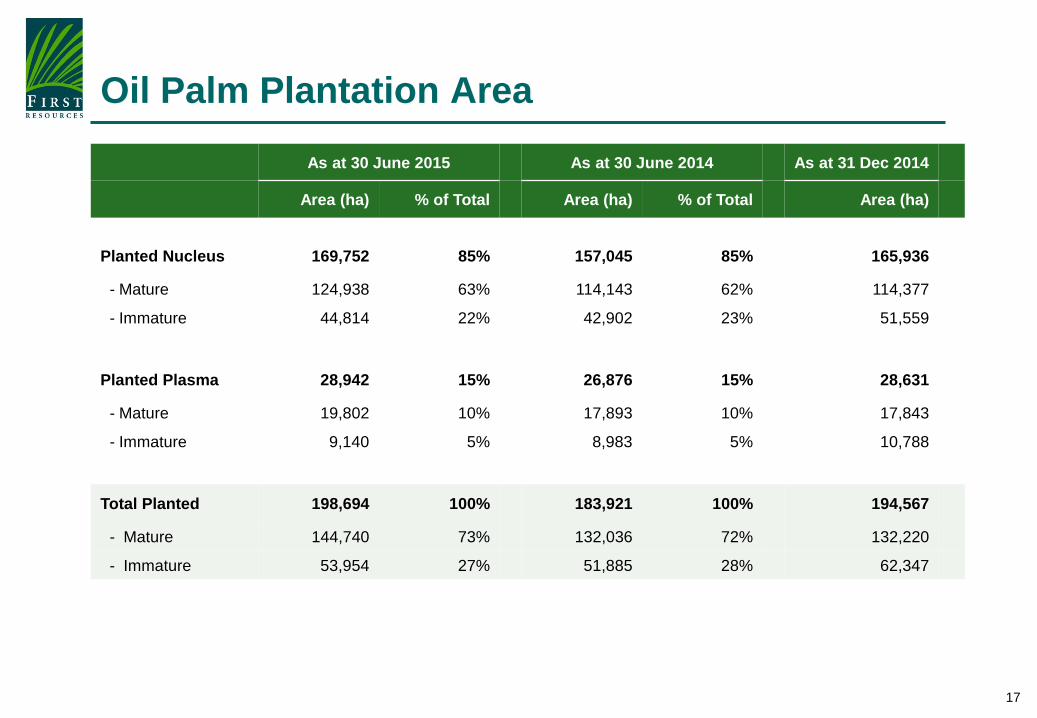
Oil Palm Plantation Area
As at 30 June 2015 As at 30 June 2014 As at 31 Dec 2014
Area (ha) % of Total Area (ha) % of Total Area (ha)
Planted Nucleus 169,752 85% 157,045 85% 165,936
- Mature 124,938 63% 114,143 62% 114,377
- Immature 44,814 22% 42,902 23% 51,559
Planted Plasma 28,942 15% 26,876 15% 28,631
- Mature 19,802 10% 17,893 10% 17,843
- Immature 9,140 5% 8,983 5% 10,788
Total Planted 198,694 100% 183,921 100% 194,567
- Mature 144,740 73% 132,036 72% 132,220
- Immature 53,954 27% 51,885 28% 62,347

18
Plantation Age Profile
Age As at 30 June 2015
Area (ha) % of Total
0-3 years (Immature) 53,954 27%
4-7 years (Young) 52,690 26%
8-17 years (Prime) 48,966 25%
≥ 18 years (Old) 43,084 22%
Total 198,694 100%
Weighted average age of 9 years
Immature27%
Young26%
Prime25%
Old22%

Group Updates

20
Updates
Outlook
In the near term, palm oil prices will continue to be impacted by subdued demand as well as low
prices of crude oil and other edible oils.
Long-term outlook of the palm oil industry remains positive, supported by underlying demand
growth from emerging markets and higher biodiesel mandate in Indonesia.
Production growth to continue for the rest of the year, as we enter the production up-cycle that
typically takes place in the 3rd and 4th quarters.
Group remains convinced of the viability of the palm oil business
21
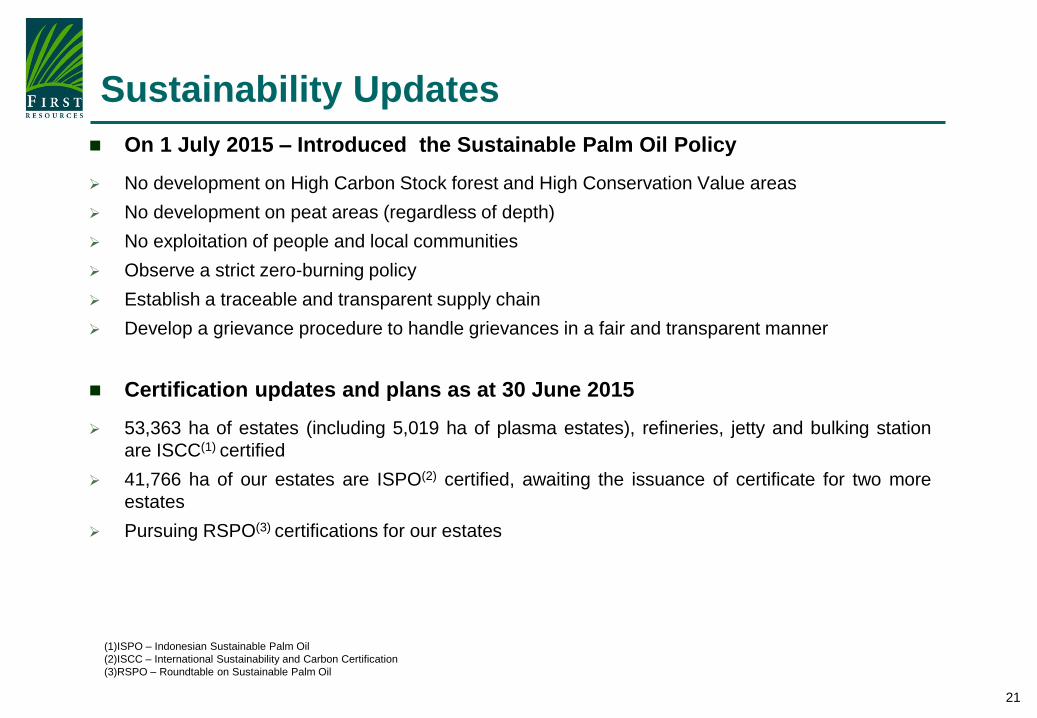
Sustainability Updates
On 1 July 2015 – Introduced the Sustainable Palm Oil Policy
No development on High Carbon Stock forest and High Conservation Value areas
No development on peat areas (regardless of depth)
No exploitation of people and local communities
Observe a strict zero-burning policy
Establish a traceable and transparent supply chain
Develop a grievance procedure to handle grievances in a fair and transparent manner
Certification updates and plans as at 30 June 2015
53,363 ha of estates (including 5,019 ha of plasma estates), refineries, jetty and bulking station
are ISCC(1) certified
41,766 ha of our estates are ISPO(2) certified, awaiting the issuance of certificate for two more
estates
Pursuing RSPO(3) certifications for our estates
(1)ISPO – Indonesian Sustainable Palm Oil
(2)ISCC – International Sustainability and Carbon Certification
(3)RSPO – Roundtable on Sustainable Palm Oil

22
Disclaimer
This presentation has been prepared by First Resources Limited (“Company”) for informational
purposes, and may contain projections and forward-looking statements that reflect the Company’s
current views with respect to future events and financial performance. These views are based on
current assumptions which are subject to various risks and which may change over time. No
assurance can be given that future events will occur, that projections will be achieved, or that the
Company’s assumptions are correct.
The information is current only as of its date and shall not, under any circumstances, create any
implication that the information contained therein is correct as of any time subsequent to the date
thereof or that there has been no change in the financial condition or affairs of the Company since
such date. Opinions expressed herein reflect the judgement of the Company as of the date of this
presentation and may be subject to change. This presentation may be updated from time to time
and there is no undertaking by the Company to post any such amendments or supplements on this
presentation.
The Company will not be responsible for any consequences resulting from the use of this
presentation as well as the reliance upon any opinion or statement contained herein or for any
omission.

23
Contact Information
For further information, please contact:
Investor Relations
First Resources Limited 8 Temasek Boulevard
#36-02 Suntec Tower Three
Singapore 038988
Tel: +65 6602 0200
Fax: +65 6333 6711
Website: www.first-resources.com