Investor Presentation Dec 2014 - BankMuscat · Oman Banking Sector –Overview Overview The Omani...
30
Transcript of Investor Presentation Dec 2014 - BankMuscat · Oman Banking Sector –Overview Overview The Omani...


Agendag
I. bank muscat Introduction 3
II Operating Environment 6II. Operating Environment 6
III. bank muscat Business Overview 11
IV Fi i l P f 21IV. Financial Performance 21
V. Annexure 26
Note: The financial information is updated as of 31th December 2014, unless stated otherwise.

I. bank muscatmuscat Introduction

bank muscat at a GlanceO i O hiOverview Ownership
#1 Bank in Oman with a significant customer base in excess of 1.7 million clients and a workforce of 3,607 employees as of 31th December 2014
Established in 1982, headquartered in Muscat with 148 branches across
Royal Court Affairs24%
Oman, 2 branches overseas, and 2 representative offices Fully diversified commercial bank offering corporate and retail banking
services Primarily domestic dominated operations with over 95% of operating
income generated in Oman Meethaq – pioneer of Islamic Banking services in Oman officially
Dubai Financial Group LLC
12%
Others44%
Meethaq pioneer of Islamic Banking services in Oman, officially launched in January 2013 with full fledged product and services offering
Long term Bank Rating : Moody’s A1 , Fitch A‐ , S&P A‐ Listed on the Muscat Securities Market, London Stock Exchange & Bahrain
Stock Exchange.
Ministry of Defence Pension
Fund7%Civil Services
Pension Fund
Muscat Overseas Group4%
IFC5%
bank muscat Growth – Footsteps of a Leader Throughout Decades
Meethaq Merger between bank of muscat &
Acquisition of the Bahraini operations
Acquisition of strategic stake in Mangal Keshav
Muscat Capital LLC l h d
Establishment of bank of muscat
Merger of BMI Bank with Al Salam
4%
1982
launched
20131993
bank of muscat & Bank Al Ahli Al Omani
2002
Bahraini operations of ABN AMRO
2004 2007
stake in Mangal Keshav Holdings
2010
launched
20121996 2003 20062005 2008 200920012000
bank of muscat
2014
Bank with Al Salam Bank, Bahrain
Acquisition of 49% stake in BMI Bank
1st Branch in Saudi Arabia
1st Branch in Kuwait
Dubai Rep Office
Singapore Rep Office
Merger with Commercial Bank of Oman
4
Exit of stake in Mangal Keshav

bank muscat – Key HighlightsDominant Franchise in Oman
Largest Bank in Oman with a market share of 37.98% in terms of assets as of 30th Nov 2014
Market Capitalisation of USD 3.3 billion Largest branch network with 148 domestic Highest Government Ownership
Dominant Franchise in Oman
S lid C it l P itig
branchesHighest Government Ownership
Highest Government Ownership among Omani Banks Royal Court Affairs: 23.58%
Indirect Government ownership of 16%
Solid Capital Position
Strong capitalization levels offering room for substantial growth
CAR of 15.92% as of 31th Dec 2014 B l III l ti
Stable Operating EnvironmentStable Asset Quality
Indirect Government ownership of 16% through various pension funds
Conservative lending approach S i k hi d li i
Solid macroeconomic conditions St bl b ki t
as per Basel III regulations.
Ratings: A1/A‐/A‐
ManagementStrong Financial Metrics
Strong risk architecture and policies Adequate asset quality metrics
Stable banking sector Prudential regulatory
environment
Most profitable bank in Oman Strong and sustainable profitability
metrics:‐Operating profit 2009‐2014 CAGR of 5.7%Net profit 2009 2014 CAGR of 20 5%
Stable and experienced management with proven track record of successful organic and inorganic growth
Good corporate governance ‐Net profit 2009‐2014 CAGR of 20.5%
5

II. Operating Environment

Sultanate of Oman – Overview Key Indicators (1) 2013E 2014F
Af h i t
Overview
2nd Largest country in the GCC with an area covering approx. 309.5 thousands Km2, strategically located, sharing borders with Saudi Arabia and UAE
Stable Political System – Monarchy led by His Majesty Sultan Qaboos who commands wide popular support and respect from Omani citizens.
Sovereign Ratings A1/A/‐
Current Account Balance
US$2.1bn US$4.5bn
International Reserves US$15.5bn US$16.6bn
SaudiArabia
EgyptPakistan
India
Libya
Afghanistan(1) Economist Intelligence Unit – January 2013
popular support and respect from Omani citizens.
Oman explicitly aims to create a neo‐liberal free market economy, where the private sector is the driver of the economy as opposed to the state.
The economy will continue to grow at high rates driven by several factors, such as: The increase in hydrocarbon production and stability in its prices. The Government’s continuous pursue of a stimulus fiscal policy and a backing monetary
policy. A strengthened and growing local demand; driving growth within the services and activities
Net Public Debt (% GDP)
7.00% 7.30%
OmanYemen
North SudanChad
contribution to GDP.
“Vision 2020” – focuses on diversification, industrialization and privatization, with the objective of reducing economic reliance on oil revenues and the hydrocarbon sector contribution to GDP.
Approx 40 major projects worth a total of $112bn are being executed or are being planned in Oman. $56bn of major projects are due for completion by the end of 2017. All $112bn of projects are due for completion by the end of 2022.
GDP Growth GDP Composition – “Vision 2020”
US$ billion 20202014
73 78 8412.8%
Transport & Communication
7%
FI's4%
Q2'2014Transport &
CommunicationFI's8%
37 42
6148
59
5.5% 6.7% 1.1%
4.8% 4.0%5.8% 4.8%
Petro activities46%
Mfg,mining & construction
12%
Petro activities19%
Trade, tourism & real estate
26%
Mfg,mining & construction
17%
8%
Source: Central Bank of Oman and EIU December 2013 Report.
7
2006 2007 2008 2009 2010 2011 2012 2013
GDP in Current Prices (US$bn) Real GDP (% Change)Trade, tourism & real estate
13%
Others18%
Others22%

Oman Banking Sector – Overview
Overview
The Omani banking sector comprises of 9 local banks, 2 specialized banks, 9 foreign commercial banks and two full fledged Islamic Banks.
The top 3 banks contribute to around 62% of total sector assets and Bank
Loans and Deposit Growth Gross Loan: +10.4%Deposits: +12.4%
US$ billion
37.239.4
43.736.8
40.545.0
pMuscat represents 37% of total sector
Conservative and Prudent Regulator
A number of regulations and caps in place to support the growth, stability and sustainability of the Omani banking sector
Adequate asset quality with relatively low impaired assets and sound
25.5 27.932.5
23.827.3
32.7
dequate asset qua ty t e at e y o pa ed assets a d sou dcapitalization
Implementing Basel 3 regulation with effect from Jan 2014
Oman in the GCC banking sector context(1) BICRA Positioning – Group 4 $ b ll
2009 2010 2011 2012 2013 Nov‐14
Gross loan Deposits
US$ billion
630
7.9%
1.9%2.6%
5.5%7.1%
3.9%7.0%
12.0%
412 250 175 18564 ‐3.0%
2.0%
UAE Saudi Arabia Qatar Kuwait Bahrain Oman
The Omani Banking Sector carries a Banking Industry Country Risk Assessment (BICRA) score of 4 and is well positioned on a GCC, emerging market and global basis
Source: GCC Central Bank websites and S&P BICRA Report February 2013.Notes: (1) Moody’s as of February 2013 and Central Bank websites based on the latest available figures for the GCC banking sectors. US$/ AED: 3.67, US$/ SAR: 3.749, US$/ QAR: 3.64, KD/ US$: 0.284, and OMR/ US$: 0.3858
UAE Saudi Arabia Qatar Kuwait Bahrain OmanTotal Assets NPL/ GLs

bank muscat – Unrivaled Leading Market Position in Oman
Total Assets Gross Loans US$ million US$ million
6 223
18,298
National Bank of Oman
bank muscat
8 296
25,268
Bank Dhofar
bank muscat
3,655
3,779
6,084
6,223
Ahli Bank
Bank Sohar
Bank Dhofar
National Bank of Oman
5,390
5,826
7,730
8,296
Bank Sohar
HSBC Bank Oman
National Bank of Oman
Bank Dhofar
Deposits Net Profit
3,190
3,276
Oman Arab Bank
HSBC Bank Oman
4,273
4,403
Ahli Bank
Oman Arab Bank
US$ millionUS$ million
104
125
426
Bank Dhofar
National Bank of Oman
bank muscat
5 656
6,447
16,481
National Bank of Oman
Bank Dhofar
bank buscat
55
65
91
HSBC B k O
Oman Arab Bank
Ahli Bank
Bank Sohar
3,519
4,030
4,811
5,656
Oman Arab Bank
Bank Sohar
HSBC Bank Oman
National Bank of Oman
9
31HSBC Bank Oman2,795Ahli Bank
*Oman Arab Bank- Data as of 30th Sep 2014

bank muscat – Dominant Domestic Franchise in the Region( ) ( )
Sector Contribution – Assets (1)
Sector Contribution – Deposits (1)
Assets as % of Total Sector Assets Deposits as % of Total Sector Deposits
15 7% 16 3%28.4%
39.3% 42.3%53.4%
40.2%31.8% 36.6%
69.8%
Asset Quality (1)
Adequate Capitalization (1)
4.8%12.6% 15.7% 16.3%
BBK CBQ ENBD NBAD NCB BM NBK QNB
11.3% 15.9% 18.9% 12.1%
BBK CBQ ENBD NBAD NCB NBK BM QNB
0.6% 4.4% 2.7% 0.9% 0.5%
15.6% 19.6% 19.9% 17.1% 15.9% 17.3% 14.1% 14.3 %
123.2%
165.9%
129.5%
156.1%58.7%
120 0%140.0%160.0%180.0%
15.0%
15.3% 17.2% 16.2%13.0%
16.8%12.6%
12.9%
2.9% 1.5% 1.4%
3.5%1 5% 1 4% 2.8% 3.5% 2.3%
8.1%14.0%
63.0%85.2% 75.1%
20.0%40.0%60.0%80.0%100.0%120.0%
QNB ENBD NBAD NCB BM NBK CBQ BBK
Tier 1 Tier 2Source: (1) Information for all the banks is based on latest published reports.GCC Central Banks. Banks’ financial Statements.US$/ AED: 3.67, US$/ SAR: 3.749, US$/ QAR: 3.64, KD/ US$: 0.284, BHD/US$:0.377 and OMR/ US$: 0.38510
1.5% 1.4% 0.0%
CBQ QNB NCB BM NBAD NBK BBK ENBDNPL/GL LLR/NPL

III bank muscat BusinessIII. bank muscat Business Overview

bank muscat Strategy – Key Pillars
Consolidate Leading
Capitalize on growth opportunities in Oman
Infrastructure development projects and Government focus on economic diversification and developing tourism
Omanis entering the workforce; over 49% of the population less than 25 years old Leverage large network of branches and other delivery channels Consolidate Leading
Position in Oman Leverage large network of branches and other delivery channels
Platform to focus on the growth potential
Cross sell opportunities Focus on fee based income
Scale up fee driven businesses both in the retail (credit card, asset management, private banking) and corporate (investment banking) segments
Leverage on existing platform and investments
Pioneering investments in technology supporting growth plans
Increase efficiency
Continuous customer service and support improvementsinvestments Continuous customer service and support improvements
Regional Expansion Strengthen regional presence through focused and controlled expansion in GCC
Leverage existing regional presence to scale up business growth Leverage existing regional presence to scale up business growth
Focus on Islamic Banking D l t i O
Meethaq – Islamic banking platform
Full fledged product and service offerings, standard of excellence, customer centric approach and Developments in Oman g p g , , pptransparency
12

bank muscat – Business Lines
Corporate Banking
Key Highlights Asset Contribution
Leading Corporate Bank Franchise offering the full array of corporate banking services
c 3 664 corporate customers in Oman
US$ 10.13 billion
40% of total asset
Profit Contribution
US$124.9 million
29% of total profitBanking
Retail Banking
c. 3,664 corporate customers in Oman Strong expertise in project finance
Leading Retail Bank platform in Oman Over 1.735 million retail customers in Oman Largest distribution network
US$ 6.55 billion
26% of total asset
US$143.64 million
34% of total profitg
Wholesale B ki
Largest distribution network
Comprise of treasury, brokerage, corporate finance, asset management and private banking
i
US$ 5.78 billion
23% of total asset
US$ 145.30 million
34% of total profitBanking
International O ti
services Financial Institutions
Presence in GCC, India and Singapore through overseas branches, rep offices and subsidiaries
US$ 1.70 billion
7% of total asset
US$ (9.3)million
‐2% of total profitOperations
h
OMR 30mn (c.US$52mn) capital assigned to this business as of 31st Oct 2014
US$ 1.11 billion
4% f t t l t
US$ 19.44 million
5% f t t l fitMeethaq Officially launched in January 2013. Currently operating through 10 full fledged Islamic branches with a plan to expand the network to 25 branches by the end of 3rd year and expand thereafter .
4% of total asset 5% of total profit
13

Corporate Banking
Overview Opportunities Strategy
Large number of infrastructure/ Industrial projects in the pipeline
Privatisation and diversification drive by
Leverage on leading position and expertise
Reinforce presence in Oman across all segments in the value chain
Leading Corporate Banking Franchise
Extensive and expanding range of products and services y
Government
Increasing business flows between Oman and regional countries
segments in the value chain
Benefit from large infrastructure and industrial projects in Oman
Focus on less capital intensive and fee income generating business
Explore contractor financing opportunities
and services
Strong project finance capabilities
Large corporate client portfolio with c.3,664 customers and lead bank for top tier Omani corporate entities
High level of sophistication differentiated Explore contractor financing opportunities
Utilize presence in regional markets
Grow GCC trade flows share
High level of sophistication differentiated through technology led investments
Commitment to maintain strong control over asset quality
C L PCorporate Loans – Peer Comparison Asset Growth Operating Income
US$ million US$ millionUS$ million11.14
177206 213 226 229 247
5,696 6,0387,107
8,752 9,346 10,1343.36 3.51
2.46 2.09 2.11 2.00
2009 2010 2011 2012 2013 2014Operating Income
2009 2010 2011 2012 2013 2014Total Assets
14
BankMuscat
Bank Dho
far
NBO
Bank Soh
ar
HSBC
Oman
Ahli Ba
nk
Oman
Arab
Bank
*Oman Arab Bank- Data as of 30th Sep 2014

Retail Banking
Overview Opportunities Strategy
Government spending resulting in job creation
Increase in salaries through various
Leveraging on leading presence in the retail segment
Increase penetration and cross sell
Leading Retail Banking Franchise in Oman
Over 1.735 million customersg
government initiatives
Favorable demographics
Over 49% of the population less than 25 years old
Housing finance
Increase penetration and cross sell
Technology‐led product development and service offerings
Enhance process efficiency
Focus on development and utilization of e‐delivery channels
Front‐runner across retail banking segments including cards, bancassuranceand remittances
Largest delivery channel network in Oman (148 branches, 438 ATMs, 168 CDMs and the best online platform in Oman) e‐delivery channels
Substantial low cost retail deposit base
Merchant acquiring market share of over 70% by volume in 2014 and leading ecommerce business in Oman
Retail Loans – Peer Comparison Asset Growth Operating Income US$ million US$ million
7.07
4,954 5,1886,097 6,005 6,056 6,551
2.72 2.72
1.54 1.32 1.28 1.19
at BO far nk ar ab
an
300 298357
425 424 432
2009 2010 2011 2012 2013 2014Total Assets
15
BankMusc NB
Bank Dho
f
Ahli Ba
n
Bank Soh
Oman
Ar a
Bank
HSBC
Oma
*Oman Arab Bank- Data as of 30th Sep 2014
2009 2010 2011 2012 2013 2014
Operating Income

Wholesale Banking
Overview Opportunities Strategy Significant cross‐sell opportunities to other
wholesale banking clients
Leverage transaction experience in attracting t fi d t
Strengthen Bank Muscat’s leading position in specialised areas
Utilize the presence in regional markets to d b i
Treasury: funding, asset and liability management requirements, offer structured solutions to corporate clients
new corporate finance mandates
Leverage regional expansion to introduce new products
Strong growth potential in the high net worth market segment
expand business
Leverage specialised product expertise in other markets
Focus on fee income
Inorganic growth
Corporate Finance: Leader in corporate advisory : series of successful transactions and track record outside Oman
Financial Institutions: trade, DCM and correspondent banking services
Asset Management: Largest Omani mutual Asset Management: Largest Omani mutual fund manager with potential for growth and expanding outside Oman. Investment solutions for high net worth individuals
Securities portfolio(1) Asset Growth Operating Income US$ million US$ million
A1 to A3
Others (1)5%
3,773 3,3274,631
3,869 4,080
5,776
111
171 172 160 153
209
13%
2009 2010 2011 2012 2013 2014Total Assets
2009 2010 2011 2012 2013 2014Operating Income
(1)Securities portfolio represents Bonds & T‐Bills .(2) Others include Baa1 to Baa3 securities and unrated Banks.
16
Aaa to Aa394%

Islamic Banking – Meethaq
Overview Opportunities Strategy
Growth momentum continued in the second year of launch indicating potential in the market
Full fledged product and service offerings
Increase Meethaq exclusive branch network
Customer Centric approach and transparency
One of the most successful Islamic banking operation in Oman during 2014
11 dedicated branches become operative Shari’a governance structure ensures
transparent banking
Large network at disposal to leverage business
Awareness drives on Shari’a compliant banking to increase customer base
Customer Centric approach and transparency
Technology driven customer service delivery within the Shari’a compliance ambit
Plan to have 25 branches by the end of 3rdyear and expand thereafter
Establishment of Meethaq as a brand in its
11 dedicated branches become operative throughout the Sultanate
Innovation in product offering and services to create niche
Established Sharia Board comprising of well experienced and reputable Sharia scholars banking to increase customer base q
own right
Meethaq – Product and Portfolio Development Loan Portfolio US$ million
Consumer
Corporate
2013 2014
Home, auto finance, saving and current a/c, E‐banking, debit and
Ujra card
Child saving accounts, employee saving funds, Ijara products
Murabaha (goods LC), vehicle and h k
1,500
Financing and Deposit (USD)
Corporate
Investment & Treasury
Asset
equipment financing, sukukunderwriting
Government checking accounts with profit distribution
Wakala and interbank Mudaraba Sukuk issue and advisory, FX hedging products
739
1,060
242
735
0
500
1,000
,
17
Asset Management
Real estate andEquity Funds
2013 2014
Financing Deposits

International Operations
Overview Opportunities Strategy
Large banking markets in Saudi Arabia and Kuwait
Pan GCC network offering opportunities for
Focus on existing GCC operations
Solidify position and increase profitability
Presence in GCC and Singapore
Branches in Saudi Arabia and Kuwait g pp
business and trade synergies
Increasing trade/business opportunities between GCC and Asia
Efficiency: rationalization of back‐office costs – sharing of operational costs
Drive synergies within the group
Scale up business volumes to attain desired return
Capture trade / business flows between GCC and Asia
Rep offices in UAE and Singapore
99.99% stake in Muscat capital LLC – Saudi based, CMA licensed entity
14.7% stake in Al Salam Bank Bahrain
In process of exiting from Mangal Keshav
Assets Operating Profit
Securities Ltd, the India based brokerage associate.
Assets Operating Profit US$ millionsUS$ millions
1214
22
3044.0
61.2
2009 2010 2011 2012 2013 2014
774 644939
1,929 1,786 1,700
2009 2010 2011 2012 2013 2014Operating Income
2009 2010 2011 2012 2013 2014Total Assets (1)
18(1) Excluding one off adjustment of US$157mn gain in relation to the sale of sale of the bank’s investment in HDFC Bank, India.(2) Includes RO 9.5 million being gain on acquisition of BMI bank by Al Salaam Bank, Bahrain
(2)

International Operations cont’d
Country Entity Overview Strategy
b k t Launched in 2007.
Enhance scale through continued focus on corporate, trade and treasury businesses
C tl l ti h t t th di i
KSA
bank muscatRiyadh Branch
As of 31 December 2014, Net Loans & Advances were US$ 783mn, outstanding LCs/LGs were US$ 667mn and customer deposits stood at US$ 943mn.
Currently, selective approach to asset growth – medium‐size ticket, contract‐backed funded & unfunded business.
Focus on bulk deposits from large corporate and HNI clientele
Cost containment and increase shared resources with HO
S l b i l hil i i
Muscat Capital
99.99% owned subsidiary launched in 2009, focus on brokerage, asset / wealth management and corporate finance advisory services.
Scale up business volume while containing costs
For brokerage and wealth management, focus on institutions and select HNW customers in KSA
Leverage expertise built in Oman in Corporate Finance/Advisory
Kuwait bank muscatKuwait Branch
Launched in 2010, focus on corporate, trade and treasury businesses.
As of 31 December 2014, Net Loans & Advances were
Strategy/Business Focus ‐ Primarily on corporate customers for corporate, trade and treasury products, as well as contract financing for Govt. and related entities. Cautious approach to credit growth.
Kuwait Branch ,US$ 158mn, outstanding LCs/LGs were US$ 346mn and customer deposits stood at US$ 169mn.
Scale up business volumes with a focus on quality lending
Leverage off low operating cost base
19

International Operations cont’d
Country Entity Overview Strategy
Pursuant to the acquisition of BMI Bank by ASBB through a share swap in March 2014, the bank is now a 14.7% shareholder in ASBB
B k M t i l k d i f i d f 3 Investment to be continued
BahrainAl Salam Bank Bahrain (“ASBB”)
Bank Muscat is locked‐in for a period of 3 years.
For the 9 month period ended 30 September 2014, ASBB posted a consolidated profit of US$ 32.9 mn. Bank Muscat will be reporting share of profit from ASBB from Q2 2014 onwards, with a lag of one quarter, since the timing of finalisation of results of ASBB (a listed entity) is usually later the reporting for the bank.
to be held as an associate.
The transaction is expected to benefit shareholders from increased scale and larger capital base, as well as ( ASBB )
Based on advice from the auditors, the transaction has been treated as a sale (of BMI Bank) and purchase (of Al Salam Bank) transaction in our books. Accordingly, the bank recognized a one‐off gain of USD 24.6mn from this transaction in Q2.
The market value of the bank’s holding in ASBB shares as on 31 December 2014 was
p ,increased revenue streams from the addition of new business lines (investment banking)
US$ 109mn, as compared to the carrying value of US$ 122mn on that date.
India Mangal Keshav
Pursuant to decision to exit the investment, two tranches of buyback have been completed as this year – in February 2014 and August 2014.
The shareholding of the bank in MKSL has reduced to 12.72%. Final exit is expected to Exit is expected to be India Mangal Keshav be in 2015.
The impairment losses on exit were booked, or provided for, in 2013 itself.
The residual value of the investment is USD 2.6mn.
completed in 2015.
20

IV. Financial Performance

bank muscat – Financial Highlights December 2014Net Profit
Net Interest Income & Income from Islamic financing
Net Profit
Customer Deposits (Incl. Islamic)
YTD Dec 14: USD 424 millionYTD Dec 13: USD 395 million*Increase of 7.31%* Includes exceptional operating loss provision of USD 39million relating to Prepaid Travel Cards compromise.
Income from Islamic financingp ( )
YTD Dec 14: USD 633 millionYTD Dec 13: USD 611 millionIncrease: by 3.53%
As at 31 Dec 14 : USD 17,216 mioAs at 31 Dec 13 : USD 14,787 mioGrowth : 16.43%
Impairment & Recoveries for Credit LossesNet Loans & Advances & Islamic Financing
Impairment:As at 31 Dec14 : USD 17,626 mioAs at 31 Dec 13 : USD 15 955 mio
ROAA & ROAE
YTD Dec 14 : USD 167 million YTD Dec 13 : USD 131 million
Recoveries: YTD Dec 14 : USD 68 millionYTD Dec 13 : USD 84 million
As at 31 Dec 13 : USD 15,955 mioGrowth : 10.47%
Return on average assetsReturn on average assetsAs at 31 Dec 14: 1.79%As at 31 Dec 13: 1.86%
Return on average equityAs at 31 Dec 14 : 13.89%A t 31 D 13 13 92%As at 31 Dec 13 : 13.92%
22

Operating Performance and Profitability
Comments Operating Income & Cost to Income Resilient operating performance throughout the financial
turmoil Solid top line income growth – 5 year CAGR of 5.7%
US$ Millions
28 2% 38.8% 41.1% 41.6% 42.2% 41.2%90 0%
Increase in operating expenses Manpower Cost Business expansion
Strong core revenue generation with net interest income and commission and fees contributing to over 90% of
756 841 884 995
28.2% 38.8% 41.1% 42.2%
10 0%
30.0%
50.0%
70.0%
90.0%
Operating Income Composition Profitability
total operating income Increasing focus on top line commission and fee income
generation Solid Profitability
756 690 764841
‐10.0%
10.0%
2009 2010 2011 2012 2013 2014Operating Income Cost/Income
Operating Income Composition Profitability US$ Millions US$ Millions
14 6%15.4%
15.4%14.5% 13.4%
21.0%
26.0%
17%18% 20% 22% 24%
25%
4%4%25% 17% 10% 10% 7% 12%
191 264 305 362 395 486 10.9%
14.6%
1.24% 1.74% 1.80% 1.84% 1.86% 1.79%‐4 0%
1.0%
6.0%
11.0%
16.0%
58% 65% 70% 69% 65% 59%
17% 25%
(1) Other income: FX Income, Profit on sale of non‐trading investments, Dividend income and other income. 23
4.0%
2009 2010 2011 2012 2013 2014Net Profit RoAE RoAA
2009 2010 2011 2012 2013 2014
Net Interest Income Net Commission & fees Net Income Islamic Other Income (1)

Asset Quality
Comments Loan GrowthUS$ Millions Stable loan book growth
Conservative lending approach Focus on high quality assets with access to top tier
b4.98%
4 19% 2 98%2.99% 2.65% 2.84%
5.00%borrowers
Strong project finance capabilities Diversified loan portfolio across sectors Adequate provisioning of impaired asset Conservative approach – provisioning in line with the
hi h f ith IFRS CBO i t
10,525 10,89412,976 15,096
16,521 18,298
4.19% 2.98%
1 00%
2.00%
3.00%
4.00%
Gross Loans – Sector Breakup Impaired Assets and Provisioning
higher of either IFRS or CBO requirements Non specific loan loss provisions of 2% on retail
portfolio and 1% on corporate portfolio 0.00%
1.00%
2009 2010 2011 2012 2013 2014Gross Loans NPL/GLs
Impaired Assets and Provisioning
US$ MillionsServices 9%Mining &
quarrying 7%
Manufacture 7%
Housing 8%
Construction 4%Others 3%
101.5%
105.9%118.4%
121.4% 129.2% 129.4%
100 0%
120.0%
140.0%
Manufacture 7%
Real estate 3%
Wholesale & Retail trade 2%Import & Export
Trade 5%Personal 30%
555 484 458 548 565672547
457387
451437
520
0 0%
20.0%
40.0%
60.0%
80.0%
100.0%
24
FIs 5%
Utilities & Transport 16%
0.0%
2009 2010 2011 2012 2013 2014LLR NPL LLR/NPL

Funding and Liquidity
3%
Comments Funding Mix
20,555
Stable funding structure with a diversified funding base Largest deposit base in Oman with significant granularity Retail deposits comprise 37% of total deposits
US$ Millions
18,77415,19715,198 22,04325,268
55% 63% 67% 68% 66% 68%
28% 18% 16% 14% 13% 15%
12% 13% 12% 13% 14% 13%5% 6% 5% 5% 6% 3%Retail deposits comprise 37% of total deposits
Top 10 depositors represent 22% of total deposits and comprise of top tier Omani institutions
Adequate liquidity Strong capitalization levels
2009 2010 2011 2012 2013 2014Others Equity Borrowings Deposits
Deposits Capital Adequacy Ratio
Highest CAR among Omani peers and one of strongest among GCC peers
Capital Adequacy Ratio
16.42%15.93%14.78%14.72%12.63% 15.92%16.32%
Ministries & Other Gov
Orginisations 32%Individual & 3.58% 2.93% 4.63%
3.68% 3.27% 2.89%
Others 38%
11.14% 11.85% 11.30% 12.64% 13.15% 13.03%
25
Private Commercial
26%
Financial Institutions
4%
2013 onwards as per Basel III regulations2014‐ post proposed dividends
2009 2010 2011 2012 2013 2014Tier 1 Ratio Tier 2 Ratio

V. Annexure

bank muscat – Organisation Structure Chief Internal Auditor
Board Secretary
Chief Risk OfficerChief Executive
Chairman’s Office Board
Compliance
Chief Operating Officer
H d HR
Group General ManagerRetail, Investment and Global
Markets
Head‐ Head‐I Bk H d IT O dHead – Head
I t ti l
Group General ManagerCorporate and Intl. Operations
Group General Manager
Islamic Banking
Group General Manager Corporate Services
Head‐Head‐ HRRetail CFOInvestment Bkg & FI
Head IT, Ops and Infrastructure
Head‐Treasury
Head‐ Credit
Head‐Branches
Head ‐Corporate Banking
Project Finance
Head‐Investment Bkg.
Head –Fin. Control, Planning
& Strategy
Head‐Credit and Recovery
International Ops
CEO Saudi Br, AGM
Ahmed F Al Balushi
Overseas Ops.Head‐IT
Corp. Comm. and CSR
Head‐Priority Banking
Head‐Cards and E‐Banking
Head‐SME
Head‐Operations
Head‐Direct/
Inst. Sales
Head‐PMO, Planning
& Control
Head‐Support Services
27

Balance SheetAmounts in US$ Millions $
31‐Dec‐14 31‐Dec‐13 31‐Dec‐12 31‐Dec‐11
Cash and bal. with Central Bank 2,589 1,512 1,723 4,403Due from banks 2,283 2,252 1,886 4,403Loans and Advances 16,586 15,230 14,548 12,518Islamic financing receivables 1,040 725 ‐gNon trading investments 1,924 1,460 1,572 891Tangible fixed assets 187 173 180 186
Other assets (incl. invt in associates) 660 690 646 777Total assets 25,268 22,043 20,555 18,774
Bank deposits/FRNs /Bonds 2,802 2,303 2,092 1,914Customer deposits (incl. CDs) 16,481 14,545 13,968 12,741Islamic Customer's Deposit 734 241 ‐Other liabilities 1,056 1,042 1,034 989Subordinated debt 625 641 675 869Convertible bonds 162 121 42 84T l li bili i 2 860 8 89 8 6 3Total liabilities 21,860 18,894 17,811 16,513
Share capital and premium 1,775 1,733 1,538 1,185Total reserves 1,004 889 743 591Retained profits 630 527 463 397Shareholders' equity 3,408 3,149 2,744 2,261
Total liabilities + shareholders' equity 25,268 22,043 20,555 18,774
Key ratios
Loans and advances/customer deposits 100.63% 104.71% 103.10% 98.20%
28
Shareholders' equity/total assets 13.49% 14.29% 13.35% 12.00%
Subordinated debt/(debt + equity) 15.49% 16.92% 19.74% 27.80%BIS total capital ratio 15.92% 16.50% 15.10% 15.93%
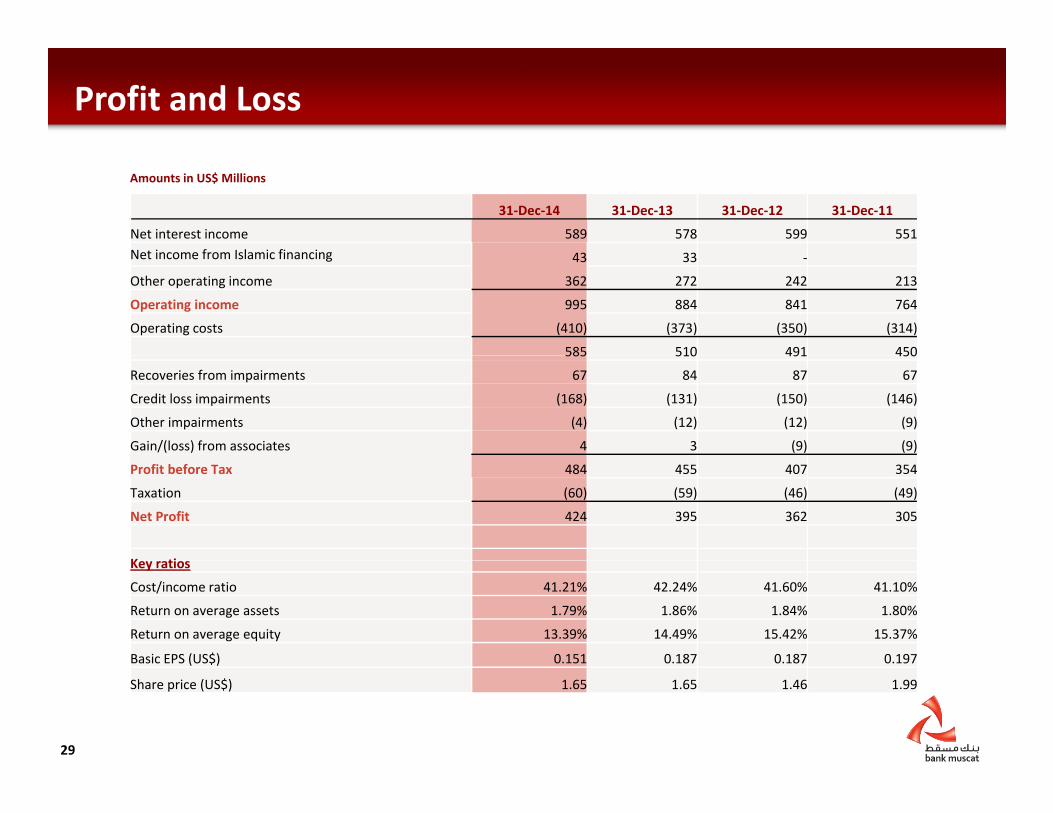
Profit and Loss
Amounts in US$ Millions
31‐Dec‐14 31‐Dec‐13 31‐Dec‐12 31‐Dec‐11
Net interest income 589 578 599 551 Net income from Islamic financing 43 33Net income from Islamic financing 43 33 ‐
Other operating income 362 272 242 213
Operating income 995 884 841 764
Operating costs (410) (373) (350) (314)
585 510 491 450585 510 491 450
Recoveries from impairments 67 84 87 67
Credit loss impairments (168) (131) (150) (146)
Other impairments (4) (12) (12) (9)
Gain/(loss) from associates 4 3 (9) (9)
Profit before Tax 484 455 407 354
Taxation (60) (59) (46) (49)
Net Profit 424 395 362 305
K tiKey ratios
Cost/income ratio 41.21% 42.24% 41.60% 41.10%
Return on average assets 1.79% 1.86% 1.84% 1.80%
Return on average equity 13.39% 14.49% 15.42% 15.37%
Basic EPS (US$) 0.151 0.187 0.187 0.197
29
Basic EPS (US$) 0.151 0.187 0.187 0.197
Share price (US$) 1.65 1.65 1.46 1.99
Thank You
“WEWECAN DOMORE.”
You may reach us on : IR@bankmuscat com
Disclaimer Statement The information and opinions contained in this document have been compiled or arrived at by bank muscat from sources believed to be reliable and in good faith, but no representation or warranty, expressed or implied, is made as to their accuracy completeness or correctness The information contained in this document is published for the assistance of
You may reach us on : [email protected]
accuracy, completeness or correctness. The information contained in this document is published for the assistance of recipients, but is not to be relied upon as authoritative or taken in substitution for the exercise of judgement by any recipient. The bank does not accept any liability whatsoever for any direct or consequential loss arising from any use of this document or its contents. This document is strictly confidential and may not be reproduced, distributed or published for any purpose.