![[A4] XIAOMEI_Guangzhou BRT and New BRT in China - Ed](https://static.fdocuments.net/doc/165x107/577ce47b1a28abf1038e73a0/a4-xiaomeiguangzhou-brt-and-new-brt-in-china-ed.jpg)
Investor Presentation - BRT Apartments Corp. | Real Estate ...
25
Investor Presentation March 2021 Mercer Crossing – Dallas, TX The Avenue – Ocoee, FL Pointe at Lenox Park – Atlanta, GA
Transcript of Investor Presentation - BRT Apartments Corp. | Real Estate ...

Investor PresentationMarch 2021
Mercer Crossing – Dallas, TX The Avenue – Ocoee, FL Pointe at Lenox Park – Atlanta, GA

Certain information contained in this presentation, together with other
statements and information publicly disseminated by BRT Apartments
Corp. (the “Company”), constitute forward-looking statements within the
meaning of Section 27A of the Securities Act of 1933, as amended, and
Section 21E of the Securities and Exchange Act of 1934, as amended.
These statements involve assumptions and forecasts that are based
upon our current assessments of certain trends, risks and uncertainties,
which assumptions appear to be reasonable to us at the time they are
made. We intend such forward-looking statements to be covered by the
safe harbor provision for forward-looking statements contained in the
Private Securities Litigation Reform Act of 1995 and include this
statement for the purpose of complying with these safe harbor
provisions. Information regarding certain important factors that could
cause actual outcomes or other events to differ materially from any such
forward-looking statements appear in the Company’s Annual Report on
Form 10-K for the year ended December 31, 2020 and the Quarterly
Reports on Form 10-Q filed with the SEC thereafter, and in particular,
the sections of such documents entitled “Risk Factors” and
“Management’s Discussion and Analysis of Financial Condition and
Results of Operations”. You should not rely on forward- looking
statements since they involve known and unknown risks, uncertainties
and other factors which are, in some cases, beyond our control and
which could materially affect actual results or performance referred to
above. We undertake no obligation to publicly update or revise any
forward-looking statements included in this presentation, whether as a
result of new information, future events or otherwise.
Safe Harbor

BRT Apartments is an owner and operator of Class B and B+ value-add
and select Class A multi-family assets primarily in superior
Sun Belt locations. The Company uses its expert real estate and investment
experience to maximize risk-adjusted return for its stockholders.
Parkway Grande – San Marcos, TX Verandas at Alamo Ranch – San Antonio, TXVanguard Heights – Creve Coeur, MO
3
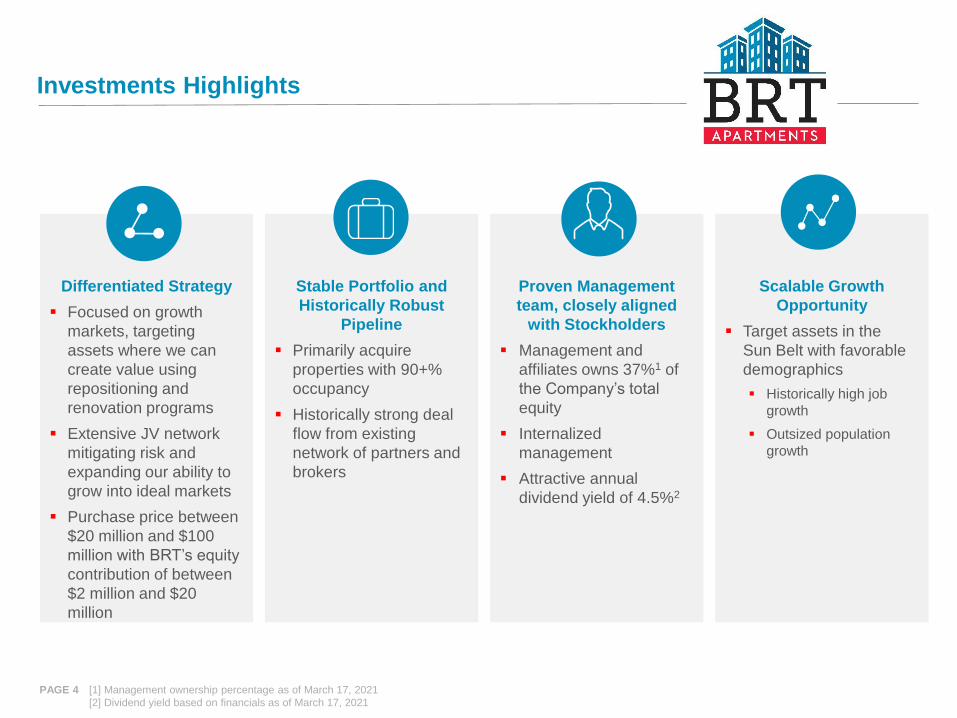
Investments Highlights
PAGE 4
Differentiated Strategy
▪ Focused on growth
markets, targeting
assets where we can
create value using
repositioning and
renovation programs
▪ Extensive JV network
mitigating risk and
expanding our ability to
grow into ideal markets
▪ Purchase price between
$20 million and $100
million with BRT’s equity
contribution of between
$2 million and $20
million
Stable Portfolio and
Historically Robust
Pipeline
▪ Primarily acquire
properties with 90+%
occupancy
▪ Historically strong deal
flow from existing
network of partners and
brokers
Scalable Growth
Opportunity
▪ Target assets in the
Sun Belt with favorable
demographics
▪ Historically high job
growth
▪ Outsized population
growth
Proven Management
team, closely aligned
with Stockholders
▪ Management and
affiliates owns 37%1 of
the Company’s total
equity
▪ Internalized
management
▪ Attractive annual
dividend yield of 4.5%2
[1] Management ownership percentage as of March 17, 2021
[2] Dividend yield based on financials as of March 17, 2021

16.1%
18.3%
21.9%
9.4%
25.8%
18.9%
4.4%
7.2%
1.8%
9.7% 9.6% 10.3% 11.4%
8.8% 7.4%
5.3% 4.9% 4.1%
0.0%
5.0%
10.0%
15.0%
20.0%
25.0%
30.0%
Charleston, SC Dallas, TX San Antonio, TX Houston, TX Nashville, TN Atlanta, GA Columbia, SC United States GatewayMarkets
Employment Growth (2014-2020) Expected Population Growth (2020-2025)
Capitalizing on Favorable Multi-Family Trends
PAGE 5Source: SNL, Bureau of Labor Statistics, U.S. Census
Note: Employment growth uses employment figures ending in December 31, 2020
[1] 2025 population numbers used to calculate expected population growth are estimates
▪ Multi-family apartments have seen tremendous growth in recent years due to high demand,
driven partially by millennial’s preference to rent rather than to buy
▪ Focus on opportunities in Sun Belt markets where we anticipate cap rates will be attractive due to positive net
migration in the millennial age group moving into the area
▪ Middle class renters who are more likely to rent Class B, or better, apartments drive demand in our markets

David W. Kalish,
Senior Vice President
Finance
More than 35 Years experience in Multi-family
Proven Senior Management Team
PAGE 6
Ryan W. Baltimore,
Senior Vice President
Corporate Strategy and Finance Mitchell K. Gould,
Executive Vice President
Acquisitions and Asset Management
George E. Zweier,
Chief Financial Officer
Vice President and CFO
Jeffrey A. Gould,
President and CEO
President and CEO since 2002
Senior Vice President and Member of the Board
of Directors of One Liberty Properties, Inc.
(NYSE: OLP) since 1999
Vice President of Georgetown Partners, Inc.,
managing general partner of Gould Investors
L.P. since 1996

PAGE 7
▪ Engaged in lending on commercial and mixed use properties
▪ Significant involvement in multi-family apartments and other real estate assets
1983 - 2011
Timeline of Business Operations
Decades of Demonstrated Success in Multi-Family
▪ Commenced multi-family investing strategy
▪ Fully exited lending and servicing business
▪ Announced internalization of management
▪ Acquired 45 properties with 13,734 units
▪ Sold 13 properties with 4,397 units
▪ Announced quarterly dividend of $0.18 per share in 2017
▪ Increased quarterly dividend to $0.20 per share in 2018
▪ Increased quarterly dividend further to $0.22 per share in 2019
▪ Acquired 18 properties with 5,112 units
▪ Sold 11 properties with 3,407 units
2011 - 2016 2021
Source: Company Filings
Note: Some numbers reflect development/lease-up units
2017 - 2020
▪ Announced 2 dispositions and anticipate being net sellers in 2021 given the compressed cap rate environment.
▪Will take advantage of further dispositions where we believe we can capture embedded value
▪Potential deleveraging opportunity with use of proceeds
▪Continue monitoring the markets and looking for accretive acquisition opportunities where available

BRT’s Total Return Since 2017
PAGE 8
▪ Since January 1, 2017, BRT’s total return has been 198.6%, outperforming both the S&P 500 and the MSCI U.S. REIT Index over the
same time period by 110.6% and 175.8%, respectively
Source: SNL
Note: As of March 11, 2021
198.6%
22.8%
88.0%

Meaningful Value
Differentiated Strategy Creating
PAGE 9
Focus on
Growth
Markets
▪ Target assets with high NOI growth potential
▪ Create value through re-tenanting, repositioning, and value-add renovations
▪ Growth through active property management
▪ High barriers to entry; minimal new development; less institutional competition
JV-Centric
Strategy
▪ JV structure leverages local expertise of joint venture partner network
▪ Superior flexibility to grow or exit markets versus vertically-integrated REITs
▪ Ability to pursue direct acquisitions of properties or buy outs of partners’ equity interest on an opportunistic basis
▪ Significant access to buying opportunities from strong JV partner network
▪ Broad network of third party management companies and partner relationships
▪ Flexible acquisition and funding profile; focus on one-off opportunities where major institutional buyers are not active
▪ BRT’s niche is the less competitive, higher returning properties worth up to $100 million
Proven Access
to Investment
Opportunities

Creating Value through Strong Operating Partnerships
Joint Venture Strategy
PAGE 10
Strong Deal
Flow
Flexibility
▪ Ability to enter and exit markets through a strong network
▪ High “hit-rate” and efficiencies on deals as we only review deals when under contract
▪ Have the ability to choose best-in-class third party management companies where the partners do not have a vertically
integrated platform
Value-Creation
through Local
Partners
▪ Local operators with expertise in specific markets provide value-added opportunities through
extensive market knowledge
▪ Able to get “off-market” deals through the partners’ relationships with local brokers and owners
▪ Generate opportunities from both existing partners and potential partners through a strong network built
from the successful lending platform and equity partnerships in the past
▪ Have never advertised publicly
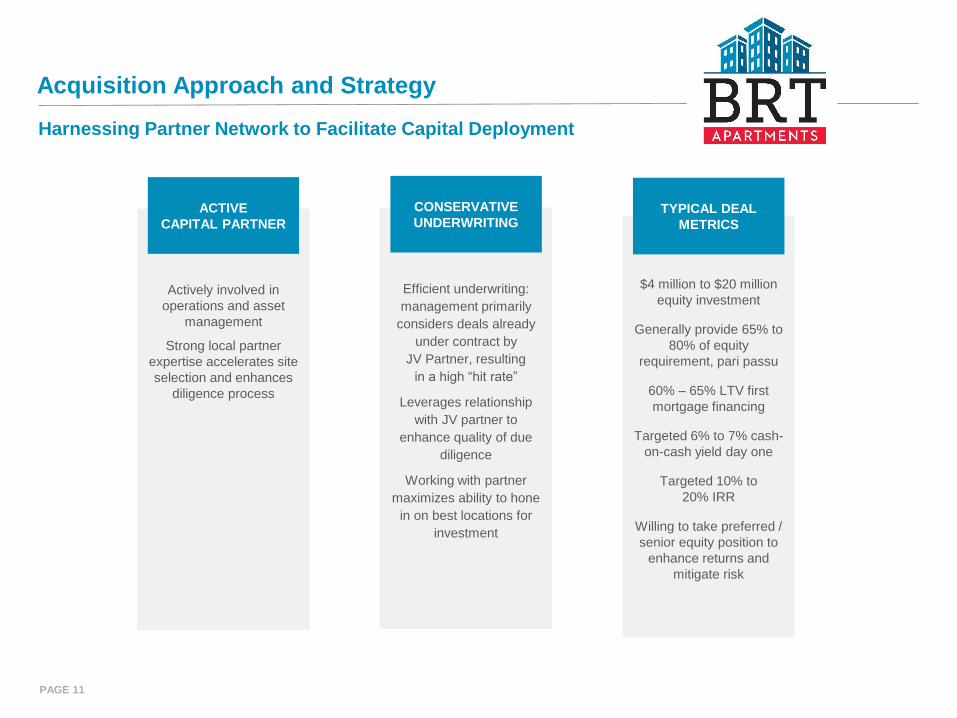
Harnessing Partner Network to Facilitate Capital Deployment
Acquisition Approach and Strategy
PAGE 11
Actively involved in
operations and asset
management
Strong local partner
expertise accelerates site
selection and enhances
diligence process
Efficient underwriting:
management primarily
considers deals already
under contract by
JV Partner, resulting
in a high “hit rate”
Leverages relationship
with JV partner to
enhance quality of due
diligence
Working with partner
maximizes ability to hone
in on best locations for
investment
$4 million to $20 million
equity investment
Generally provide 65% to
80% of equity
requirement, pari passu
60% – 65% LTV first
mortgage financing
Targeted 6% to 7% cash-
on-cash yield day one
Targeted 10% to
20% IRR
Willing to take preferred /
senior equity position to
enhance returns and
mitigate risk
ACTIVE
CAPITAL PARTNER
CONSERVATIVE
UNDERWRITINGTYPICAL DEAL
METRICS

PAGE 12
Strategically Diversified in Sun Belt Markets
Focus on Growth Markets
KEY PORTFOLIO FIGURES
Average Monthly Rental Rate3,5 $1,088
Average Property Age (Years)2,3 20
Average Cost per Unit4 $129.4k
Geographically Diverse Portfolio
Texas
Georgia
South Carolina
Florida
Alabama
Mississippi
Tennessee
North Carolina
Missouri
Ohio
Virginia
Other1
STATE
10
5
5
4
4
2
2
2
3
1
1
-
PROPERTIES2
3,025
1,545
1,391
1,248
940
776
702
576
355
264
220
-
UNITS2
21%
15%
11%
12%
10%
7%
6%
5%
5%
3%
5%
2%
% of NOI
CONTRIBUTION3
TOTAL 39 11,042 100%
Source: Company Filings, SNL
[1] Primarily reflects amounts from properties related to a commercial leasehold position in Yonkers, NY
[2] As of December 31, 2020
[3] For the quarter ending December 31, 2020. See appendix for an explanation of the manner in which net operating income, or NOI, is calculated.
[4] Average cost includes total capitalization for renovations
[5] Reflects stabilized properties

Strong partnerships with national operators who manage/own 100,000+ units
Partnering with Private Owner/Operators
PAGE 13 Note: Select group of BRT partners

PORTFOLIO OCCUPANCY1AVERAGE RENT PER UNIT1
Upside in Rents Due to Strong Value-AddProgram and Stable Occupancy
PAGE 14
Q4 2020 SAME STORE NOI GROWTH2AVERAGE AGE OF PROPERTY (YEARS)1
Source: Company Filings, SNL
[1] As of the quarter ending December 31, 2020
[2] Q4 2019 to Q4 2020
6
1718
20
33
0
5
10
15
20
25
30
35
APTS BRG IRT BRT NXRT
$1,088$1,128 $1,136
$1,315 $1,390
$0
$200
$400
$600
$800
$1,000
$1,200
$1,400
BRT NXRT IRT BRG APTS
94.1% 94.5% 95.0% 95.4% 95.6%
50.0%
60.0%
70.0%
80.0%
90.0%
100.0%
NXRT BRT IRT BRG APTS
0.2%
0.7%
2.9%3.2%
4.4%
0.0%
2.0%
4.0%
6.0%
BRG APTS BRT NXRT IRT

THE VILLAGE AT LAKESIDE
THE VIVE AT KELLSWATER
ABBOTTS RUN
Sample Acquisitions
PAGE 15
▪ Projected stabilized cap rate: 5.2%
▪ Purchase price: $48.6 million
▪ Location: Kannapolis, NC
▪ Number of units: 312
Source: Company Filings
SOMERSET AT TRUSSVILLE
▪ Projected stabilized cap rate: 6.0%
▪ Purchase price: $43.0 million
▪ Location: Birmingham, AL
▪ Number of units: 328
▪ Value Add
▪ Projected stabilized cap rate: 7.7%
▪ Purchase price: $38.0 million
▪ Location: Wilmington, NC
▪ Number of units: 264
▪ Value Add
▪ Projected stabilized cap rate: 5.7%
▪ Purchase price: $18.4 million
▪ Location: Auburn, AL
▪ Number of units: 200
▪ Value Add

DISPOSITION DATE
Dispositions
History of Value Creation
TOTAL 6,836 $123.6mm
PROPERTY NAME
Ivy Ridge
Grove at Trinity Pointe
Mountain Park Estates
Courtney Station
Madison at Schilling Farms
Village Green
Sundance
Southridge
Spring Valley
Sandtown Vista
Autumn Brook
Meadowbrook
Parkside
Ashwood Park
Waverly Place Apartments
Fountains
Apartments at the Venue
The Factory at Garco Park
Cedar Lakes
Stonecrossing
Waterside
LOCATION
Marietta, GA
Cordova, TN
Kennesaw, GA
Pooler, GA
Collierville, TN
Little Rock, AK
Wichita, KS
Greenville, SC
Panama City, FL
Atlanta, GA
Hixson, TN
Humble, TX
Humble, TX
Pasadena, TX
Melborune, FL
Palm Beach Gardens, FL
Valley, AL
North Charleston, SC
Lake St. Louis, MO
Houston, TX
Indianapolois, IN
# OF UNITS
207
464
450
300
324
172
496
350
160
350
156
260
160
144
208
542
618
271
420
384
400
BRT SHARE OF
GAIN ON SALE1
$4.6mm
$4.5mm
$6.3mm
$4.3mm
$3.7mm
$0.4mm
$5.4mm
$9.2mm
$3.9mm
$4.7mm
$0.5mm
$4.6mm
$2.8mm
$1.7mm
$10.0mm
$21.2mm
$5.2mm
$6.2mm
$5.6mm
$9.0mm
$9.8mm
IRR1
31.7%
21.2%
26.0%
13.0%
10.0%
10.0%
32.0%
27.0%
37.0%
40.2%
-5.1%
23.5%2
23.5%2
23.5%2
25.0%3
25.0%3
15.7%
20.0%
15.9%
18.3%
23.2%
Jul-15
Mar-16
Mar-16
Apr-16
Jun-16
Jun-16
Sep-16
Oct-16
Oct-16
Nov-16
Nov-16
Jul-17
Jul-17
Jul-17
Oct-17
Feb-18
Feb-18
Nov-18
Dec-18
Jul-19
Dec-19
PAGE 16 Source: Company Filings [1] Net to BRT after paying distributions to Joint Venture partners
Note: As of December 31, 2020 [2,3] Represents IRRs for portfolio of properties in a crossed joint venture

▪ Civic Center 1 purchased for $35mm, or
$89,286, per unit
▪ Civic Center 2 purchased for $38.205mm, or
$99,492, per unit
▪ Blended acquisition cap rate of 6.1% (based
on projected NOI and total cost)
▪ Civic 1 capex budget of $1.940,400 or
$4,950, per unit
▪ Civic 2 capex budget of $1,655,800 or
per unit 4,312, per unit
Southhaven, MS
Value-Add Case Study: Mississippi Portfolio
PAGE 17
▪ 2 class B multi-family properties located
in Southaven, Mississippi.
▪ Built in 2002, 2005 and 2006
▪ 776 total units
▪ 324 units have been renovated as of
7/31/2020.
PROPERTY DESCRIPTION ACQUISITION DATA
▪ Upgraded interior units with new cabinet
doors, resurface countertop, new lighting
fixtures, new vinyl flooring in the kitchens
and bathrooms, new paint color scheme,
new USB outlets in Kitchen. Some units
also received a new appliance package in
the kitchen.
▪ Targeted upgrades that result in the highest
return on investment.
VALUE ADD UPGRADES
Before Renovation After Renovation
Property
Civic Center 1
Civic Center 2
Average Cost Per Unit
$4,282
$4,601
Average Rent Increase
$92
$103
ROI
26%
27%
VALUE ADD PROGRAM
RETURN ON INVESTMENT

Columbia, SC $60,697,000 $59,994,000 339 ▪ Occupancy is 85% as of 12/31/2020
Nashville, TN $73,263,000 $72,324,000 402 ▪ Occupancy is 74% as of 12/31/2020
Superior Locations with Limited New Supply
Development Transactions
PAGE 18
▪ Pursue Class A / A+ new construction in emerging
Southeast US markets
▪ Willing to provide at least 50% of the required equity with well-
capitalized development partners
▪ Garden style or mid-rise construction
▪ Targeting unlevered stabilized return of at least 6%
Location Estimated
Development
Cost
Capital Drawn(Debt and Equity)
Planned Units Status
Canalside Sola, Columbia, SC Bells Bluff, Nashville, TN
(rendering)
Source: Company Filings

Well Laddered Debt Maturities
▪ Weighted average interest rate on property debt is 4.04% with a weighted averaged remaining term to maturity of 7.2 years1
▪ Attractive corporate level subordinated notes bear interest at the rate of 3M LIBOR + 200bps and mature on April 30, 2036.
The rate was 2.21% on December 31, 2020
▪ At March 11, 2021 BRT had up to $10.0 million available under its credit facility (not portrayed in the chart below)
Source: Company Filings
Note: All data as of the fiscal quarter ending December 31, 2020
[1] Weighted by outstanding mortgage balance
[2] Mortgage debt amounts include 100% of the outstanding balance with respect to wholly owned properties and the Company’s pro rata share of the outstanding balance for
properties owned in a joint venture. See reconciliation in appendix
PAGE 19
PRINCIPAL PAYMENT SCHEDULE
USD in millions
2
$20.7
$111.0
$30.9$7.1 $33.6
$455.6
$37.4
$0
$100
$200
$300
$400
$500
$600
$700
2021 2022 2023 2024 2025 Thereafter
Mortgage Debt Subordinated

Investment Highlights
PAGE 20
Scalable Growth Opportunity
Proven Management
with Close Alignment of Interests
Differentiated Niche Strategy
Stable Portfolio and
Robust Pipeline

Appendix
Non-GAAP Financial Measures, Definitions and Reconciliations

A-1
PAGE 22
We compute NOI by taking rental revenues less property operating expenses, and with respect to our unconsolidated properties, we use
our pro rata share of such amounts. We define "Same Store NOI" as NOI for all our consolidated properties and our pro rata share of the
operations of unconsolidated properties that were owned for the entirety of the periods being presented, other than properties in lease
up and developments. Other REIT’s may use different methodologies for calculating NOI, and accordingly, our NOI may not be
comparable to other REIT’s. We believe NOI provides an operating perspective not immediately apparent from GAAP operating income
or net (loss) income. NOI is one of the measures we use to evaluate our performance because it (i) measures the core operations of
property performance by excluding corporate level expenses and other items unrelated to property operating performance and (ii)
captures trends in rental housing and property operating expenses. We view Same Store NOI as an important measure of operating
performance because it allows a comparison of operating results of properties owned for the entirety of the current and comparable
periods and therefore eliminates variations caused by acquisitions or dispositions during the periods. However, NOI should only be used
as an alternative measure of our financial performance.
Pro rata refers to our share of the accounts and operations of our unconsolidated properties and is based on our percentage equity
interest in such properties. We use pro rata to help the reader gain a better understanding of our unconsolidated joint ventures.
However, the use of pro rata information has certain limitations and is not representative of our operations and accounts as presented in
accordance with GAAP. Accordingly, pro rata information should be used with caution and in conjunction with the GAAP data presented
herein and, in our reports, filed with the SEC.
NOI
Pro-Rata Share

A-2
PAGE 23
December 31, 2020
ASSETS
Real estate properties, net of accumulated depreciation of $145,600 $ $1,075,178
Cash and cash equivalents 16,939
Other assets 29,392
Total Assets $ 1,121,509
LIABILITIES AND EQUITY
Liabilities:
Mortgages payable, net of deferred costs of $563 $ 829,646
Accounts payable and accrued liabilities 20,237
Total Liabilities 849,883
Commitments and contingencies
Equity:
Total unconsolidated joint venture equity 271,626
Total Liabilities and Equity $ 1,121,509
BRT interest in joint venture equity $ 169,474
Unconsolidated Mortgages Payable:
BRT’s pro-rata share $ 525,709
Partner’s pro-rata share 303,937
Total $ 829,646
At December 31, 2020, the Company held interests in unconsolidated joint ventures that own 31 multi-family properties (the
"Unconsolidated Properties"). The condensed balance sheets below present information regarding such properties (dollars in
thousands):
Mortgages payable are net of deferred costs

A-3
PAGE 24
Consolidated
Year Total Principal Payments Scheduled Amortization Principal Payments Due at Maturity Percent of Total Principal Payments
Due At Maturity Weighted Average Interest Rate (1)
2021 $ 17,274 $ 3,272 $ 14,002 12 % 4.29 %
2022 62,543 1,924 60,619 54 % 4.29 %
2023 1,270 1,270 — — —
2024 1,316 1,316 — — —
2025 16,661 1,286 15,375 14 % 4.42 %
Thereafter 31,933 8,769 23,164 20 % 3.77 %
Total $ 130,997 $ 17,837 $ 113,160 100 %
Unconsolidated (BRT pro rata share)
Year Total Principal Payments Scheduled Amortization Principal Payments Due at MaturityPercent of Total Principal Payments
Due At Maturity Weighted Average Interest Rate (1)
2021 $ 3,388 $ 3,388 $ — — —
2022 48,443 4,984 43,459 10 % 3.38 %
2023 29,582 4,997 24,585 5 % 4.12 %
2024 5,782 5,782 — — —
2025 16,972 7,102 9,870 2 % 3.94 %
Thereafter 423,698 44,663 379,034 83 % 4.12 %
Total $ 527,865 $ 71,350 $ 456,948 100 %

A-4
PAGE 25
Weighted Average Remaining Term to Maturity (2) 7.2 years
Weighted Average Interest Rate (2) 4.04 %
Debt Service Coverage Ratio for the quarter ended December 31, 2020 1.55 (3)
(1) Based on balloon payments at maturity. Includes consolidated and BRT pro rata share amounts.
(2) Includes consolidated and BRT pro rata share unconsolidated amounts.
(3) See definition under "Non-GAAP Financial Measures and Definitions." Includes consolidated and 100% of the unconsolidated amounts.
Junior Subordinated Notes
Principal Balance $37,400
Interest Rate 3 month LIBOR + 2.00% (i.e, 2.21% at 12/31/2020)
Maturity April 30, 2036
Credit Facility (as of March 11, 2021)
Maximum Amount Available Up to $10,000
Amount Outstanding $0
Interest Rate Prime + 0.50% (floor of 4.25%)
Maturity April 18, 2021
Combined
Year Total Principal Payments Scheduled Amortization Principal Payments Due at MaturityPercent of Total Principal Payments
Due At Maturity Weighted Average Interest Rate (1)
2021 $ 20,662 $ 6,660 $ 14,002 2 % 4.29 %
2022 110,986 6,908 104,078 18 % 3.91 %
2023 30,852 6,267 24,585 4 % 4.12 %
2024 7,098 7,098 — — —
2025 33,633 8,388 25,245 4 % 4.23 %
Thereafter 455,631 53,432 402,198 72 % 4.10 %
Total $ 658,862 $ 88,753 $ 570,108 100 %