INVESTOR PRESENTATION Broad-basing the pyramid Q2'20... · 2019-11-14 · Mrs. Mamta Binani...
46
SKIPPER LIMITED INVESTOR PRESENTATION Broad-basing the pyramid Q2 & H1 PERFORMANCE, 2019 - 20
Transcript of INVESTOR PRESENTATION Broad-basing the pyramid Q2'20... · 2019-11-14 · Mrs. Mamta Binani...

SKIPPER LIMITED INVESTOR PRESENTATION
Broad-basing the pyramid
Q2 & H1 PERFORMANCE, 2019 - 20

SKIPPER LIMITED INVESTOR PRESENTATION
About Us

W H O W E A R E
3
Skipper Limited is India’s largest and world's most competitive integrated transmission tower manufacturing
company

4
• Flagship company of the S.K. Bansal Group (incorporated 1981).
• Angle rolling, tower, accessories and fastener manufacture coupled with EPC line construction
• One of India’s largest and fastest growing polymer pipes & fittings companies
• Four Power Grid Corporation of India-approved transmission tower and pole manufacturing plants (combined engineering capacity 300,000 MTPA)
• Among the most effective knowledge pools in the sector comprising 2,450+ members
• Widely respected player; awarded Largest Tower Supplier Award by Power Grid for 3rd consecutive year
• Awarded Best Industry in Water Resources sector by Central Board of Irrigation and Power.
K E Y F A C T S

SKIPPER LIMITED INVESTOR PRESENTATION
Key Management

6
Sajan Kumar Bansal Managing Director
Sharan Bansal Director
Devesh Bansal Director
Siddharth Bansal Director
Yash Pall Jain Director
He is the driving force behind the company's exponential growth since the beginning of the new millennium. Under his visionary leadership, the company has grown from a single unit, single product manufacturer to multi-unit, multi product manufacturing, ranging from Steel to Polymer.
A mechanical engineering graduate, he is heading the Tower manufacturing and EPC business of the company. He's taken the company to a leadership position in this industry.
With a Master's in International Business degree under his belt, he is heading the Tubes and Tubular products divisions of the company. He is also responsible for the group's upstream expansions.
Heading the company's first diversification into non steel products, he is responsible for the Polymer product manufacturing divisions. He has a degree in Entrepreneurship from University of Illinois, USA.
He is a B.com graduate from Punjab University and has an experience of over 35 years in various leading Industrial houses. In his corporate career he has held several responsible and important portfolios.
B O A R D O F D I R E C T O R S – W H O L E T I M E

7
B O A R D O F D I R E C T O R S - I N D E P E N D E N T
Mr. Amit Kiran Deb
IAS (Retd.),
Chairman
He has held several
responsible and
important portfolios
in the West Bengal
State Government,
before finally retiring
as Chief Secretary
and Tourism
Secretary. He has
profound
knowledge and
experience in
various industries.
Mrs. Mamta Binani
Immediate Past
President ICSl
She is one of the
leading Practicing
Company
Secretary from
Eastern India and
her professional
career includes 17
years of experience
in corporate
consultation &
advisory.
Mr. Joginder Pal Dua
Ex CMD - Allahabad
Bank
He has been with
Allahabad Bank for 5
years and retired as
Chairman of (B.I.F.R.).
He has held several
portfolios in reputed
banking
organizations and
was on the
governing board of
several education
institutions.
Sri Pramod Kumar
Shah C.A
He is a Fellow
member of the
Institute of
Chartered
Accountants of
India and has 35
years of experience
in practicing
accountancy with
an expertise in the
area of internal
audit. He has
graduated with a
Bachelor's Degree in
Commerce from
Calcutta University.
Mr. Ashok Bhandari
C. A.
He has profound
experience in
working with
different industries.
He has held
various notable
positions in
different sectors
and finally retired
as the CFO in
Shree Cement
Limited, a B.G.
Bangur Company.

S K I P P E R : O N E - S T O P S O L U T I O N P R O V I D E R
M I S S I O N
Engineering products
Capacity: 300,000 MTPA
• Power Transmission Tower
• Power Distribution Poles
• Monopoles
• MS & High Tensile Angles
• Solar Structures
• Fasteners
• Tower Accessories
• Railway Structures
Highlights
Positioned as one of the world's leading transmission tower manufacturer; largest in India
Revenues (FY’19)
Rs16,452mn
Polymer products
Capacity: 51,000 MTPA
• UPVC Pipes
• CPVC Pipes
• SWR Pipes
• HDPE Pipes
• Fittings
Highlights
• Only polymer pipe company in India to implement TOC in its operations
Infrastructure projects
• Transmission Line EPC
• Railway Electrification EPC
• Underground Utility laying by HDD
Highlights
• Forward integration activity
• Aimed at high-margin projects
Revenues (FY’19)
Rs1,598mn
Revenues (FY’19)
Rs 658mn
P R O D U C T O F F E R I N G S

G L O B A L P R E S E N C E
SOUTH AMERICA Peru, Colombia, Chile, Paraguay, Panama
EUROPE UK, Germany, Spain
AFRICA Kenya, Egypt, Ghana, Nigeria, Zambia, Sierra Leone Guinea, South Africa, Botswana, Burundi, Angola
MIDDLE EAST Jordan, Saudi Arabia, UAE
SOUTH AND SOUTH EAST ASIA Nepal, Bangladesh, Sri Lanka, Indonesia, Philippines, Malaysia
AUSTRALIA
F O O T P R I N T S
SKIPPER LIMITED Performance Update
Q2 & H1 FY’20 Update

11
F i n a n c i a l P e r f o r m a n c e Q 2 & H 1 F Y ’ 2 0
Sl Profit & Loss Summary Q2 FY’20 Q2 FY’19 H1 FY’20 H1 FY’19
1 Revenues 3,132.5 5,239.6 6,518.2 10,026.6
2 Operating EBITDA (without Forex) 356.6 534.6 749.9 1,043.0
% of Revenue 11.4% 10.2% 11.5% 10.4%
3 Forex Gain / (Loss) (11.0) (146.6) 22.2 (205.3)
4 Reported EBITDA (2+3) 345.6 388.0 772.1 837.8
% of Revenue 11.0% 7.4% 11.8% 8.4%
5 Depreciation 94.9 96.6 188.4 211.8
6 Interest Expenses 232.1 256.5 447.7 530.5
7 Other Income 1.6 3.4 4.3 6.6
8 Profit Before Tax (4-5-6+7) 20.3 38.3 140.4 102.1
9 Tax 6.1 13.4 44.0 32.2
10 Profit After Tax (8-9) 14.2 24.9 96.4 69.9
Rs in Mn
B U S I N E S S R E P O R T C A R D

12
P E F R O R M A C E H I G H L I G H T S
Q2 & H1 FY’20 Revenue impacted on account of –
Consciously slowed down supplies to the customer unwilling to give secured payment terms
Considering the liquidity situation in the market, Limited our credit risk exposure across our customers ; at this stage we find it more prudent to not chase growth in revenue at the cost of financial discipline.
Lack of short term orders in market
Structural changes undergoing implementation in Polymer Segment
Performance Update
Management ideology of not chasing growth at the cost of financial discipline will be maintained and adhered.

13
P E F R O R M A C E H I G H L I G H T S
Operational Performance Highlights
Stand Alone operating EBITDA margins improved to 11.5% in spite of lower sales; The margins of engineering business are back to their normal historical range of 13%.
Stable raw material prices and corrective steps undertaken to reduce overhead and fixed costs leaded to improved margin performance ; Stronger expected execution in our Engineering business going forth will further boost its performance.
Productivity and cost reduction initiatives at the plant and site level are expected to further improve efficiency in operations and aid to stable margins
Actively pursuing projects worth Rs 2,950 crore on international front and about Rs 1,020 Crores on the Domestic front, which are at the highest level in company history.
Performance Update

Engg 86%
Polymer 8%
Infra 6%
14
S e g m e n t P e r f o r m a n c e Q 2 & H 1 F Y ’ 2 0
S E G M E N T R E P O R T
Revenue Mix – H1 FY’20
Note: Segment EBITDA is net of Forex and includes allocation of un-allocable expenditure in pro-rata share of sales in their respective segment
Segment Financial Summary Q2
FY’20 Q2
FY’19 H1
FY’20 H1
FY’19
Engg.
Products
Net revenue 2,643.7 4,776.1 5,576.0 8,817.0
EBIDTA (w/o forex) 345.1 526.5 725.1 1,004.6
% of Revenue 13.1% 11.0% 13.0% 11.4%
Polymer
products
Net revenue 301.1 359.0 541.0 919.9
EBIDTA (w/o forex) 8.4 5.9 12.9 12.4
% of Revenue 2.8% 1.6% 2.4% 1.3%
Infra projects
Net revenue 187.7 104.5 401.2 289.7
EBIDTA (w/o forex) 3.1 2.2 11.9 26.0
% of Revenue 1.7% 2.1% 3.0% 9.0%
Total
Net revenue 3,132.5 5,239.6 6,518.2 10,026.6
EBIDTA (w/o forex) 356.6 534.6 749.9 1,043.0
% of Revenue 11.4% 10.2% 11.5% 10.4%

15
I M P R O V E M E N T T R E N D S
Op. EBITDA Margin (without Forex)
• Engineering & Stand Alone EBITDA margin are back to its normal range of 13% & 12 % respectively , Clocked the desired range for past 3 consecutive quarters.
• Improved margin performance despite of lower sales in Q2 & H1 FY’20 ; Corrective steps undertaken to reduce fixed cost, Stable Raw material prices and better operational efficiencies resulted in such improvement.
• Margins to get better with expected increase in Engineering execution on both domestic and international front going forth.
Note: Engineering EBITDA is net of Forex and includes allocation of un-allocable expenditure in pro-rata share of its sales
11.8% 11.0%
7.0%
13.3% 12.9% 13.1%
10.6% 10.2%
6.2%
12.2% 11.6% 11.4%
0.0%
10.0%
20.0%
Q1'19 Q2'19 Q3'19 Q4'19 Q1 Fy'20 Q2 Fy'20
Engineering Stand Alone

16
Debt Details
30.09.2019 30.09.2018 Increase / (Decrease)
Gross Debt 6,096 6,551 (455)
Net Debt 5,982 6,351 (369)
Rs in Mn
C A P I TA L S TA T U S
Long Term Debt Equity Ratio 0.27 0.32 (0.05)
Gross Debt Equity Ratio 0.93 1.05 (0.12)
Leverage Ratio (X)
• Half year Interest expenses down by 16% in compare to previous year period • Focus continues on Balance sheet consolidation ; Implementation of TOC in both Engineering &
Polymer business to significantly improve the working capital cycle and bottom-line profitability

17
E n g i n e e r i n g P r o d u c t s – O r d e r B o o k C o m p o s i t i o n – S e p 2 0 1 9
O R D E R B O O K P I E
67%
13%
20%
Domestic T&D Domestic - Telecom & Railways Exports
Total Order Book Rs 2,380 Crores
47%
30%
23%
PGCIL SEB & Private Export
Order Book to Sales stands at 1.5 X
T&D Order Book Rs 2,058 Crores

18
O R D E R I N F L O W S & C O M P O S I T I O N
H1 FY’20 Order Inflow Total – 852 Crores
Strong Bidding Pipeline of 3,970 Crores as on 30th Sep 2019;
International – 2,950 Cr & Domestic - 1,020 Cr
73%
22%
5% T&D Domestic T&D - Export
Railways & Telecom
• Secured new orders of Rs 667 crore in Q2 FY’20 for engineering products supplies from PGCIL, SEB’s, Railways and for supplies across various export markets.
• YTD Engineering Order Intake of Rs 852 crores ; Share of Non T&D products at 13% in overall order book
• T&D Order book well diversified between Power Grid, Domestic SEB and International Projects
The company expects Ordering & Execution to gain pace in the second half of the year with increased participation opportunities from Power Grid, SEB, TBCB projects, Exports and Infrastructure push in North East & East India.
Growing global competiveness; Focusing on international markets to drive the ordering growth
EPC tenders for some of the recently awarded TBCB projects are to get finalised by this quarter.
Plans worth of Rs 50,000 crores of Green Energy corridor related projects to come up for bidding from next year will provide a big boost to the domestic transmission industry
Strong order traction from Domestic Railway; Non T&D share of business will continue to grow.

19
P E R F O R M A N C E O U T L O O K
Rebound expected in domestic T&D action both on Ordering and Execution front from next quarter onwards
Focus on strengthening the international T&D order book ; Positioned to grow exports to 40% of revenue in next 2 years
Desired EBITDA margin focus of 12-13% in FY’20
Implementation of TOC in both Engineering and Polymer business to significantly improve its working capital cycle and bottom-line profitability
Volume-value play to drive shareholder value
B U S I N E S S O U T L O O K

20
T H E B I G M E S S A G E
Profitability in a downturn is a validation of Skipper’s business model
Conscious slowing down: Not chase growth at the cost of financial discipline
Sectoral consolidation to lead to next rebound; opportunity to switch sectors based on margin positive
Skipper opportunity-ready through re-navigated business model
Progressive broadbasing to strengthen revenues and margins – overall quality of business
B U S I N E S S M A N T R A

BROADBASING OUR PYRAMIDS
Core Strategy

22
E N G I N E E R I N G P R O D U C T S B U S I N E S S
Broadbasing the pyramid
Broadbasing the number of sectors addressed Riding the growth of some fast-growing segments into the long-term like telecom and railways
Broadbasing the customer mix within each sector (government and non-government)
Riding the inflection point within India where the power transmission sector opened to private players
Broadbasing the number of customers Addressing the needs of a reasonable number of the large and a large number of small fast growing companies
Broadbasing the countries of our presence
Entering new geographies to derisk from an excessive dependence on one or few economies
1 2
3 4
W H A T I S B R O A D B A S I N G T H E P Y R A M I D ?

23
To strengthen margins; some
sectors promise lower working capital cycle
To be able to capitalise on
sectoral upturns with speed;
faster off the blocks
To strengthen competitiveness;
last person standing
To transform from an Indian company into a
global player
To report a lower sectoral
beta; smooth the performance
curves
To progress towards any-
market business sustainability
W H Y W E A R E B R O A D B A S I N G
W H Y B R O A D B A S I N G T H E P Y R A M I D ?
24
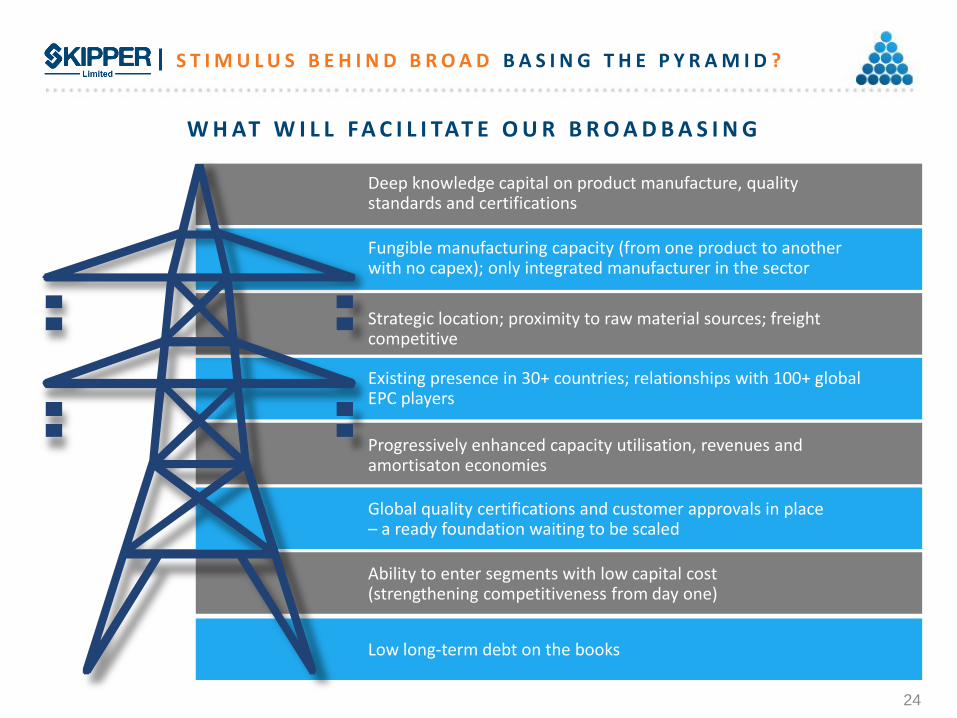
W H AT W I L L F A C I L I TAT E O U R B R O A D B A S I N G
Deep knowledge capital on product manufacture, quality standards and certifications
Fungible manufacturing capacity (from one product to another with no capex); only integrated manufacturer in the sector
Existing presence in 30+ countries; relationships with 100+ global EPC players
Progressively enhanced capacity utilisation, revenues and amortisaton economies
Global quality certifications and customer approvals in place – a ready foundation waiting to be scaled
Ability to enter segments with low capital cost (strengthening competitiveness from day one)
Low long-term debt on the books
Strategic location; proximity to raw material sources; freight competitive
S T I M U L U S B E H I N D B R O A D B A S I N G T H E P Y R A M I D ?

25
T H E I M PA C T O F T H E B R O A D B A S I N G : F O U R D R I V E R S
Focus on projects coming out
of PGCIL, SEB and private transmission
players (Domestic T&D)
Building credential and
relationship with global EPC players to gain presence in international
market
Focus on telecom and railways
sectors (domestic sectoral
diversification)
Increased bidding for
projects promising
superior IRR
Order book break-up as per segments T&D order book break-up as per End user
K E Y D R I V E R S O F T H E I D E A
87%
7% 6%
T&D Telecom Railways
Order book break-up as per segments
47%
30%
23%
PGCIL SEB & Others Exports
As on June, FY20 As on June, FY20

26
B R O A D B A S I N G W O V E N A R O U N D F I N A N C I A L D I S C I P L I N E
Driven by the philosophy of
profitable growth
Bids for projects that meet basic IRR
criteria
Believes that no business is better
than bad business
Consistent resistance to chasing
volumes over profits
Can temporarily and selectively
sacrifice margins for a larger strategic market entry and
growth
Geographic diversification
(global) dictated by large volumes,
superior realisations and quicker receivables
Invested in pre-bid team capabilities;
attractive strike rate of around 50 %

SKIPPER LIMITED INVESTOR PRESENTATION
Future Ready

28
BROADBASING TO REDUCE DOMESTIC DEPENDENCE
• Opportunity-ready: Certified by prominent international organizations for confidence-enhancing certifications
• Established traction: Working with over 100 Global EPC player ; Enlisted 11 prominent customers in two years
• Creditable beginning: first-time enquiries from South Korea, Uruguay, Paraguay, Romania, Croatia, Mexico, Panama, Poland, Afghanistan, Russia, Australia and Nicaragua among others
• Optimistic outlook: Positioned to grow exports to 40 % of revenues in next two year and to 50% in three years (15% today)
• Competitiveness: Increasing cost of labour and capacity shut downs in China is making Indian players like us globally competitive
• Visible brand: Participated in around 25 global exhibitions in two years to enhance visibility
•
Certification Country
CFE/LAPEM Mexico
CWB Canada & USA
DEWA Dubai
ROHAS Malaysia
CE CERTIFICATION Europe
ACHILLES/STATNET Nordics
Saudi Electric Company Saudi Arabia
The Jordanian Electric Power Company Ltd Jordan
RETIE Colombia
EETC Egypt
BPC Bhutan
KETRACO Kenya
TCN Nigeria
NGCP Philippines
International certifications
E X P L O R I N G N E W G E O G R A P H I E S

• Skipper is the highest accredited manufacturers in India for supplying to global markets
• Largest and lowest cost manufacturer out of India and one of the lowest globally • In between 2005 – 15 Skipper supported multiple Indian non integrated T&D EPC Contractors
(holding major market share) with low cost reliable Transmission Tower supplies (Towers are almost 50% of the value of any project).
• Currently replicating the same format in International markets with major International EPC contractors, helping them leverage their relations with the Utilities better
• Increase in approvals such as CWB (North America), Lapem (Central America & Mexico), CE (Europe), DEWA (Middle east), Achilles (Nordic countries) and Sirim (South East Asia) which gives it better access to T&D business in these regions. Continuously increasing , Utility approval list with more key utilities in the European markets
29
L E A D E R S H I P P O S I T I O N
S K I P P E R I S C L E A R LY P O I S E D T O B E I N T H E W I N N I N G S P O T I N T H E I N T E R N AT I O N A L T & D S E C T O R

WHAT MAKES US MORE COMPETITIVE
Higher Price : Chinese manufacturers are almost 10-15% higher priced than Indian manufacturers, owing to un favorable currency and much higher labor costs.
Limited Capacities to offer : Chinese manufacturers have cut capacities owing to pollution issues and the remaining capacity is tied up in their Belt – Road project so are quoting very long lead times.
Reliability: More and more global utilities are interested to source from Indian manufacturers compared to Chinese due to regular quality issues over the years.
30
G R O W I N G G L O B A L C O M P E T I T I V E N E S S
SKIPPER C H I N E S E M A N U FA C T U R E R S

31
Bidding Volumes T&D sector
2017-18 Rs in Cr
H1 FY’20 Rs in Cr
Change %
International T&D 810 2,950 264%
Domestic T&D 1,625 1,020 -37%
Total 2,435 3,970 63%
Considerable increase in Bidding Volumes from International T&D Sector
G R O W I N G G L O B A L C O M P E T I T I V E N E S S
67% 33%
FY 2017-18
Domestic T&D International T&D
These developments reinforce our belief of a significant turnaround in the international markets.
26%
74%
H1- FY’20
Domestic T&D International T&D

32
GLOBAL T&D INVESTMENT OPPORTUNITIES
G L O B A L N E E D
According to World Energy Outlook (WEO) 2015, a total of US$ 8.4 trillion investments are expected to flow in the global T&D investments between 2015 and 2040, averaging US$320 billion per year.

33
T&D INDUSTRY OVERVIEW IN INDIA
• Historical skew between generation and T&D asset creation; shortage of power evacuation capacity
• Skew correction across the last decade: substantial increase in T&D capacity amounting to 345 GW as on September 2019 which is estimated to grow at a CAGR of 6.5% between 2018 and 2023.
• Part of an overarching government agenda: one nation, one grid
• National power grid backbone enabling regions of power surplus to feed regions of power deficit
• Part of a long-term structural correction to maximise national resource use and create one consolidated market
• This structural correction to widen and deepen: large room for India’s transmission network to grow
• India Transmission capex estimated at INR 2.6 trillion (+49%) in the 13th Plan.
I N D I A S T O R Y

34
STRONG OPPRTUNITY IN INDIA’S T&D SECTOR
• Planned government transmission sector investment of Rs 2.6 lakh crore in FY17-22; estimated Rs 1.3 lakh crore allocated for intra-state transmission capacity. SEBs and private players to drive orders
• Village electrification, railway electrification, enhanced public-private participation and Electricity for All by 2019 to drive sectoral rebound
• 175 GW renewable energy capacity addition targeted by 2022 – an unprecedented opportunity
• Rs 50,000 cr Plus Green Corridor Projects (Lines being built in Western region catering to Renewable power sources)
• Dedicated schemes of Rs 1.09 lakh cr to provide 24x7 power (rural and urban)
• Unprecedented Rs 1 lakh cr allocated by Central government for national transmission grid
• Growing transmission focus with substantial line capacity addition from 11th Plan to 13th Plan
• 100,000+ CKM transmission lines at 220 kV+ projected for 13th Plan
• R-APDRP launched by Ministry of Power; upgradation of transmission and distribution network to reduce AT&T losses to 15%
• Growing participation in tariff-based competitive bidding (TBCB) by Indian private sector giants (Sterlite, Essel and Adani) creating multiple revenue engines
• SAARC keen to develop robust transmission grid to enhance pan-sub-continental power trade
• Growing popularity of monopoles
Total line capacity
11th Plan: 2,57,481 CKM
12th Plan: 3,64,921 CKM
13th Plan: 4,70,515 CKM
D O M E S T I C O P P O R T U N I T I E S

35
E X P E C T E D T R A N S M I S S I O N S Y S T E M A D D I T I O N D U R I N G 2 0 1 7 - 2 2
Transmission line length(ckt. km)
As of March 2017 Addition during 2017-18
(till September 2017) Planned addition during
2017-22 Balance capacity to be
added by 2022
HVDC (800/500 kV) 15,556 - 4,280 4,280
765 kV 31,240 2,046 27,300 25,254
400 kV 1,57,787 8,678 46,000 37,322
220 kV 1,63,268 1,627 28,000 26,173
Total 3,67,851 12,551 1,05,580 93,029
HDVC capacity (MW)
+/-800 kV 5,000 3,000 14,000 11,000
+/-500 kV 13,500 - -
Total 19,500 - 14,000 11,000
Substation capacity (MVA)
765 kV 1,67,500 10,000 1,14,000 1,04,000
400 kV 2,40,807 20,445 1,03,000 82,555
220 kV 3,12,958 8,620 75,000 66,380
Total 7,21,265 39,065 2,92,000 2,52,935
Source : Central Electricity Authority

36
REASONS FOR LONG-TERM SECTORAL OPTIMISM
• India the fastest growing major global economy; expected to quadruple and emerge as a $ 10 trn economy in the next 15 years
• India’s power appetite projected to increase [4]x in line with its growing economy in the next decade
• India extensively under-penetrated: per capita power consumption considerably lower than peer countries which is estimated to reach 3000 units by 2040 compared to 1150 units in 2018.
• Three forecasted drivers of India’s power consumption: organic increase in demand in a growing economy; under-penetration likely to correct (supply likely to increase demand)/ substantial growth of renewable energy
P O S I T I V E O U T L O O K

37
Railways Around 6,000 km of electrification planned annually for the next three-four years • CORE approvals for all plants after Uluberia
expected soon • This will enable Skipper to utilise its capacity
(across T&D, Railways and Telecom).
Telecom Accelerating data boom: 5G rollout expected to drive next stage of tower rollout
• Significant presence in telecom towers; preferred tower supplier for Jio and all major domestic telecom companies
• Alliance with Ramboll – Denmark for technical design/support in process and quality assurance
E M E R G I N G G R O W T H D R I V E R S R A I L W AY S & T E L E C O M
Existing capacities and capabilities fungible across sectors
The greater the fungibility, the superior the return on gross block
Margins-enhancing competitive advantage
Will progressively enhance capacity utilisation, revenues and amortisaton economies
G A M E P O I N T

38
Received CORE approval for all the plant to manufacture and supply various types of Railway overhead wiring support structures.
Projected spending of Rs 35,000 cr over a period of next 3-4 lined up for Railway Electrification in India ; 40-45% of this to get invested in Rail Structures
Large and robust growth plan in the pipeline: multi-year growth outlook
Proposed electrification of 6,000 km network in 2018-19 and 7,000 km route in 2019 -20
Projects of Rs 40,000 cr-plus to connect capitals of five NE states and border areas with rest of the country and areas bordering China, Myanmar and Bangladesh with the rest of the country. Being an East India player we are logistically well placed to target these large upcoming opportunities
RAILWAYS ELECTRIFICATION
0
4000
8000
2016-17 2017-18 2018-19 2019-20 2020-21
Railway up-gradation (Rs in Cr)
R A I L W AY E L E C T R I F I C A T I O N S E C T O R

39
• Large engineering capacity which can be deployed to make Railway Masts
• Low cost base of manufacturing
• One plant already approved - three more under approval
• Integrated manufacturing facility with own raw material rolling facility
S K I P P E R I S C L E A R LY P O I S E D T O B E I N T H E W I N N I N G S P O T I N T H E R A I LW AY S E C T O R
L E A D E R S H I P P O S I T I O N

40
TELECOM TOWER
• India needs around 100,000 additional towers to address growth
• National Telecom Policy aims to inspire $100 bn investment in five years
• India’s 30 per cent broadband penetration leaves large headroom
• Sector added 65,000 mobile towers in two years
• Expansion of 4G, 5G, Artificial Intelligence, Virtual Reality, Internet of things and M2M among others are driving the need for more towers
China
India
1.4 bn
Customers
1.18 bn
Customers
1.94 mn
Telecom tower
0.46 mn
Telecom towers
I N D I A O N T H E C U S P O F M O B I L E D A T A E X P L O S I O N
India;s smartphone users will more than double by 2022 (in mn)
The number of connected devices will boom in india (in bn)
Average mobile data consumption per month in India (in gigabytes)
20
17
2
02
2
0 900 600 300
20
17
2
02
2
0 2.4 1.6 0.8
20
17
2
02
2
0 18 12 6 2.0 1.2 0.4
T E L E C O M S E C T O R

41
S K I P P E R I S C L E A R LY S E T T O B E I N T H E W I N N I N G S P O T I N T H E T E L E C O M S E C T O R
L E A D E R S H I P P O S I T I O N
• Large engineering capacity to support manufacturing of Telecom structures
• Proximity to focus Telcos markets - East & North East
• Tie up with one of world's leading tower design company - Ramboll
• Long standing relationships with major telecos in India and abroad

42
SKIPPER’S POLYMER BUSINESS
Polymer manufacturing
capacity of 51,000 MTPA
Plants invested state-of-the-art manufacturing
technology
70%+ gross block less than six years
old
Among few Indian companies assured of CPVC for pipes
manufacture
One of few Indian companies with NSF certification
Quality certifications
• ASTM D-1785, ASTM D-2467, ASTM D-2846 • IS: 12818 • IS: 13592 • IS: 4985 • IS: 15778 • IS: 13592 • IS: 14735 • IS: 10124 • IS: 14182 • NSF
P O LY M E R P R O D U C T S S E G M E N T
43
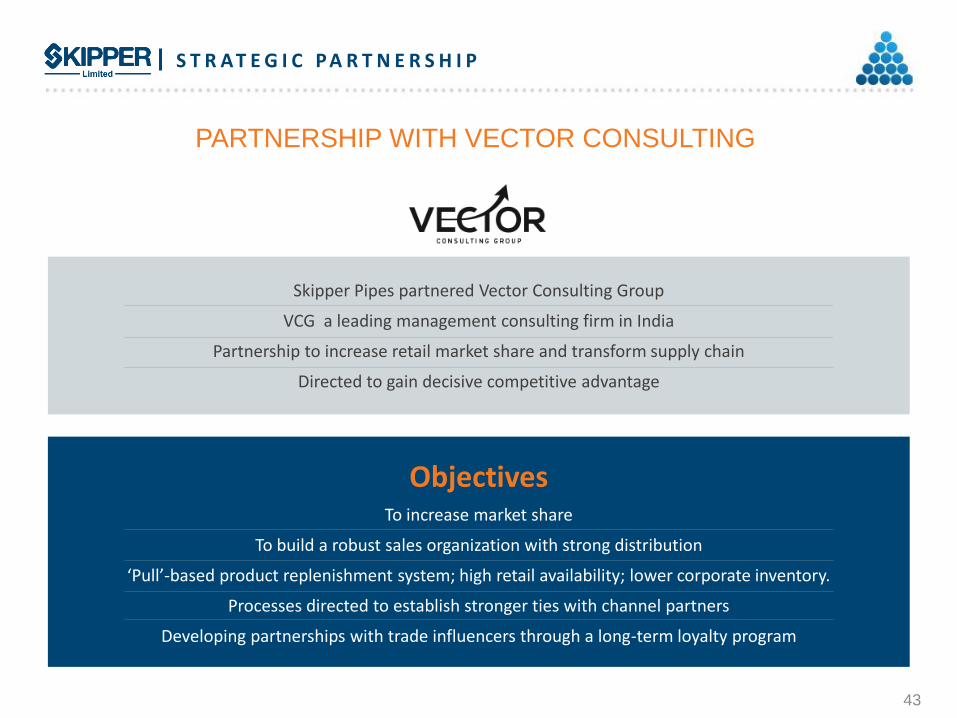
PARTNERSHIP WITH VECTOR CONSULTING
Skipper Pipes partnered Vector Consulting Group
VCG a leading management consulting firm in India
Partnership to increase retail market share and transform supply chain
Directed to gain decisive competitive advantage
Objectives To increase market share
To build a robust sales organization with strong distribution
‘Pull’-based product replenishment system; high retail availability; lower corporate inventory.
Processes directed to establish stronger ties with channel partners
Developing partnerships with trade influencers through a long-term loyalty program
S T R A T E G I C P A R T N E R S H I P

44
OUR USP
• Partnering benefits:
• Exponential Sales Growth & Gain in Market Share
• Robust Processes & Systems in place to improve profitability
• Consistent availability of entire range of products at billing points
• Improvement in working capital cycle and reduction of inventory days
• Gain of more output from the current capacity
• Improvement in ROI to dealers and distributors
Skipper is the only Indian polymer pipe company to
implement Theory of Constraints (TOC)
approach in an organized manner
Directed to empower the supply chain processes
and systems
T H E O R Y O F C O N S T R A I N T S

45
AWARDS AND ACCOLADES
A W A R D : T H E L A R G E S T T O W E R
S U P P L I E R F O R 3 r d C O N S E C U T I V E Y E A R
G I V E N B Y : P O W E R G R I D
C O R P O R A T I O N O F I N D I A L T D . ( P G C I L )
A W A R D : E M E R G I N G P O W E R
E P C P L A Y E R G I V E N B Y : E P C
W O R L D
A W A R D : G L O B A L H R
E X C E L L E N C E G I V E N B Y :
W O R L D H R D C O N G R E S S
A W A R D : N O . 1 E M E R G I N G
B R A N D I N P O L Y M E R P I P E S &
F I T T I N G S G I V E N B Y : W C R C
A W A R D : M O S T V A L U A B L E
C O N T R I B U T I O N T O P O W E R I N D U S T R Y
G I V E N B Y : E T E D G E
A W A R D : S T A R P E R F O R M E R
A W A R D F O R T H E Y E A R 2 0 1 5 - 1 6
G I V E N B Y : E E P C I N D I A
A W A R D : T H E B E S T P O L Y M E R
B R A N D G I V E N B Y :
C O N S T R I C T I O N T I M E S
A W A R D : M O S T E T H I C A L
C O M P A N Y G I V E N B Y :
W O R L D C S R D A Y
H O N O R S

46
D I S C L A I M E R
For any queries please contact:
Aditya Dujari (Investor Relations)
Skipper Limited 3A, Loudon Street, 1St Floor, Kolkata 700 017
E-Mail: [email protected] Tel: + 91 33 2289 2327/5731 Mobile: 9830806906
This Investor Presentation has been prepared by Skipper Limited for investors, solely for informational purposes. The information contained herein has been prepared to assist prospective investors in making
their own evaluation of the Company and does not purport to be all-inclusive or to contain all of the information a prospective or existing investor may desire. In all cases, interested parties should conduct their own investigation and analysis of the Company and the data set forth in this information. Skipper
makes no representation or warranty as to the accuracy or completeness of this information and shall not have any liability for any representations (expressed or implied) regarding information contained in, or for
any omissions from, this information or any other written or oral communications transmitted to the recipient in the course of its evaluation of the Company. This Information includes certain statements and
estimates provided by the Company with respect to the projected future performance of the Company. Such statements, estimates and projections reflect various assumptions by management concerning
possible anticipated results, which assumptions may or may not be correct. No representations are made as to the accuracy of such statements, estimates or projections. Prospective investors will be expected to have conducted their own due diligence investigation regarding these and all other matters pertinent to
investment in the Company. This presentation may contain statements that are not historical facts, referred to as “forward looking statements.” The corporation’s actual future results may differ materially
from those suggested by such statements, depending on various factors including statements contained in the Company's filings with the Stock Exchanges and our reports to shareholders. The Company does not
undertake to update any written or oral forward-looking statements that may be made from time to time by or on behalf of the Company