Investor Presentation - bhbt.com · Investor Presentation November 2014 NYSE MKT: BHB For more...
19
Investor Presentation November 2014 NYSE MKT: BHB www.bhbt.com For more information contact: Curtis C. Simard, President & CEO Gerald Shencavitz, EVP & CFO 207-288-3314 1
Transcript of Investor Presentation - bhbt.com · Investor Presentation November 2014 NYSE MKT: BHB For more...
Investor Presentation
November 2014
NYSE MKT: BHB
www.bhbt.com
For more information contact:
Curtis C. Simard, President & CEO
Gerald Shencavitz, EVP & CFO
207-288-3314
1
FORWARD-LOOKING STATEMENTS
The information presented may contain certain forward-looking statements within the meaning of the Private Securities Litigation Reform Act of
1995.. You can identify these forward-looking statements by the use of words like “strategy,” “anticipates” “expects,” “plans,” “believes,” “will,”
“estimates,” “intends,” “projects,” “goals,” “targets,” and other words of similar meaning. You can also identify them by the fact that they do not
relate strictly to historical or current facts. Forward-looking statements include, but are not limited to, those made in connection with estimates with
respect to the future results of operation, financial condition, and the business of the Company which are subject to change based on the impact of
various factors that could cause actual results to differ materially from those projected or suggested due to certain risks and uncertainties. These risks
and uncertainties include, but are not limited to:
• general economic conditions, either nationally or regionally, resulting in, among other things, a deterioration in credit quality;
• changes in the interest rate environment that could reduce margins;
• changes in monetary and fiscal policies;
• the highly competitive industry and market area in which we operate;
• changes in deposit flows and loan demand;
• changes in business conditions and inflation;
• continued relationships with major customers;
• changes in technology used in the banking business;
• failure of our technology infrastructure or information security incidents;
• our controls and procedures may fail or be circumvented;
• the effects of more stringent capital or liquidity requirements;
• changes in key management personnel;
• the effects of terrorist activities and other hostilities; and
• recent or proposed legislative and regulatory initiatives including accounting principles, policies or guidelines, as well as other economic,
competitive, governmental, regulatory and accounting and technological factors affecting the Company’s operations.
Bar Harbor Bankshares cautions that the foregoing list of factors is not exclusive. For a discussion of factors that may cause actual results to differ
from expectations, please refer to our filings with the Securities and Exchange Commission. In particular, please refer to "Item 1A. Risk Factors" of
the Bar Harbor Bankshares Annual Report on Form 10-K for the year ended December 31, 2013 as updated by the Company’s Quarterly reports on
Form 10-Q and other filings with the Commission. Forward-looking statements speak only as of the date they are made. Bar Harbor Bankshares does
not undertake to update forward-looking statements to reflect facts, circumstances, assumptions or events that occur after the date the forward-looking
statements are made. For any forward-looking statements made in this presentation or in any documents, Bar Harbor Bankshares claims the protection
of the safe harbor for forward-looking statements contained in the Private Securities Litigation Reform Act of 1995.
2

Corporate Overview September 30, 2014
• Bar Harbor Bank & Trust – commercial
and retail banking services through 15 branch
offices along the coast of Maine
• Bar Harbor Trust Services – trust and
investment management; $386 million AUM
• Bar Harbor Financial Services – a third-
party registered broker-dealer offering
securities and insurance products with over
3,000 customers
Founded in 1887
Bank Holding Company
Headquarters: Bar Harbor, ME
Assets: $1.44 billion
Loans: $898 million
Deposits: $887 million
Market Cap: $179 million (11/6/14)
Shares Outstanding: 5.9 million
Tangible Book Value per Share: $22.88
3
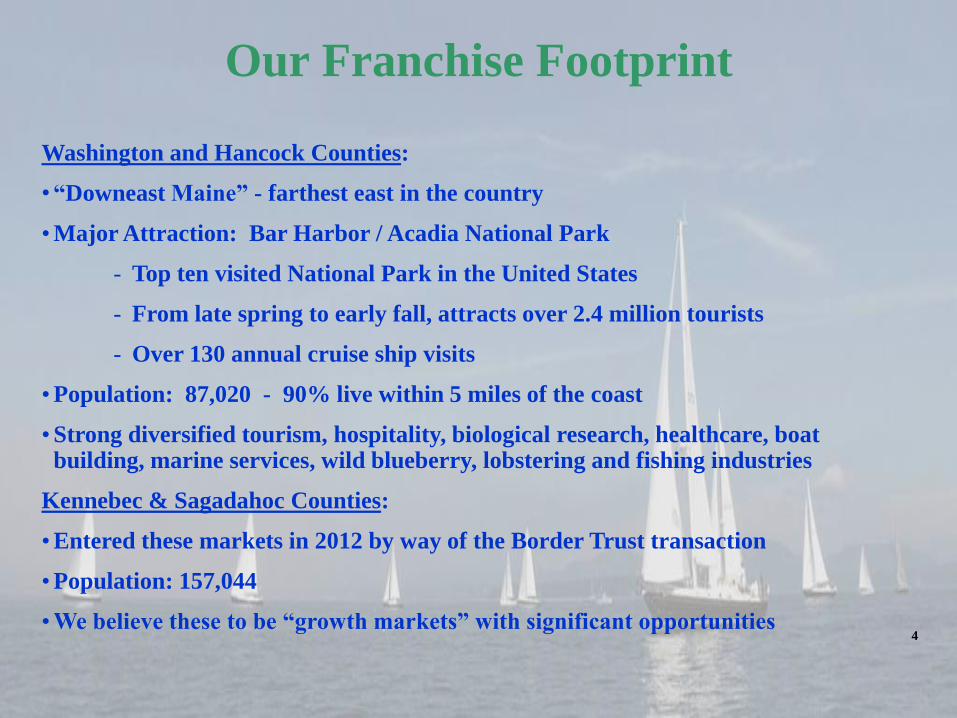
Our Franchise Footprint
Washington and Hancock Counties:
•“Downeast Maine” - farthest east in the country
• Major Attraction: Bar Harbor / Acadia National Park
- Top ten visited National Park in the United States
- From late spring to early fall, attracts over 2.4 million tourists
- Over 130 annual cruise ship visits
• Population: 87,020 - 90% live within 5 miles of the coast
• Strong diversified tourism, hospitality, biological research, healthcare, boat building, marine services, wild blueberry, lobstering and fishing industries
Kennebec & Sagadahoc Counties:
• Entered these markets in 2012 by way of the Border Trust transaction
• Population: 157,044
• We believe these to be “growth markets” with significant opportunities
4
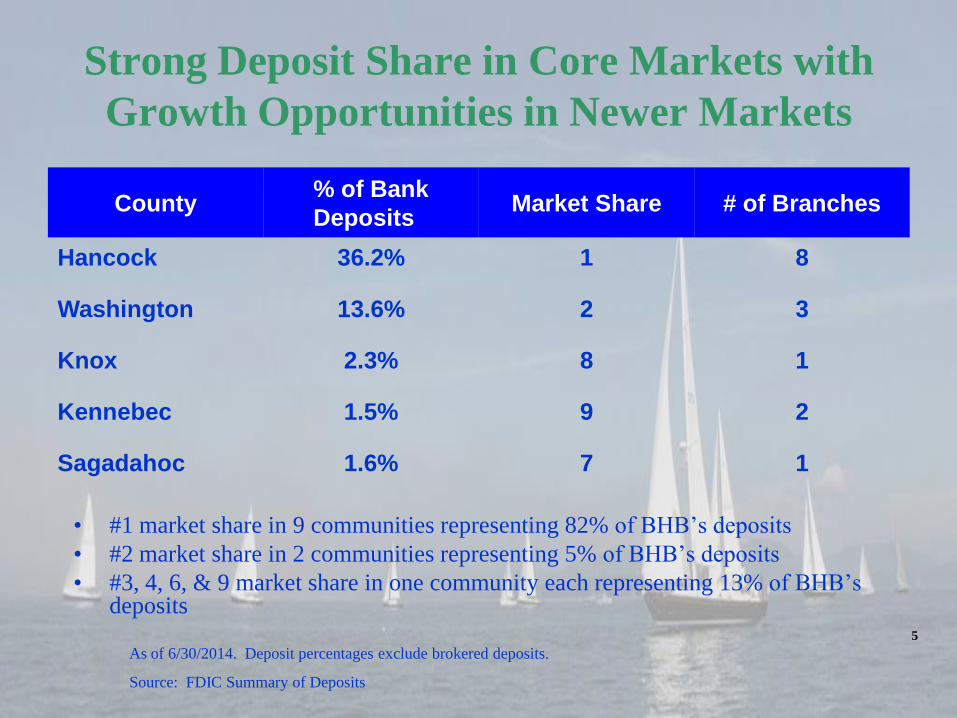
Strong Deposit Share in Core Markets with
Growth Opportunities in Newer Markets
• #1 market share in 9 communities representing 82% of BHB’s deposits
• #2 market share in 2 communities representing 5% of BHB’s deposits
• #3, 4, 6, & 9 market share in one community each representing 13% of BHB’s deposits
County % of Bank
Deposits Market Share # of Branches
Hancock 36.2% 1 8
Washington 13.6% 2 3
Knox 2.3% 8 1
Kennebec 1.5% 9 2
Sagadahoc 1.6% 7 1
As of 6/30/2014. Deposit percentages exclude brokered deposits.
Source: FDIC Summary of Deposits
5
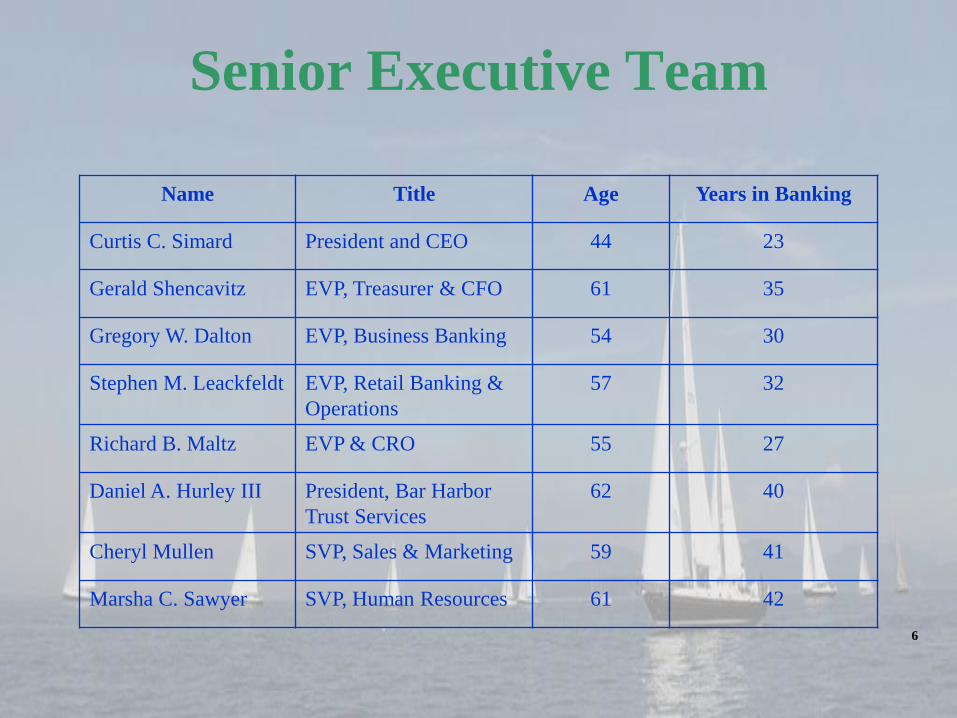
Senior Executive Team
Name Title Age Years in Banking
Curtis C. Simard President and CEO 44 23
Gerald Shencavitz EVP, Treasurer & CFO 61 35
Gregory W. Dalton EVP, Business Banking 54 30
Stephen M. Leackfeldt EVP, Retail Banking &
Operations
57 32
Richard B. Maltz EVP & CRO 55 27
Daniel A. Hurley III President, Bar Harbor
Trust Services
62 40
Cheryl Mullen SVP, Sales & Marketing 59 41
Marsha C. Sawyer SVP, Human Resources 61 42
6
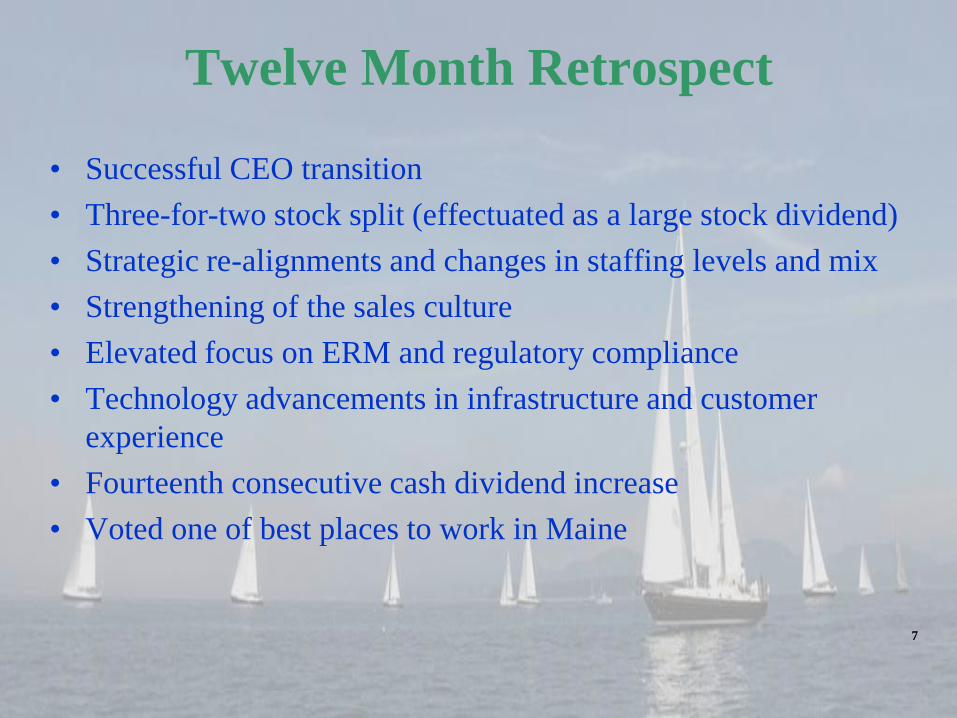
Twelve Month Retrospect
• Successful CEO transition
• Three-for-two stock split (effectuated as a large stock dividend)
• Strategic re-alignments and changes in staffing levels and mix
• Strengthening of the sales culture
• Elevated focus on ERM and regulatory compliance
• Technology advancements in infrastructure and customer
experience
• Fourteenth consecutive cash dividend increase
• Voted one of best places to work in Maine
7
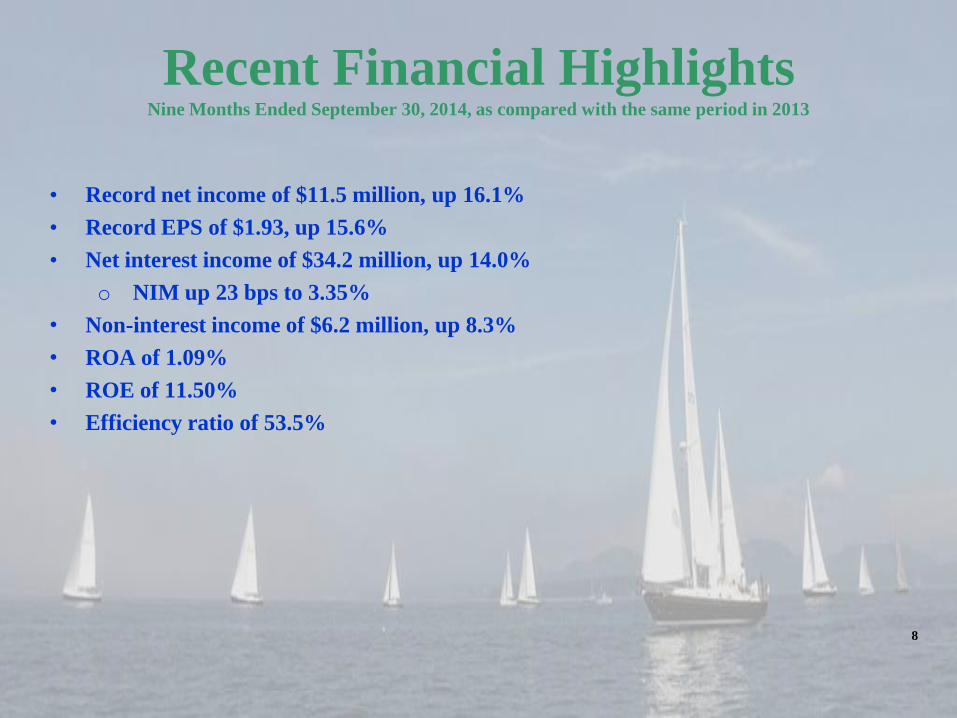
Recent Financial Highlights Nine Months Ended September 30, 2014, as compared with the same period in 2013
• Record net income of $11.5 million, up 16.1%
• Record EPS of $1.93, up 15.6%
• Net interest income of $34.2 million, up 14.0%
o NIM up 23 bps to 3.35%
• Non-interest income of $6.2 million, up 8.3%
• ROA of 1.09%
• ROE of 11.50%
• Efficiency ratio of 53.5%
8
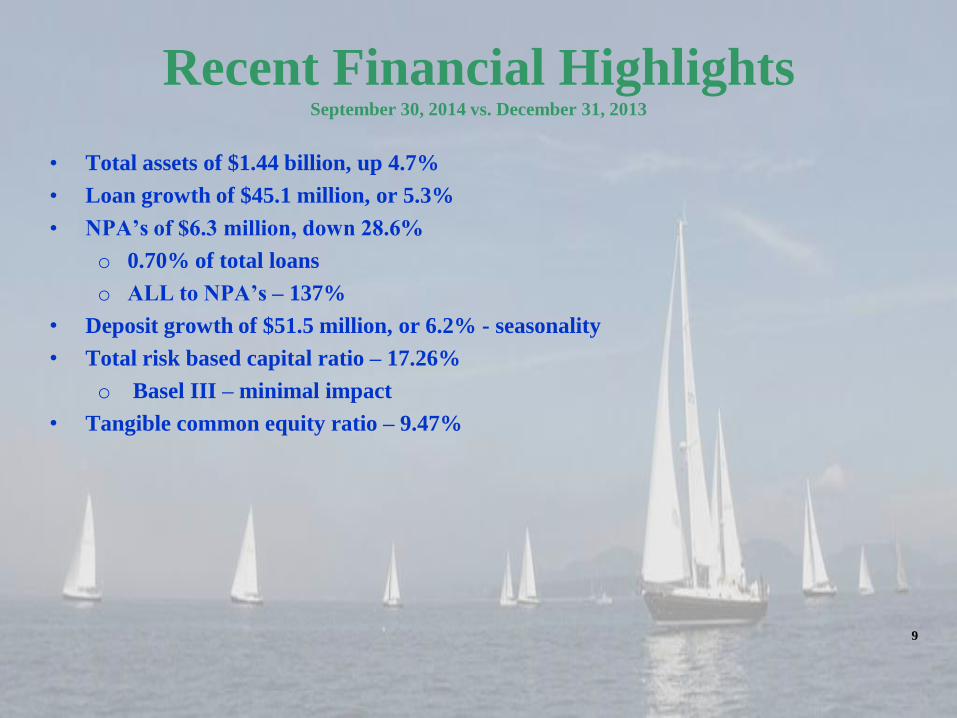
Recent Financial Highlights September 30, 2014 vs. December 31, 2013
• Total assets of $1.44 billion, up 4.7%
• Loan growth of $45.1 million, or 5.3%
• NPA’s of $6.3 million, down 28.6%
o 0.70% of total loans
o ALL to NPA’s – 137%
• Deposit growth of $51.5 million, or 6.2% - seasonality
• Total risk based capital ratio – 17.26%
o Basel III – minimal impact
• Tangible common equity ratio – 9.47%
9
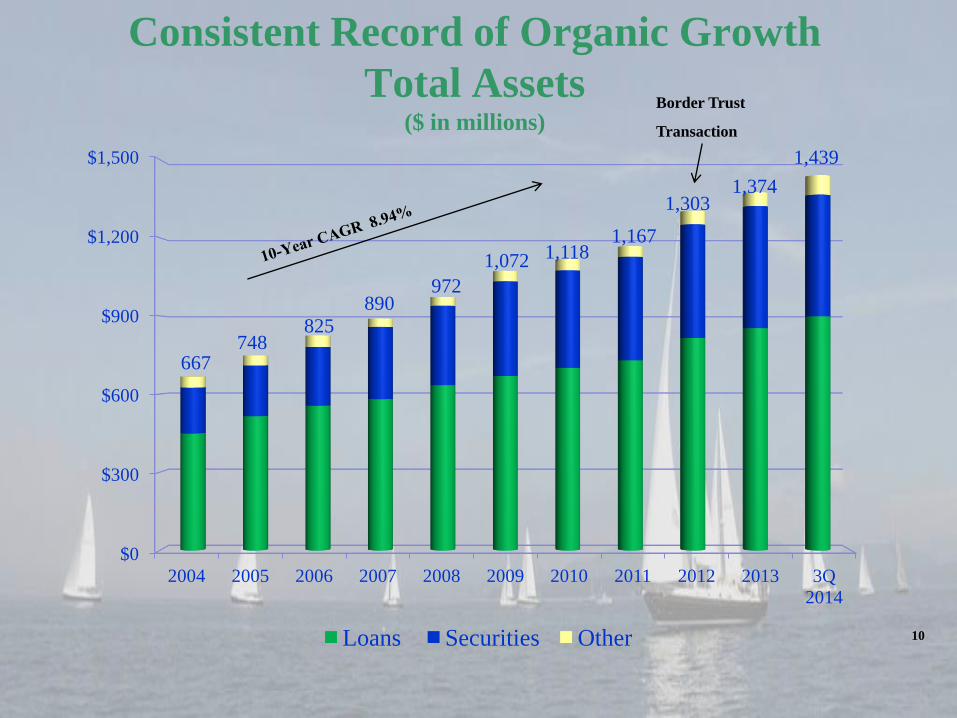
Consistent Record of Organic Growth
Total Assets ($ in millions)
$0
$300
$600
$900
$1,200
$1,500
2004 2005 2006 2007 2008 2009 2010 2011 2012 2013 3Q
2014
667 748
825 890
972
1,072 1,118 1,167
1,303 1,374
1,439
Loans Securities Other
Border Trust
Transaction
10
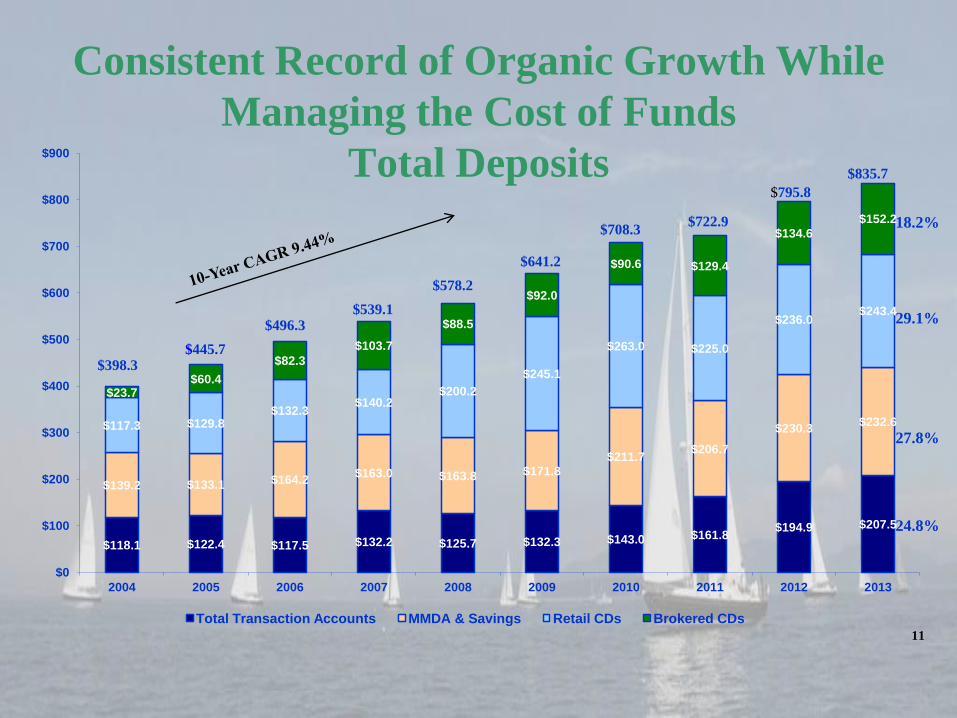
Consistent Record of Organic Growth While
Managing the Cost of Funds
Total Deposits
$118.1 $122.4 $117.5 $132.2 $125.7 $132.3 $143.0 $161.8 $194.9 $207.5
$139.2 $133.1 $164.2 $163.0 $163.8 $171.8
$211.7 $206.7
$230.3 $232.6 $117.3 $129.8
$132.3 $140.2
$200.2
$245.1
$263.0 $225.0
$236.0 $243.4
$23.7 $60.4
$82.3
$103.7
$88.5
$92.0
$90.6 $129.4
$134.6
$152.2
$0
$100
$200
$300
$400
$500
$600
$700
$800
$900
2004 2005 2006 2007 2008 2009 2010 2011 2012 2013
Total Transaction Accounts MMDA & Savings Retail CDs Brokered CDs
$795.8
$496.3 $539.1
$578.2
$641.2
$708.3 18.2%
29.1%
27.8%
24.8%
$445.7 $398.3
$722.9
$835.7
11
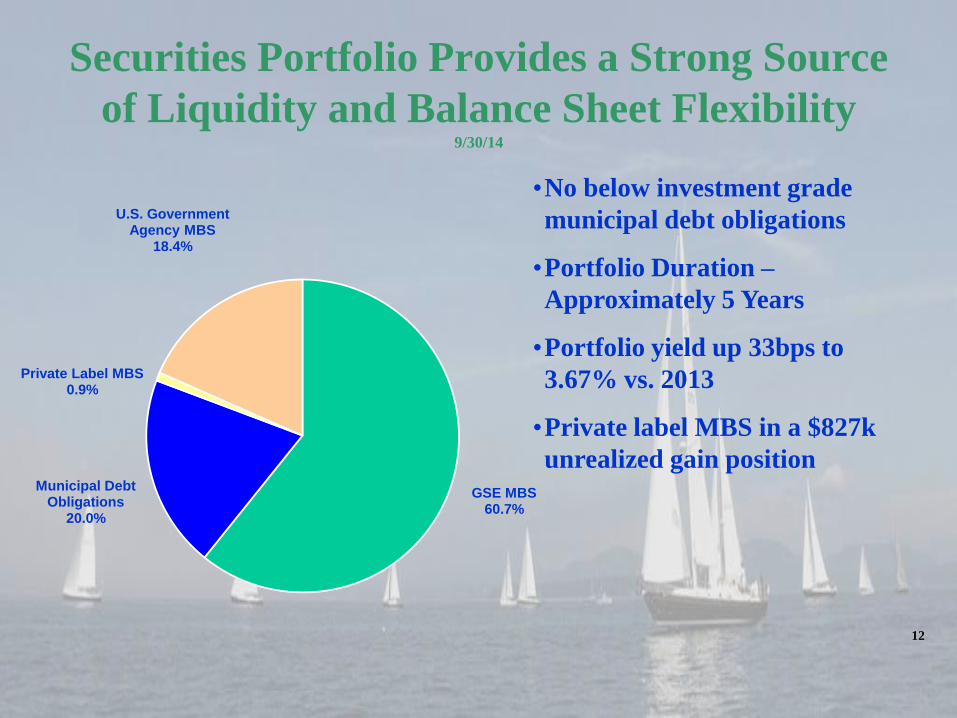
Securities Portfolio Provides a Strong Source
of Liquidity and Balance Sheet Flexibility 9/30/14
•No below investment grade
municipal debt obligations
•Portfolio Duration –
Approximately 5 Years
•Portfolio yield up 33bps to
3.67% vs. 2013
•Private label MBS in a $827k
unrealized gain position
GSE MBS 60.7%
Municipal Debt Obligations
20.0%
U.S. Government Agency MBS
18.4%
Private Label MBS 0.9%
12
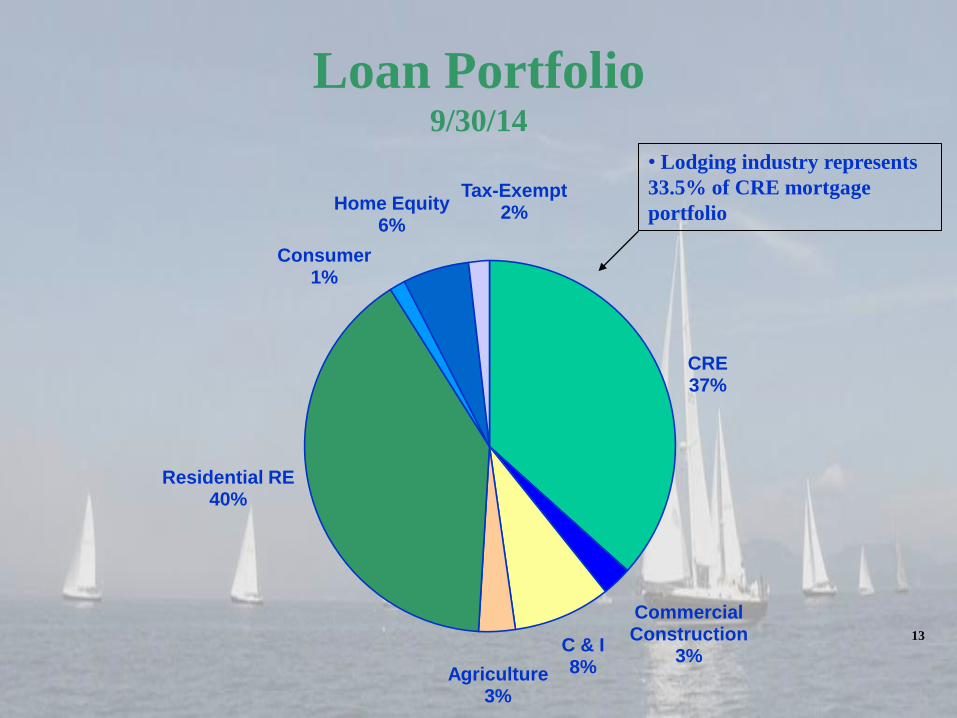
Loan Portfolio 9/30/14
CRE 37%
Commercial Construction
3% C & I 8% Agriculture
3%
Residential RE 40%
Consumer 1%
Home Equity 6%
Tax-Exempt 2%
• Lodging industry represents
33.5% of CRE mortgage
portfolio
13
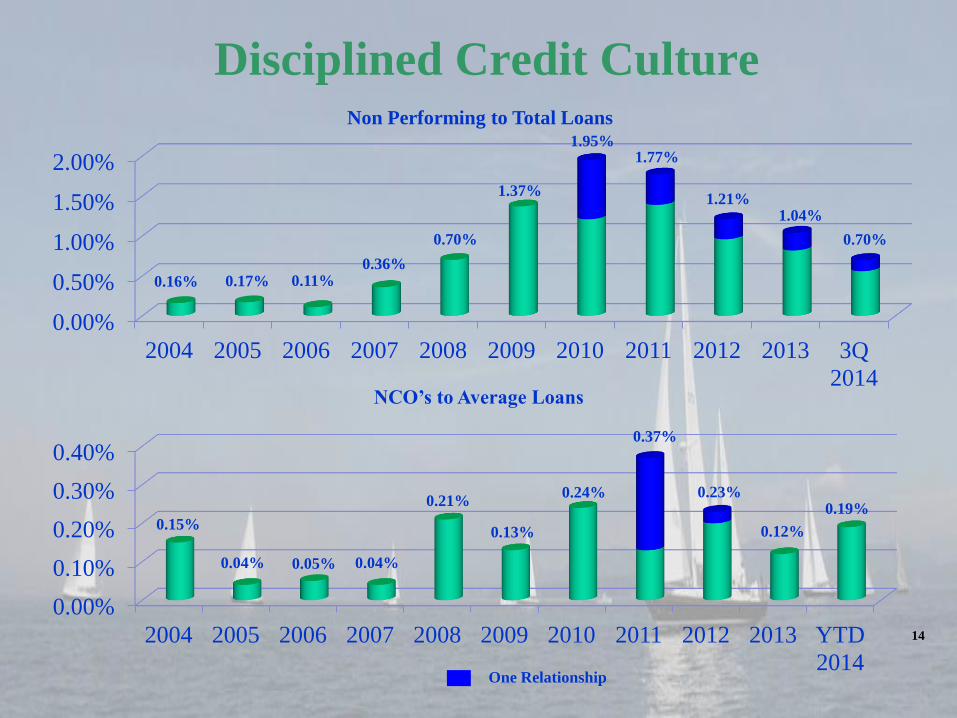
Disciplined Credit Culture
0.00%
0.50%
1.00%
1.50%
2.00%
2004 2005 2006 2007 2008 2009 2010 2011 2012 2013 3Q
2014
0.16% 0.17% 0.11% 0.36%
0.70%
1.37%
1.95% 1.77%
1.21% 1.04%
0.70%
Non Performing to Total Loans
0.00%
0.10%
0.20%
0.30%
0.40%
2004 2005 2006 2007 2008 2009 2010 2011 2012 2013 YTD
2014
0.15%
0.04% 0.05% 0.04%
0.21%
0.13%
0.24%
0.37%
0.23%
0.12%
0.19%
NCO’s to Average Loans
One Relationship
14
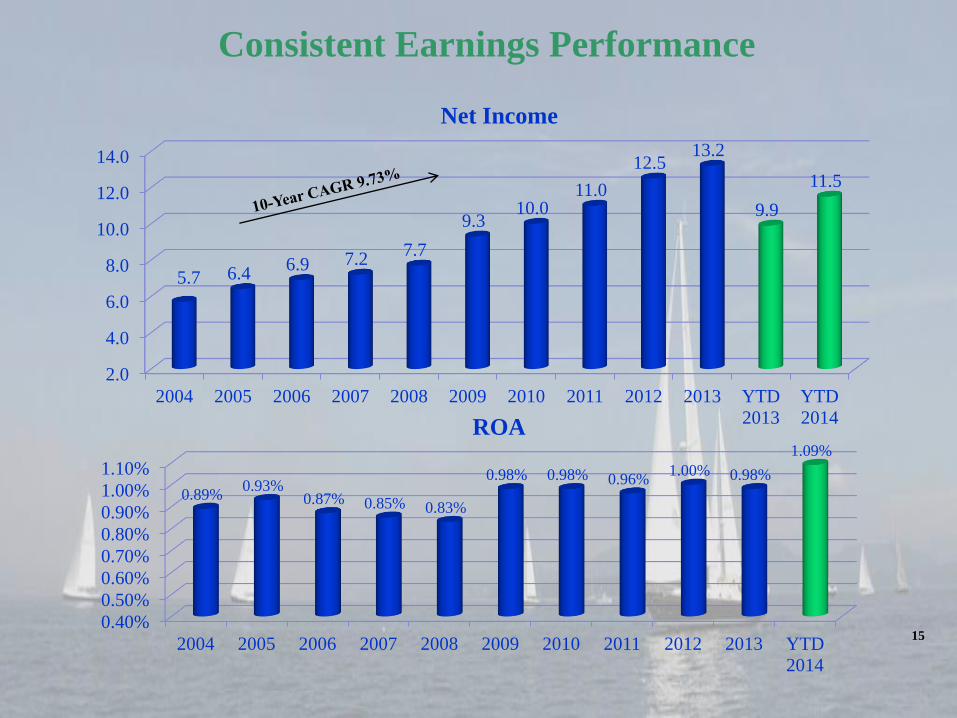
Consistent Earnings Performance
2.0
4.0
6.0
8.0
10.0
12.0
14.0
2004 2005 2006 2007 2008 2009 2010 2011 2012 2013 YTD
2013
YTD
2014
5.7 6.4 6.9 7.2
7.7
9.3 10.0
11.0
12.5 13.2
9.9
11.5
0.40%
0.50%
0.60%
0.70%
0.80%
0.90%
1.00%
1.10%
2004 2005 2006 2007 2008 2009 2010 2011 2012 2013 YTD
2014
0.89% 0.93%
0.87% 0.85% 0.83%
0.98% 0.98% 0.96% 1.00% 0.98%
1.09%
15
ROA
Net Income
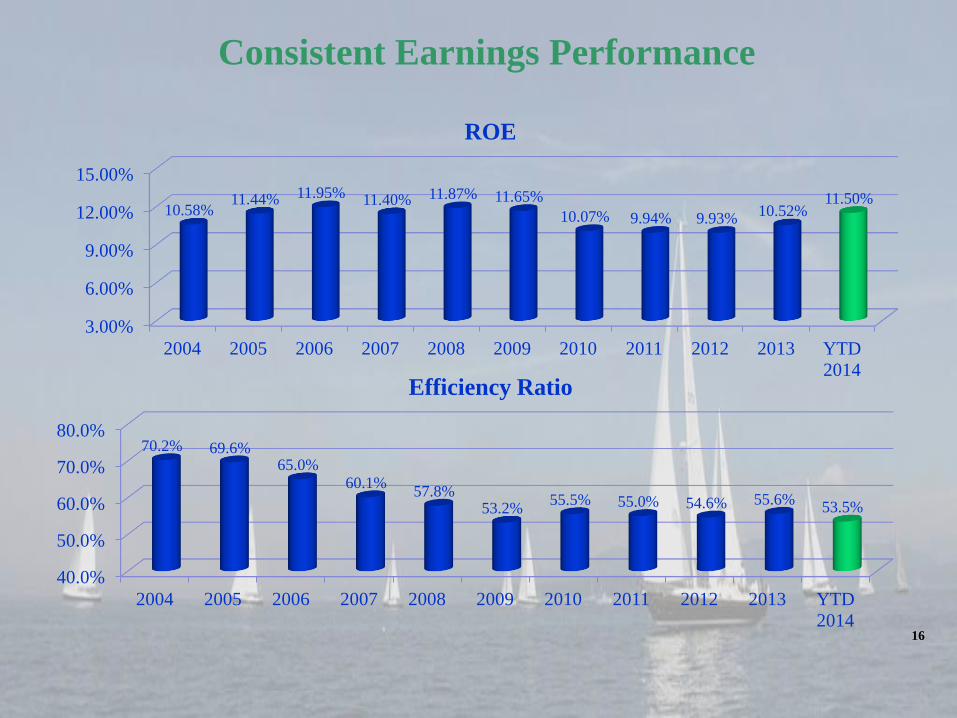
Consistent Earnings Performance
3.00%
6.00%
9.00%
12.00%
15.00%
2004 2005 2006 2007 2008 2009 2010 2011 2012 2013 YTD
2014
10.58% 11.44% 11.95% 11.40% 11.87% 11.65%
10.07% 9.94% 9.93% 10.52%
11.50%
40.0%
50.0%
60.0%
70.0%
80.0%
2004 2005 2006 2007 2008 2009 2010 2011 2012 2013 YTD
2014
70.2% 69.6% 65.0%
60.1% 57.8%
53.2% 55.5% 55.0% 54.6% 55.6%
53.5%
16
Efficiency Ratio
ROE
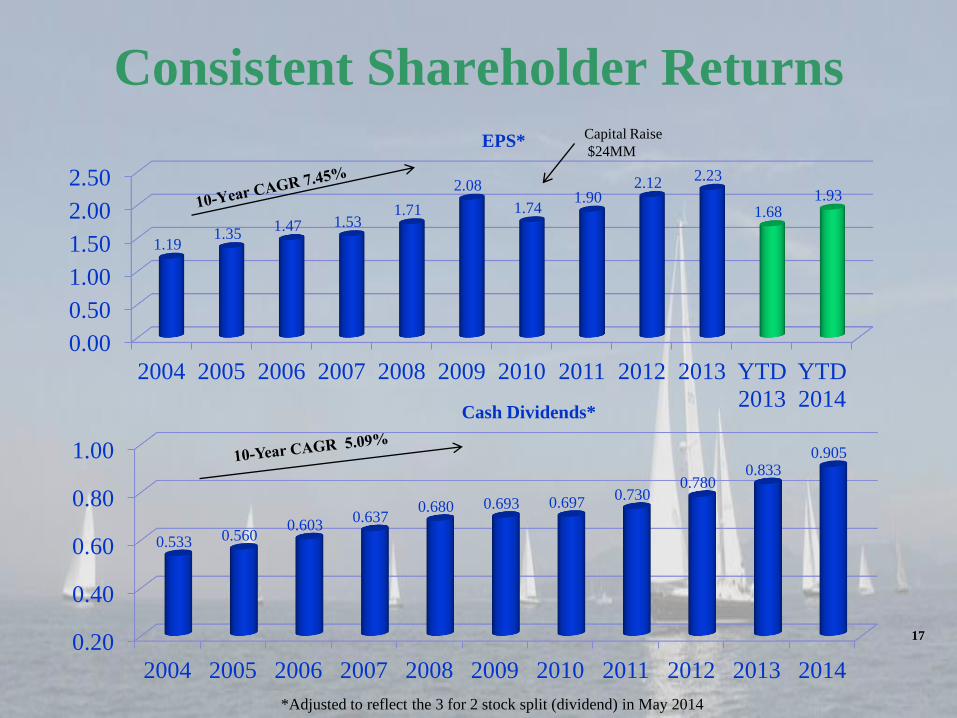
Consistent Shareholder Returns
0.20
0.40
0.60
0.80
1.00
2004 2005 2006 2007 2008 2009 2010 2011 2012 2013 2014
0.533 0.560 0.603
0.637 0.680 0.693 0.697
0.730 0.780
0.833 0.905
Cash Dividends*
0.00
0.50
1.00
1.50
2.00
2.50
2004 2005 2006 2007 2008 2009 2010 2011 2012 2013 YTD
2013
YTD
2014
1.19 1.35
1.47 1.53 1.71
2.08
1.74 1.90
2.12 2.23
1.68 1.93
EPS* Capital Raise
$24MM
*Adjusted to reflect the 3 for 2 stock split (dividend) in May 2014
17
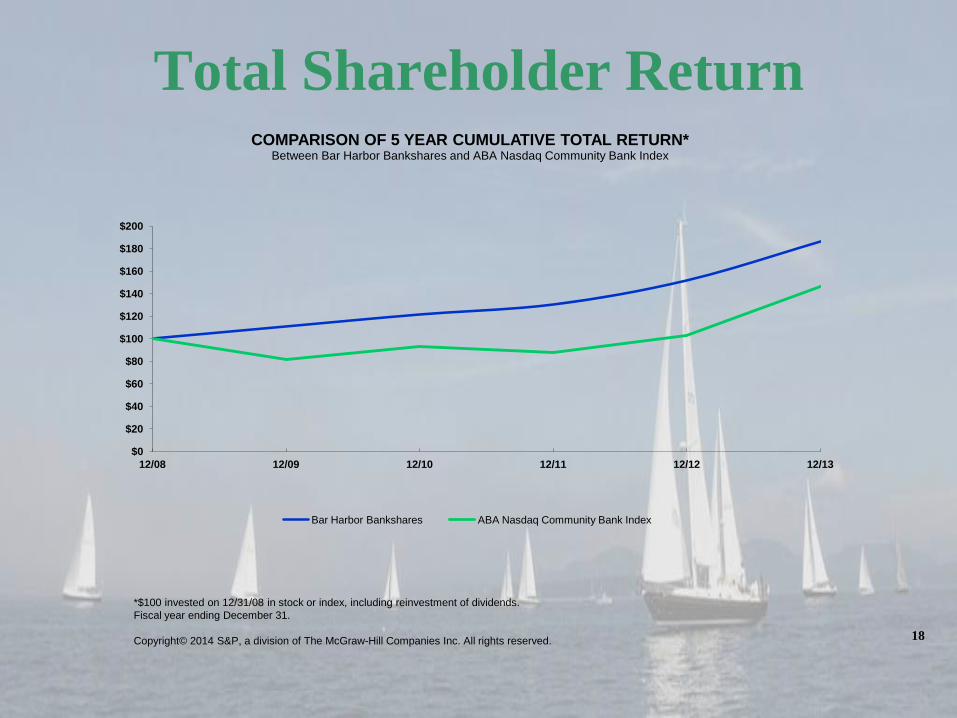
Total Shareholder Return
$0
$20
$40
$60
$80
$100
$120
$140
$160
$180
$200
12/08 12/09 12/10 12/11 12/12 12/13
COMPARISON OF 5 YEAR CUMULATIVE TOTAL RETURN* Between Bar Harbor Bankshares and ABA Nasdaq Community Bank Index
Bar Harbor Bankshares ABA Nasdaq Community Bank Index
*$100 invested on 12/31/08 in stock or index, including reinvestment of dividends.
Fiscal year ending December 31.
Copyright© 2014 S&P, a division of The McGraw-Hill Companies Inc. All rights reserved. 18
Ongoing Strategic Objectives
• Sustaining the balance between growth and earnings without sacrificing soundness
• Improve earnings by measured loan growth and COF management
• Demonstrate a business development mindset to attract, develop, and retain
profitable client relationships, within the confines of our risk appetite
• Enhance the client experience through product development, new technology,
and process improvement
• Adapt structure, policies and procedures for growth
•Loan growth in proven disciplines while utilizing skillsets of catalyst recruits to
provide diversification
•Leverage longstanding Bar Harbor Bank & Trust brand in more recently
entered markets 19