INVESTOR PRESENTATION 2015 ELECTRICAL PRODUCTS ... - Xylem
24
XYLEM INC. INVESTOR PRESENTATION 2015 ELECTRICAL PRODUCTS GROUP CONFERENCE MAY 19, 2015
Transcript of INVESTOR PRESENTATION 2015 ELECTRICAL PRODUCTS ... - Xylem

XYLEM PROPRIETARY / CONFIDENTIAL
XYLEM INC. INVESTOR PRESENTATION 2015 ELECTRICAL PRODUCTS GROUP CONFERENCE MAY 19, 2015

XYLEM PROPRIETARY / CONFIDENTIAL
FORWARD-LOOKING STATEMENTS
2
This presentation contains information that may constitute “forward-looking statements.” Forward-looking statements by their nature address matters that are, to different degrees, uncertain. Generally, the words “anticipate,” “estimate,” “expect,” “project,” “intend,” “plan,” “forecast,” “believe,” “target,” “will,” “could,” “would,” “should” and similar expressions identify forward-looking statements, which generally are not historical in nature. However, the absence of these words or similar expressions does not mean that a statement is not forward-looking. These forward-looking statements include statements about the capitalization of Xylem Inc. (the “Company”), the Company’s restructuring and realignment, future strategic plans and other statements that describe the Company’s business strategy, outlook, objectives, plans, intentions or goals. All statements that address operating or financial performance, events or developments that we expect or anticipate will occur in the future — including statements relating to orders, revenues, operating margins and earnings per share growth, and statements expressing general views about future operating results — are forward-looking statements. Forward-looking statements involve known and unknown risks, uncertainties and other important factors that could cause actual results to differ materially from those expressed or implied in, or reasonably inferred from, such forward-looking statements. Factors that could cause results to differ materially from those anticipated include: economic, political and other risks associated with our international operations, including military actions, economic sanctions or trade embargoes that could affect customer markets, and non-compliance with laws, including foreign corrupt practice laws, export and import laws and competition laws; potential for unexpected cancellations or delays of customer orders in our reported backlog; our exposure to fluctuations in foreign currency exchange rates; competition and pricing pressures in the markets we serve; the strength of housing and related markets; ability to retain and attract key members of management; our relationship with and the performance of our channel partners; our ability to borrow or to refinance our existing indebtedness and availability of liquidity sufficient to meet our needs; changes in the value of goodwill or intangible assets; risks relating to product defects, product liability and recalls; governmental investigations; security breaches or other disruptions of our information technology systems; litigation and contingent liabilities; and other factors set forth in Item 1A of our Annual Report on Form 10-K for the year ended December 31, 2014, and those described from time to time in subsequent reports filed with the Securities and Exchange Commission. All forward-looking statements made herein are based on information currently available to the Company. The Company undertakes no obligation to publicly update or revise any forward-looking statements, whether as a result of new information, future events or otherwise, except as required by law.
XYLEM PROPRIETARY / CONFIDENTIAL 3
• Company Overview
• 2015 Outlook / 1Q Results
• CEO Update
TODAY’S AGENDA

XYLEM PROPRIETARY / CONFIDENTIAL 4
Why invest in Xylem? • Focused Water Play • Leading Market Positions in Highly
Fragmented Industry • Fortress Brands & World Class Distribution • Diverse Geographic & End Market
Exposure • ~40% Recurring Revenue Driven from
Large Installed Base • Strong Financial Position & Cash Flow
Generation
STRONG FOUNDATION & FUNDAMENTALS WITH OPPORTUNITY TO OUTPERFORM
XYLEM OVERVIEW

XYLEM PROPRIETARY / CONFIDENTIAL
Water Infrastructure 62% Applied Water 38%
2014 REVENUE BY SEGMENT
5
OUR BROAD PORTFOLIO ALLOWS US TO ADDRESS A DIVERSE SET OF MARKETS AND PROVIDES FOR A UNIQUE INVESTMENT OPPORTUNITY
2014 REVENUE BY END MARKET
Industrial 44% Public Utility 33% Commercial 13% Residential 7% Agriculture 3%
2014 REVENUE BY REGION
Developed 79% Emerging 21% Large Developed Market Installed Base & Increasing Penetration into Faster Growth Regions
XYLEM’S REVENUE PROFILE
Providing Highly Engineered Water & Waste Water Technologies & Services
Macro Trends Fuel Long-Term Growth within Cyclical Markets

XYLEM PROPRIETARY / CONFIDENTIAL
WATER INFRASTRUCTURE Served Market Size: $20B 2014 Revenues: $2.4B 2014 Op Margin*: 14.3%
Products include: • Water and Waste Water Pumps • Dewatering Pumps and Services • Filtration, Biological and
Disinfection Technologies • Water & Environment Analytics
End Markets served: • Public Utility • Industrial Growth Drivers: • Water Scarcity • Population Growth • Urbanization • Aging Infrastructure • Regulation/Environmental
Protection
APPLIED WATER Served Market Size: $15B 2014 Revenues: $1.5B 2014 Op Margin*: 14.0%
Products include: • HVAC Pumps, Heat Exchangers • Pressure Boosters • Fire Protection • Groundwater & Surface Pumps
End Markets served: • Industrial • Commercial / Residential • Agriculture Growth Drivers: • Water Scarcity • Population Growth • Urbanization • Aging Infrastructure • Regulation/Environmental
Protection
6
62% 38%
Segment Split (3rd Party Revenue)
* See appendix for non-GAAP reconciliations
SEGMENT OVERVIEW

XYLEM PROPRIETARY / CONFIDENTIAL
2013 2014
7
2014 FINANCIAL SUMMARY
SOLID EXECUTION DELIVERED STRONG 2014 PERFORMANCE
2013 2014
(Dollars, In Millions, except EPS)
REVENUE OP MARGIN*
2013 2014
EPS*
2013 2014
FCF*
12.9%
11.8%
Organic* +3% +18%
1.97
1.67
+50% +110 bps
297
198
3,916 3,837
* See appendix for non-GAAP reconciliations

XYLEM PROPRIETARY / CONFIDENTIAL
Q1'14 Q1'15
8
Q1’15 XYLEM PERFORMANCE
Q1'14 Q1'15
906 837
(Dollars In Millions, except EPS)
REVENUE OP MARGIN*
Q1'14 Q1'15
EPS*
Q1'14 Q1'15
(3)
2
FCF*
10.4% 0.33 0.34
+60 bps Ex. FX
Translation
Organic growth in line with guidance
FX Translation -8%
1 less day (YOY) -1%
Improved Working Capital Performance Increased Capex for Growth Investments
$76 Return of Capital via dividends and share
repurchases
FX Translation - $0.04
FX
Continuous Improvement & Business Simplification Focus Drives Op Margin Expansion
+9% Ex. FX
Translation Organic
+1%
FX FX 10.8%
SOLID START, ON TRACK TO DELIVER ON 2015 COMMITMENTS
* See appendix for non-GAAP reconciliations

XYLEM PROPRIETARY / CONFIDENTIAL
2014 2015E
9
2015 OUTLOOK (as of April 30th, 2015)
NO CHANGE IN OPERATIONAL OUTLOOK … GUIDANCE UPDATED ONLY TO REFLECT INCREMENTAL FX HEADWIND
2014 2015E
(Dollars In Millions, except EPS)
REVENUE OP MARGIN*
2014 2015E
EPS*
2014 2015E
FCF CONVERSION*
13.0% to 13.4% 12.9% 1.80 to
1.90
1.97
+50 to +90 bps Ex. FX
Translation
~100% 91%
Organic Growth 1-3%
FX Translation -8%
Committed to Disciplined Capital Deployment
10% Dividend Increase
3,916 3,620 to
3,700
FX
Operations +$0.09 to $0.19
FX Translation - $0.26
FX
Operations +50 to 90 bps
FX Translation - 40 bps
+5% to +10% Ex. FX
Translation Organic
+1% to 3%
FX
Improving Working Capital
* See appendix for non-GAAP reconciliations

XYLEM PROPRIETARY / CONFIDENTIAL 10
CEO UPDATE
Key Focus Areas
• Maintaining Focus on Execution & Accountability
• Driving “One Xylem” Commercial Transformation
• Increasing Emerging Market Growth Investments
• Enhancing Organizational Capabilities
• Strategy & Capital Deployment

XYLEM PROPRIETARY / CONFIDENTIAL 11
OUR STRATEGIC FRAMEWORK
CLEAR STRATEGY TO LEAD AND GUIDE THE COMPANY FORWARD
Accelerate Profitable
Growth
Build a Continuous
Improvement Culture
Build a Culture of Execution & Accountability
Create Superior Leadership &
Talent Development
XYLEM PROPRIETARY / CONFIDENTIAL 12
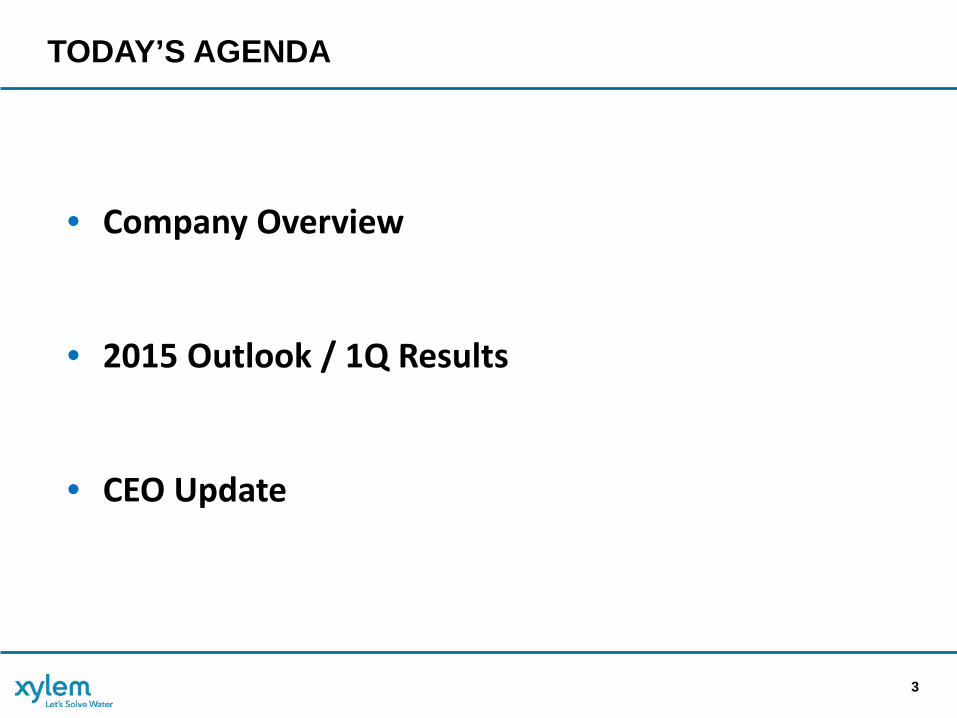
SAVE THE DATE
XYLEM’S 2015 INVESTOR & ANALYST DAY
• Date: September 24, 2015
• Location: New York City, NY
• Additional details to follow
• Planned Agenda: • Vision & Roadmap
• Growth Strategy
• Continuous Improvement
• Capital Deployment
• Long-Term Financial Objectives

XYLEM PROPRIETARY / CONFIDENTIAL 13
THANK YOU FOR YOUR INTEREST

XYLEM PROPRIETARY / CONFIDENTIAL 14
APPENDIX

XYLEM PROPRIETARY / CONFIDENTIAL 15
NON-GAAP MEASURES Management views key performance indicators including revenue, gross margins, segment operating income and margins, orders growth, free cash flow, working capital, and backlog, among others. In addition, we consider certain measures to be useful to management and investors evaluating our operating performance for the periods presented, and provide a tool for evaluating our ongoing operations, liquidity and management of assets. This information can assist investors in assessing our financial performance and measures our ability to generate capital for deployment among competing strategic alternatives and initiatives. These metrics, however, are not measures of financial performance under GAAP and should not be considered a substitute for revenue, operating income, net income, earnings per share (basic and diluted) or net cash from operations as determined in accordance with GAAP. We consider the following non-GAAP measures, which may not be comparable to similarly titled measures reported by other companies, to be key performance indicators: “Organic revenue" and "Organic orders” defined as revenue and orders, respectively, excluding the impact of foreign currency fluctuations and contributions from acquisitions and divestitures. Divestitures include sales of portions of our business that did not meet the criteria for classification as a discontinued operation or insignificant portions of our business that we did not classify as a discontinued operation. The period-over-period change resulting from foreign currency fluctuations assumes no change in exchange rates from the prior period. “Constant currency” defined as financial results adjusted for currency translation impacts by translating current period and prior period activity using the same currency conversion rate. This approach is used for countries whose functional currency is not the U.S. dollar. "Adjusted Operating Income", "Adjusted Segment Operating Income", and “Adjusted EPS” defined as operating income, segment operatng income and earnings per share, adjusted to exclude restructuring and realignment costs, gain on sale of businesses, special charges and tax-related special items, as applicable. “Free Cash Flow” defined as net cash from operating activities, as reported in the Statement of Cash Flow, less capital expenditures as well as adjustments for other significant items that impact current results which management believes are not related to our ongoing operations and performance. Our definition of free cash flows does not consider non-discretionary cash payments, such as debt. “Realignment costs” defined as costs not included in restructuring costs that are incurred as part of actions taken to reposition our business, including items such as professional fees, severance, relocation, travel, facility set-up and other costs. “Special charges" defined as costs incurred by the Company associated with the settlement of legal proceedings with Xylem Group LLC and certain costs incurred for the change in chief executive officer made during the third quarter of 2013, as well as costs incurred in the fourth quarter of 2013 and first quarter of 2015 for the contractual indemnification of federal tax obligations to ITT, costs associated with a legal judgment arising from a historical acquisition matter and legal and professional fees, associated with the Korea matters during the first quarter of 2015.

XYLEM PROPRIETARY / CONFIDENTIAL 16
NON-GAAP MEASURES

XYLEM PROPRIETARY / CONFIDENTIAL 17
NON-GAAP MEASURES
Q1 Q2 Q3 Q4 YTD2014 2013 2014 2013 2014 2013 2014 2013 2014 2013
Total Revenue• Total Xylem 906 879 1,005 960 963 965 1,042 1,033 3,916 3,837 • Water Infrastructure 552 532 616 577 602 602 672 673 2,442 2,384 • Applied Water 354 347 389 383 361 363 370 360 1,474 1,453
Operating Income• Total Xylem 76 66 116 70 130 98 141 129 463 363
• Water Infrastructure 46 39 76 40 95 85 104 99 321 263 • Applied Water 41 43 53 46 51 43 48 43 193 175
• Total Segments 87 82 129 86 146 128 152 142 514 438
Operating Margin• Total Xylem 8.4% 7.5% 11.5% 7.3% 13.5% 10.2% 13.5% 12.5% 11.8% 9.5%
• Water Infrastructure 8.3% 7.3% 12.3% 6.9% 15.8% 14.1% 15.5% 14.7% 13.1% 11.0%• Applied Water 11.6% 12.4% 13.6% 12.0% 14.1% 11.8% 13.0% 11.9% 13.1% 12.0%
• Total Segments 9.6% 9.3% 12.8% 9.0% 15.2% 13.3% 14.6% 13.7% 13.1% 11.4%
Special Charges• Total Xylem - - - - - 20 - 4 - 24
• Water Infrastructure - - - - - - - 4 - 4 • Applied Water - - - - - - - - - -
• Total Segments - - - - - - - 4 - 4
Restructuring & Realignment Costs• Total Xylem 18 12 9 28 4 12 12 12 43 64
• Water Infrastructure 12 10 5 22 3 8 9 8 29 48 • Applied Water 6 2 4 6 1 4 2 4 13 16
• Total Segments 18 12 9 28 4 12 11 12 42 64
Adjusted Operating Income*• Total Xylem 94 78 125 98 134 130 153 145 506 451
• Water Infrastructure 58 49 81 62 98 93 113 111 350 315 • Applied Water 47 45 57 52 52 47 50 47 206 191
• Total Segments 105 94 138 114 150 140 163 158 556 506
Adjusted Operating Margin*• Total Xylem 10.4% 8.9% 12.4% 10.2% 13.9% 13.5% 14.7% 14.0% 12.9% 11.8%
• Water Infrastructure 10.5% 9.2% 13.1% 10.7% 16.3% 15.4% 16.8% 16.5% 14.3% 13.2%• Applied Water 13.3% 13.0% 14.7% 13.6% 14.4% 12.9% 13.5% 13.1% 14.0% 13.1%
• Total Segments 11.6% 10.7% 13.7% 11.9% 15.6% 14.5% 15.6% 15.3% 14.2% 13.2%
Xylem Inc. Non-GAAP ReconciliationAdjusted Operating Income
($ Millions)
*Adjusted Operating Income excludes restructuring & realignment costs and special charges.

XYLEM PROPRIETARY / CONFIDENTIAL 18
NON-GAAP MEASURES

XYLEM PROPRIETARY / CONFIDENTIAL 19
NON-GAAP MEASURES
2014 2013
Net Cash - Operating Activities 416$ 324$
Capital Expenditures (119) (126)
Free Cash Flow 297$ 198$
Net Income 337 228
Gain on Sale of Business 11 -
Net Income, excluding gain on sale of business 326$ 228$
Free Cash Flow Conversion 91% 87%
Xylem Inc. Non-GAAP ReconciliationNet Cash - Operating Activities vs. Free Cash Flow
($ Millions)
Year Ended

XYLEM PROPRIETARY / CONFIDENTIAL 20
NON-GAAP MEASURES
Constant Currency(A) (B) (C) (D) (E) = B+C+D (F) = E/A (G) = (E - C) / A
Change % Change Change % ChangeRevenue Revenue 2015 v. 2014 2015 v. 2014 FX Contribution Adj. 2015 v. 2014 Adj. 2015 v. 2014
2015 2014Quarter Ended March 31
Xylem Inc. 837 906 (69) -8% 5 73 9 1% 0%
Water infrastructure 500 552 (52) -9% - 54 2 0% 0%Applied Water 337 354 (17) -5% 5 19 7 2% 1%
Acquisitions / Divestitures
Xylem Inc. Non-GAAP ReconciliationReported vs. Organic & Constant Currency Revenue
($ Millions)
(As Reported - GAAP) (As Adjusted - Organic)

XYLEM PROPRIETARY / CONFIDENTIAL 21
NON-GAAP MEASURES
Q12015 2014
Total Revenue• Total Xylem 837 906 • Water Infrastructure 500 552 • Applied Water 337 354
Operating Income• Total Xylem 83 76
• Water Infrastructure 47 46 • Applied Water 46 41
• Total Segments 93 87
Operating Margin• Total Xylem 9.9% 8.4%
• Water Infrastructure 9.4% 8.3%• Applied Water 13.6% 11.6%
• Total Segments 11.1% 9.6%
Special Charges• Total Xylem 1 -
• Water Infrastructure 1 - • Applied Water - -
• Total Segments 1 -
Restructuring & Realignment Costs• Total Xylem 6 18
• Water Infrastructure 5 12 • Applied Water 1 6
• Total Segments 6 18
Adjusted Operating Income*• Total Xylem 90 94
• Water Infrastructure 53 58 • Applied Water 47 47
• Total Segments 100 105
Adjusted Operating Margin*• Total Xylem 10.8% 10.4%
• Water Infrastructure 10.6% 10.5%• Applied Water 13.9% 13.3%
• Total Segments 11.9% 11.6%
Xylem Inc. Non-GAAP ReconciliationAdjusted Operating Income
($ Millions)
*Adjusted Operating Income excludes restructuring & realignment costs and special charges.

XYLEM PROPRIETARY / CONFIDENTIAL 22
NON-GAAP MEASURES
Q1 2014 Q1 2015As Reported Adjustments Adjusted As Reported Adjustments Adjusted
Total Revenue 906 906 837 837 Operating Income 76 18 a 94 83 7 a 90 Operating Margin 8.4% 8.4% 9.9% 10.8%Interest Expense (14) (14) (14) (14) Other Non-Operating Income (Expense) (1) (1) (1) 1 b - Gain from sale of businesses - - 9 (9) 0 Income before Taxes 61 18 79 77 (1) 76 Provision for Income Taxes (12) (4) c (16) (13) (3) c (16) Net Income 49 14 63 64 (4) 60 Diluted Shares 185.8 185.8 183.1 183.1 Diluted EPS 0.27$ 0.07$ 0.34$ 0.35$ (0.02)$ 0.33$
a Restructuring & realignment costs in 2014 and 2015 and special charges in 2015b Special chargesc Net tax impact of restructuring & realignment costs, special charges and special tax items
Xylem Inc. Non-GAAP ReconciliationAdjusted Diluted EPS
($ Millions, except per share amounts)

XYLEM PROPRIETARY / CONFIDENTIAL 23
NON-GAAP MEASURES
2015 2014
Net Cash - Operating Activities 39$ 22$
Capital Expenditures (37) (25)
Free Cash Flow 2$ (3)$
Net Income 64 49
Gain from sale of businesses 9 -
Net Income, excluding gain on sale of business 55$ 49$
Free Cash Flow Conversion 4% -6%
Xylem Inc. Non-GAAP ReconciliationNet Cash - Operating Activities vs. Free Cash Flow
($ Millions)
Three Months Ended

XYLEM PROPRIETARY / CONFIDENTIAL
NYSE: XYL
Phil De Sousa, VP, Investor Relations (914) 323-5930
Matt Latino, Manager, Investor Relations (914) 323-5821
Dawn Powell, Investor Relations Coordinator (914) 323-5931
http://investors.xyleminc.com