Investor Presentation 2011 English - Basler Kantonalbank · PDF fileInvestor Presentation 2011...
42
Investor Presentation 2011 Basler Kantonalbank Our aim is the sustainable and permanent communication with investors and analysts.
Transcript of Investor Presentation 2011 English - Basler Kantonalbank · PDF fileInvestor Presentation 2011...
Investor Presentation 2011Basler Kantonalbank
Our aim is the sustainable and permanent communication with investors and analysts.
Page 2 | © Basler Kantonalbank
Agenda
1. Financial figures
• Parent Company Basler Kantonalbank
• BKB Group
2. Focal Points
3. Positioning in the BKB Group
4. Objectives 2015
5. BKB Participation Certificate
Page 3 | © Basler Kantonalbank
Agenda
1. Financial figures
• Parent Company Basler Kantonalbank
• BKB Group
2. Focal Points
3. Positioning in the BKB Group
4. Objectives 2015
5. BKB Participation Certificate
Page 4 | © Basler Kantonalbank
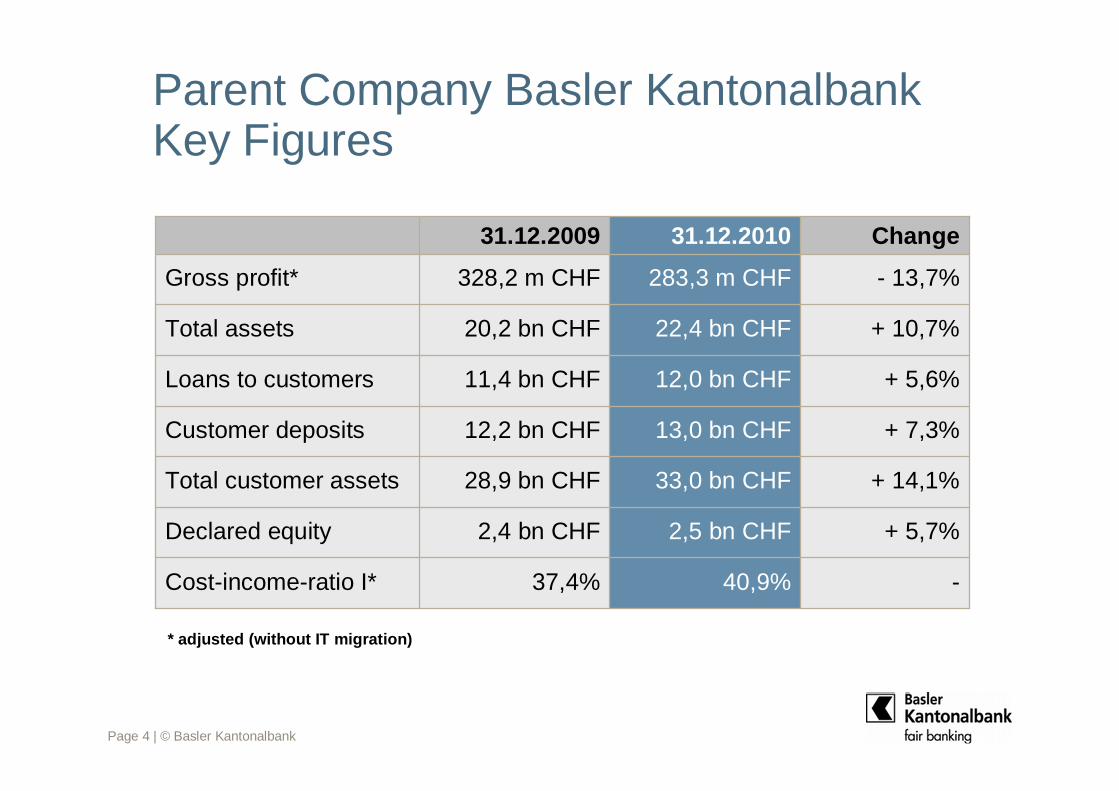
Parent Company Basler Kantonalbank Key Figures
* adjusted (without IT migration)
+ 5,7%2,5 bn CHF2,4 bn CHFDeclared equity
- 13,7%283,3 m CHF328,2 m CHFGross profit*
40,9%
33,0 bn CHF
13,0 bn CHF
12,0 bn CHF
22,4 bn CHF
31.12.2010
+ 7,3%12,2 bn CHFCustomer deposits
+ 14,1%28,9 bn CHFTotal customer assets
-37,4%Cost-income-ratio I*
+ 10,7%20,2 bn CHFTotal assets
+ 5,6%11,4 bn CHFLoans to customers
Change31.12.2009
Page 5 | © Basler Kantonalbank
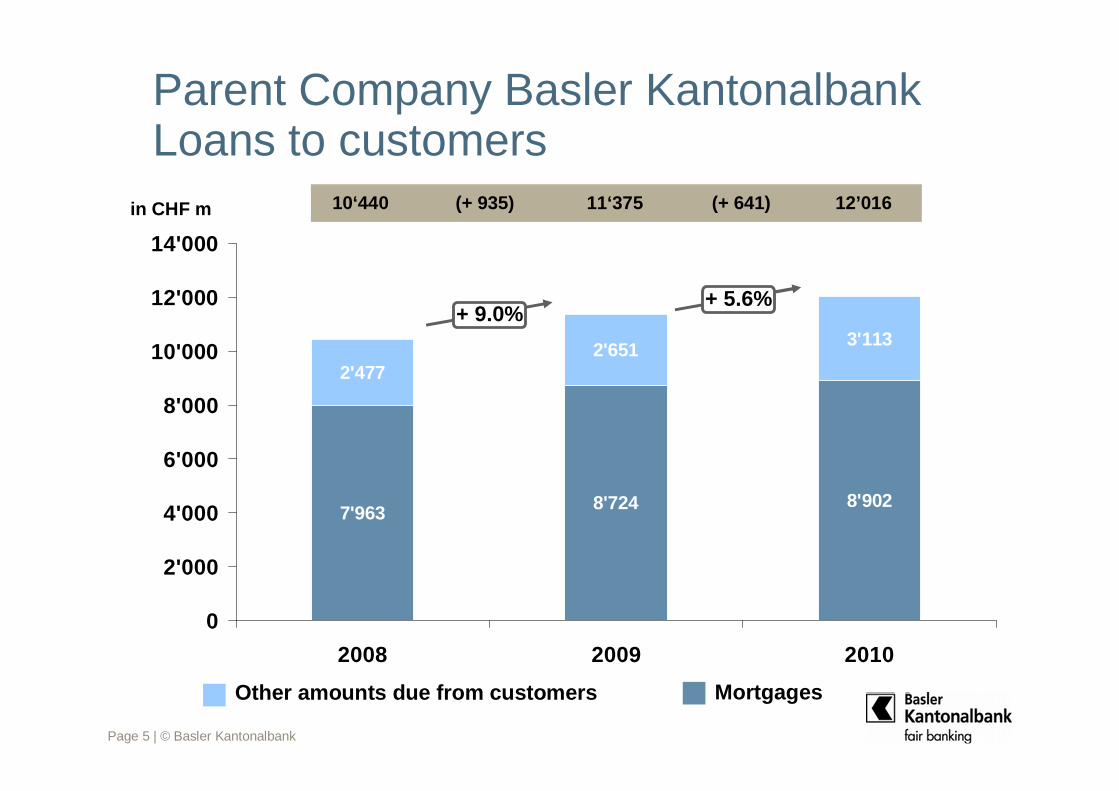
Parent Company Basler Kantonalbank Loans to customers
MortgagesOther amounts due from customers
7'963 8'724 8'902
2'4772'651 3'113
0
2'000
4'000
6'000
8'000
10'000
12'000
14'000
2008 2009 2010
11‘37510‘440 12’016 (+ 935) (+ 641)
+ 9.0%+ 5.6%
in CHF m
Page 6 | © Basler Kantonalbank
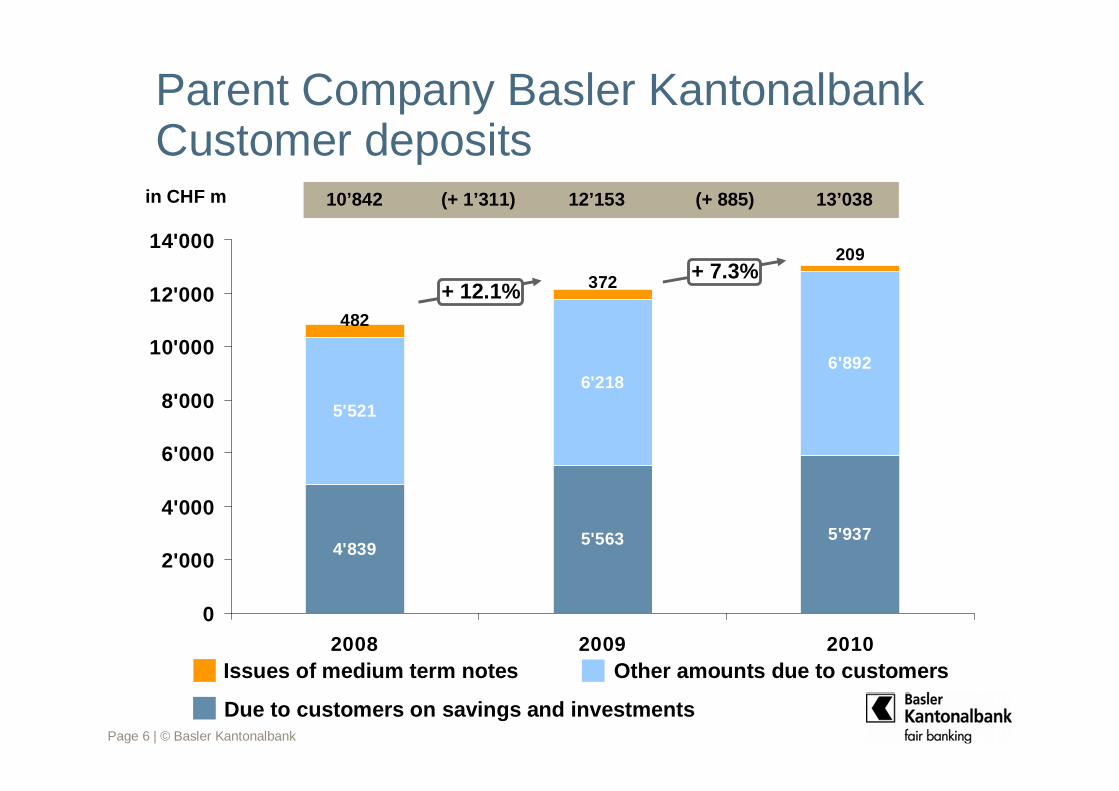
Parent Company Basler Kantonalbank Customer deposits
Due to customers on savings and investments
Other amounts due to customersIssues of medium term notes
4'8395'563 5'937
5'521
6'2186'892
482
372
209
0
2'000
4'000
6'000
8'000
10'000
12'000
14'000
2008 2009 2010
+ 12.1%+ 7.3%
12’153 10’842 13’038 (+ 1’311) (+ 885)in CHF m
Page 7 | © Basler Kantonalbank
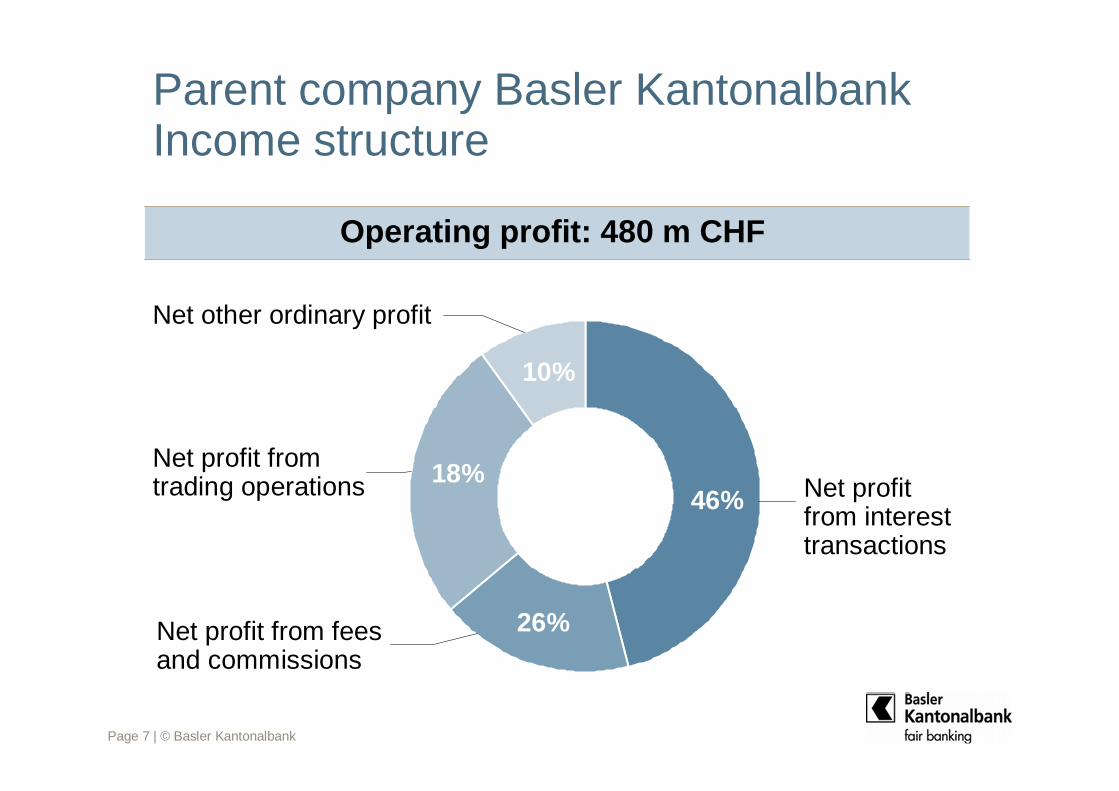
Parent company Basler KantonalbankIncome structure
Net profit from trading operations
Net profit from fees and commissions
Net profit from interest transactions
Operating profit: 480 m CHF
Net other ordinary profit
46%
26%
18%
10%
Page 8 | © Basler Kantonalbank
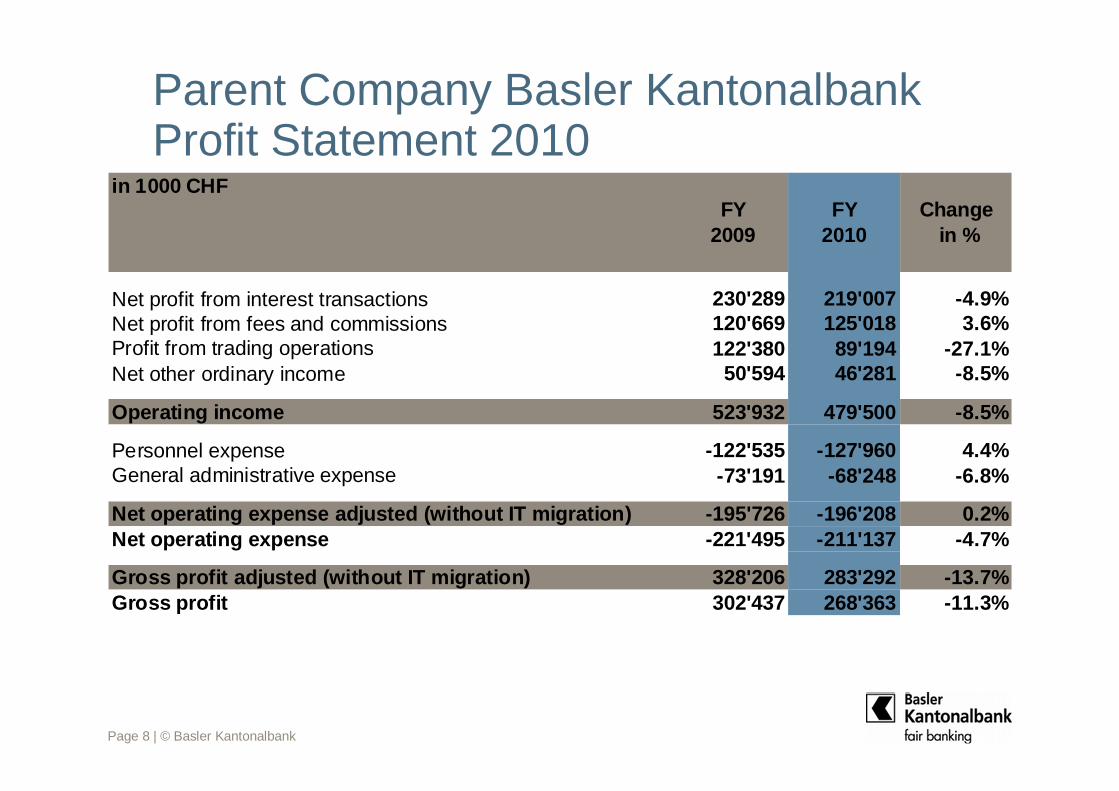
Parent Company Basler KantonalbankProfit Statement 2010
in 1000 CHF
Net profit from interest transactions 230'289 219'007 -4.9%Net profit from fees and commissions 120'669 125'018 3.6%Profit from trading operations 122'380 89'194 -27.1%Net other ordinary income 50'594 46'281 -8.5%
Operating income 523'932 479'500 -8.5%
Personnel expense -122'535 -127'960 4.4%General administrative expense -73'191 -68'248 -6.8%
Net operating expense adjusted (without IT migration) -195'726 -196'208 0.2%Net operating expense -221'495 -211'137 -4.7%
Gross profit adjusted (without IT migration) 328'206 283'292 -13.7%Gross profit 302'437 268'363 -11.3%
FY2009
FY2010
Change in %
Page 9 | © Basler Kantonalbank
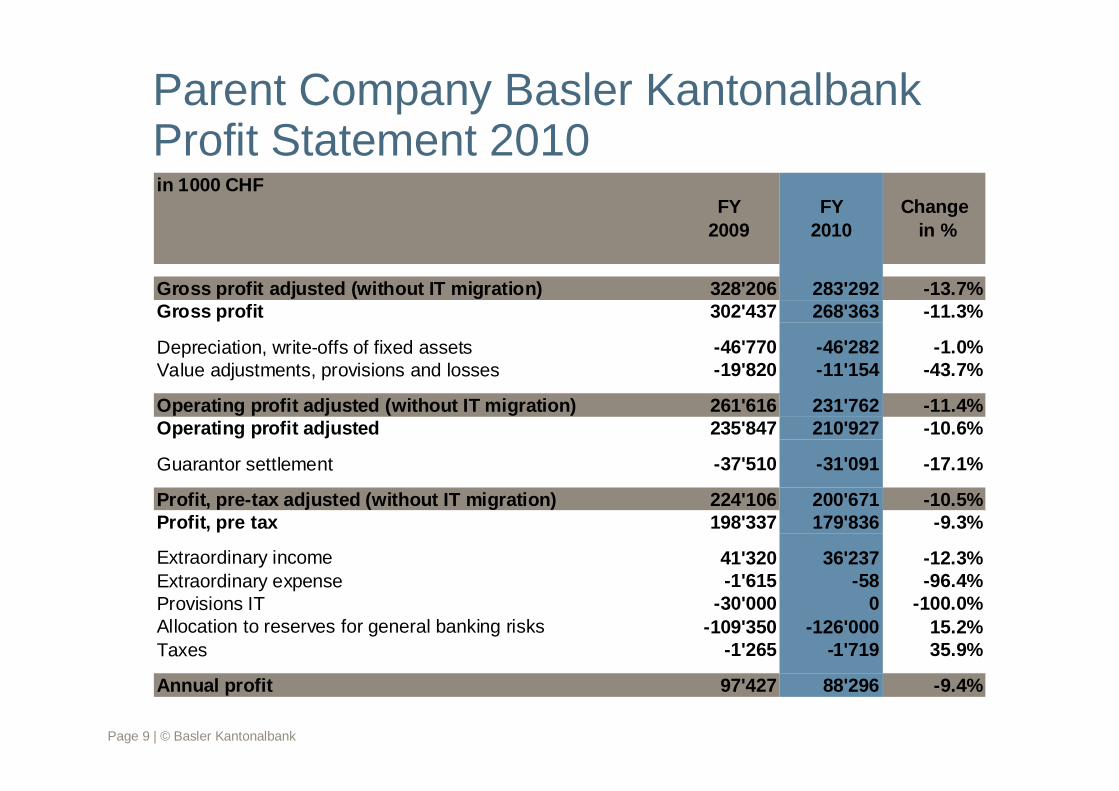
Parent Company Basler KantonalbankProfit Statement 2010in 1000 CHF
Gross profit adjusted (without IT migration) 328'206 283'292 -13.7%Gross profit 302'437 268'363 -11.3%
Depreciation, write-offs of fixed assets -46'770 -46'282 -1.0%Value adjustments, provisions and losses -19'820 -11'154 -43.7%
Operating profit adjusted (without IT migration) 261'616 231'762 -11.4%Operating profit adjusted 235'847 210'927 -10.6%
Guarantor settlement -37'510 -31'091 -17.1%
Profit, pre-tax adjusted (without IT migration) 224'106 200'671 -10.5%Profit, pre tax 198'337 179'836 -9.3%
Extraordinary income 41'320 36'237 -12.3%Extraordinary expense -1'615 -58 -96.4%Provisions IT -30'000 0 -100.0%Allocation to reserves for general banking risks -109'350 -126'000 15.2%Taxes -1'265 -1'719 35.9%
Annual profit 97'427 88'296 -9.4%
FY2009
FY2010
Change in %
Page 10 | © Basler Kantonalbank
Agenda
1. Financial figures
• Parent Company Basler Kantonalbank
• BKB Group
2. Focal Points
3. Positioning in the BKB Group
4. Objectives 2015
5. BKB Participation Certificate
Page 11 | © Basler Kantonalbank
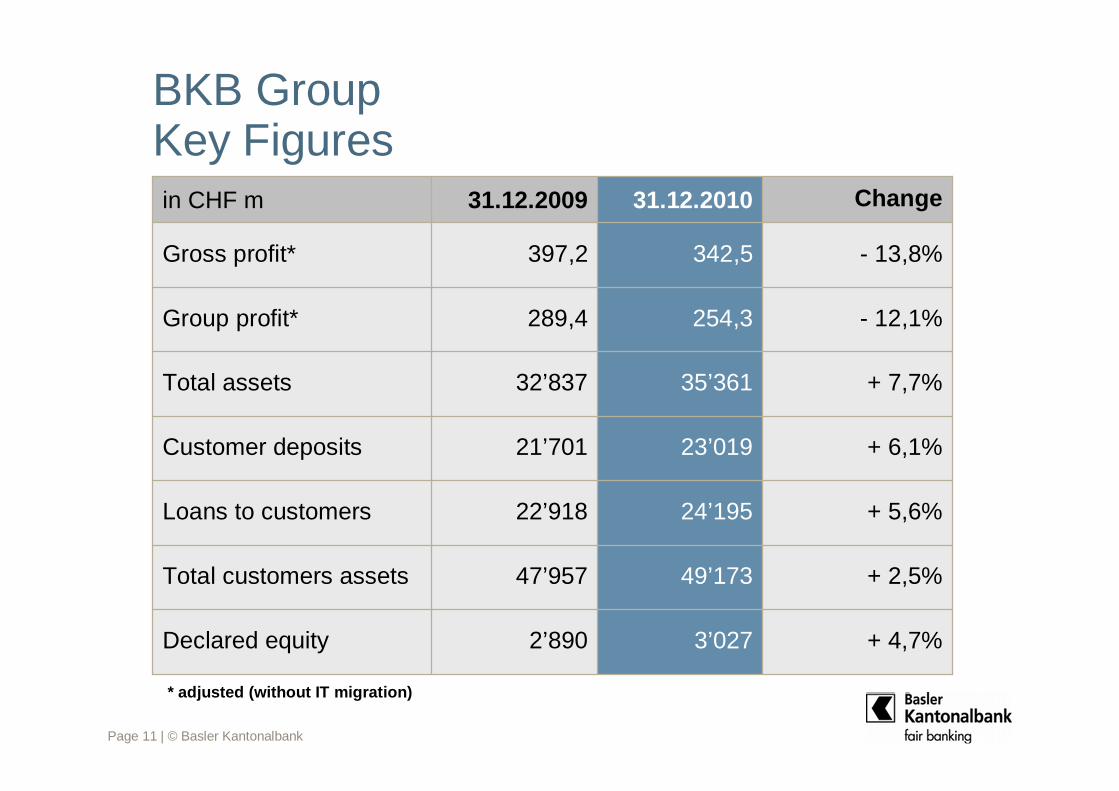
BKB Group Key Figures
+ 2,5%49’17347’957Total customers assets
+ 6,1%23’01921’701Customer deposits
+ 4,7%3’0272’890Declared equity
+ 5,6%24’19522’918Loans to customers
35’361
254,3
342,5
31.12.2010
+ 7,7%32’837Total assets
- 13,8%397,2 Gross profit*
- 12,1%289,4Group profit*
Change31.12.2009in CHF m
* adjusted (without IT migration)
Page 12 | © Basler Kantonalbank
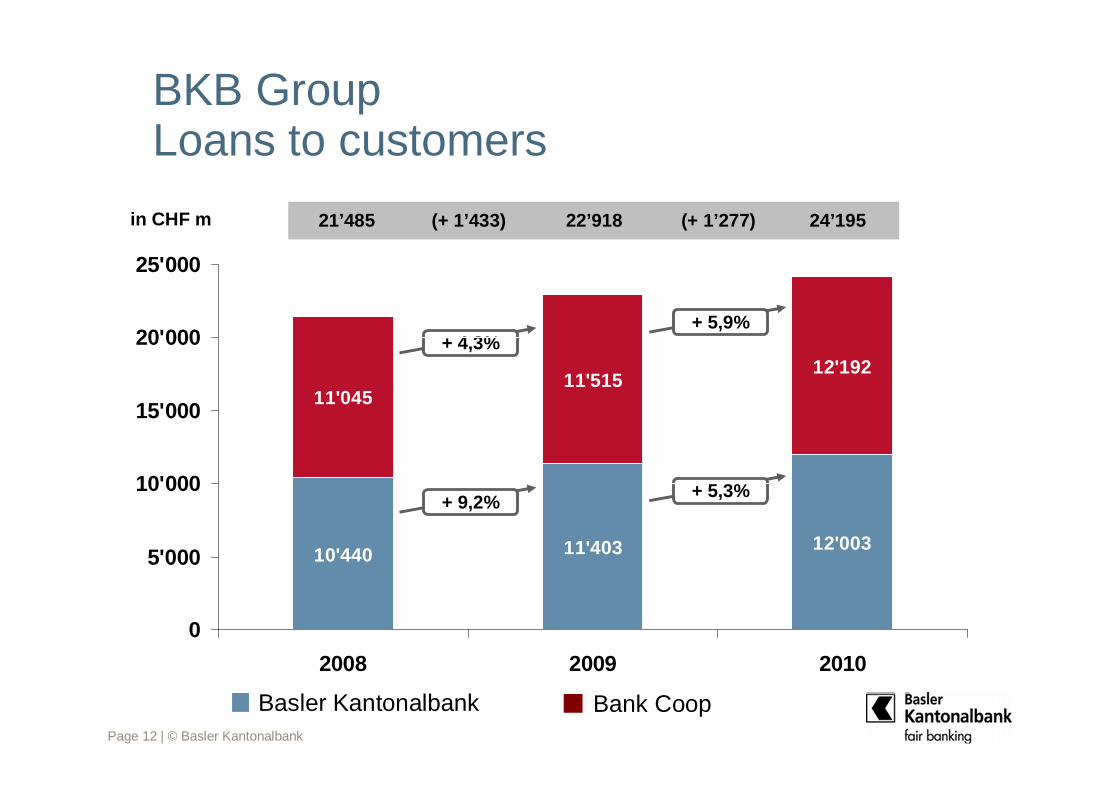
BKB GroupLoans to customers
Bank CoopBasler Kantonalbank
22’918 21’485 24’195 (+ 1’433) (+ 1’277)
+ 5,9%+ 4,3%
+ 9,2%+ 5,3%
in CHF m
10'440 11'403 12'003
11'04511'515
12'192
0
5'000
10'000
15'000
20'000
25'000
2008 2009 2010
Page 13 | © Basler Kantonalbank
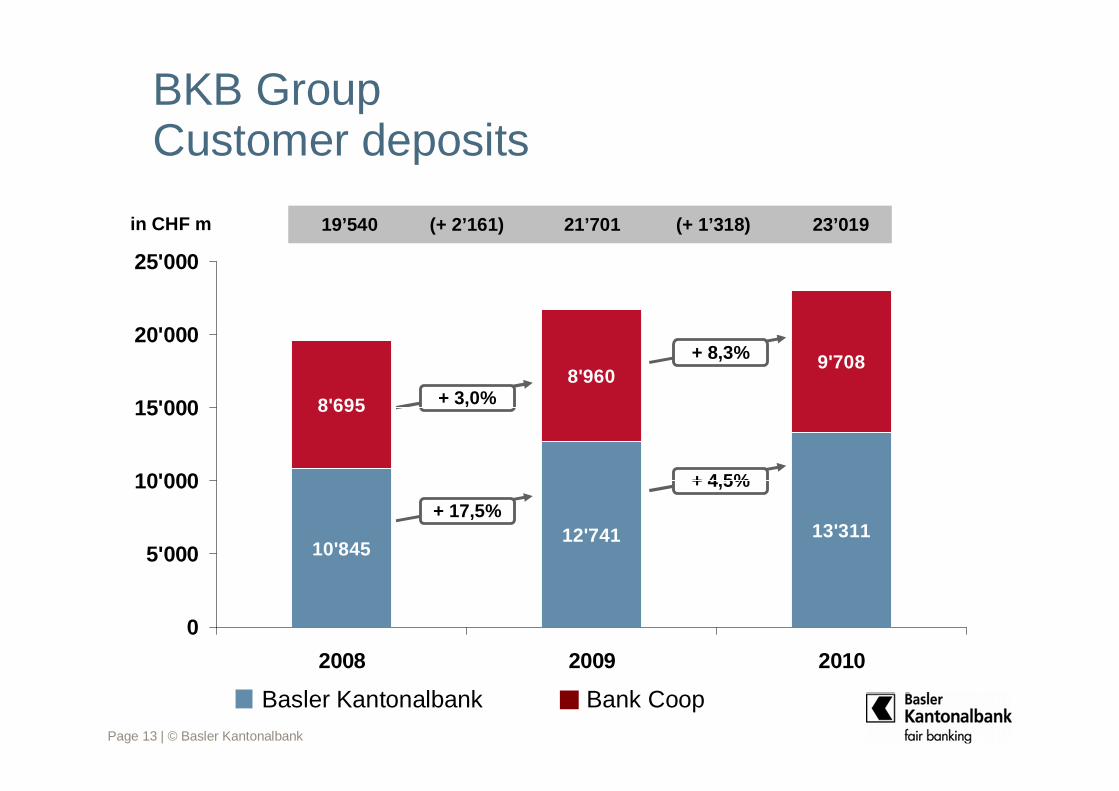
BKB GroupCustomer deposits
Basler Kantonalbank Bank Coop
+ 8,3%
+ 4,5%
21’701 19’540 23’019 (+ 2’161) (+ 1’318)
+ 17,5%
+ 3,0%
in CHF m
10'84512'741 13'311
8'695
8'9609'708
0
5'000
10'000
15'000
20'000
25'000
2008 2009 2010
Page 14 | © Basler Kantonalbank
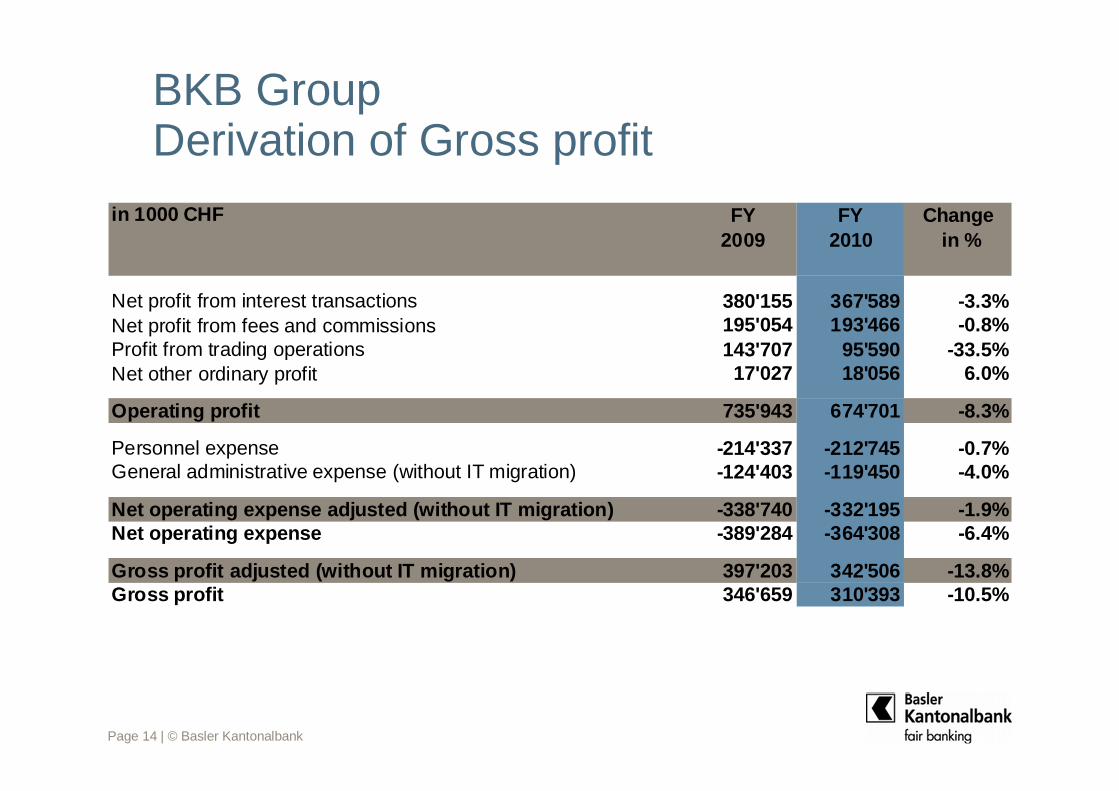
BKB GroupDerivation of Gross profit
in 1000 CHF
Net profit from interest transactions 380'155 367'589 -3.3%Net profit from fees and commissions 195'054 193'466 -0.8%Profit from trading operations 143'707 95'590 -33.5%Net other ordinary profit 17'027 18'056 6.0%
Operating profit 735'943 674'701 -8.3%
Personnel expense -214'337 -212'745 -0.7%General administrative expense (without IT migration) -124'403 -119'450 -4.0%
Net operating expense adjusted (without IT migration) -338'740 -332'195 -1.9%Net operating expense -389'284 -364'308 -6.4%
Gross profit adjusted (without IT migration) 397'203 342'506 -13.8%Gross profit 346'659 310'393 -10.5%
FY2009
FY2010
Change in %
Page 15 | © Basler Kantonalbank
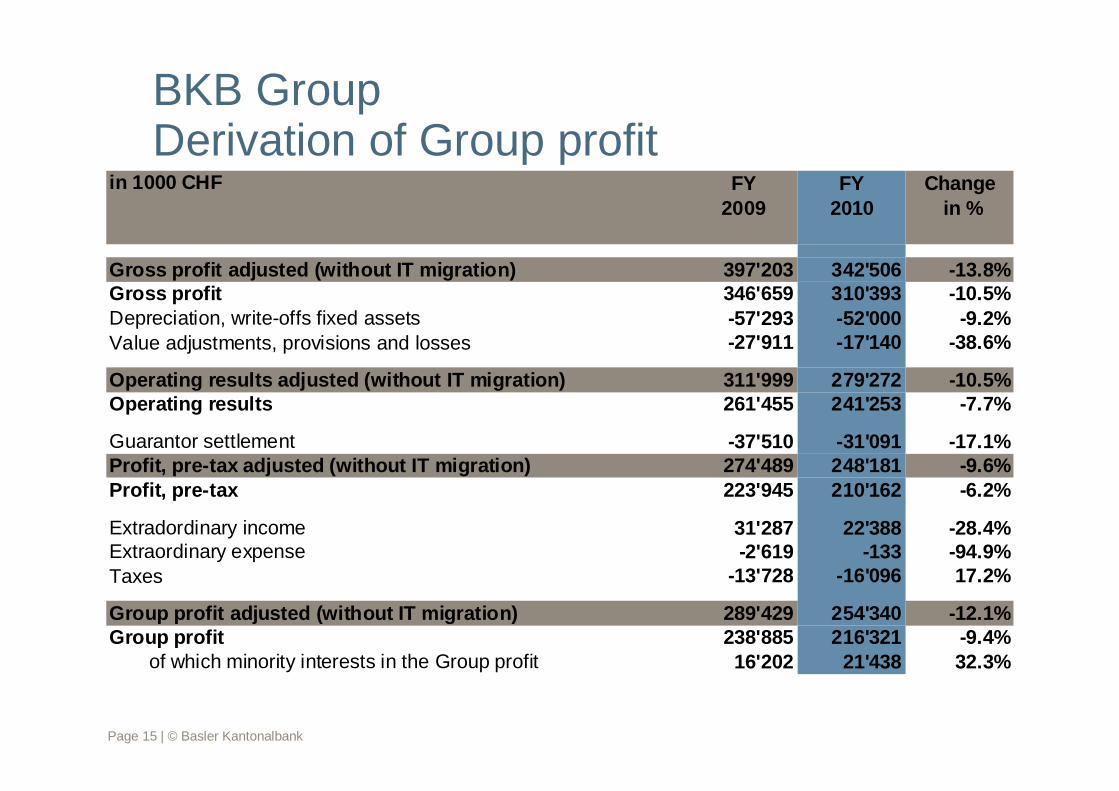
BKB GroupDerivation of Group profit
in 1000 CHF
Gross profit adjusted (without IT migration) 397'203 342'506 -13.8%Gross profit 346'659 310'393 -10.5%Depreciation, write-offs fixed assets -57'293 -52'000 -9.2%Value adjustments, provisions and losses -27'911 -17'140 -38.6%
Operating results adjusted (without IT migration) 311'999 279'272 -10.5%Operating results 261'455 241'253 -7.7%
Guarantor settlement -37'510 -31'091 -17.1%Profit, pre-tax adjusted (without IT migration) 274'489 248'181 -9.6%Profit, pre-tax 223'945 210'162 -6.2%
Extradordinary income 31'287 22'388 -28.4%Extraordinary expense -2'619 -133 -94.9%Taxes -13'728 -16'096 17.2%
Group profit adjusted (without IT migration) 289'429 254'340 -12.1%Group profit 238'885 216'321 -9.4%
of which minority interests in the Group profit 16'202 21'438 32.3%
FY2009
FY2010
Change in %
Page 16 | © Basler Kantonalbank
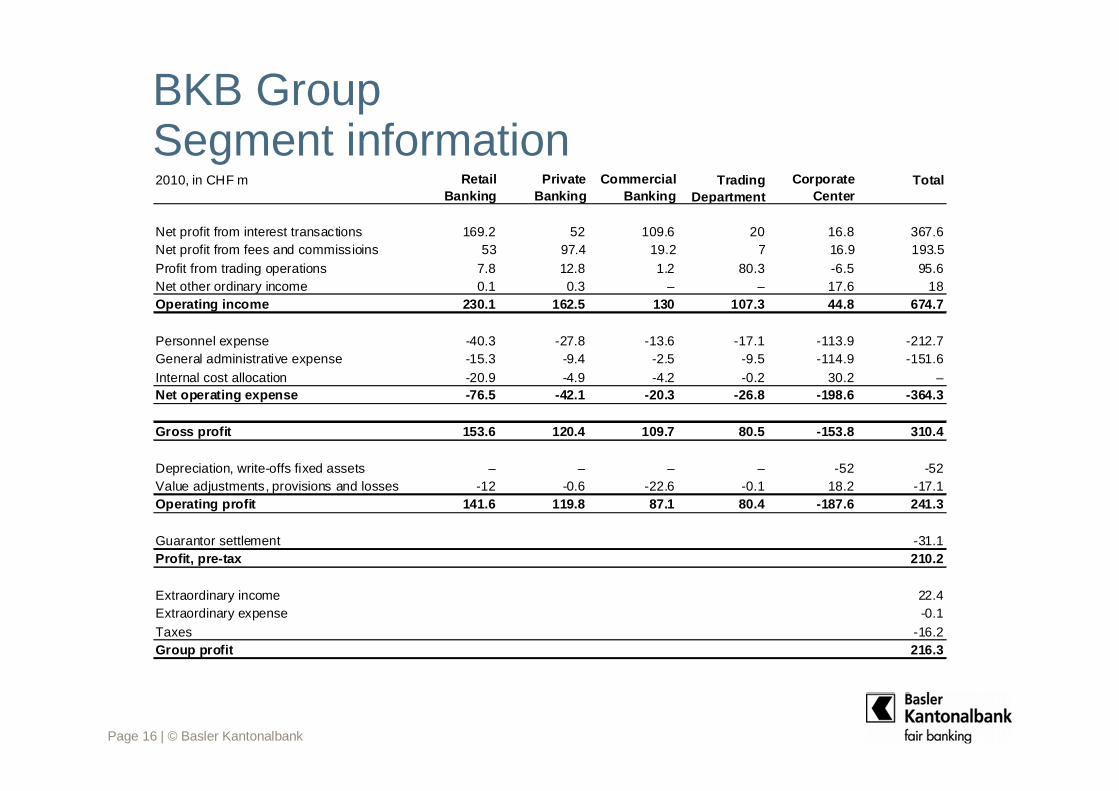
BKB GroupSegment information 2010, in CHF m Retail
BankingPrivate
BankingCommercial
BankingTrading
DepartmentCorporate
CenterTotal
Net profit from interest transactions 169.2 52 109.6 20 16.8 367.6Net profit from fees and commissioins 53 97.4 19.2 7 16.9 193.5Profit from trading operations 7.8 12.8 1.2 80.3 -6.5 95.6Net other ordinary income 0.1 0.3 – – 17.6 18Operating income 230.1 162.5 130 107.3 44.8 674.7
Personnel expense -40.3 -27.8 -13.6 -17.1 -113.9 -212.7General administrative expense -15.3 -9.4 -2.5 -9.5 -114.9 -151.6Internal cost allocation -20.9 -4.9 -4.2 -0.2 30.2 –Net operating expense -76.5 -42.1 -20.3 -26.8 -198.6 -364.3
Gross profit 153.6 120.4 109.7 80.5 -153.8 310.4
Depreciation, write-offs fixed assets – – – – -52 -52Value adjustments, provisions and losses -12 -0.6 -22.6 -0.1 18.2 -17.1Operating profit 141.6 119.8 87.1 80.4 -187.6 241.3
Guarantor settlement -31.1Profit, pre-tax 210.2
Extraordinary income 22.4Extraordinary expense -0.1Taxes -16.2Group profit 216.3
Page 17 | © Basler Kantonalbank
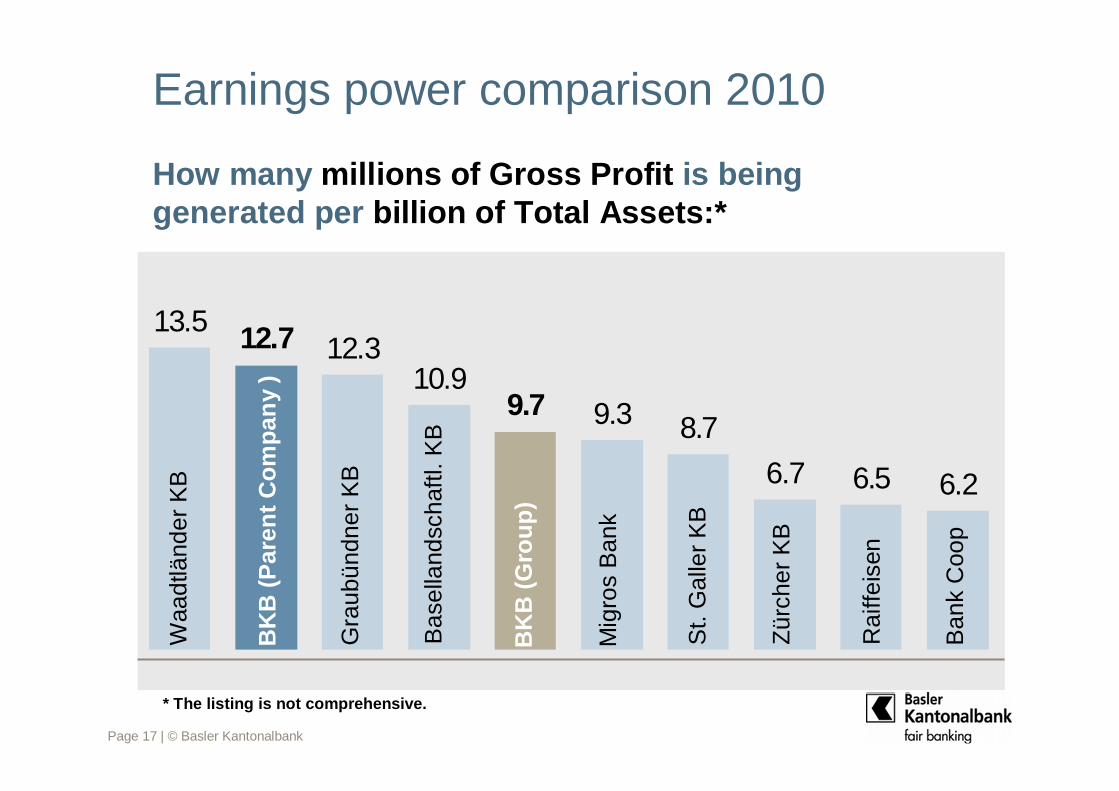
Earnings power comparison 2010
How many millions of Gross Profit is beinggenerated per billion of Total Assets:*
* The listing is not comprehensive.
9.3 8.7
6.7 6.5
9.7
12.7
6.2
12.310.9
13.5
Waa
dtlä
nder
KB
St.
Gal
ler
KB
Gra
ubün
dner
KB
BK
B (
Gro
up
)
Mig
ros
Ban
k
Bas
ella
ndsc
haftl
. KB
BK
B (
Par
ent
Co
mp
any
)
Zür
cher
KB
Rai
ffeis
en
Ban
k C
oop
Page 18 | © Basler Kantonalbank
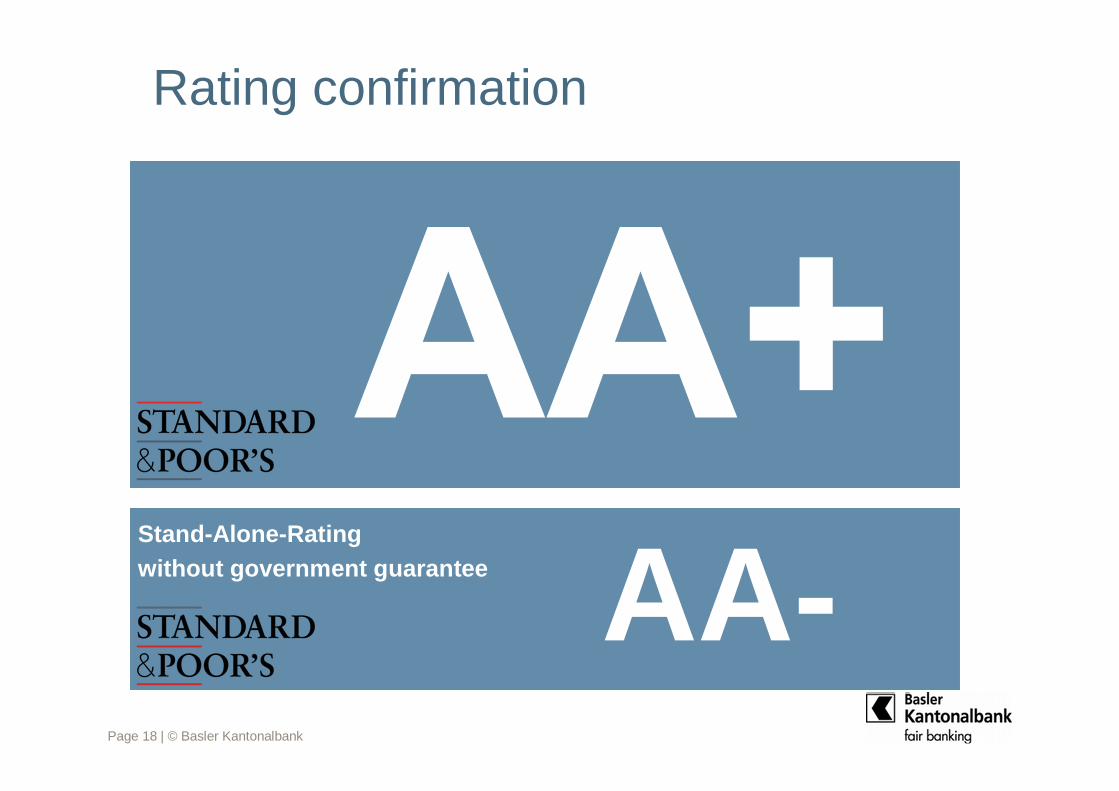
Rating confirmation
Stand-Alone-Ratingwithout government guarantee AA-
Page 19 | © Basler Kantonalbank
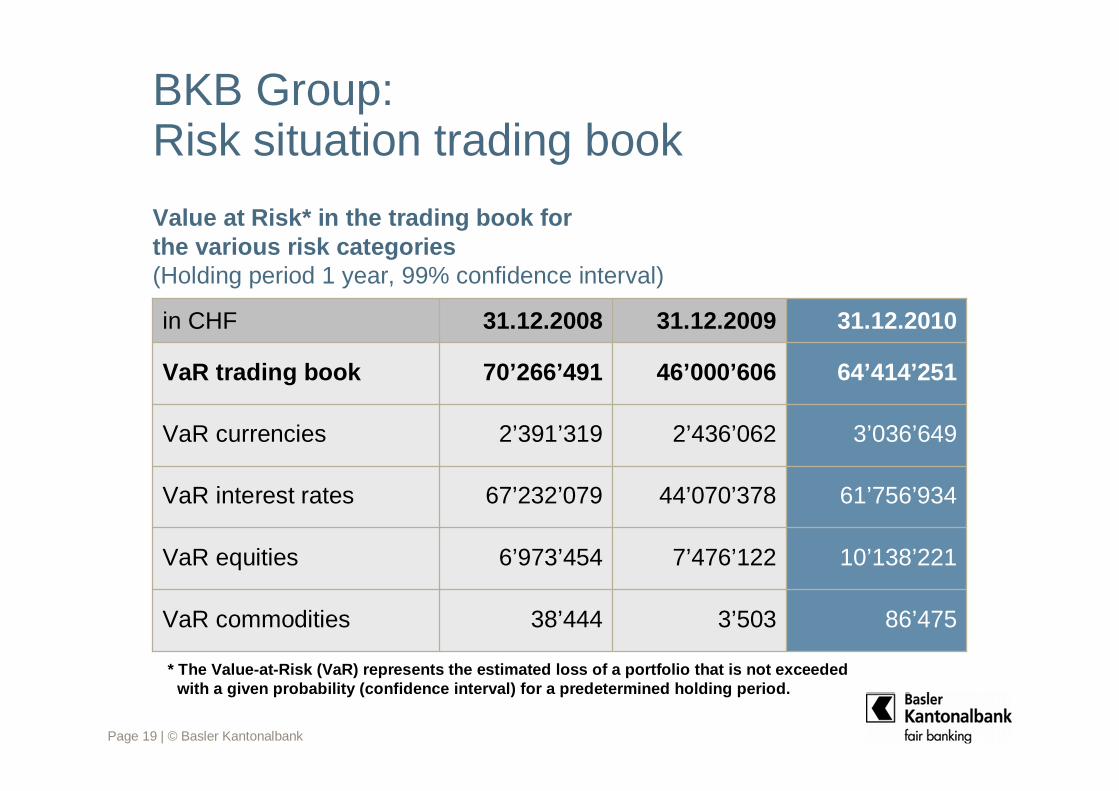
BKB Group:Risk situation trading book
3’503
7’476’122
44’070’378
2’436’062
46’000’606
31.12.2009
10’138’2216’973’454VaR equities
86’47538’444VaR commodities
61’756’934
3’036’649
64’414’251
31.12.2010
67’232’079VaR interest rates
70’266’491VaR trading book
2’391’319VaR currencies
31.12.2008in CHF
Value at Risk* in the trading book forthe various risk categories(Holding period 1 year, 99% confidence interval)
* The Value-at-Risk (VaR) represents the estimated loss of a portfolio that is not exceededwith a given probability (confidence interval) for a predetermined holding period.
Page 20 | © Basler Kantonalbank
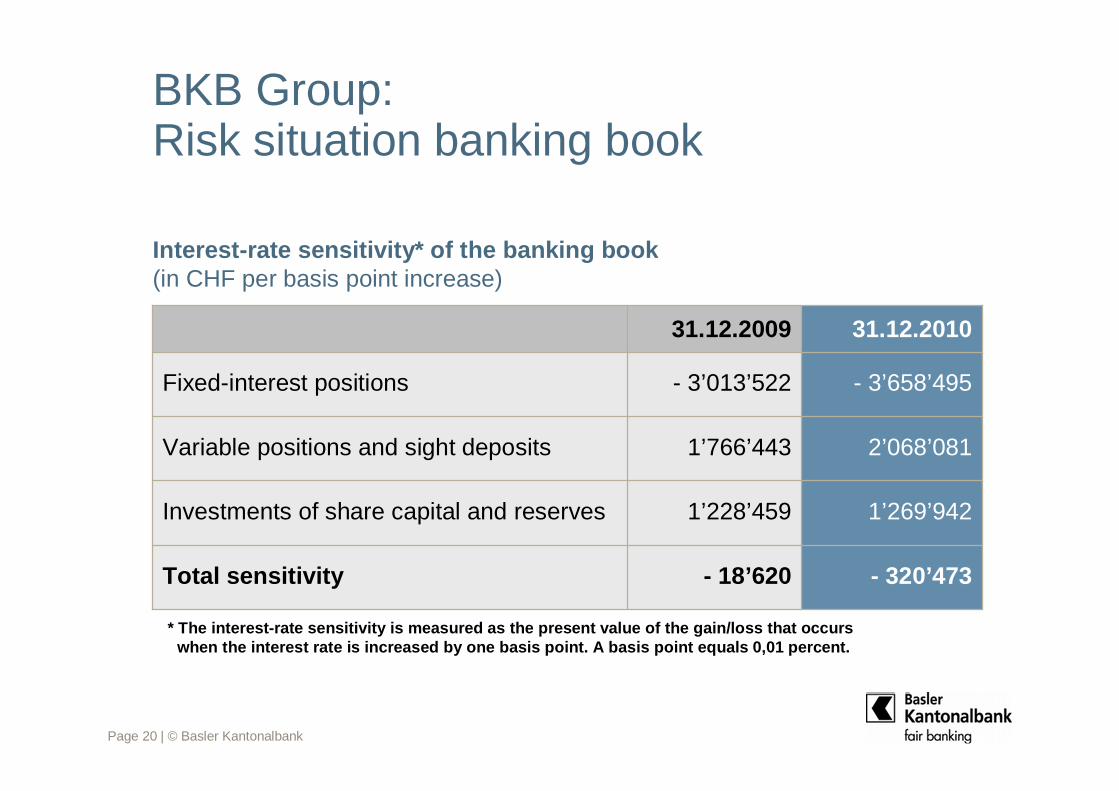
BKB Group:Risk situation banking book
- 18’620
1’228’459
1’766’443
- 3’013’522
31.12.2009
- 320’473Total sensitivity
1’269’942
2’068’081
- 3’658’495
31.12.2010
Investments of share capital and reserves
Fixed-interest positions
Variable positions and sight deposits
Interest-rate sensitivity* of the banking book(in CHF per basis point increase)
* The interest-rate sensitivity is measured as the present value of the gain/loss that occurswhen the interest rate is increased by one basis point. A basis point equals 0,01 percent.
Page 21 | © Basler Kantonalbank
Agenda
1. Financial figures
• Parent Company Basler Kantonalbank
• BKB Group
2. Focal Points
3. Positioning in the BKB Group
4. Objectives 2015
5. BKB Participation Certificate
Page 22 | © Basler Kantonalbank
Migration of BKB Group to Avaloq
Enables offering of complex investment solutions
Increased efficiency for both banks
Shared IT platform „Avaloq“ in the BKB Group
Page 23 | © Basler Kantonalbank
Acquisition of AAM Privatbank AG
• Successful Integration
• Expansion of Client Basis
• New Private Banking Location
• Strengthening of Workforce
Page 24 | © Basler Kantonalbank
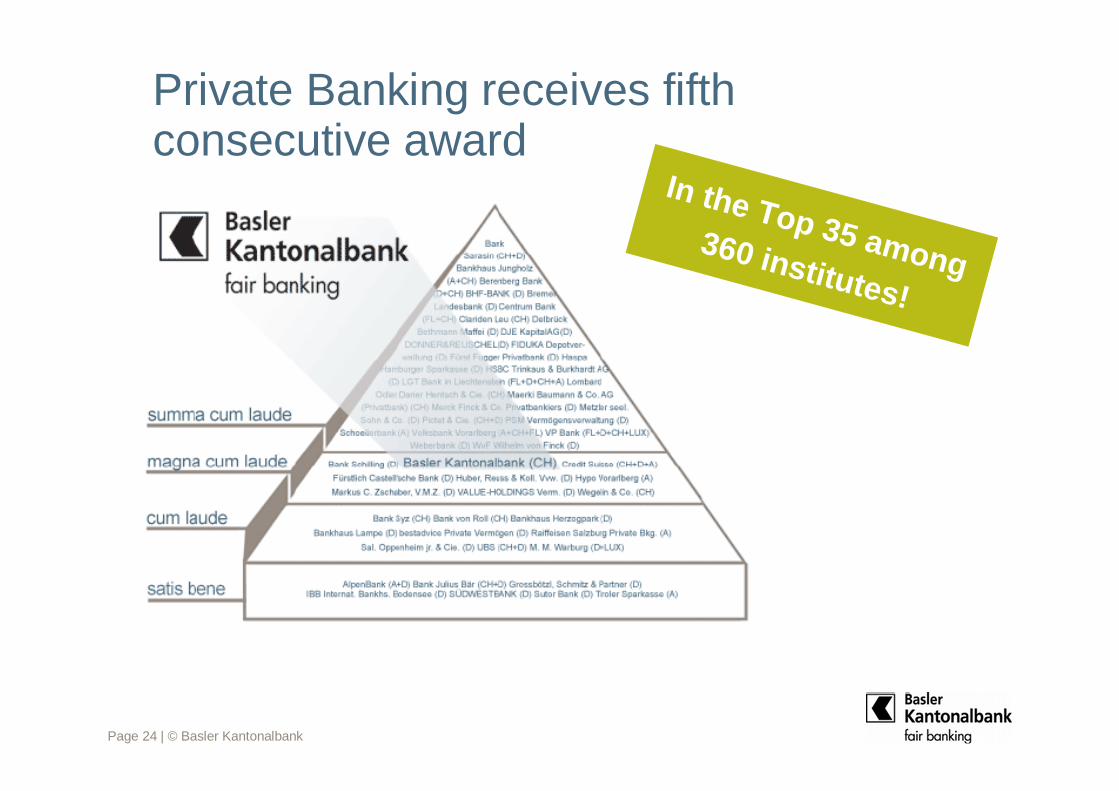
Private Banking receives fifthconsecutive award
In the Top 35 among360 institutes!
Page 25 | © Basler Kantonalbank
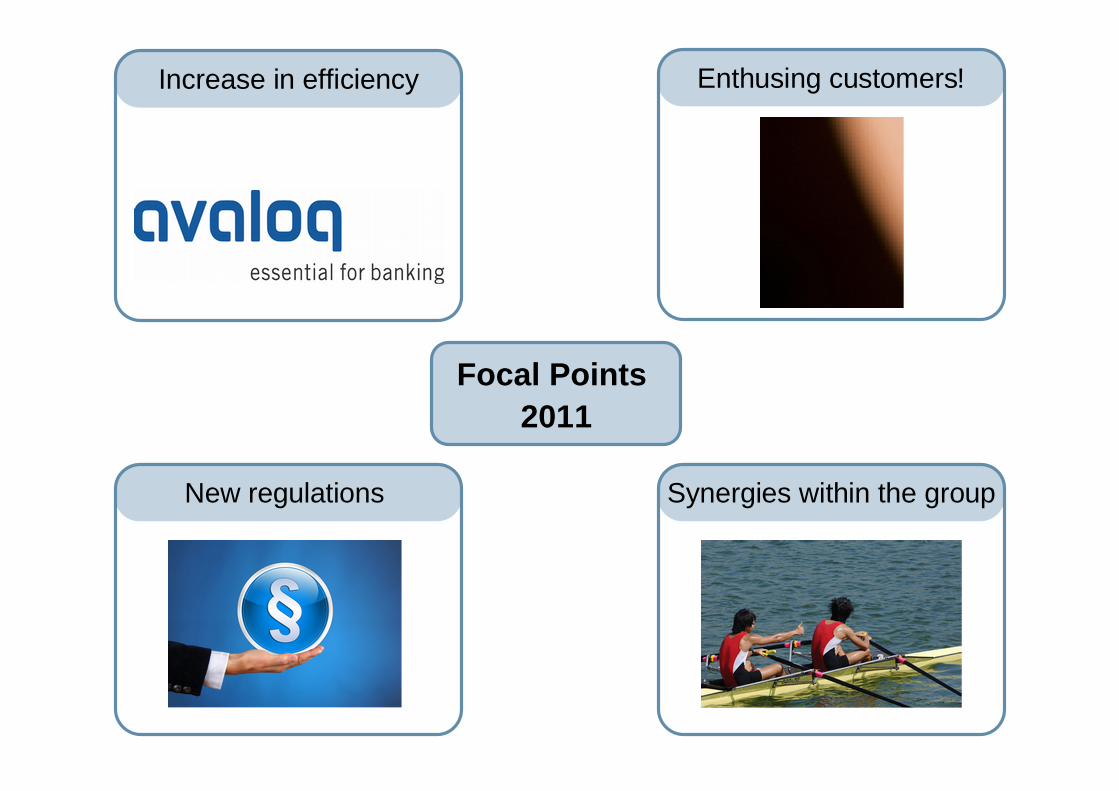
Focal Points2011
Enthusing customers!Increase in efficiency
New regulations Synergies within the group
Page 26 | © Basler Kantonalbank
Agenda
1. Financial figures
• Parent Company Basler Kantonalbank
• BKB Group
2. Focal Points
3. Positioning in the BKB Group
4. Objectives 2015
5. BKB Participation Certificate
Page 27 | © Basler Kantonalbank
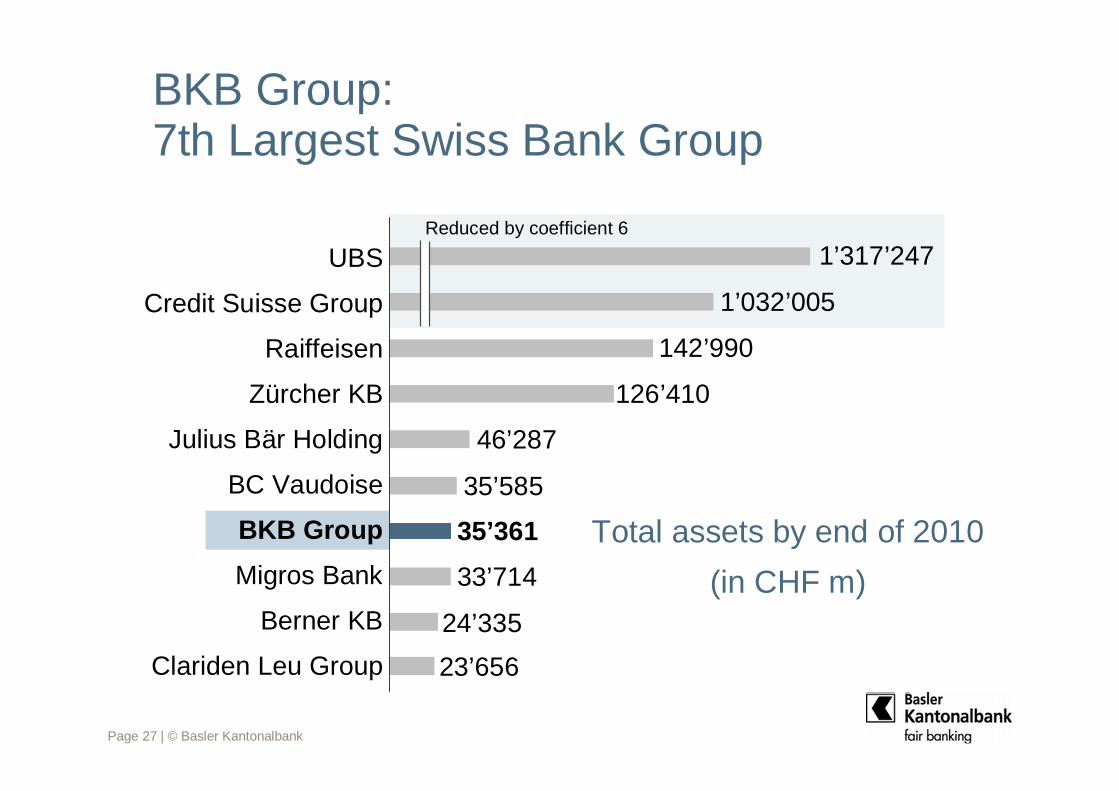
BKB Group: 7th Largest Swiss Bank Group
Reduced by coefficient 6
Total assets by end of 2010
(in CHF m)
1’317’247
1’032’005
142’990
126’410
46’287
35’585
35’361
33’714
23’656
24’335
Clariden Leu Group
Berner KB
Migros Bank
BKB Group
BC Vaudoise
Credit Suisse Group
UBS
Raiffeisen
Zürcher KB
Julius Bär Holding
Page 28 | © Basler Kantonalbank
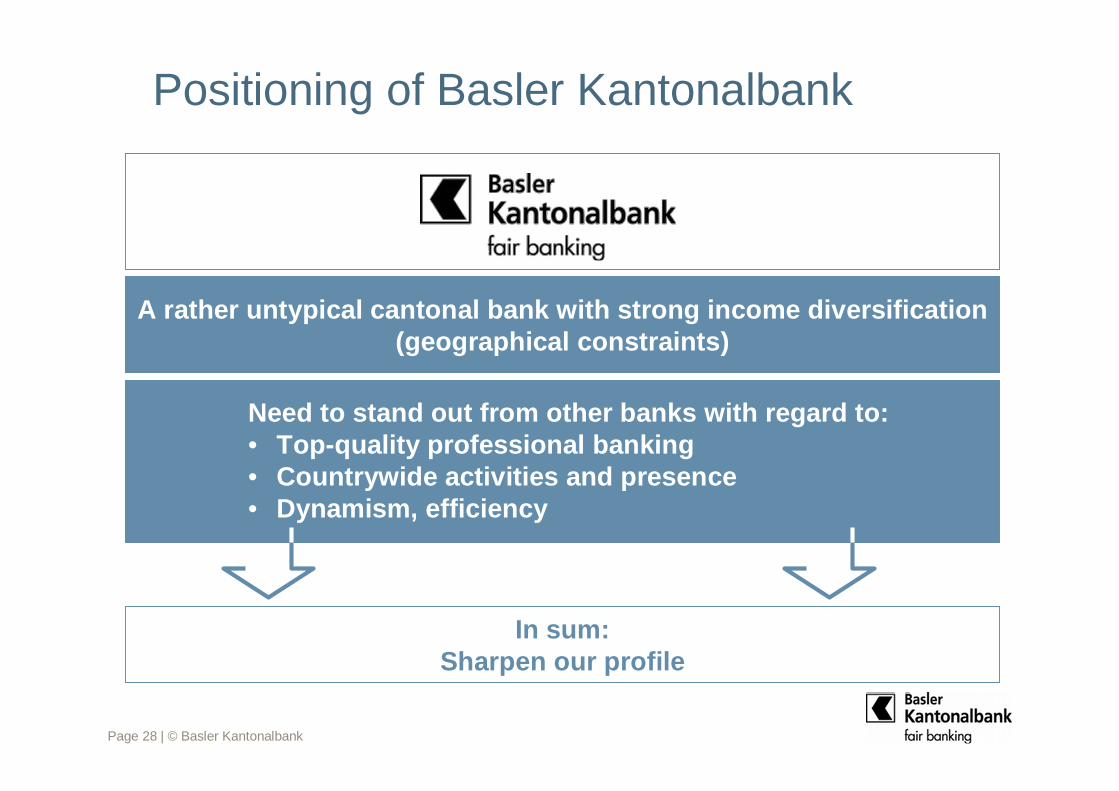
Positioning of Basler Kantonalbank
A rather untypical cantonal bank with strong income diversification(geographical constraints)
Need to stand out from other banks with regard to:• Top-quality professional banking• Countrywide activities and presence• Dynamism, efficiency
In sum:Sharpen our profile
Page 29 | © Basler Kantonalbank
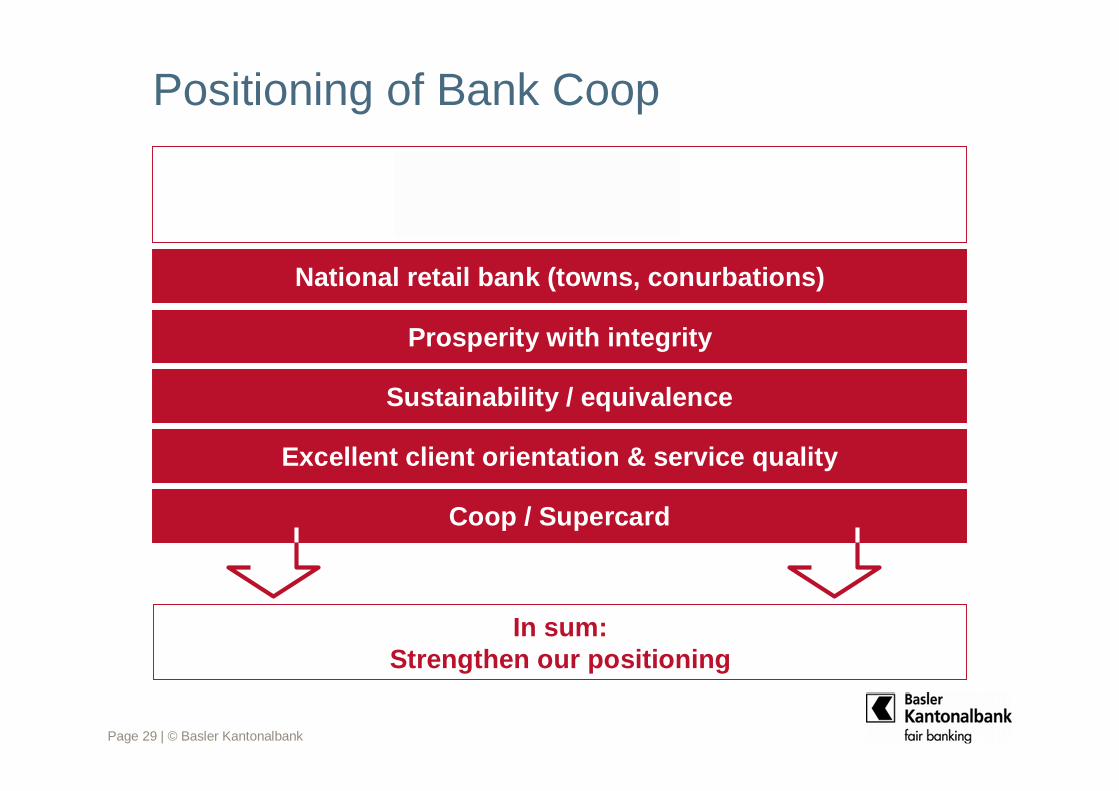
Positioning of Bank Coop
National retail bank (towns, conurbations)
Prosperity with integrity
Sustainability / equivalence
Excellent client orientation & service quality
Coop / Supercard
In sum:Strengthen our positioning
Page 30 | © Basler Kantonalbank
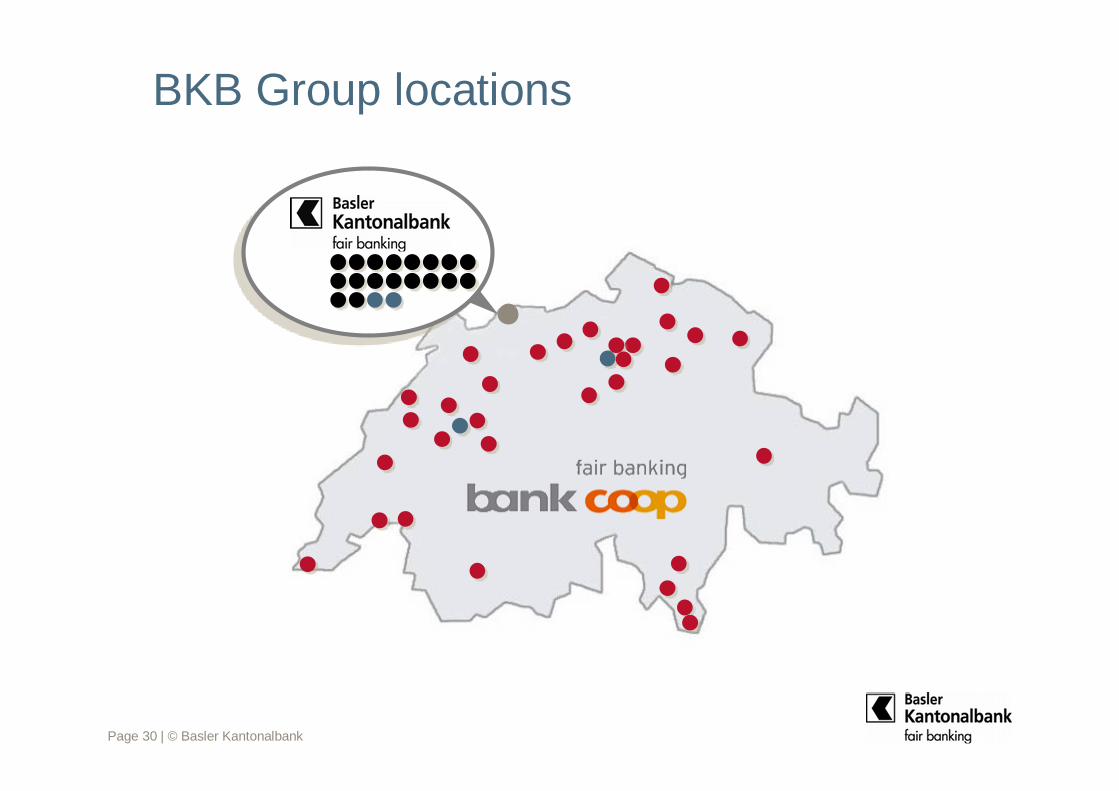
BKB Group locations
Page 31 | © Basler Kantonalbank
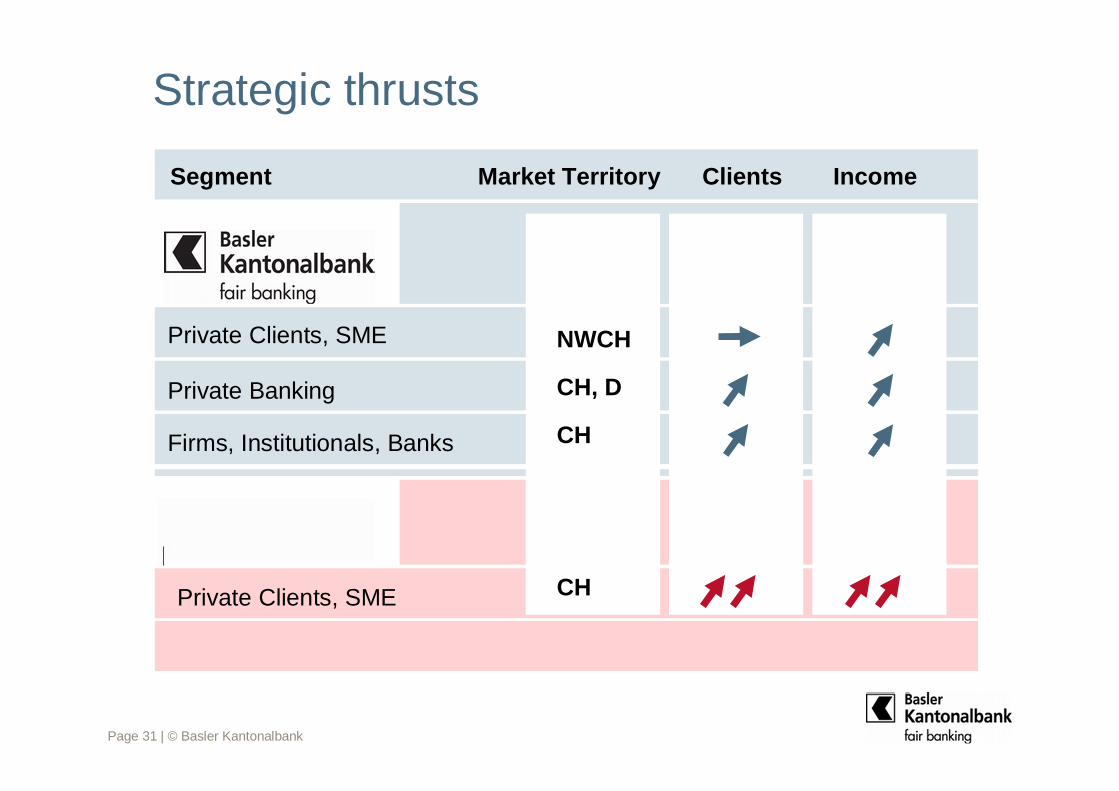
Strategic thrusts
Clients Income
NWCH
CH, D
CH
CH
Segment Market Territory
Private Clients, SME
Private Banking
Private Clients, SME
Firms, Institutionals, Banks
Page 32 | © Basler Kantonalbank
Agenda
1. Financial figures
• Parent Company Basler Kantonalbank
• BKB Group
2. Focal Points
3. Positioning in the BKB Group
4. Objectives 2015
5. BKB Participation Certificate
Page 33 | © Basler Kantonalbank
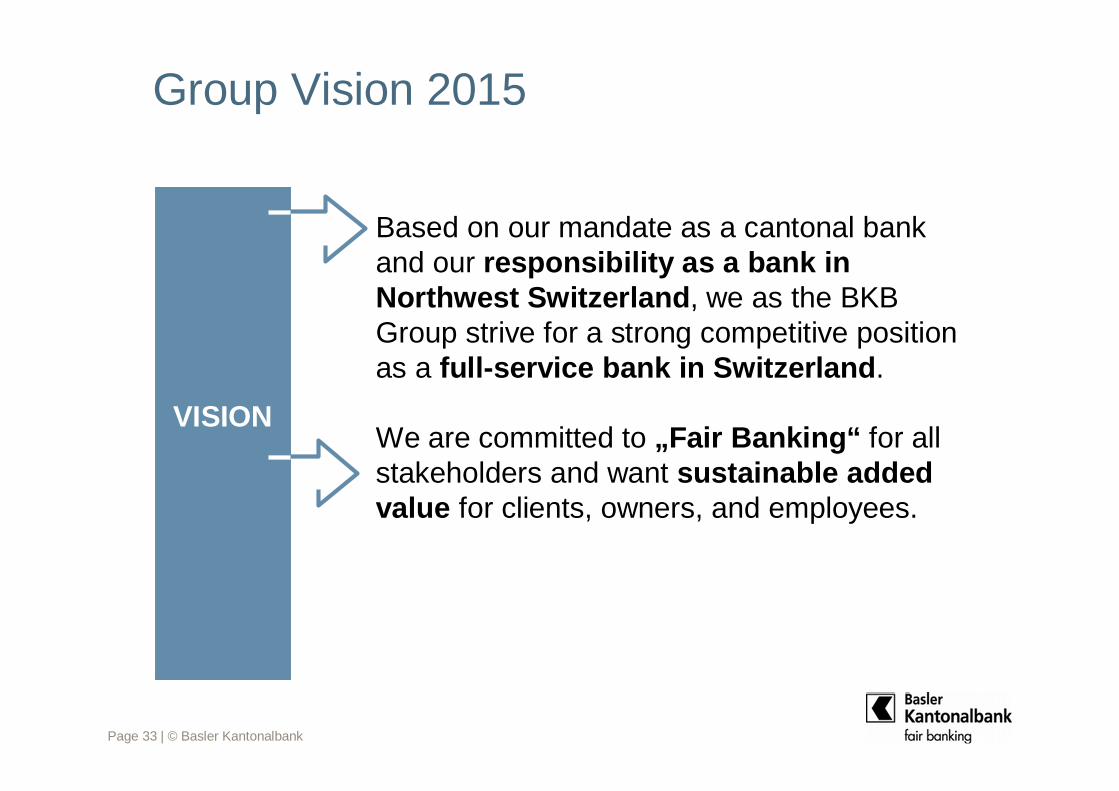
Based on our mandate as a cantonal bankand our responsibility as a bank in Northwest Switzerland, we as the BKB Group strive for a strong competitive positionas a full-service bank in Switzerland.
We are committed to „Fair Banking“ for all stakeholders and want sustainable addedvalue for clients, owners, and employees.
VISION
Group Vision 2015
Page 34 | © Basler Kantonalbank
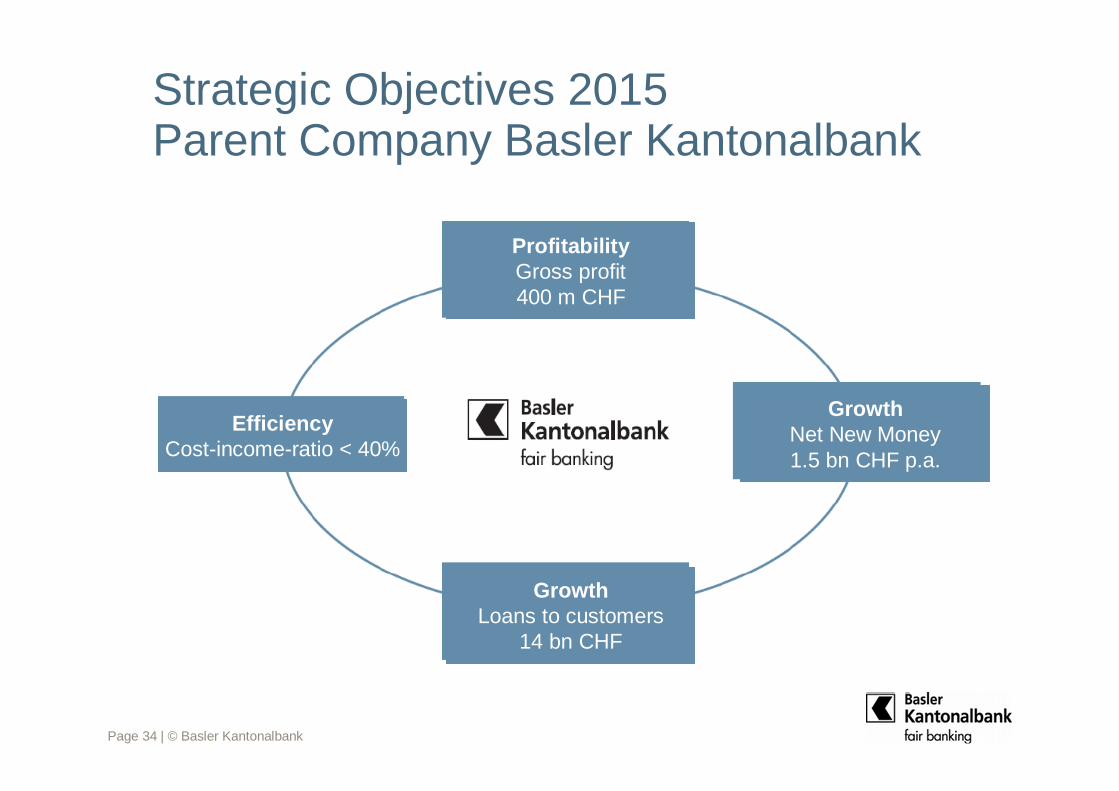
Strategic Objectives 2015 Parent Company Basler Kantonalbank
ProfitabilityGross profit400 m CHF
EfficiencyCost-income-ratio < 40%
GrowthLoans to customers
14 bn CHF
GrowthNet New Money1.5 bn CHF p.a.
Page 35 | © Basler Kantonalbank
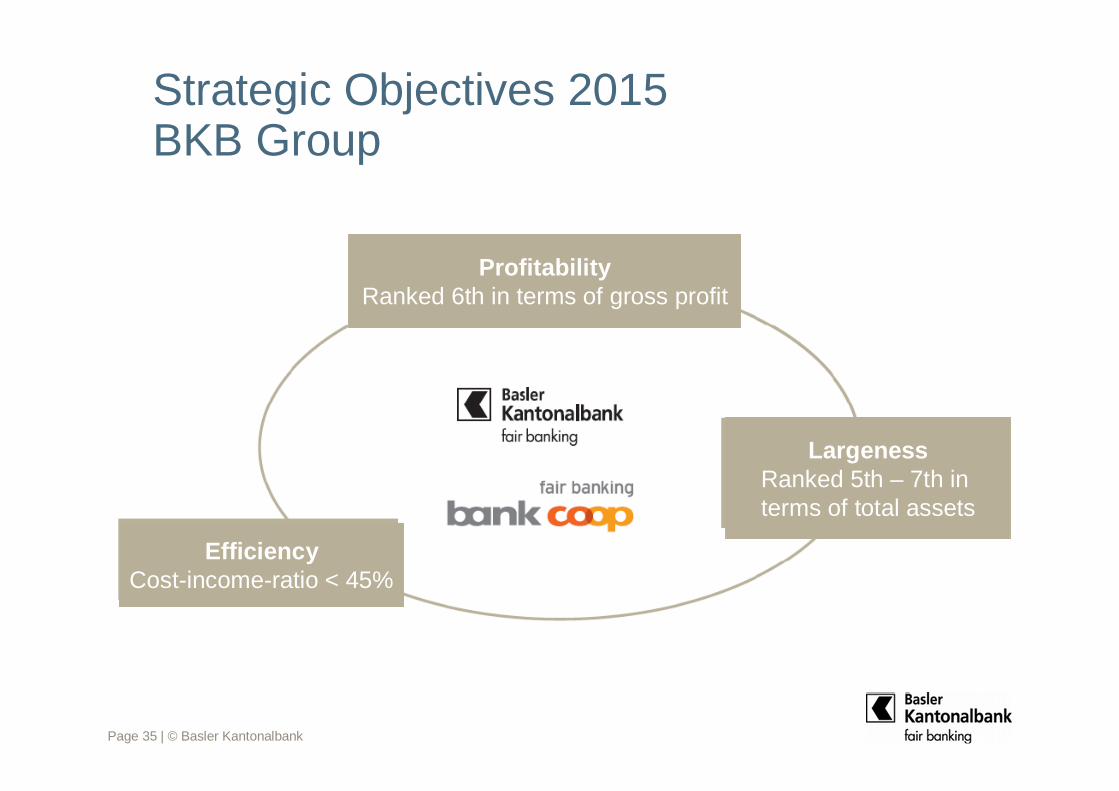
Strategic Objectives 2015BKB Group
EfficiencyCost-income-ratio < 45%
ProfitabilityRanked 6th in terms of gross profit
LargenessRanked 5th – 7th in terms of total assets
Page 36 | © Basler Kantonalbank
Agenda
1. Financial figures
• Parent Company Basler Kantonalbank
• BKB Group
2. Focal Points
3. Positioning in the BKB Group
4. Objectives 2015
5. BKB Participation Certificate
Page 37 | © Basler Kantonalbank
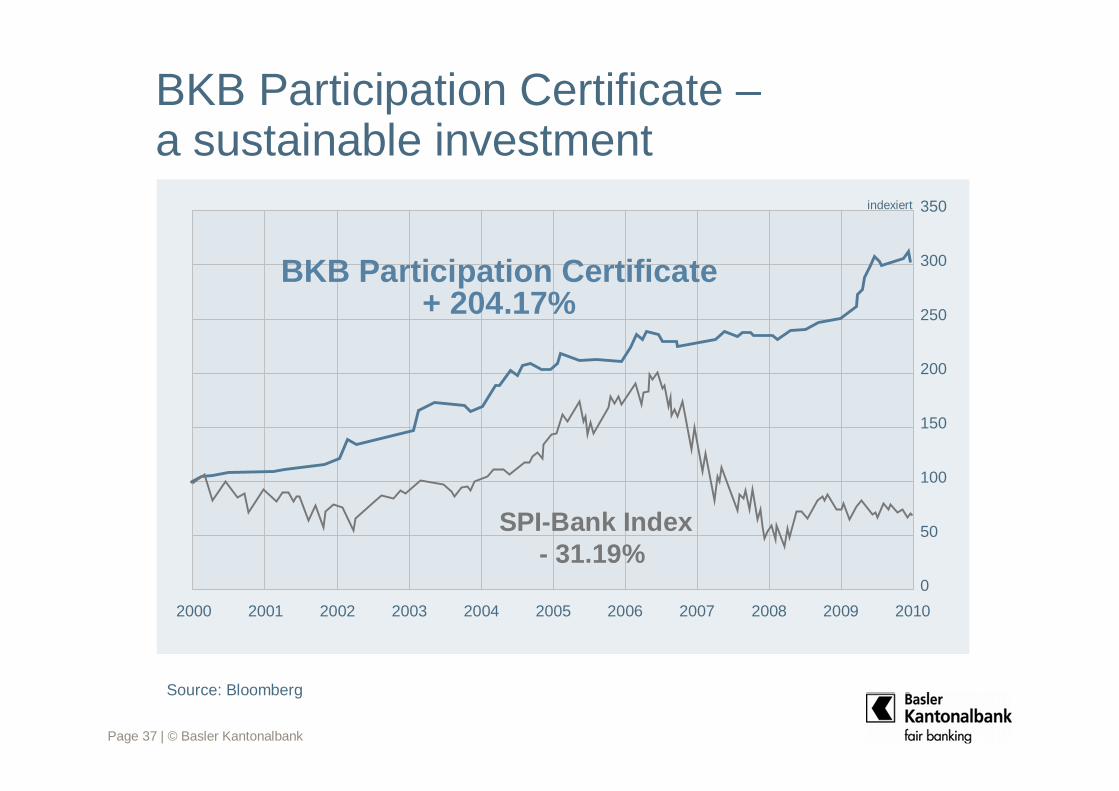
Source: Bloomberg
BKB Participation Certificate –a sustainable investment
2000 2001 2002 2003 2004 2005 2006 2007 2008 2009 2010
350
300
250
200
150
100
50
0
indexiert
BKB Participation Certificate+ 204.17%
SPI-Bank Index- 31.19%
Page 38 | © Basler Kantonalbank
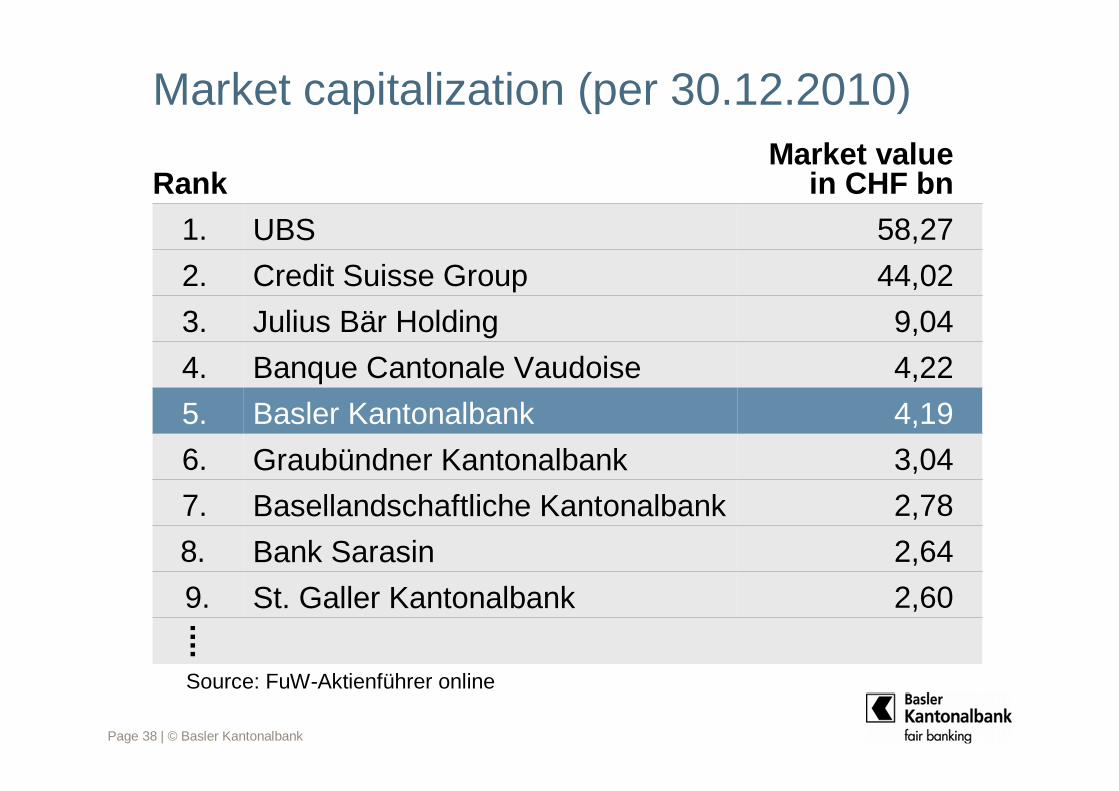
Market capitalization (per 30.12.2010)
2,60St. Galler Kantonalbank9.
Market valuein CHF bnRank
2,64Bank Sarasin8.
4,19Basler Kantonalbank5.
4,22Banque Cantonale Vaudoise4.
9,04Julius Bär Holding3.
3,04Graubündner Kantonalbank6.
Basellandschaftliche Kantonalbank
Credit Suisse Group
UBS
2,787.
44,022.
58,27 1.
Source: FuW-Aktienführer online
Page 39 | © Basler Kantonalbank
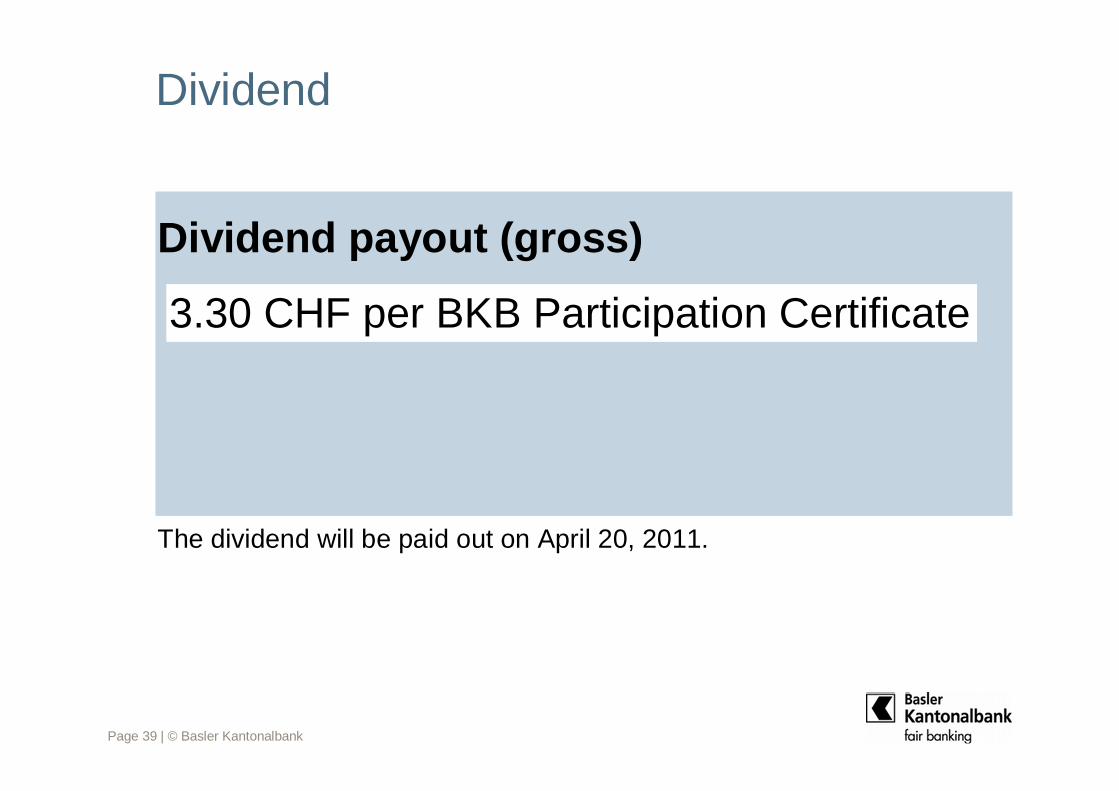
Dividend
Dividend payout (gross)
3.30 CHF per BKB Participation Certificate
The dividend will be paid out on April 20, 2011.
Page 40 | © Basler Kantonalbank
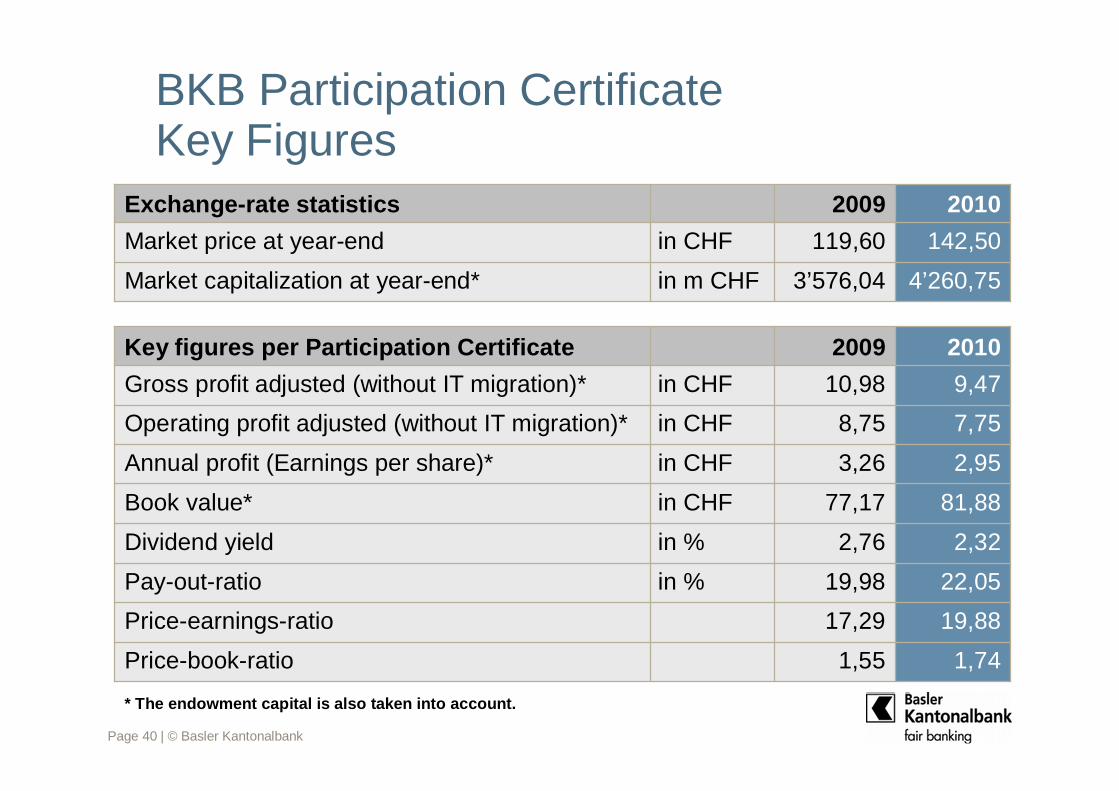
BKB Participation CertificateKey Figures
4’260,753’576,04in m CHFMarket capitalization at year-end*
119,60
2009
142,50in CHFMarket price at year-end
2010Exchange-rate statistics
81,8877,17in CHFBook value*
2,322,76in %Dividend yield
22,0519,98in %Pay-out-ratio
19,8817,29Price-earnings-ratio
1,741,55Price-book-ratio
3,26
8,75
10,98
2009
2,95in CHFAnnual profit (Earnings per share)*
9,47in CHFGross profit adjusted (without IT migration)*
7,75in CHFOperating profit adjusted (without IT migration)*
2010Key figures per Participation Certificate
* The endowment capital is also taken into account.
Page 41 | © Basler Kantonalbank
Caution regarding forward-looking statements
- This communication contains statements that constitute “forward-looking statements”, including, but not limited to, statements relating to the implementation of strategic initiatives, such as the expansion in private banking, and other statements relating to our future business development and economic performance.
- While these forward-looking statements represent our judgments and future expectations concerning the development of our business, a number of risks, uncertainties and other important factors could cause actual developments and results to differ materially from our expectations.
- These factors include, but are not limited to, (1) general market, macro-economic, governmental and regulatory trends, (2) movements in local and international securities markets, currency exchange rates and interest rates, (3) competitive pressures, (4) technological developments, (5) changes in the financial position or creditworthiness of our customers, obligors and counterparties and developments in the markets in which they operate, (6) federal and local legislative developments, (7) management changes and changes to our Business Group structure.
- Basler Kantonalbank is not under any obligations to (and expressly disclaims any such obligations to) update or alter its forward-looking statements whether as a result of new information, future events, or otherwise.
Disclaimer
Page 42 | © Basler Kantonalbank
Basler KantonalbankHead of General Secretariat / Media Office / IRDr Michael BuessP.O. BoxCH-4002 Basel
Direct line +41 (0)61 266 29 77Fax +41 (0)61 266 26 40E-mail [email protected]
www.bkb.ch
Contact Details