Investor Call Presentation - Diamond Bankdiamondbank.com/images/banners/linkcreation/IR/2013... ·...
40
Investor Call Presentation Full Year 2013 & Q1 2014 Results
Transcript of Investor Call Presentation - Diamond Bankdiamondbank.com/images/banners/linkcreation/IR/2013... ·...

14 APRIL 2014
Investor Call Presentation
Full Year 2013
&
Q1 2014 Results

2
Forward looking statements
This presentation contains or incorporates by reference ‘forward-looking statements’ regarding the belief or current expectations of Diamond
Bank, the Directors and other members of its senior management about the Group’s businesses and the transactions described in this
presentation. Generally, words such as ‘‘could’’, ‘‘will’’, ‘‘expect’’, ‘‘intend’’, ‘‘anticipate’’, ‘‘believe’’, ‘‘plan’’, ‘‘seek’’ or similar expressions identify
forward-looking statements.
These forward-looking statements are not guarantees of future performance. Rather, they are based on current views and assumptions and
involve known and unknown risks, uncertainties and other factors, many of which are outside the control of the Company and/or its Group and
are difficult to predict, that may cause actual results to differ materially from any future results or developments expressed or implied from the
forward-looking statements. Such risks and uncertainties include, but are not limited to, regulatory developments, competitive conditions,
technological developments and general economic conditions. The Bank assumes no responsibility to update any of the forward looking
statements contained in this presentation.
Any forward-looking statement contained in this presentation based on past or current trends and/or activities of Diamond Bank should not be
taken as a representation that such trends or activities will continue in the future. No statement in this presentation is intended to be a profit
forecast or to imply that the earnings of the Company for the current year or future years will necessarily match or exceed the historical or
published earnings of the Company. Each forward-looking statement speaks only as of the date of the particular statement. Diamond Bank
expressly disclaims any obligation or undertaking to release publicly any updates or revisions to any forward-looking statements contained herein
to reflect any change in Diamond Bank’s expectations with regard thereto or any change in events, conditions or circumstances on which any
such statement is based.
3
Outline
• Executive Summary (by Dr. Alex Otti, GMD)
• Strategy & Business Update (by Dr. Alex Otti, GMD)
• FY 2013 Financial Performance (by Abdulrahman Yinusa, CFO)
• Q1 2014 Financial Performance (by Abdulrahman Yinusa, CFO)
• Concluding Remarks (by Dr. Alex Otti, GMD)

4
Overview
The global economic recovery remained weak despite the US Federal Reserve tapering which further
depressed economic activities in emerging markets.
Global economy grew 3.0% in 2013, and forecast to grow by 3.7% in 2014; driven by recovery in
advanced economies.
The World Economy
The Nigerian Economy
Our Strategy
Outlook
The Nigerian economy grew by approximately 6.8% in 2013. Nigeria remains an attractive investment
destination as the on-going transformation in the real sector is poised to deliver sustainable growth in
the mid to long term.
The recent rebasing of the GDP (to $510bn) offers fresh imperatives for investment opportunities.
The Bank’s full year 2013 and Q1 2014 results point to a healthy and sustainable growth. Our strategy
remains to consolidate our dominance in the Retail/SME space while remaining relevant in the
Corporate space.
We will continue to offer unequalled customer experience within the financial inclusion framework.
Despite the challenging operating environment, we will continue to explore all opportunities to grow
our business and market share as we leverage on our growing customer relationships.
We remain positive on our retail banking strategy, even though our business and corporate banking
segments remain significant business drivers.

5
Operating Environment
Average GDP growth rate of 6.8% in 2013 (7.7% in Q4 2013)
Agriculture, Wholesale & Retail trades and Services remain key drivers of GDP
Average Headline Inflation of 8.5% in 2013 year-on-year (8.0% in Dec. 2013)
Stable official exchange rate – N155/N160; albeit the Naira came under pressure at the parallel
market segment.
Reduction in Commission on Turnover (COT) from N5/mille to N3/mille (April 2013); N2/mille (Year
2014); N1/mille (Year 2015); and N0/mille (year 2016)
Increase in the savings interest rate to 30% of Monetary Policy Rate (MPR) – 3.6%
Increase in Cash Reserve Requirement (CRR) charge on Public Sector funds to 50% ( August 2013),
and 75% (February 2014)
Increase in CRR charge on Private Sector funds to 15% from 12% (April 2014)
Cashlite policy – Lagos (April 2012); 6 States (Oct. 2013); Nationwide (to commence in July 2014)
Sound and Stable Macroeconomic Environment
Regulatory Environment

6
Nigerian Economy – Key Trends
0
2
4
6
8
10
12
14
16
2008 2009 2010 2011 2012 2013
Monetary policy rate Standing lending rate Standing deposit rate
-10
-8
-6
-4
-2
0
2
4
6
8
10
12
14
2008 2009 2010 2011 2012 2013
Interest Rates, %
Private Sector Credit Growth, % YoY
2010 2011 2012 2013
7.9% 7.4%
6.6% 6.8%
GDP Growth Rates, % YoY
Inflation Rate, % YoY
13.9%
10.9% 12.2%
8.5%
2010 2011 2012 2013

7
Diamond Bank at a glance
Diamond Bank
Diamond Bank Togo
Diamond Bank Senegal
Diamond Bank Cote d’Ivoire
Current Group Structure
Diamond Pension Fund
Custodian
Diamond Bank Benin S.A.
Diamond Bank
UK
Diamond Bank commenced operations in March 1991; assumed the
universal banking status in Feb. 2001; and was listed on the NSE in
May 2005.
The Bank acquired Lion Bank in October 2005 and listed its GDRs on
the Professional Securities Market of the London Stock Exchange in
January 2008.
The Group has 286 branches across Nigeria, Benin Republic, Cote
d’Ivoire, Senegal, Togo and the United Kingdom.
In line with the new CBN banking model, Diamond divested from its
subsidiaries and obtained licence to operate as a commercial bank
with international authorization.
Background
Countries with Banking Presence
Nigeria (255 branches), Benin (19), Cote d’Ivoire (3), Senegal (4), Togo (4) and UK (1)
Listings Nigeria Stock Exchange – 2005 London PSE – 2008
Market Capitalisation*
N91.9 billion (As of 31 March 2014)
Ratings Fitch: BBB+ (B, Stable - Int’l), GCR: A-
Number of accounts
3.4 million
ATMs/POS 689 / 10,500
Staff Head Count (Group)
4,366
Alternative Delivery Channels
ATMs, POS, Internet, mobile
Direct Sales Force 1,567
Strategic Partners IFC, USAID, WWB, EFINA, MTN
Recognitions Appointed by DFID as one of the four African banks to manage $7.1 million financial inclusion project
Awards
IFC’s Award for Best Issuing Bank in Su—Saharan Africa (under IFC Global Trade Finance Program); Best Credit card in Nigeria; Best Bank in Oil & Gas investment
Key Highlights

8
Gross earnings grew 30% to N181 billion, driven by the growth in
balance sheet and other transactional activities.
PBT grew by 19% to N32bn from N27bn in December 2012.
Customer deposits continued to drive balance sheet growth.
Comments
FY 2013 Group Performance Summary
P & L (N’Bn) FY 2013 FY 2012 % Growth
Gross Earnings 181 139 30
Operating Income 140 113 24
Profit Before Tax 32 27 19
Balance Sheet FY 2013 FY 2012 % Growth
Total Assets 1,519 1,178 29
Loans to customers 689 585 18
Deposits 1,206 910 33

9
Forecast for 2014 Profitability
Impact on P&L (N’Bn)
Operating Profit 55
Provision for Losses
- Direct Provision (Circa) ~ (20)
Profit/(Loss) Before Tax 35
45 55
28 32
2012 2013 2014 est
Operating Profit PBT
Deposits (N’Bn) Operating Profit and PBT (N’Bn)
ROE of 23% achieved in 2013 financial year
ROE of above 20% expected in 2014 (excl. impact of any increase in
equity capital)
Comments
35
55
-11.4%
22.7% 23.0%
> 20%
2011 2012 2014 est.
ROAE
2013

10
Outline
• Executive Summary (by Dr. Alex Otti, GMD)
• Strategy & Business Update (by Dr. Alex Otti, GMD)
• FY 2013 Financial Performance (by Abdulrahman Yinusa, CFO)
• Q1 2014 Financial Performance (by Abdulrahman Yinusa, CFO)
• Concluding Remarks (by Dr. Alex Otti, GMD)

11
Business Segments
79
222
109
309
1
Gross Risk Assets (N'bn)
Retail Banking
Business Banking
Subsidiaries
Corporate Banking
Treasury
6.2
6.2 5.3
7.7
0
NPLs (N'bn)
Retail Banking
Business Banking
Subsidiaries
Corporate Banking
Treasury
393
542
189
53 29
Deposits (N'bn)
Retail Banking
Business Banking
Subsidiaries
Corporate Banking
Treasury
7.8 2.8
4.9
2.5 0
NPL (%)
Retail Banking
Business Banking
Subsidiaries
Corporate Banking
Treasury

12
Retail Banking
More Efficient Balance Sheet
Strategic Partnerships
Continue to drive low-cost deposits by deploying cost effective delivery channels.
Continue to reach out to the under-banked and underserved population through:
(i) Full roll out of the BETA proposition in partnership
with Women’s World Banking (WWB)
(ii) Launched the youth & mass market proposition in
partnership with MTN (Diamond Y’ello Account)
Retail Banking Growth Strategy Retail Banking Loan Portfolio
New Segments Launched the school banking proposition to capture the
entire value chain of the educational sector.
16% 13% 12% 12% 11%
4% 4% 6% 5% 5%
11% 11% 10% 10% 9%
53% 54% 51% 51% 50%
16% 18% 21% 22% 25%
Dec. 12 Mar. 13 Jun. 13 Sep. 13 Dec. 13
Personal Loan Auto Loan & Lease Mortgages MSME Credit Card
Critical target markets include:
– MSMEs (with annual turnover of < N500 million)
– Individuals and Sole Proprietors
– Mass Market
Recognition
Only Nigerian Bank appointed alongside three other African banks by UK’s DFID to manage $7.1 million dedicated to bringing 1.3 million people in sub-Saharan Africa into the formal financial services sector.
Ranked among the four most customer-centric banks in the Retail segment – 2013 Retail Banking Survey
Awards
Best Credit Card product of the year by Coalition for e-payments (2nd year running)
Best co-branded program of the year by Coalition for e-payments

13
Our Retail Footprint: Diverse Channel Options
Number of Customer Accounts (million)
Number of Online Banking Customers
Number of ATMs
240
408
671
Dec. 2011 Dec. 2012 Dec. 2013
180%
1.5
2.1
3.4
Dec. 2011 Dec. 2012 Dec. 2013
69,789
356,907
1,120,671
Dec. 2011 Dec. 2012 Dec. 2013
15,058%
127%
1,053 1,092
1,567
Dec. 2011 Dec. 2012 Dec. 2013
Number of Direct Sales Agents No. of Mobile Banking Customers (million)
49%
Number of Telephone Banking customers
2,933
828,155
1,185,729
Dec. 2011 Dec. 2012 Dec. 2013
1.4
1.9
2.8
Dec. 2011 Dec. 2012 Dec. 2013
100%
403,272%

14
24% Savings & Demand
Deposits 85% (86%)
Time deposits 15% (14%)
Dec 2013 (Dec 2012)
86% 85% 84% 86% 85%
14% 15% 16% 14% 15%
Dec. 2012 Mar. 2013 Jun. 2013 Sep. 2013 Dec. 2013
Low Cost Deposits Fixed Deposits
Retail Deposits (N’Bn)
N393bn
29%
N305bn N316bn N334bn
Retail Banking – Trend in Deposits & Loans
15%
N343bn
16%
4%
11%
53%
16%
Dec. 12
Personal Loan
Auto Loan & Lease
Mortgages
MSME
Credit Card
11%
5%
9%
50%
25%
Dec. 13
Personal Loan
Auto Loan & Lease
Mortgages
MSME
Credit Card

15
Business Banking
Middle Market 66%
(67%)
Public Sector 34%
(33%)
Deposits N542bn (Dec 2012: N415bn)
Middle Market 96%
(96%)
Public Sector 4%
(4%)
Risk Assets N222bn (Dec 2012: N213bn)
Business Banking Growth Strategy
SMEs
Strategic Partnerships
Continue to provide flexible access to credits – provision of on-lending facilities
Continue to work with DFIs to support SMEs
Partnering with IFC to build capacity and increase access to agric. finance for SMEs
International Trade
Leverage on our UK subsidiary in providing trade finance support
Risk Assets
Deposits

16
Corporate Banking
Loan Portfolio
Deposits
28% 21% 22% 21%
16% 17% 18% 18%
56% 62% 60% 61%
Dec. 2012 Jun. 2013 Sep. 2013 Dec. 2013
Institutional banking Infrastructure & Transport Energy Business
47% 38% 35% 31% 38%
22% 22% 33% 27%
30%
31% 40%
32%
42%
32%
Dec. 2012 Mar. 2013 Jun. 2013 Sep. 2013 Dec. 2013
Institutional banking Infrastructure & Transport Energy Business
More Efficient Balance Sheet
Strategic Partnerships
Continue to leverage on e-payment and cash management services.
Continue to work with DFIs and multilateral agencies to provide funding
Corporate Banking Growth Strategy
Recognitions & Awards
Received the World Finance Group award for the best Oil & Gas Investment in 2013 (2nd year running)
Appointed as one of the lending institutions to disburse the Cabotage Vessel Financing Fund (CVFF)
17
Outline
• Executive Summary (by Dr. Alex Otti, GMD)
• Strategy & Business Update (by Dr. Alex Otti, GMD)
• FY 2013 Financial Performance (by Abdulrahman Yinusa, CFO)
• Q1 2014 Financial Performance (by Abdulrahman Yinusa, CFO)
• Concluding Remarks (by Dr. Alex Otti, GMD)

18
Strong Balance Sheet Growth (Dec. 2012 to
Dec. 2013)
+29%
Assets
+18%
Loans (net)
+33%
Deposits
ROAE of 23.0% (Dec. 2012: 22.7%); ROAA of 2.1% (Dec. 2012: 2.0%)
EPS of 197k (Dec. 2012: 153k)
Profit before tax (PBT) up 19% to N32.0 billion (Dec. 2012: N27.0 billion)
Efficiency and
Profitability
Capital ratios – 17.3% risk adjusted capital ratio in FY 2013 against 15% statutory limit
Liquidity ratios of 41.8% (Dec. 2012: 42.3%, Sept. 2013: 36.7%)
Liquidity was adversely impacted by the new CRR on government funds
Capital and
Liquidity
Strong net interest margin of 8.1% - one of the best in the industry
30% growth in gross earnings to N181 billion (Dec. 2012: N139 billion)
Low cost of funds – 3.4% driven by the continuous growth in retail deposits
Revenue Mix
Financial Highlights
Improving NPL – 3.5% in FY 2013; 4.7% in Dec. 2012
Coverage ratio – 116.1% in FY 2013 from 88.9% in Dec. 2012 Assets Quality
19
Group Statement of Comprehensive Income (FY 2013)
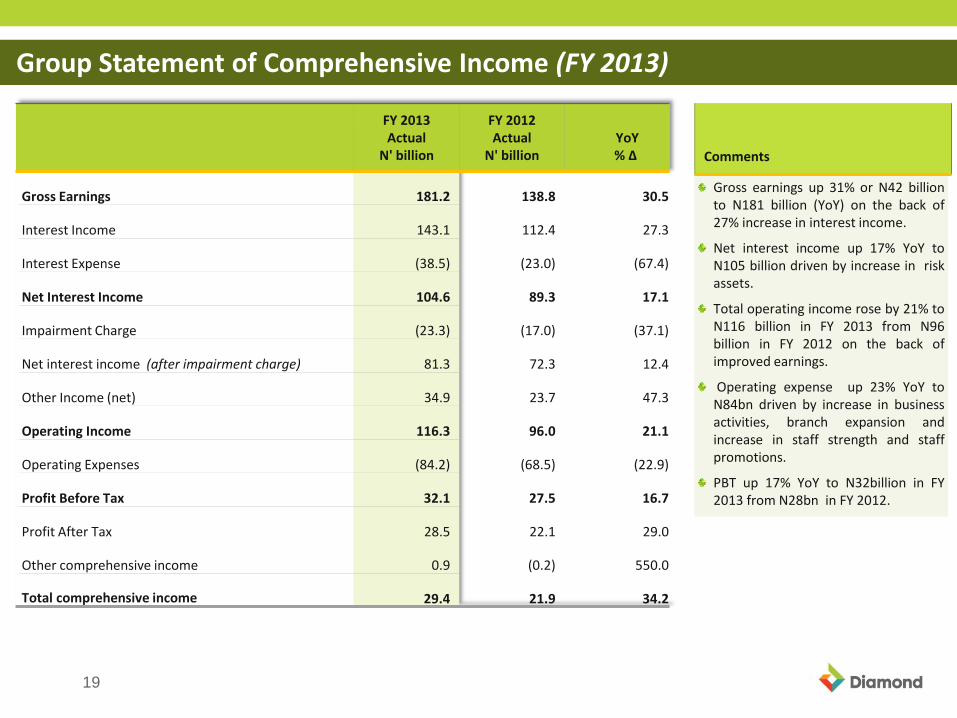
Gross earnings up 31% or N42 billion to N181 billion (YoY) on the back of 27% increase in interest income.
Net interest income up 17% YoY to N105 billion driven by increase in risk assets.
Total operating income rose by 21% to N116 billion in FY 2013 from N96 billion in FY 2012 on the back of improved earnings.
Operating expense up 23% YoY to N84bn driven by increase in business activities, branch expansion and increase in staff strength and staff promotions.
PBT up 17% YoY to N32billion in FY 2013 from N28bn in FY 2012.
Comments
FY 2013 Actual
N' billion
FY 2012 Actual
N' billion YoY % Δ
Gross Earnings 181.2 138.8 30.5
Interest Income 143.1 112.4 27.3
Interest Expense (38.5) (23.0) (67.4)
Net Interest Income 104.6 89.3 17.1
Impairment Charge (23.3) (17.0) (37.1)
Net interest income (after impairment charge) 81.3 72.3 12.4
Other Income (net) 34.9 23.7 47.3
Operating Income 116.3 96.0 21.1
Operating Expenses (84.2) (68.5) (22.9)
Profit Before Tax 32.1 27.5 16.7
Profit After Tax 28.5 22.1 29.0
Other comprehensive income 0.9 (0.2) 550.0
Total comprehensive income 29.4 21.9 34.2

20
Loans to banks
7% (8%)
Loans and advances to customers 71% (79%)
Investment securities 22% (13%)
Interest Income
Commission on turnover 17% (18%)
Letter of credit
commission 11% (9%)
Service fees & charges 35%
(54%)
Others 37% (19%)
Net Fee and Commission Income
Group Profit Drivers – Strong Revenue Generation
Gross earnings up 30.5% to N181.2 billion YoY.
Interest income accounted for 79.0% of gross earnings (80.9% in
2012) while 18.2% was derived from non-interest income (19.4% in
2012).
Revenue growth was driven by sustained risk assets volume and fee
generating transactions.
However, this was partially offset by the impact of margin
compression.
Dec 2013 (Dec 2012) Dec 2013 (Dec 2012)
112.4 143.1
26.4
38.1
Dec. 2012 Dec. 2013
Int Income Non int. Income
Revenue Mix (YoY : +31%)
N181.2bn
N138.8bn
Comments

21
Group Profit Drivers – Moderate Operating Expenses
N’Billion
17.0 23.3
Dec. 2012 Dec. 2013
Impairment Charge (YoY: -37%)
60.6% 60.3%
Dec. 2012 Dec. 2013
Cost to Income Ratio (excludes provisions)
Operating expenses increased 23% year-on-year to N84.2 billion,
due mainly to investment in new branches and work force.
Staff strength in the Bank increased to 3,805 in Dec 2013 from
2,912 in Dec. 2012.
Impairments went up due principally to significant reduction in
collateral valuations.
Comments
N’Billion
42.5 54.8
26.0
29.4
Dec. 2012 Dec. 2013
Operating expenses Employee benefit expenses
Expense Summary (YoY: +23%)

22
2
2
Group Statement of Financial Position
Net loan book of N689 billion, up 18% from
December 2012 (N585 billion) primarily
reflecting growth in volume of business.
Deposit base continues to grow above the N1
trillion mark closing at N1.206 trillion, up 33%
from December 2012 (N910 billion).
Total assets up 29% to N1.5 trillion from N1.2
trillion as at December 2012.
Effect of new CRR Policy led to increase in cash
and balances sterilized at the CBN by 73% in FY
2013 from N132bn in Dec 2012.
Comments
FY 2013 Actual
N' billion
FY 2012 Actual
N' billion
YoY % Δ
Cash & Balances with Central Banks 228.3 132.2 72.7
Loans & Advances to Banks 129.4 139.8 (7.4)
Loans & Advances to Customers 689.2 585.2 17.8
Investments 294.0 173.7 69.3
Pledged Assets 96.5 79.3 21.7
Other Assets 22.1 13.8 60.1
Fixed Assets & Intangibles 52.7 45.8 15.1
Deferred Tax Asset 6.7 8.3 (19.3)
Total Assets 1,518.9 1,178.1 28.9
Deposits from Banks 54.6 31.2 75.0
Deposits from Customers 1,206.0 910.2 32.5
Derivative Liability 14.7 13.2 11.4
Other Liabilities 36.3 45.2 (19.7)
Borrowings 47.5 50.0 (5.0)
Long Term debt 20.9 19.4 7.7
Equity 138.9 108.9 27.5 Total Equity & Liabilities 1,518.9 1,178.1 28.9

23
Group Risk Management Metrics – FY 2013
FY 2013 N’ billion
9-M 2013 N’ billion
H1 2013 N’ billion
Q1 2013 N’ billion
FY 2012 N’ billion
Gross Risk Assets 718.7 715.4 652.1 625.0 610.7
NPL 25.4 31.0 26.7 28.9 28.7
Provisions 29.5 33.6 27.6 32.4 25.5
NPL Ratio 3.5% 4.3% 4.1% 4.6% 4.7%
NPL Coverage Ratio 116.1% 108.4% 103.1% 112.1% 88.9%
NPL ratio stood at 3.5% in FY 2013. This is an improvement compared to 4.7% in Dec. 2012
Coverage Ratio improved to 116.1% in FY 2013 from 88.9% in FY 2012
Comments

24
Group Key Performance Metrics – FY 2013
FY 2013
9-M 2013
H1 2013
Q1 2013
FY 2012
Net Interest Margin (NIM) 8.1% 8.6% 8.8% 8.8% 9.9%
Cost of Risk 3.5% 3.4% 3.1% 2.1% 3.3%
Cost of Funds 3.4% 3.4% 3.5% 3.6% 2.9%
Loan-to-Deposit Ratio 59.6% 67.4% 64.0% 63.2% 67.1%
Capital Adequacy Ratio (CAR) 17.3% 17.1% 16.5% 16.3% 17.3%
Liquidity Ratio 41.8% 36.7% 48.2% 46.9% 42.3%
Cost to Income Ratio 60.3% 58.9% 59.1% 60.7% 60.6%
Earnings per share 197K 185k 175k 174k 153k
ROE 23.0% 22.4% 22.1% 22.5% 22.7%
The Group Net Interest Margin (NIM) decreased to 8.1% in FY 2013 from 8.6% in Q3 2013 due principally to impact of 50% CRR charge on public sector funds.
Comments

25
Group Balance Sheet Structure
1,178 1,273 1,334 1,377
1,519
910 989
1,032 1,062 1,206
585 593 625 682 689
Dec. 2012 Mar. 2013 Jun. 2013 Sep. 2013 Dec. 2013
Total Assets Deposits Loans & Advances
Balance Sheet Trend (N’Bn)
Total assets stood at N1.5 trillion as at FY 2013, up N339 billion or 29%,
from N1.2 trillion at the end of Dec 2012.
Growth in balance sheet driven by growth in deposits (N1.2 trillion as at
Dec. 2013, from N910 billion in Dec. 2012).
Net Risk Assets up by N104 billion or 18% to N689 billion (Dec. 2012: N585
billion).
Comments
1,519 358
689
294
97 59 22
Total assets LiquidAssets
Risk Assets Investments PledgedAssets
Fixed Assets OtherAssets
Total Assets (N’Bn) Dec. 2013 (Dec. 2012)
1,519 55 1,206
48 36 36 139
TotalLiabilities
Dep. FromBanks
Depositsfrom
Customers
Borrowings OtherLiabilities
Tier 2Capital
Equity
Total Liabilities (N’Bn) Dec. 2013 (Dec. 2012)
1,178 272
585
174
54 14
79
1,178 910
45 33 109
50
31

26
Group Funding Mix & Deposits Composition
2010 2011 2012 2013
73% 78% 76% 74%
27% 22% 24% 26%
Demand & Savings Deposits Time Deposits
Sustaining Stable Low-Cost Funding Base
18% 11% 9% 9%
70% 76% 77% 79%
2010 2011 2012 2013
Equity Tier 2 Capital Borrowings
Other Liabilities Deposits Dep. From Banks
Funding Structure
2012
49% 57% 59% 57%
24% 21% 17% 17%
27% 22% 24% 26%
2010 2011 2012 2013
Demand Savings Time
Deposit Mix by Type
34%
45%
22%
Corporate
Deposit Mix by Business Segment
31%
24%
43%
2%
Retail Business
2013

27
Group Loan Growth
Dec. 2012 Mar. 2013 Jun. 2013 Sep. 2013 Dec. 2013
611 625
652
715 719
Gross Loans Gross Risk Assets (N’Bn)
Dec. 2012 Mar. 2013 Jun. 2013 Sep.2013 Dec. 2013
29 29 27
31
25 26
32
28
34
29
Non Performing Loans Provisions
Non Performing Loans & Provisions (N’Bn)
Loans and advances (gross) went up by 18% to N719 billion year-on-year (Dec
2012: N611 billion).
The growth in loan portfolio is driven by our growing customer relationships
especially in the business and corporate banking segments.
Loan to deposit ratio stood at 60% as at 31St Dec 2013 from 67% in Dec 2012.
Comments Loan to Deposit Ratio
Dec. 2012 Mar. 2013 Jun. 2013 Sep. 2013 Dec. 2013
67.1%
63.2% 63.2%
67.4%
59.6%

28
26%
18%
8%
10% 9%
7%
4%
5%
3%
1%
2%
2%
1%
4%
Oil & Gas 26%
General Comm 18%
Manufacturing 8%
Others 10%
Real Est & Const 9%
Power & Energy 7%
Government 4%
ICT 5%
Consumer Credit 3%
Transportation 1%
Agriculture 2%
Mortgage 2%
Education 1%
Financial and insurance 4%
Gross Loan Breakdown – Dec 2013
(N611bn) N719bn N719bn
Group Lending
26%
18%
8%
10% 9%
7%
4%
5%
3%
1%
2%
2%
1%
4%
Oil & Gas (26%) 26%
General Comm (20%) 18%
Manufacturing (13%) 8%
Others (8%) 10%
Real Est & Const (7%) 9%
Power & Energy (6%) 7%
Government (6%) 4%
ICT (4%) 5%
Consumer Credit (3%) 3%
Transportation (3%) 1%
Agriculture (2%) 2%
Mortgage (2%) 2%
Education (0%) 1%
Financial and insurance (0%)4%
Gross Loan Breakdown – (Dec 2012) Dec 2013

29
Group NPL Analysis
Dec. 2012 Mar. 2013 Jun. 2013 Sep. 2013 Dec. 2013
23% 20% 21% 15% 33%
52% 52% 57% 73% 51%
25% 28% 22% 12% 16%
Substandard Doubtful Lost
NPL by Category
N28.9bn
General Commerce and Oil & Gas accounted for about 65% of total NPLs.
The Group has managed its credit risk more effectively through its
improved risk management practices as demonstrated by < 5% NPL ratio.
Comments
General Comm 34%
Oil & Gas 31%
Consumer Credit 9%
Others 4%
Agriculture 6%
Real Estate & Constr. 7%
Manufacturing 1%
Power 1%
Communication 4%
Mortgage 3%
NPL by Sector (Dec. 2009) NPL by Sector (Dec 2013)
General Commerce 34%
Oil & Gas 27%
Consumer Credit 12%
Communication 9%
Others 8%
Agriculture 4%
Real Estate & Constr. 3%
Manufacturing 3%
Power 0%
NPL by Sector (Dec 2012)
N28.7Bn
N25.4Bn
N26.7bn N28.7bn N31.0bn N25.4bn

30
Group Asset Quality
Dec. 2012 Mar. 2013 Jun. 2013 Sep. 2013 Dec. 2013
4.7% 4.6% 4.1% 4.3%
3.5%
NPL Ratio
Dec. 2012 Mar. 2013 Jun. 2013 Sep. 2013 Dec. 2013
88.9% 112.1% 103.1% 108.4% 116.1%
Coverage Ratio
Dec. 2012 Mar. 2013 Jun. 2013 Sep. 2013 Dec. 2013
3.3%
2.1%
3.1% 3.4% 3.5%
Cost of Risk
Cost of risk remained within 5% in Dec 2013.
Coverage ratio improved to 116.1% in Dec 2013 from 88.9% in Dec 2012.
NPL ratio of sub 5% achieved through out 2013.
Comments

31
Group Net Interest Margin
Dec. 2012 Mar. 2013 Jun. 2013 Sep. 2013 Dec. 2013
9.9%
8.8% 8.8% 8.6% 8.1%
Strong Net Interest Margin (NIM)
Dec. 2012 Mar. 2013 Jun. 2013 Sep. 2013 Dec. 2013
13.8% 13.4% 13.4% 12.0%
11.1%
Yield on Earning Assets
Dec. 2012 Mar. 2013 Jun. 2013 Sep. 2013 Dec. 2013
2.9% 3.6% 3.5% 3.4% 3.4%
Low Cost of Funds Comments
Reduction in NIM by 50 bps due to the impact of CRR on public sector
funds as additional funds were sterilized thereby constraining earnings.
Despite the impact of the new CRR policy, the bank will continue to
protect its margin by leveraging on its Retail Banking strategy to maintain
cost of funds below industry average.
Cost of funds remained stable in FY 2013.
32
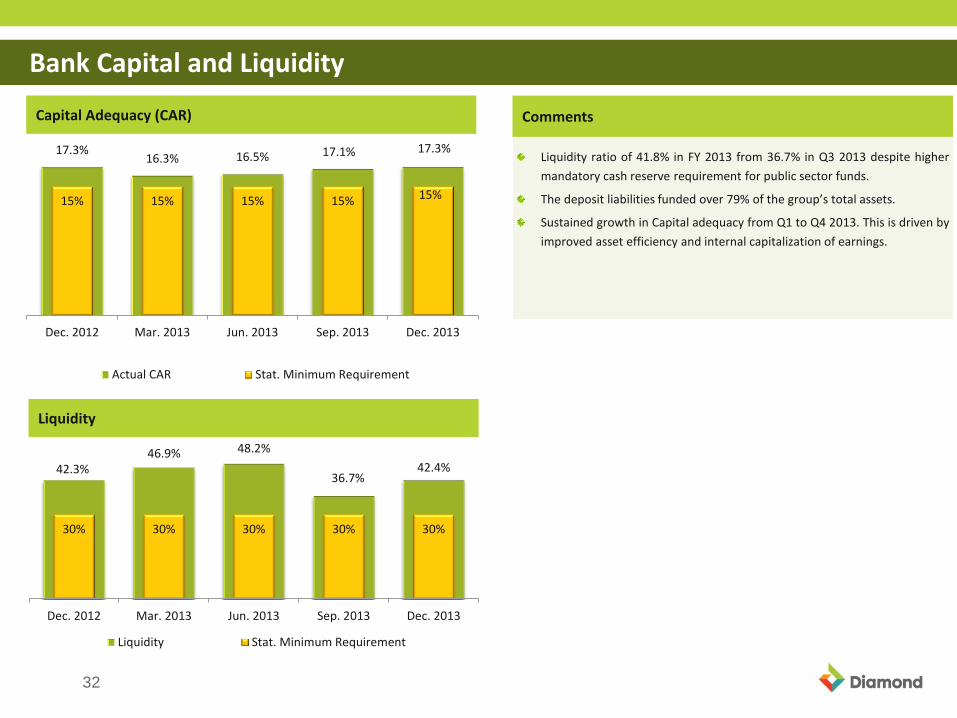
Bank Capital and Liquidity
42.3% 46.9% 48.2%
36.7% 42.4%
30% 30% 30% 30% 30%
Dec. 2012 Mar. 2013 Jun. 2013 Sep. 2013 Dec. 2013
Liquidity Stat. Minimum Requirement
Liquidity
Liquidity ratio of 41.8% in FY 2013 from 36.7% in Q3 2013 despite higher
mandatory cash reserve requirement for public sector funds.
The deposit liabilities funded over 79% of the group’s total assets.
Sustained growth in Capital adequacy from Q1 to Q4 2013. This is driven by
improved asset efficiency and internal capitalization of earnings.
Comments
17.3% 16.3% 16.5% 17.1% 17.3%
15% 15% 15% 15% 15%
Dec. 2012 Mar. 2013 Jun. 2013 Sep. 2013 Dec. 2013
Actual CAR Stat. Minimum Requirement
Capital Adequacy (CAR)

33
Outline
• Executive Summary (by Dr. Alex Otti, GMD)
• Strategy & Business Update (by Dr. Alex Otti, GMD)
• FY 2013 Financial Performance (by Abdulrahman Yinusa, CFO)
• Q1 2014 Financial Performance (by Abdulrahman Yinusa, CFO)
• Concluding Remarks (by Dr. Alex Otti, GMD)

34
Group Statement of Comprehensive Income (Q1 2014)
Gross earnings up 22% or N9 billion to N49 billion (YoY) on the back of 13% increase in interest income.
Net interest income up 12% YoY to N28 billion driven by increase in risk assets
Total operating income rose by 19% to N32 billion in Q1 2014 from N27 billion in Q1 2013 on the back of improved earnings.
Operating expense up 23% YoY to N23bn driven by branch expansion and increase in business activities.
PBT up 6% YoY to N9billion in Q1 2014.
Comments
Q1 2014 Actual
N' billion
Q1 2013 Actual
N' billion YoY % Δ
Gross Earnings 49.0 40.3 21.6
Interest Income 38.2 33.8 13.0
Interest Expense (10.8) (9.3) (16.1)
Net Interest Income 27.5 24.5 12.2
Impairment Charge (5.0) (3.2) (56.3)
Net interest income (after impairment charge) 22.5 21.3 5.6
Other Income (net) 9.9 6.0 65.0
Operating Income 32.4 27.3 18.7
Operating Expenses (23.2) (18.6) (24.7)
Profit Before Tax 9.2 8.7 5.7
Profit After Tax 8.4 6.3 33.3
Other comprehensive income (0.2) (0.3) 33.3
Total comprehensive income 8.2 6.0 36.7

35
3
5
Group Statement of Financial Position (Q1 2014)
Net loan book of N712 billion, up 4% from
December 2013 (N689 billion) primarily
reflecting growth in volume of business.
Deposit base up 2% to N1.233 trillion
from December 2013 (N1,206 trillion),
and up 25% from March 2013 (N989
billion).
Total assets up 4% to N1.6 trillion from
N1.5 trillion as at December 2013.
Effect of new CRR Policy led to increased
Cash & Balances sterilized at the CBN.
Comments
Q1 2014 Actual
N' billion
Q1 2013 Actual
N' billion
YoY % Δ
FY 2013 Actual
N' billion
QoQ % Δ
Cash & Balances with Central Banks 245.1 128.9 90.1 228.3 7.4
Loans & Advances to Banks 140.9 125.9 11.9 129.4 8.9
Loans & Advances to Customers 712.2 592.5 20.2 689.2 3.3
Investments 296.7 259.8 14.2 294.0 0.9
Pledged Assets 94.6 82.8 14.3 96.5 (2.0)
Other Assets 34.5 28.4 21.5 22.1 56.1
Fixed Assets & Intangibles 53.4 46.2 15.6 52.7 1.3
Deferred Tax Asset 6.7 9.2 (27.2) 6.7 0.0
Total Assets 1,584.1 1,273.7 24.4 1,518.9 4.3
Deposits from Banks 51.3 31.4 63.4 54.6 (6.0)
Deposits from Customers 1,233.2 989.0 24.7 1,206.0 2.3
Derivative Liability 14.7 13.2 11.4 14.7 0.0
Other Liabilities 69.8 55.8 25.1 36.3 92.3
Borrowings 47.0 49.8 (5.6) 47.5 (1.1)
Long Term debt 21.0 19.6 7.1 20.9 0.5
Equity 147.1 114.9 28.0 138.9 5.9
Total Equity & Liabilities 1,584.1 1,273.7 24.4 1,518.9 4.3

36
Group Risk Management Metrics – Q1 2014
Q1 2014 N’ billion
FY 2013 N’ billion
9-M 2013 N’ billion
H1 2013 N’ billion
Q1 2013 N’ billion
Gross Risk Assets 747.8 718.7 715.4 652.1 625.0
NPL 33.0 25.4 31.0 26.7 28.9
Provisions 34.3 29.5 33.6 27.6 32.4
NPL Ratio 4.4% 3.5% 4.3% 4.1% 4.6%
NPL Coverage Ratio 103.9% 116.1% 108.4% 103.1% 112.1%
NPL ratio stood at 4.4% in Q1 2014 against 3.5% recorded as at 31st December 2013.
Coverage Ratio of 103.9% in Q1 2014 from 116.1% in FY 2013.
Comments

37
Group Key Performance Metrics – Q1 2014
Q1 2014
FY 2013
9-M 2013
H1 2013
Q1 2013
Net Interest Margin (NIM) 7.4% 8.1% 8.6% 8.8% 8.8%
Cost of Risk 2.7% 3.5% 3.4% 3.1% 2.1%
Cost of Funds 3.3% 3.4% 3.4% 3.5% 3.6%
Loan-to-Deposit Ratio 60.6% 59.6% 67.4% 64.0% 63.2%
Capital Adequacy Ratio (CAR) 17.4% 17.3% 17.1% 16.5% 16.3%
Liquidity Ratio 37.3% 41.8% 36.7% 48.2% 46.9%
Cost to Income Ratio 62.0% 60.3% 58.9% 59.1% 60.7%
Earnings per share (annualized) 232K 197K 185k 175k 174k
ROE 23.6% 23.0% 22.4% 22.1% 22.5%
The Group Net Interest Margin (NIM) decreased to 7.4% in Q1 2014 from 8.1% in FY 2013 due to impact of 75% CRR charge on public sector funds.
Comments

38
Outline
• Executive Summary (by Dr. Alex Otti, GMD)
• Strategy & Business Update (by Dr. Alex Otti, GMD)
• FY 2013 Financial Performance (by Abdulrahman Yinusa, CFO)
• Q1 2014 Financial Performance (by Abdulrahman Yinusa, CFO)
• Concluding Remarks (by Dr. Alex Otti, GMD)

39
Concluding remarks
The tight monetary policy stance of the Central Bank is expected to continue in 2014. This should
restrain the earnings capability of Banks. However, we are determined to deliver on our profit
guidance in 2014.
The recent rebasing of Nigeria’s GDP has revealed more sectors with compelling growth dynamics
and opportunities. We will continue to leverage on our existing relationships to explore these
opportunities in 2014 and beyond.
The Group’s financial performance for FY 2013 and Q1 2014 is a reflection of our unfettered
commitment to growing shareholder value through technology driven banking solutions.
We will sustain our retail banking leadership as we continue to offer unparalleled customer
experience through safe and convenient delivery channels.
We remain on course towards deploying additional capital from the debt/equity market to
support our rapidly expanding businesses. In this regard, we are currently assessing the pulse of
the international debt market as well as the local equity market or possible raising of
debt/equity capital at the appropriate time.

40
Thank You