Investment Trusts: Back in Voguemedia.morningstar.com/uk/AWS/Website/IT_Back_In_Vogue.pdf ·...
40
<#> © 2010 Morningstar, Inc. All rights reserved. Investment Trusts: Back in Vogue × Jackie Beard, Director of Investment Trust Research, UK
-
Upload
truongnguyet -
Category
Documents
-
view
222 -
download
7
Transcript of Investment Trusts: Back in Voguemedia.morningstar.com/uk/AWS/Website/IT_Back_In_Vogue.pdf ·...

<#>
© 2010 Morningstar, Inc. All rights reserved.
Investment Trusts: Back in Vogue
× Jackie Beard, Director of Investment Trust Research, UK

2
Agenda
× Qualitative Research
× Key Advantages
× Performance Comparison
× Case Study

3
× 220 researchers worldwide
× Quantitative methodologies team (PhDs, CFAs, MBAs)
× 120+ equity analysts, 2,000 stocks worldwide
× 70+ fund analysts; 3,000 funds worldwide
× US: 25 fund analysts; 2,000 funds
× Australia: 7 analysts; 250 strategies
× Canada: 7 analysts; 400 funds
× Europe & Asia: 38 researchers;
current coverage of >1,000 funds
× ETF & Closed-End Team: 12 analysts
Research Staff at Morningstar: Global and Local

4
Investment Trust Qualitative Research – Why now?
× Fully independent research
× Depth of analytical resources and tools
× Leading provider of closed-end fund data - Morningstar Traded Funds
×Mission – create great products that help investors reach their goals
× Investors come first

5
Back in Vogue…
× “Investment trusts are the granddaddy of the fund world.” David Budworth, The Times Online, 4 Jan. 2010
× “…The companies are giving shareholders a choice because the more vehicles competing, the better and cheaper they will be…This is a structure which still has its attractions.” Ian Sayers, Director General AIC, Investment Week, 15 Mar 2010
× “Reform will create new opportunities for investment trusts to meet changing consumer needs.” Daniel Godfrey, former Director General AIC) Investment Week, 10 Nov 2008
× "This [financial markets] upheaval has obscured a rapid transformation of the closed-end sector. It has benefitted from a general move away from closet tracking where risk was assessed by reference to volatility compared to, and deviation from, a given benchmark.“ Nick Greenwood, CIO, iimia, iimia Investment Trust results 29 Jul 2010

6
Investment Trusts
Unit TrustsListed Equities
What is an Investment Trust?
7
Key advantages
× Closed to new capital after initial public offering
× Listed on a stock exchange – can be traded intraday
× Fixed number of shares, so price determined by supply and demand
× Board of Directors
× External management contract (usually but not always)
× Ability to use leverage (gearing)
× Discounts
× Structure well suited to illiquid asset classes
× Cost benefits
8
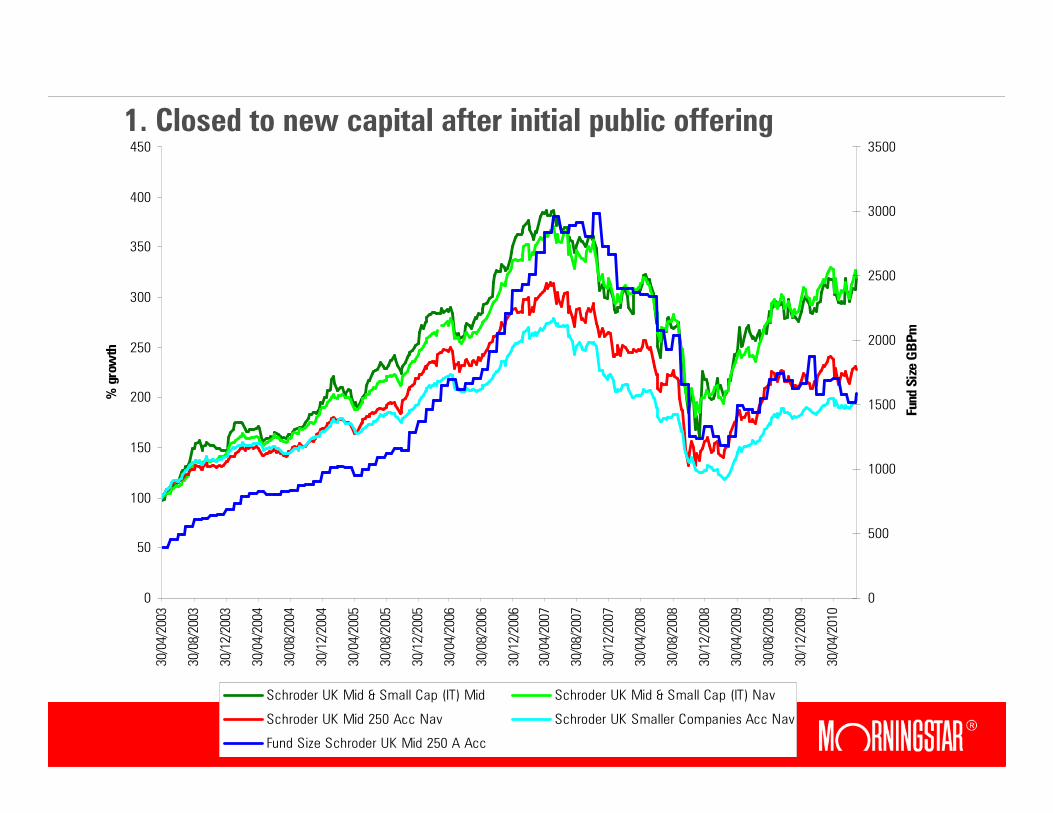
1. Closed to new capital after initial public offering
0
50
100
150
200
250
300
350
400
45030/04/2003
30/08/2003
30/12/2003
30/04/2004
30/08/2004
30/12/2004
30/04/2005
30/08/2005
30/12/2005
30/04/2006
30/08/2006
30/12/2006
30/04/2007
30/08/2007
30/12/2007
30/04/2008
30/08/2008
30/12/2008
30/04/2009
30/08/2009
30/12/2009
30/04/2010
% growth
0
500
1000
1500
2000
2500
3000
3500
Fund Size GBPm
Schroder UK Mid & Small Cap (IT) Mid Schroder UK Mid & Small Cap (IT) Nav
Schroder UK Mid 250 Acc Nav Schroder UK Smaller Companies Acc Nav
Fund Size Schroder UK Mid 250 A Acc

9
2. Can be traded intraday29 Sep 2008 – US Congress rejects $700bn bank bailout plan
Source: CNN
10
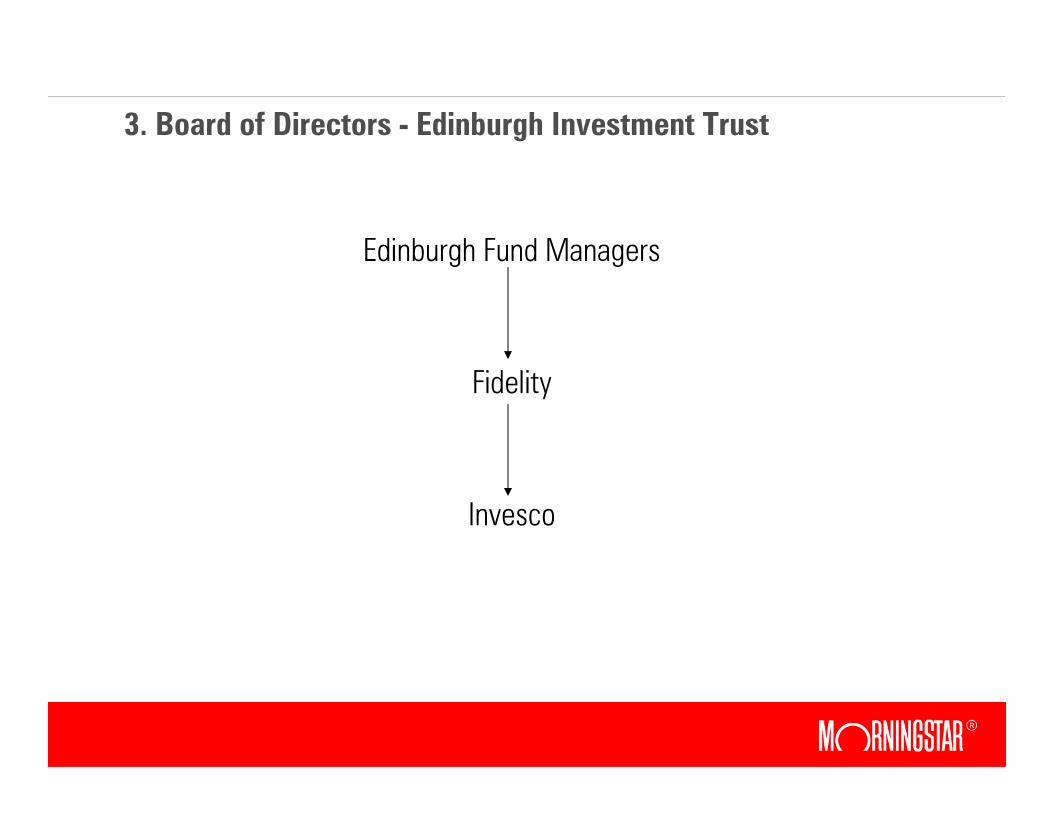
3. Board of Directors - Edinburgh Investment Trust
Edinburgh Fund Managers
Fidelity
Invesco

11
4. Gearing - Levels across IT sectors
90
95
100
105
110
115
120
125
130
Asia ex Japan Europe GEM Global Growth Global G&I Japan UK Growth
Gross Net Highest
Source: Morningstar

12
5. DiscountsLondon-listed average weighted discount vs FTSE AllShare
Source: Morningstar
80
100
120
140
160
180
200
220
240
260
280
Jan-96
Jul-96
Jan-97
Jul-97
Jan-98
Jul-98
Jan-99
Jul-99
Jan-00
Jul-00
Jan-01
Jul-01
Jan-02
Jul-02
Jan-03
Jul-03
Jan-04
Jul-04
Jan-05
Jul-05
Jan-06
Jul-06
Jan-07
Jul-07
Jan-08
Jul-08
Jan-09
Jul-09
Jan-10
FTSE All Share Performance (%)
-23
-18
-13
-8
-3
Discount (%)
Total Return % Discount
13
5. Discounts - Possible cause of discounts
× Illiquidity of underlying assets
× Discounting future management fees
× Poor past performance
× Lack of board action to keep discount narrow
×Market sentiment towards investment type/sector

14
5. Discounts - Better Performance, Narrower Discounts?
Alliance Trust
RIT Capital Partners
F&C Investment Trust
Scottish Mortgage
Caledonia Investments
Witan
Monks British Empire Securities
Scottish Investment Trust
Bankers
30
35
40
45
50
55
60
65
70
-20 -15 -10 -5 0 5
Discount (%)
NAV Performance 5y

15
5. Discounts - Discount control mechanisms
× Fixed wind-up dates
× Fixed wind-up resolution dates
× Discount targets (if breached over specific period, may trigger a continuation vote or tender offer)
× Share buybacks
× Presence of arbitrageurs provides incentive to prevent discount from drifting too wide

16
0
20,000
40,000
60,000
80,000
100,000
120,000
140,000
160,000
2000 2001 2002 2003 2004 2005 2006 2007 2008 2009
Equity Property Private Equity Hedge Funds Other Alternative VCTs Fixed Income
Source: Morningstar
6. Suited to illiquid asset classesGrowth of Assets by Sector (London-listed inv. companies)

17
7. Cost Benefits - Lower Costs, Greater Transparency
Total Expense Ratio: 2009 Fiscal Year
0.0
0.2
0.4
0.6
0.8
1.0
1.2
1.4
1.6
1.8
British Empire Securities F&C Investment Trust JPMorgan Emerging Markets Alliance Trust
ManFee PerfFee Interest Other Costs Tax
Source: Morningstar
18
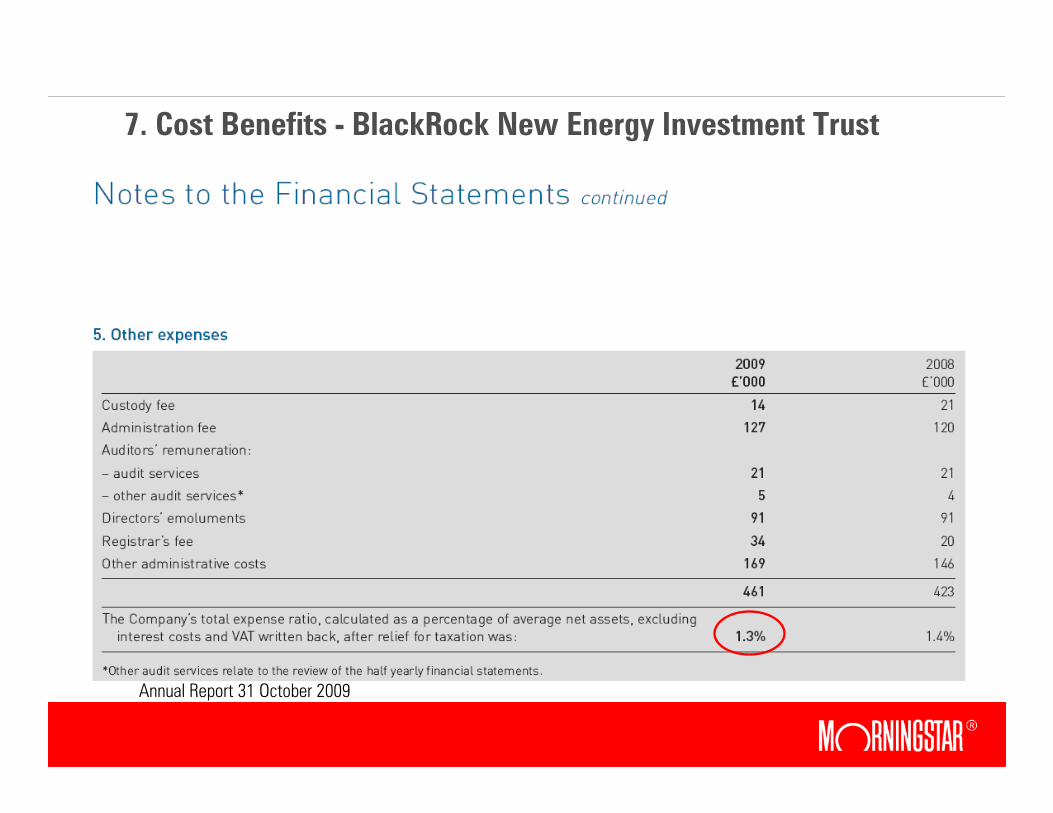
7. Cost Benefits - BlackRock New Energy Investment Trust
Annual Report 31 October 2009

19
Annual Report 31 October 2009
7. Cost Benefits - BlackRock New Energy Investment Trust

20
Simplified Prospectus 31 March 2010
7. Cost Benefits - BGF New Energy (SICAV)

21
Investment Trusts vs OEICsReturns to 31-Aug-10
Source: Morningstar
39.6
5.94
47.96
42.89
15.81
1.84
24.51
18.67
0
10
20
30
40
50
60
1 year 3 years 5 years 10 years
AIC IMA

22
Investment Trusts vs OEICsAnnual % compound outperformance 10 yrs to 31-Aug-10
Source: Morningstar
-5
-4
-3
-2
-1
0
1
2
3
4
Global
Growth
Emerging
Markets
UK Growth North
America
Asia Pac ex
Japan
Asia Pac inc
Japan
Europe Japan

23
Global Emerging – JPMorgan Emerging Markets
Source: Morningstar

24
Global Emerging – JPMorgan Emerging Markets
Source: Morningstar
-50
-25
0
25
50
75
100
2000 2001 2002 2003 2004 2005 2006 2007 2008 2009
JPMorgan Emerging Markets A Acc JPMorgan Emerging Markets Ord Mid JPMorgan Emerging Markets Ord NAV
25
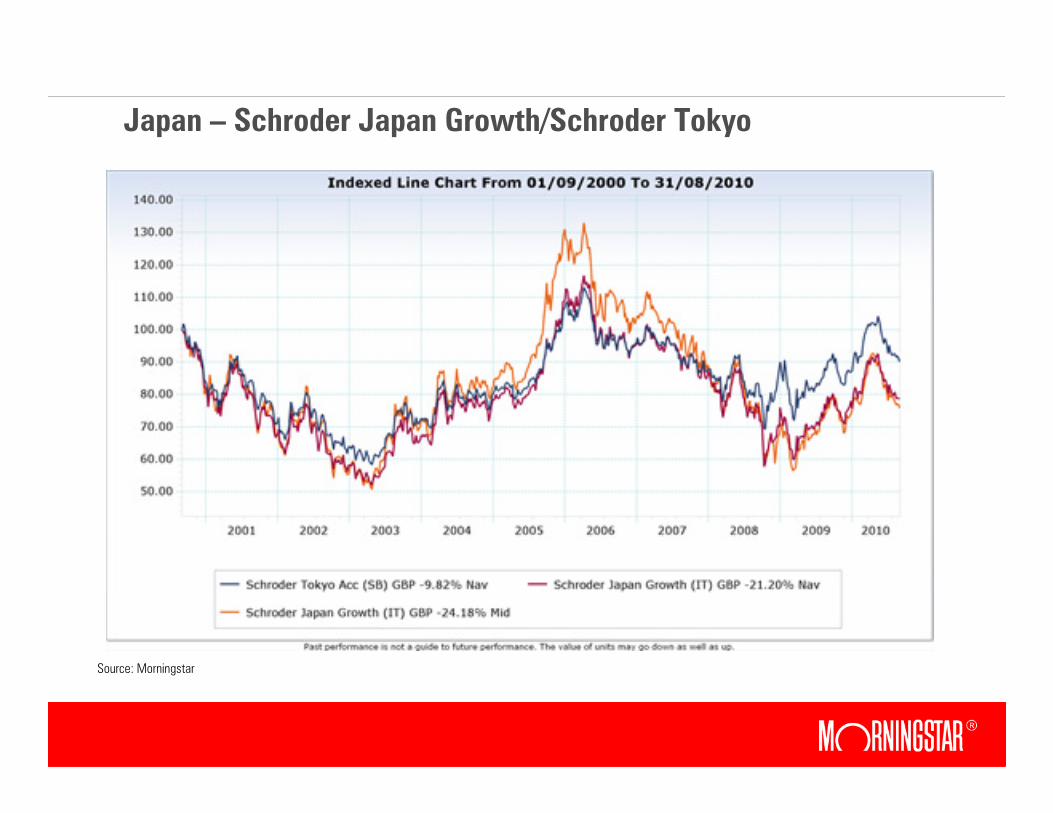
Japan – Schroder Japan Growth/Schroder Tokyo
Source: Morningstar
26
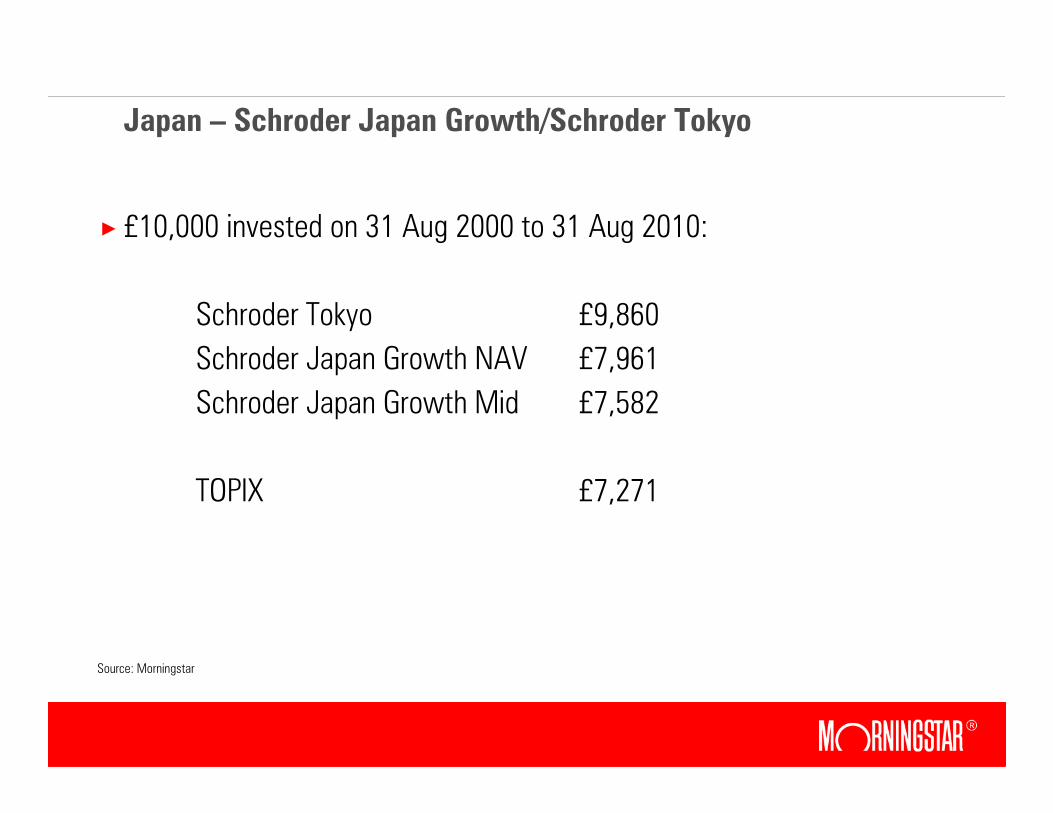
Japan – Schroder Japan Growth/Schroder Tokyo
× £10,000 invested on 31 Aug 2000 to 31 Aug 2010:
Schroder Tokyo £9,860
Schroder Japan Growth NAV £7,961
Schroder Japan Growth Mid £7,582
TOPIX £7,271
Source: Morningstar

27
Some of the new funds launched in 2010
× Aberdeen Latin American Income (£57.2m)
× Fidelity China Special Situations (£460m)
× JP Morgan Brazil (£46.7m)
× JP Morgan Glbl Emerging Markets Income (£104m)
× Polar Capital Glbl Healthcare Growth & Income (£89m)
× YTD inflow through launches (to 30 Sep 10) +£1.88bn

28
Case Study
× Aberdeen Latin American Income (£57.2m)
× Fidelity China Special Situations (£460m)
× JP Morgan Brazil (£46.7m)
× JP Morgan Glbl Emerging Markets Income (£104m)
× Polar Capital Glbl Healthcare Growth & Income (£89m)

29
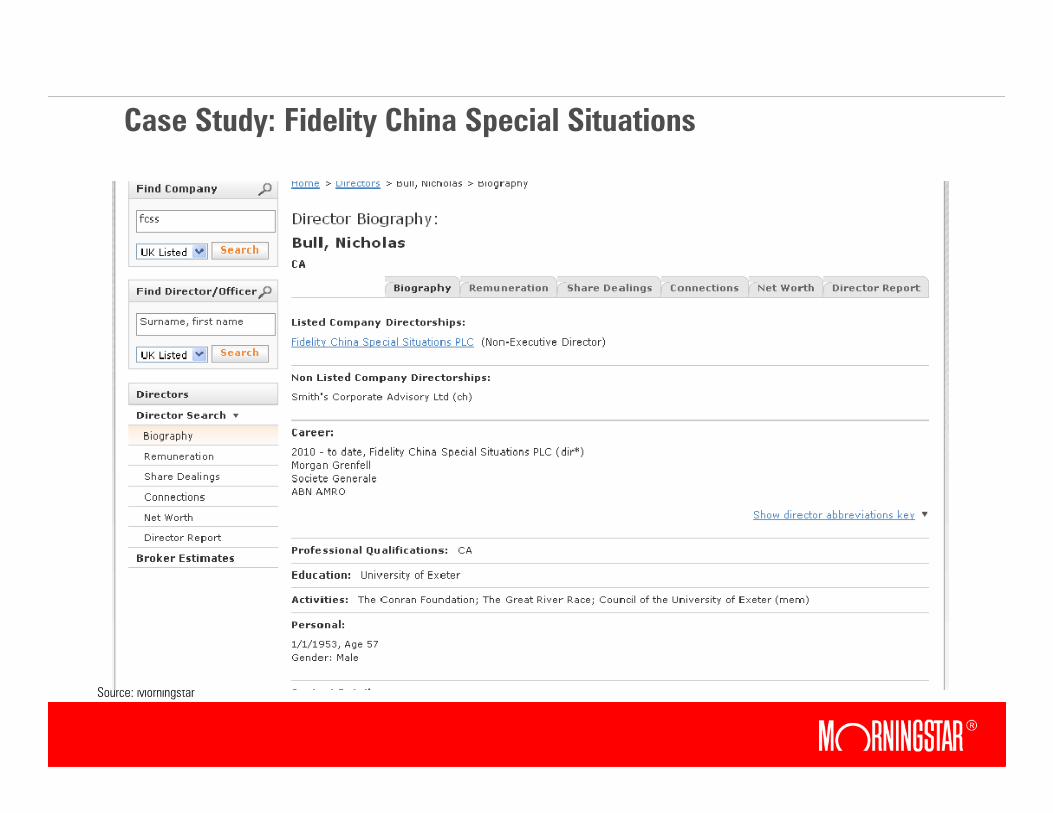
Case Study: Fidelity China Special Situations
× People
× Asian team of 22 PMs and 31 analysts
× Based in HK, Seoul, Singapore, Mumbai, Sydney
×Martha Wang – FF China Focus – Superior rated
× Experienced investor generally who is familiar with management of closed-end vehicles
× Invested £2.5m at launch, aligning his interests with his investors’
× But…
× Only committed to 2 years
× Limited prior experience of investing in China

30
Case Study: Fidelity China Special Situations
× Parent – Part 1 - FIL
× Fund line-up spans all asset classes, geographies – aiming to be all things to all investors – but means well-resourced
× Promotes through ranks – can lead to higher than average manager turnover as they change focus
× Funds could be cheaper, given scale of AUM (approx £140 bn)
× Paid 0.5% trail to IFAs who promoted fund, despite being closed-end
× If no adviser involved, Fidelity keeps the 0.5% trail – firm putting its own and advisers’ interests above those of investors

31
Case Study: Fidelity China Special Situations
× Parent – Part 2 – Board of Directors of Trust
× 5 non-execs
× 1 is director of another trust
× 1 is director of FIL
× 4 own shares in the trust
32
Case Study: Fidelity China Special Situations
Source: Morningstar
33
× Process
×What do we know from Fidelity Special Sits?
× Contrarian with value bias
× Searches down market-cap scale
× Uses analysts extensively
× Tail in portfolio but capacity limit of $1bn
× Driven by bottom-up fundamentals but macro aware
×Will it work in China where many individuals trade daily?
Case Study: Fidelity China Special Situations

34
× Price
× Under the Management Agreement the Investment Manager has agreedto provide investment management services for an annual fee equal to 1.5% of the NAV.
× In addition, the Investment Manager is entitled to an annual Performance Fee of 15% of any change in NAV attributable to performance which is more than 2% above the returns on the MSCI China Index subject to a maximum Performance Fee payable in any year equal to 1.5% of the arithmetic mean of the value of assets with valuation calculated at the end of each month during the year.
× Any outperformance above this cap will be carried forward.
× If the Company underperforms, such underperformance must be madegood before any further Performance Fee becomes payable.
Source: FCSS Prospectus
Case Study: Fidelity China Special Situations

35
× Corporate Structure
× Discount control mechanism
×Wind-up policy
× Borrowing restrictions
× Debt
Case Study: Fidelity China Special Situations
36
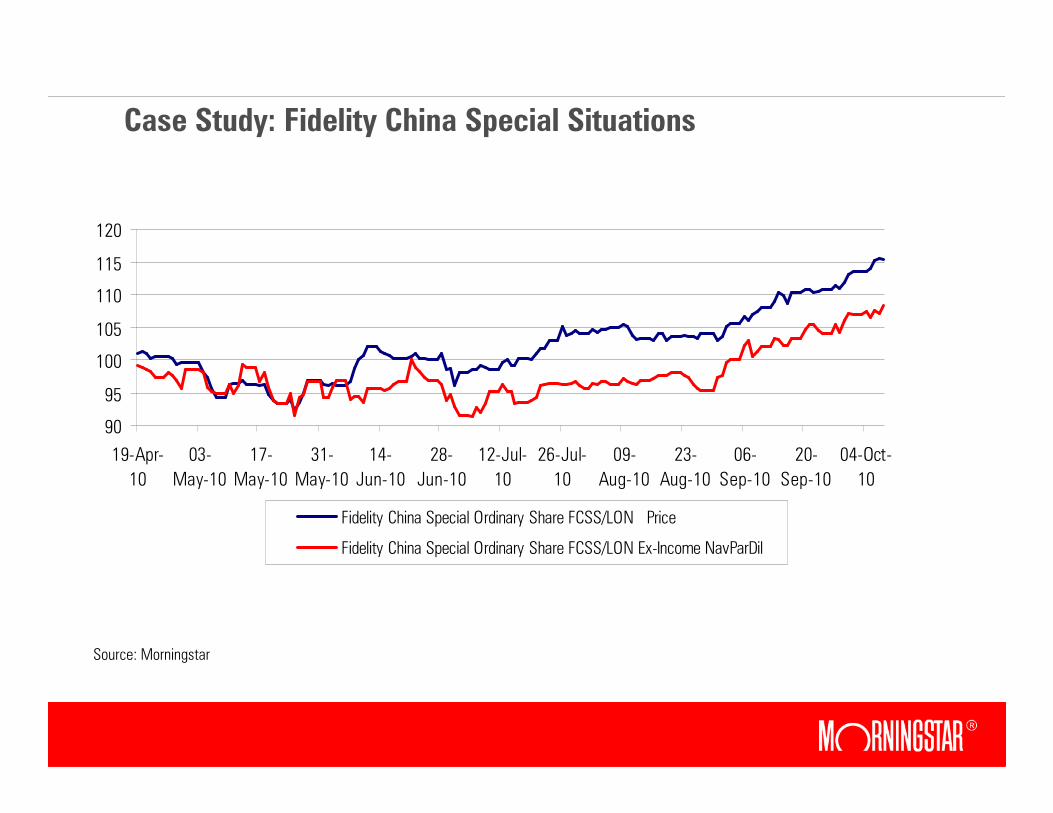
Case Study: Fidelity China Special Situations
Source: Morningstar
90
95
100
105
110
115
120
19-Apr-
10
03-
May-10
17-
May-10
31-
May-10
14-
Jun-10
28-
Jun-10
12-Jul-
10
26-Jul-
10
09-
Aug-10
23-
Aug-10
06-
Sep-10
20-
Sep-10
04-Oct-
10
Fidelity China Special Ordinary Share FCSS/LON Price
Fidelity China Special Ordinary Share FCSS/LON Ex-Income NavParDil

37
Case Study: Fidelity China Special Sits v JPM China
Source: Morningstar
-15
-10
-5
0
5
10
19-Apr-
10
03-
May-10
17-
May-10
31-
May-10
14-
Jun-10
28-
Jun-10
12-Jul-
10
26-Jul-
10
09-
Aug-10
23-
Aug-10
06-
Sep-10
20-
Sep-10
04-Oct-
10
FCSS JMC

38
× Specialist asset class or sector
× Alternative source of income generation
× Broad diversification as ISA investment
Potential Roles in Portfolio

39
× Key attributes
× Cost benefits
× Greater transparency for investors
× Understand both fund and company structure
× Know where risks lie
Summary

40