INVESTMENT, REPROCUREMENT AND FRANCHISE CONTRACT LENGTH … · INVESTMENT, REPROCUREMENT AND...
33
INVESTMENT, REPROCUREMENT AND FRANCHISE CONTRACT LENGTH IN THE BRITISH RAILWAY INDUSTRY* Luisa Affuso a and David Newbery Department of Applied Economics, University of Cambridge This Draft: May 2001 Abstract This paper studies the interaction between repeated auctions of rail franchises of different lengths, uncertainty, and incentives for investment in rolling stock, following the privatisation of British Rail. Theoretical predictions are tested empirically using a unique panel of data. Theory suggests that short franchise lengths reduce incentives to invest in specific assets. Our empirical results suggest that competition and strategic behaviour at the re-procurement stage can create incentives for delayed investment. Investing just before the end of the franchise enhances the incumbent’s probability of having the contract re-awarded and provides it with a first-mover advantage, while raising the entry cost for other potential bidders. JEL Classification: L22, L92, D23, C23 Keywords: Railways, Investment, Contracts, Panel Data * We are very grateful to Manuel Arellano, Richard Green, Jonathan Köhler, Chris Nash, Volker Nocke, Richard Price, Roger Price, Mike Waterson, Helen Weeds, Melvyn Weeks and the participants to the CEPR meeting of December 2000 for very helpful comments and suggestions. Many thanks to Chris Bowdler and Philip Gaudoin for their valuable research assistance, and to the ESRC for sponsoring this research, Grant No. R000237928. The usual disclaimer applies. a Corresponding author: Department of Applied Economics, University of Cambridge, Sidgwick Avenue, Cambridge CB3 9DD, United Kingdom. E-mail: [email protected].
Transcript of INVESTMENT, REPROCUREMENT AND FRANCHISE CONTRACT LENGTH … · INVESTMENT, REPROCUREMENT AND...

INVESTMENT, REPROCUREMENT AND FRANCHISE CONTRACT LENGTH INTHE BRITISH RAILWAY INDUSTRY*
Luisa Affuso a and David NewberyDepartment of Applied Economics,
University of Cambridge
This Draft: May 2001
AbstractThis paper studies the interaction between repeated auctions of rail franchises of different lengths,uncertainty, and incentives for investment in rolling stock, following the privatisation of British Rail.Theoretical predictions are tested empirically using a unique panel of data. Theory suggests that shortfranchise lengths reduce incentives to invest in specific assets. Our empirical results suggest thatcompetition and strategic behaviour at the re-procurement stage can create incentives for delayedinvestment. Investing just before the end of the franchise enhances the incumbent’s probability ofhaving the contract re-awarded and provides it with a first-mover advantage, while raising the entrycost for other potential bidders.
JEL Classification: L22, L92, D23, C23Keywords: Railways, Investment, Contracts, Panel Data
* We are very grateful to Manuel Arellano, Richard Green, Jonathan Köhler, Chris Nash, Volker Nocke, RichardPrice, Roger Price, Mike Waterson, Helen Weeds, Melvyn Weeks and the participants to the CEPR meeting ofDecember 2000 for very helpful comments and suggestions. Many thanks to Chris Bowdler and Philip Gaudoinfor their valuable research assistance, and to the ESRC for sponsoring this research, Grant No. R000237928. Theusual disclaimer applies.
a Corresponding author: Department of Applied Economics, University of Cambridge, Sidgwick Avenue,Cambridge CB3 9DD, United Kingdom. E-mail: [email protected].

2
1. Introduction
The 1993 Rail Act resulted in a dramatic restructuring and subsequent privatisation of British
Rail (BR). The single vertically integrated railway company was unbundled in 1994 into over 70
suppliers of different services, overlaid with a web of contractual relations and subject to two
regulators – the Office of the Rail Regulator (ORR), and a governmental body, the Office of
Passenger Rail Franchising (OPRAF), recently reformed as the Strategic Rail Authority
(SRA).1 The hope was that a more commercial structure operating under competitive pressures
would better deliver the services that customers required and would drive down costs to achieve
better value for public money. The obvious concern was that breaking up a vertically integrated
industry would lose the economies of co-ordination essential for the seamless delivery of nation-
wide services and investment in rail and rolling stock.
The background to the dramatic restructuring of BR was one of static or declining
traffic, a dramatic and inexorable decrease in rail's share of total passenger and freight
kilometres (documented in Figure 1), extensive line closures in the 1960s, and a history of
under-investment but steady fiscal drain on the exchequer. Whether the government genuinely
believed that a commercial railway could attract adequate private finance and relieve the fiscal
burden, or merely wanted to transfer responsibility for managing the continued withdrawal from
the British transport scene is unclear. Certainly, the idea of putting train services out to
competitive tender to see who could deliver the services required for the least subsidy appeared
attractive to the Treasury. The resulting decrease in the subsidy required over the first franchise
period suggested that at last a method had been found to contain public expenditure on the
railways.
The early experience of privatisation gave mixed messages. Both passenger and freight
demand increased rapidly after 1995 (see Figure 1), reversing decades-long declines. Proponents
argued that this demonstrated the greater customer focus of the new Train Operating Companies
(TOCs), while sceptics pointed to the buoyant economy and the failure to invest in adequate
road infrastructure as more plausible causes. Against this optimistic background, the collapse in
rolling stock investment revealed by Figure 2 suggested that fears about the loss of co-
ordination between the different parts of the railway system were well founded. The pause,
followed by a considerable expansion in infrastructure investment, highlighted the contrast
between the regulated Railtrack, with its obligation to deliver services combined with
guaranteed funds to finance this, compared with the commercial orientation of the TOCs and the
1 Shadow until legislation is passed.

3
Rolling Stock Companies (ROSCOs), who based their investment decisions on commercial
perceptions.
Figure 1 Rail demand
* share of road+railTransport Statistics Great Britain
Bill. Pkm or Tkm rail % of road+rail
1952 1957 1962 1967 1972 1977 1982 1987 1992 19970
10
20
30
40
50
0
10
20
30
40
50
passenger freight pass % freight %
£ m
illio
n at
199
6/7
pric
es
1985 1986 1987 1988 1989 1990 1991 1992 1993 1994 1995 1996 19970
500
1000
1500
2000
Figure 2 Rai l Investment 1985-97at 1996/7 prices
Roll ing stock infrastructure total
Transport Stat ist ics GB

4
The question that we seek to answer in this paper is whether the collapse in rolling stock
investment can be attributed to vertically separating the industry, and therefore to the
transactions costs deriving from having to set in place contracts that overcome the specific
idiosyncrasies of the different parts of this industry and/or whether it reflects the uncertainties
created by the transition from one structure to another and difficulties in predicting demand.2
One of the major benefits of privatising other network utilities has been the considerable
increase in capital productivity and reduction in the investment cost per unit of capacity
provided. If the collapse in investment is short-lived and soon reversed, and if the benefits of
improved procurement lower the cost of investment, then the restructuring may have been
worthwhile. Here the evidence is encouraging. New competition from foreign companies has
resulted in price reductions of up to 30% compared to the last stock ordered by BR (NAO, 1998,
p.68). Similarly, if the restructuring leads to a more commercial approach to investment with a
reduction in socially unprofitable investment, then again there will be benefits from
restructuring. But if vertical separation creates avoidable risks and transaction costs that
undermine investment incentives, the aim of improving Britain's transport infrastructure will
have been jeopardised.
There are good theoretical reasons for concern. Railway assets are durable and highly
specific. Not only is British rolling stock significantly different from that of other countries,
even within Britain there are important incompatibilities. Track and trains exhibit a high degree
of technical complementarity. Electric trains require electrified track, and even here there are
different types: overhead power and the third-rail systems that are used in different parts of
the country. According to a National Audit Office report (NAO, 1998), only 8% of electric
vehicles could run on both power sources in 1994. Some trains are restricted to certain routes
because of their weight and weight distribution (i.e. route availability) and dimensions (i.e.,
loading gauge). There are also interdependencies between track capacity and train service
improvements. Increases in train speeds resulting from investment in new rolling stock may
require associated infrastructure investment (e.g., tilting trains).
Rolling stock is also very durable, with an asset life of 30 years or more. This contrasts
with the length of the franchises for the TOCs that were mainly for seven years. It was soon
realised that introducing competition on the tracks, that is between different TOCs offering
services between the same origins and destinations, raised a variety of intractable problems, not
2 The level of rolling stock investment needed just for replacement on a long-term basis has been estimated byORR (1998, 5.3) as £250 million per year, so the collapse in investment is substantial even if there were no needto invest to accommodate growing demand.

5
least over the setting of efficient and fair access prices and handling timetabling. Instead,
competition for the tracks was the preferred solution, with competitive bidding for TOC
franchises. As a result, TOCs have a franchise monopoly for a large fraction of the area they
serve. If these companies are not to mature into sleepy monopolies, the franchises must be
periodically re-tendered. The chosen franchise length of seven years reflects a balance between
the need for periodic contestability and the requirement to make adequate investments in
company-specific assets.
Nevertheless, seven years is a small fraction of the life of typical rolling stock assets.
TOCs therefore face the risk of hold-up problems3. If they buy rolling stock at the start of their
franchise, they need to predict its realisable value at the end of the franchise. Subsequent
franchise bidders may offer a very low price confident that the asset cannot be used elsewhere
and hence have low residual value. Faced with the risk that its investment will be stranded and
will need to be written down rapidly over the life of the franchise, the TOCs may limit their
investments to the most profitable that can be assured of recovering their cost over the franchise,
leading to under-investment.
This problem was recognised and addressed by creating the rolling stock companies
(ROSCOs). These companies invest in and own the rolling stock, which they lease to the TOCs.
If they have made wise investment decisions, then the rolling stock they offer will be best suited
and most economic for the franchises, and each potential bidder will be equally placed to
acquire appropriate rolling stock and meet the conditions of the franchise at the successive
tendering rounds. The ROSCOs only need to predict the market demand in each area, not the
particular whims of transient TOCs.
Does this adequately solve the problem? Whereas there are 25 TOCs, there were only
three ROSCOs at privatisation. This would seem to give the ROSCOs some market power,
which they might chose to exercise by restricting the supply of suitable rolling stock, i.e. under-
investing. Of course, TOCs can contract directly for new rolling stock, but they run the risk of
asset hold-up at the end of their franchise, and so the market for rolling stock is not sufficiently
contestable. The ROSCOs also face considerable uncertainty about the demand for new rolling
3 ‘Hold-ups are common when one or both trading partners make relationship-specific investments, that is,investments that enhance the value of trade but that are of substantially less value outside the relationship. […]The parties cannot sign “complete” contracts which specify efficient trade for each state of the world. Yet,investments must be sunk before the state uncertainty is resolved,’ [Edlin and Reichelstein (1996), p.478],therefore the party that has sunk the invesment can become a victim of opportunistic behaviour from the otherparty. For further discussion of hold-up see Klein et al. (1978) and Hart (1995), p.27 footnote 17 and referencestherein. An interesting study on contract design, specific investments and opportunism in the US freight railwayindustry is Pittman (1991).

6
stock, as they have to decide whether the recent growth in demand represents a change in a
long-term static trend.
Finally, the ROSCOs are operating at some distance from the final market. They need to
co-ordinate their proposed investments with Railtrack to make sure that complementary
investments are undertaken. New high-speed trains or tilting trains require substantial
investment in rail and signalling technology to be feasible. The ROSCOs have to be in close
touch with the TOCs who in turn are more knowledgeable about consumer demand and the kind
of innovative services that they plan to introduce. They must weigh the risk that one TOC’s
bright idea to attract custom may be commercially catastrophic, and the equipment may then
prove unattractive to subsequent bidders. In short, the continuing existence of ROSCOs does
not completely avoid the problem of asset specificity and hold-up, and introduces an additional
link in the flow of information needed to select the appropriate investment.
We would therefore like to see whether the evidence on investment behaviour across the
different TOCs and ROSCOs provides any support for concerns that the vertical unbundling has
prejudiced investment. The two main explanations for the apparent collapse in rolling stock
investment are, on the one hand that asset-specificity and the short franchise length resulting
from the unbundling has prejudiced investment; and on the other hand that the uncertainty about
future traffic demand and the disruption created by the transition have temporarily reduced
investment, which will recover to normal levels once these problems have been resolved.
The issue is of great topical importance, for dissatisfaction with the performance of the
rail industry has resulted in a whole series of initiatives designed to address the perceived
problems. The Strategic Rail Authority has been set up in shadow form, awaiting legislative
confirmation. The Government's Transport 2010: The 10 Year Plan suggests that public support
for rail investment will be dramatically increased, and will run at three times the level of
strategic road investment (that carries 67% of road freight, and hence far more than the entire
rail system). If their diagnosis is incorrect, large sums of public money and new possibly
inflexible contracts will have been committed prematurely.
2. The new railway structure
The 1993 Railway Act created a completely new structure in which the industry is divided
into separate companies: train owners, train operators, a track owner and many providers of
supporting services. Train Operating Companies (TOCs) operate the passenger services over
specific franchised routes. The TOCs lease trains from Rolling Stock Companies (ROSCOs),

7
and pay for access to the track network provided by the monopoly operator Railtrack, from
whom they also lease (some) railway stations. Our concern is investment in rolling stock,
though this will be affected by the vertical structure of the industry, and involves both
ROSCOs and TOCs directly.
2.1 The Rolling Stock Companies
The ROSCOs play a central role in the new railway structure, and already there is some
evidence that their performance falls short of the initial expectations of the Government. The
sale of the three rolling stock leasing companies – Angel Train Contracts Limited (Angel),
Eversholt Leasing Limited (Eversholt) and Porterbrook Leasing Company Limited
(Porterbrook) – was completed by the Department of Transport in February 1996. All three
ROSCOs have subsequently changed ownership, revealing a market valuation of their assets
50% higher (on average) than the value at which the Government sold them.4 One explanation
for such high returns and the high willingness to pay by new investors is that the investors
expected to enjoy monopoly profits. The report of the National Audit Office (NAO, 1998) on
the privatisation of the ROSCOs reveals that one ROSCO expected that competition would not
develop and that the TOCs would continue to lease most of their rolling stock, given that the
alternative of outright purchase would be more expensive. Financiers of new rolling stock
(potential entrants into the leasing market) would charge more because they provide funds on
the basis of a long-term assessment of the riskiness of the market (NAO, 1998, p.61) whereas
the TOC contracts for ROSCOs’ services were mostly comparatively short term.
The Government hoped that the provision of rolling stock would become competitive,
but active competition in the rolling stock leasing market has not materialised. Instead, the
ROSCOs enjoy a strong oligopolistic position. They faced little threat entry5 and competition
among the incumbent ROSCOs was hindered because of a twin problem of asset specificity and
short-termism.6
4 Porterbrook was sold to Stagecoach Holding in August 1996 at a price 56% higher than the original. This wasrecently divested by Stagecoach. In February 1997 the Forward Trust Group, part of HSBC Holdings plc, boughtEversholt at a price 40% higher. Finally, after an intermediate transaction, Angel was sold to the Royal Bank ofScotland Group in December 1997, for a price 58% higher than the original one.5 GL Railease is the only new entrant due a specific order placed by Virgin Rail (OPRAF, 1999).6 One representative example of asset specificity and short-termism is that faced by GNER (Great North EasternRailway). Despite an intensive search they were unable to find any surplus high speed powered vehicles. At thesame time two ROSCOs found limited demand for their surplus assets, especially for older refurbished ones(NAO, 1998, pp.64-65). Furthermore, GNER was unable to order new rolling stock because the new high speedtrains they needed could not easily be used elsewhere on the network, and they could not enter the necessarycontracts with ROSCOs because their franchise was only seven years (ibid., p.68).

8
Due to the differences in the specifications of vehicles, tracks and signalling systems, a
competitive market seems unlikely to develop. Indeed, the ROSCOs are reluctant to invest in
specific assets for companies whose life is shorter than the required assets’ life because there is
no guarantee that they will be able to re-lease the new stock beyond the lives of existing
franchises. This exposes the ROSCOs to potential hold-up by the new entrants at the re-
procurement stage. One possible way to eliminate or mitigate a potential hold-up problem is via
vertical mergers. This was the path followed by the train operator Stagecoach and the ROSCO
Porterbrook. However, ORR says that further ROSCO-TOCs mergers are undesirable7 as they
might create barriers to the entry of new leasing suppliers (ORR, 1998, 5.22).8
Limits on the interchangeability of the rolling stock increase concentration in certain
market segments; for example, high-speed trains were given only to Angel and Porterbrook. A
commonly held view was that due to the lack of competition in this market the ROSCOs should
be subject to regulation as well as the other major players in this industry9. This was
investigated by ORR (1998) in order to assess the extent of their market power and whether the
underinvestment was a result of the exploitation of a monopoly position. ORR investigated
whether the lack of surplus assets which constrained ability to meet demand (Welsby, 1997)
was attributable to ROSCOs’ attempts to exploit market power. They found that while the
ROSCOs held a dominant position in this market, there was no evidence that they were abusing
this position. ORR’s assessment was nevertheless that the degree of market concentration,
combined with the tight balance between demand for stock and available supply creates the
potential for abuse. This might prove of particular significance during the next franchise round.
ORR therefore expressed the need to reassess the situation at TOCs’ franchise renewal, when
the balance between supply and demand could give the existing lessors of rolling stock market
power.10 To sum up, long-lived specific assets and short-term demand create (i) uncertainty and
7 Detailed analyses of welfare effects of mergers in railways are very scarce. A very good one is Pittman (1990).8 Also at http://www.rail-reg.gov.uk/docs/64/contents.htm9 According to the design of the regulatory structure of the industry set out in the Railway Act 1993, rolling stockleasing companies were left outside the regulatory framework, being subject only to competition law.10 ‘In considering the future balance between supply and demand, and also the development of factors relevant todetermining residual values, there seems to be a clear contrast between the multiple unit market and the marketfor high speed InterCity trains. The multiple unit fleet is large - around 7,500 vehicles - and increasingstandardisation of vehicles is likely to result in greater flexibility and market liquidity, and in falling lease costs.InterCity trains, on the other hand, are likely to be specialised, one-off builds. This is likely to result in highercosts, not least because of the limited alternative uses of stock for the ROSCO, with the attendant increase inresidual value risk in the absence of longer leases. A further issue which affects the future development of therolling stock market is the extent to which changes in the railway infrastructure will reduce some of the currentrestrictions on use. More generally, some routes require particular types of rolling stock (for exampleincorporating different technical standards for services through deep tunnels, such as WAGN services toMoorgate), while other types of rolling stock (such as Networkers) may effectively be limited to certain routes

9
(ii) risk of hold-up. Both these factors could explain underinvestment in rolling stock assets.
2.2 The Train Operating Companies
The duration of franchise contracts awarded to the TOCs varies between seven and fifteen
years. The longer franchises involve a higher degree of commitment in the form of investment
obligations; the seven-year franchises do not generally have any investment requirements (see
OPRAF’s reports for more details). While the franchise contracts are currently exclusive, the
Government declared its intent to introduce open access competition at some stage in the
future.11
Because of the ‘repeated auction’ framework, and the problem of ‘asset specificity’, the
TOCs also face a potential hold-up problem if they seek to sell-on their assets to new entrants at
the end of their franchise. Given that there are few alternative economic uses for the
incumbent’s rolling stock assets, the entrant can threaten to lease assets from the ROSCOs, or
even buy on the market, though this would not necessarily be credible, for the same reasons that
discourage TOC investment in the first place.12 The risk of being replaced at the next franchise
reprocurement stage could reduce the incentive on TOCs to invest, and the expectation of open
access competition might be expected to reinforce this effect. This risk is increased where the
TOC negotiates and part-funds improved infrastructure investment by Railtrack to provide
capacity for the new rolling stock, as they face the risk that other companies might enter and
take advantage of the improved infrastructure (Dodgson, 1994, p246). Nash and Preston (1997)
report that many franchisees indicated that they would not be interested in bidding unless they
received exclusive rights to run the service. The Government has responded to some of these
concerns by postponing competition within franchise areas, which have been made exclusive for
the first round. At present, though, the threat of open access competition remains for future
franchises at the next reprocurement stage.
In addition to fears about future competition, there is considerable uncertainty about
future demand (CRUCC, 1999). It will take time to discover whether this unexpected increase
in demand is temporary or, instead, it marks a change in trend. Real option theory suggests
because of the need for, and expense of, modification of track circuits to avoid electrical interference,’ (ORR, 1998, pp. 75-77).11 The intention of the rail reform was to stimulate intramodal competition for passenger traffic by promotingopen access to the rail network. However, this has been postponed until the year 2002, thus sheltering the TOCsfrom competition until 1999, from when limited competition could be introduced at the discretion of theregulator. In the course of 1999 open access competition plans were suspended even though this was notofficially announced.12 The TOCs’ franchise contracts do not include ‘asset-transfer’ rules because the rolling stock business was

10
that uncertainty that may be resolved by waiting makes it worthwhile to delay investment,
providing an additional explanation for initial underinvestment (Dixit and Pindyck, 1994). In
some instances the problems caused by underinvestment were so acute as to induce requests
from TOCs to renegotiate their franchise with the SRA (OPRAF, 1999).
2.3 Railtrack
Railtrack is a regulated monopolist. The track access price it charges to the TOCs is subject to
price-cap regulation. As a consequence of the initial structure of access charges, it had almost no
incentive to invest in upgrading the quality or capacity of the track network, though this has
been addressed in the Draft Conclusions of the first Periodic Review (ORR, 2000).13 The
resulting level of investment in network infrastructure has spillover effects on investment in
rolling stock because of complementarities. In one case the market has generated a possible
solution through vertical contractual arrangements with the Virgin Trains-Railtrack agreement
for the upgrade of the West Coast Main Line (WCML). Under this contract the train operator
agrees to share its revenues with the network provider in return for contributing to new track
investments.
Deals that facilitate investments which would not have been made otherwise appear to
be Pareto improving, and hence efficient. However, such agreements create de facto vertical
integration between a favoured downstream provider and a monopolistic input provider,
raising concerns about market foreclosure (see Grimm, Winston and Evans, 1992).14
Railtrack may find it profitable to give preferential access to its partner TOC, and restrict
access to other companies using the same tracks, and to potential new entrants.
intended to be kept separate from train operation.13 The original access-price structure involved only 3% of track-access income varying with being the number oftrains and a further 5% to cover electric traction (Railtrack, 1998). ORR has partially responded to Railtrack’ssuggestions for greater incentives for increasing capacity, partly by a value-based adjustment to the RegulatoryAsset Base at the next Periodic Review of the difference between the actual and assumed growth in passengermiles multiplied by a rate per passenger mile (ORR, 2000, 9.26). The proportion of the track access charges thatare variable (including the traction electricity charge of 5% of the total) will rise from 8% to 41%, providing“much stronger incentives for Railtrack to be responsive to the needs of its customers than under the currentregime.” (ORR, 2000, 9.42)14 Railtrack designs the timetable and so allocates the paths between train operators who share the same track.Railtrack might foreclose access to the track to other companies in order to favour access of the company withwhich it has an investment agreement and whose revenues it shares. Modern Railways (June 1999, p.392)reports that problems are being faced by companies running on the WCML (the passenger train operatorSilverlink and by the freight operator EWS) to obtain the number of paths promised by Railtrack at the time ofapproval of the contract with Virgin Trains. Moreover, requests for additional paths from EWS have been turneddown. Therefore operators have to find alternative routes which are less efficient (as they are longer) and requirea different type of asset (EWS had to buy train of different specification to make use of the alternative route, see Modern Railways, November 1999, p.788).

11
As a monopolist, Railtrack has the bargaining power to extract surplus by carrying out
or contributing to investments, thus determining the future shape of the network and access to
it. This would not matter if bargaining between Railtrack, TOCs (and ROSCOs) were
efficient, but with incomplete and asymmetric information, there must be concerns that some
desirable ROSCO investments are delayed while a satisfactory division of the gains between
the parties is agreed.
3. The theory
We now examine two theoretical explanations for the observed investment behaviour in rolling
stock: (a) contractual incompleteness and incentives, and (b) uncertainty and option value.
(a) Contractual incompleteness and incentives
Williamson (1985) considers the limitations that arise from incomplete long-term contracts
and highlights problems relating to non-compliance. Posner (1972) suggests that the duration
of these franchise contracts should be short in order to avoid the problems arising from
incomplete long-term contracts (such as a lack of incentive for efficiency). However, short-
term contracts have serious shortcomings. Among these is the impossibility of maintaining
bidders’ parity at renewal. Posner argues that, to overcome this, the assets should be
transferred to the winner at a pre-agreed rate. Competition among bidders will then prevent
any exploitation of monopoly by the new winner. However, Williamson (1976) disputes this
because the incumbent enjoys an advantage over its competitors due to (i) imperfect
transferability of physical/human capital, and (ii) imperfect measurability of the residual value
of investments. If investments are specific, short-term contracts will not be efficient and the
greater the degree of specificity, the longer will be the term of contract required.
Williamson points out that recurrent short-term franchise contracts have not in fact
been widely used. He investigates the case of franchises for cable television, most of which
have been awarded with 10-15 year contracts. Appropriate penalties have to be devised for
unsatisfactory performance and setting up conditional responses to contingent events can
promote efficiency and mitigate litigation expenses.
In auctions of monopoly franchises, as Williamson (1985, p.337) put it, there is always a
“risk of inability to perform of the lowest bidders. History is full of cases of renegotiation.” The
probability of renegotiation is higher for industries of national interest (such as defence and
transport). This is well illustrated by the case of Argentina’s Railways, where freight and

12
passenger concessions have faced similar challenges. Initial demand projections by the winning
operators proved too optimistic and made them unable to fulfil their investment commitments
(Thompson and Budin, 1997). Although this could be explained by opportunistic behaviour of
the contractors, the regulator has nevertheless to guarantee that the companies do not fail (or at
least that service continuity is maintained). In this sense, short-term contracts have the
advantage of enabling adaptive sequential decision making. However, when assets are specific
and their transfer is not straightforward, by backward induction one can expect that little or no
investments will take place. The mechanism of asset transfer should therefore be pre-specified
(Williamson, 1985, p.341), though this too could be manipulated.
This theory therefore suggests that vertical integration or long-term contracts should be
favoured in order to facilitate investment, though the leasing arrangement with long-lived
ROSCOs is clearly intended as a means of addressing this problem. Williamson’s prediction of
contract renegotiation also seems to fit our case. The Strategic Rail Authority has recently
announced that it is willing to renegotiate the franchise contracts expiring within five years, ‘and
will modify the steep downward trend in the government funding which supplements farebox
revenues, but only in return for solid commitments to invest in core developments in the
franchises…’ (SRA, 1999). The SRA is also willing to offer new contracts having a duration of
15-20 years.
Laffont and Tirole (1993) develop a theory based on Williamson’s points (i) and (ii)
above. They assume that the investment is non-transferable and that the regulator can observe
cost and profits from the accounting data, but cannot deduce the precise value of the
investment. They develop a two-stage model where at time 1 the regulator offers an incentive
contract to a single firm and at time 2 reprocurement occurs. The prospect of being replaced
by an entrant would lower the incumbent’s incentive to invest in capital which it would not be
able to transfer at the correct price. When the investment is non-observable (i.e., non-
contractible) it cannot be fully compensated and the incumbent has too little incentive to
invest. The regulator can offset this with an optimal reprocurement (‘break-out’) rule that
favours the incumbent at the reprocurement stage. This departure from bidders’ parity,
according to Laffont and Tirole, implies only a small loss in productive efficiency and
increases investment. Laffont and Tirole conclude: “That a second source may not be of much
use when investment is transferable (but not perfectly observable) leads us to a somewhat
pessimistic assessment of how much regulators can hope to gain by using second sourcing in
a natural monopoly situation involving substantial investment” (ibid. p.355).

13
In the rail industry assets are transferable though not perfectly observable (Nichols and
Welsby, 1999), so Laffont and Tirole's model implies the desirability of departing from
bidding parity in order to provide incentives for investment. This could consist of an option to
extend the contract, provided performance is satisfactory, instead of re-auctioning the
franchise.
(b) Uncertainty and Real Option explanations
Dixit and Pindyck (1994) demonstrate that delaying investment in the presence of uncertainty
has an option value. According to orthodox theory, an investment should take place whenever
the expected net present value (NPV) of the investment is greater than, or equal to, zero. Dixit
and Pindyck note that this theory ignores a number of factors, namely that investment is
irreversible, may be delayed until a later date, and that the project returns are subject to
uncertainty (NPV is based on the mean and does not consider the expected variance of the
returns). Dixit and Pindyck note that under these conditions, the ability to delay investment
has a value that they compare to a financial call option, which is cashed when the investment
takes place. Therefore, the value of not investing is not zero, as traditionally thought, but it is
positive, and the NPV test must exceed this positive value for investment to be justified.
This theory is relevant in our investigation because (i) uncertainty derives from the
final demand for railway transport,15 future competition, costs and regulation16 for Railtrack
and the TOCs (see Armstrong, Cowan and Vickers, 1994, pp.85-86); (ii) irreversibility
derives from the specificity of assets; and (iii) firms have the ability to delay the investment
without losing the option to invest due to their monopoly licence.
Guiso and Parigi (1999) point out that although irreversibility is an important variable
in the determination of the sign of the investment-uncertainty relationship, ‘other more subtle
assumptions have been shown to be relevant,’ (p.186). Even in the presence of irreversibility
Abel and Eberly (1993, 1994) find that uncertainty has a non-negative effect on investment if
the firm operates in a competitive market. Caballero (1991) also finds that the relationship
between the degree of irreversibility of the investment and the degree of competition in the
final market is important in determining the effect of uncertainty over investment. This
relationship however can become ambiguous when there are time lags for the delivery of the
15 As pointed out above, there has been a very high unpredicted increase in demand for passenger rail servicessince privatisation.16 The regulator might hold-up the company after the investment has been sunk. Therefore, an ex-ante crediblecommitment is needed. Removal of regulatory uncertainty over the treatment of such investments is necessary to

14
capital goods (e.g., construction lags), as this might speed up capital accumulation to meet a
higher-than-predicted demand.
Guiso and Parigi conclude that the sign and intensity of the investment-uncertainty
relationship must be resolved on empirical grounds. Unfortunately, because of the difficulty
of measuring uncertainty, such empirical research is very scarce. They refer to only one other
study using micro data (Leahy and Whited, 1996). They find that uncertainty has a
substantially stronger negative effect on the investment decision of firms that cannot easily
dispose of their capital in second hand markets than those that can. This is certainly the case
for investment by ROSCOs (and also by TOCs).
In the next section we investigate the empirical validity of these theoretical predictions
in the British passenger railway industry.
4. Empirical analysis
We now investigate investment in new rolling stock by means of the following model:
itu
itF
itU
itC
itI ++++= δγβα
The dependent variable I represents the investment carried out by TOC17 i at time t. More
specifically, we study the ‘spontaneous’ investment, which the companies have made as their
commercial decision, i.e., not deriving from any contractual obligation. The ‘committed
investment’ is the investment that the companies agreed to carry out as a condition of their
franchise. This is taken into account in the equation among the right hand side variables. The
level of committed investment is a possible explanatory variables, since the level of
committed investment might trade-off against the level of additional ‘spontaneous’
investment.
Following the theories above we explain the investment behaviour by means of three
main vectors of variables described in Table 1 below. C is a vector of variables measuring
contract characteristics (e.g., length of the contract, request of renegotiation, award of
extension) and asset specificity (measuring the degree of specificity of the assets adopted by
TOC i). U is a vector of variables which proxy uncertainty (demand, variance of demand, and
future state of competition). Finally, F is a vector of firm characteristics describing the initial
state of the stock adopted by company i, proxied by its age, the level of profits, any merger
prevent underinvestment (Railtrack, 1998; Gilbert and Newbery, 1994)17 The rolling stock assets are actually acquired on TOC’s order by the ROSCOs, who then lease the assets to theTOCs for the entire duration of their contracts and thereby repay the investment.

15
(horizontal or vertical) or contract that it might have entered with other firms in the industry,
etc. α is a constant, and uit is a stochastic error term.

16
Table 1 Explanatory variables for spontaneous investmentModel Variable Predicted effect on
Investment
WilliamsonandLaffont & Tirole
C• Contract length• Extension Requested• Extension Awarded (Renegotiation)• Asset Specificity/Flexibility
PositivePositivePositiveNegative/Positive
Dixit & PindyckU• Future competition• Demand• Demand Variance
NegativePositiveNegative
General Factors:
Integration vs.Separation
F• Age of stock• Horizontal Consolidation• Vertical Consolidation• Joint Ownership• Coach-company Ownership
PositivePositivePositivePositivePositive
Financialincentives
• Subsidy profile (subsidy left)• Profits• Committed Investment
?PositiveNegative
Uncertainty/Delay • Time dummies Increasing
Appendix 1 gives the sources and methods for constructing these variables.
4.1 The data
Our data set consists of a panel of all 25 franchisees (passenger TOCs) from the start of their
operation until February 2000. These companies did not all start operation at the same time
because not all the auctions were simultaneous (the franchising timetable is given in OPRAF,
1997, p.8). We therefore have only three full years of data so in our model i = 25 and t = 3.
One advantage of our panel of data is that it represents the entire population. Its main
limitation is that the short time span since the start of railway privatisation provides only 72-
74 observations, depending on the variable. The small sample size does not lend itself to
econometric techniques that would enable us to explore dynamics. It would have been
interesting to estimate this model in a specification with all the variables taken as differences
from their time series mean. We leave this for future research when the size of the panel
increases sufficiently. Appendix 3 reports the summary statistics of our data.

17
4.2 Econometric methodology and results
Investment is modelled using a random effects (RE) specification. This choice reflects the
fact that many elements come into play in the commercial decision to invest. First, the
ROSCOs provide the initial finance in most cases, and second, in cases of loss-making
operations, the local Passenger Transport Authorities (PTAs) provide finance. As other agents
are involved in financing decisions a RE specification is more appropriate. From a practical
point of view, a fixed effects (FE) model is very costly in terms of degrees of freedom.
Nerlove and Balestra (1992) in Baltagi (1995) emphasise the view that the population consists
not of an infinity of individuals but of an infinity of decisions that the individuals might make
(see also Greene, 1993, and Hsiao, 1986) 18, this makes the random effects specification more
appropriate to our investigation.
We estimated our model by means of a Probit, transforming our dependent variable
into a binary variable 0-1 (1 being the case when spontaneous investment occurred). This
model specification is more appropriate to our analysis as it more closely reflects the nature of
the investment under investigation. Investments in railways assets are generally ‘lumpy and
jumpy’, hence the critical decision is whether to invest or not, rather the size of the
investment. The variables of our model were normalised by the number of train miles per
each TOC, in order to control for the different scale of the operations. The results of our
Probit estimations are reported in Table 2.
We also estimated this model under alternative specifications, with the dependent
variable being the capital value of the assets bought - in excess of their franchise conditions-.
We run the estimations first excluding and then including our normalisation for scale. These
results are reported in Tables 3 and 4 respectively. We tested the RE specification by means
of a Hausman test. The test statistic, reported in Table 3, suggested that the RE is the correct
specification. As an additional test we estimated the model using a fixed effects specification.
The results confirm that this model is not the correct specification, as the F statistic for the
joint significance of the coefficients and the F test for the joint significance of the individual
dummies demonstrate.
[Table 2 here]
[Table 3 here]
18 Mundlak (1978) argues that all individual effects should be treated as random.

18
[Table 4 here]
The striking finding across the different sets of results is that the coefficient of the
contract length variable is negative and significantly different from zero, which implies that
shorter contracts generate higher rates of investment. This is contrary to our original
hypothesis and sufficiently surprising to require interpretation. One possible explanation is
that TOCs facing re-procurement sooner (i.e. those with the shortest contracts) respond with
increased investment to signal their commitment to the regulator and thus increase their
probability of re-award of the franchise. Clear messages were sent by the SRA about its
expectations with regard to investment by TOCs: ‘OPRAF takes every opportunity to
encourage and facilitate such initiatives (investments) in dialogue with operators, [...]. It has
become clear that TOCs should become investment vehicles,’ (The Utilities Journal, 2000).
Public threats of fines and non-renewal of franchises from the regulator (SRA) have served as
a strong incentive. If this explanation is correct, it suggests that the repeated nature of the
game may help overcome some of the problems of asset specificity (Gilbert and Newbery,
1994).
Investing near the end of the franchise is also a way to signal aggressive behaviour to
potential entrants and to raise their entry costs. It has moderately low risk for the TOCs, as the
risk is largely borne by the ROSCO, while the incumbent TOCs will have a clearer idea of the
value of the investments they have chosen in the next round of bidding. The result is also
consistent with the findings of Abel and Eberly (1993, 1994) mentioned in the discussion of
theory (b) above on the relationship between investment and uncertainty. Abel and Eberly
find that uncertainty can have a positive effect on investment in a competitive market. The
threat of competition at the next TOC franchise auction might explain our finding that
companies invest towards the end of their contract. Unfortunately our data cannot directly
capture such factors,19 although our results are nevertheless consistent with this explanation.
The time dummies are non-significant in all specifications, though they are consistent
with investment delays (and hence the option value explanation, or the disruption of
restructuring explanation). We tried to capture the effect of the postponement of plans to
introduce open access competition by means of a 1999 time dummy but this was not
19 We had to exclude from the estimations the main variable proxying uncertainty, the standard deviation ofdemand, because the construction of this variable reduces the number of observations by one year. As thisreduced the number of observations for this variable to 50, it was excluded.
19
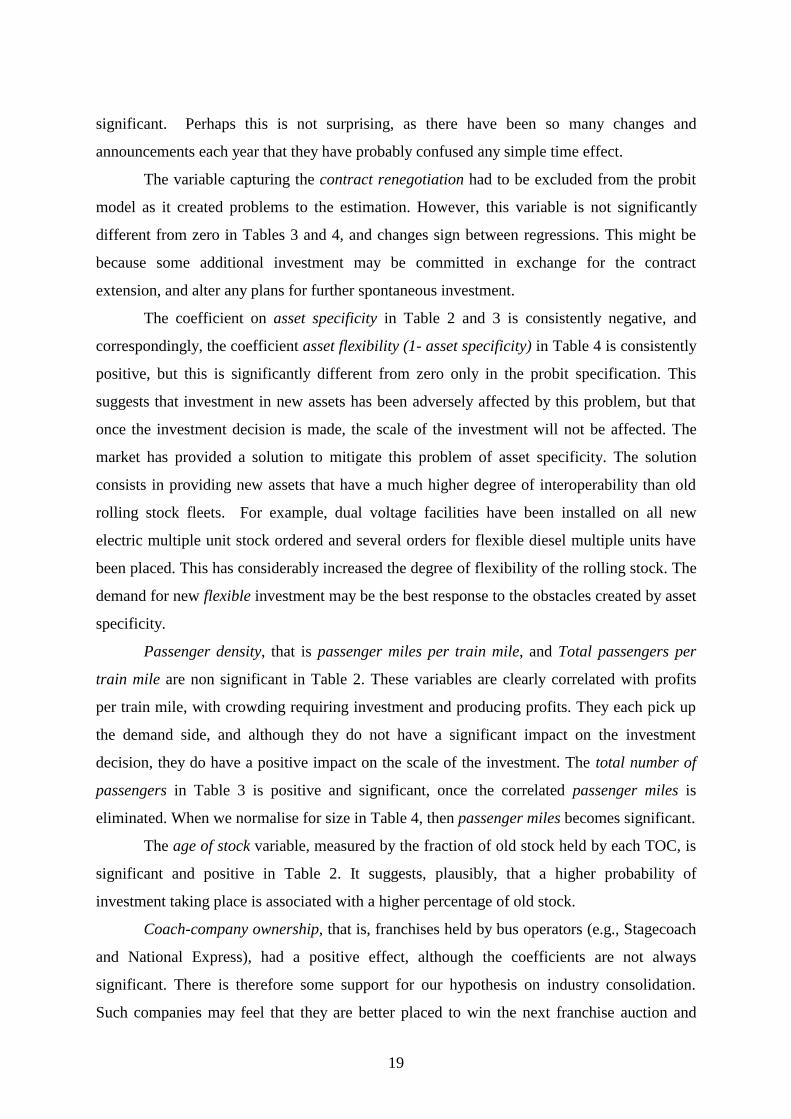
significant. Perhaps this is not surprising, as there have been so many changes and
announcements each year that they have probably confused any simple time effect.
The variable capturing the contract renegotiation had to be excluded from the probit
model as it created problems to the estimation. However, this variable is not significantly
different from zero in Tables 3 and 4, and changes sign between regressions. This might be
because some additional investment may be committed in exchange for the contract
extension, and alter any plans for further spontaneous investment.
The coefficient on asset specificity in Table 2 and 3 is consistently negative, and
correspondingly, the coefficient asset flexibility (1- asset specificity) in Table 4 is consistently
positive, but this is significantly different from zero only in the probit specification. This
suggests that investment in new assets has been adversely affected by this problem, but that
once the investment decision is made, the scale of the investment will not be affected. The
market has provided a solution to mitigate this problem of asset specificity. The solution
consists in providing new assets that have a much higher degree of interoperability than old
rolling stock fleets. For example, dual voltage facilities have been installed on all new
electric multiple unit stock ordered and several orders for flexible diesel multiple units have
been placed. This has considerably increased the degree of flexibility of the rolling stock. The
demand for new flexible investment may be the best response to the obstacles created by asset
specificity.
Passenger density, that is passenger miles per train mile, and Total passengers per
train mile are non significant in Table 2. These variables are clearly correlated with profits
per train mile, with crowding requiring investment and producing profits. They each pick up
the demand side, and although they do not have a significant impact on the investment
decision, they do have a positive impact on the scale of the investment. The total number of
passengers in Table 3 is positive and significant, once the correlated passenger miles is
eliminated. When we normalise for size in Table 4, then passenger miles becomes significant.
The age of stock variable, measured by the fraction of old stock held by each TOC, is
significant and positive in Table 2. It suggests, plausibly, that a higher probability of
investment taking place is associated with a higher percentage of old stock.
Coach-company ownership, that is, franchises held by bus operators (e.g., Stagecoach
and National Express), had a positive effect, although the coefficients are not always
significant. There is therefore some support for our hypothesis on industry consolidation.
Such companies may feel that they are better placed to win the next franchise auction and

20
hence are more willing to invest in advance.
We expected that if TOC i merges (either horizontally or vertically) or enters a
contractual arrangement with other companies in the industry, this would reduce risk and
hence stimulate investment. Unfortunately both variables had to be excluded from our probit
estimates as they created problems to the estimations. However, if we look at the results of
the GEE estimations (reported in Table 4) where these variables could be used, we find that
although the effect of vertical consolidation is not significantly different from zero,
horizontal consolidation is, though, contrary to our hypothesis, it has a negative sign. This
could suggest the presence of economies of scale in investment. For example Virgin and
Stagecoach, who acquired some joint ownership, have invested in trains that could be adopted
for both operations.
Joint ownership, which is measured by the number of TOCs owned by the same
parent company, is positive and significant in our probit results reported in Table 2, and it
becomes significant when we exclude the ‘coach-company ownership’ variable in Table 3.
Larger firms are more likely to invest. This is consistent with the explanation that larger
groups face lower degrees of financial risk and are therefore better able to undertake
discretionary investment. This is also consistent however with a signalling explanation, that
would see larger groups that intend to acquire more franchises in future, trying to signal their
‘good behaviour’ to the regulator.
The committed investment variable is surprisingly non significant. It only becomes
marginally significant in the normalised model of Table 4 provided the contract renegotiation
variable is included, and with which it seems to interact. This suggests that the decision to
invest over and above the contractual commitment is not affected by the sums already
committed, and therefore does not affect the willingness (or need) to undertake additional
discretionary investment. In other words, the spontaneous investment is not a substitute for
committed investment, as one might have expected. This could become the case when TOCs
are willing to commit their planned additional investment in order to secure a franchise
extension, in which case less discretionary investment is needed, but does not appear to be
true otherwise.
The variable measuring subsidy remaining, included to control for the effect of
financial incentives, or their lack, has a significant negative effect on the investment decision
(Table 2). This can be explained by the fact that the ‘market driven’ incentives to invest are
missing in those cases (franchises) that mainly operate PSO (‘public service obligation’)

21
services. Hence, consistently, the level of investment is not affected by the level of subsidy
(Tables 3 and 4).
The profits variable is positive and significant in Table 2. This is also positive and
significant in Table 3 and in the normalised version of Table 4, when passenger density
(passengers per train) is dropped (with which it is collinear). This suggests that investment
decisions respond to commercial incentives (passenger demand which produces profits
requires extra capacity).
5. Conclusions
In this paper we considered the pattern of investment in rolling stock in the British
railway industry from its restructuring in 1994 through privatisation in 1995/96 until 2000.
We have been concerned that repeated auctions of rail franchises of different length, as well
as other sources of uncertainty, may have adverse effects on rolling stock investment. Theory
suggests that the length of a franchise contract plays a major role in determining the
franchisee’s incentives to invest in specific assets. The high degree of specificity of rolling
stock assets lead us to expect that short-term franchise contracts –such as the seven years
franchises awarded to some TOCs after BR privatisation- together with uncertainty as to the
winner at the next franchise auction, would weaken incentives to invest. This effect is
reinforced by uncertainty from (i) the potential threat of future open access competition, and
(ii) uncertainty about future demand.
Surprisingly our empirical findings did not confirm this simple interpretation of the
apparently adverse interaction between asset specificity and short contract lengths. Several
explanations suggest themselves. The structure of long-term leasing companies (the
ROSCOs) owning the assets and leasing them to whoever wins the particular franchise
reduces the risk of stranding assets considerably, though not completely. Given their
considerable market power, deriving from their small numbers and barriers to entry, the
ROSCOs may feel that demand for continued leases is sufficient to support investments in
assets of considerably greater durability than franchise lives.
The time pattern of investment (increasing towards the end of the contract) is
consistent with the option value of delaying in the face of uncertainties over future demand,
as well as the disruption caused by the restructuring. Excess supply of rolling stock building
capacity and a slump in new build prices would also encourage some delay. We also suggest
that delaying investment until later in the contract life can be explained by companies’

22
strategic behaviour. Investing just before the end of their contract potentially enhances the
probability of having the contract re-awarded. Very explicit messages from the regulator
suggest that this will be an element taken into account in the re-franchising process. Moreover
such behaviour provides the incumbent operator with a first-mover advantage, while raising
the entry cost for other potential bidders.
We find that investment appears to respond positively to other commercial incentives
such as profits, and that investment per train mile also responds to the number of passengers
per train.
The current policy adopted by the SRA in response to the problems of
underinvestment in rolling stock after privatisation has been (a) to extend contract length so
that the new franchise contracts will have a minimum duration of 15-20 years, with a review
taking place every five/seven years; (b) to act as a procurement agent by buying new rolling
stock with the aim of transferring this to the successful franchisee,20 and (c) to offer larger
franchises at re-procurement. Are these responses justified in the light of our findings?
Our first contrary finding is that discretionary investment is stimulated by shorter
rather than longer contracts, casting some doubt on the view that longer contracts are needed
to address the under-investment problem. Longer contracts may be required for radical
changes in strategy such as introducing high speed tilting trains, but not necessarily for
“business as usual” scenarios. Our finding that investment appears to respond as predicted to
commercial incentives (profitability) also casts doubt on the need for market intervention by
the SRA in rolling stock orders. The increased interoperability of the new stock ordered
seems to suggest that an increasingly flexible market is developing, which reinforces the
suggestion that longer franchise contracts are not the correct solution for under-investment in
British railways. Finally, companies holding a larger number of franchises are more likely to
invest. This is consistent with a lower financial risk and a reduced problem of asset specificity
deriving from owning several franchises, however, it is also consistent with the attempt to
signal good behaviour to the regulator in order to increase the probability to be awarded
further franchises.
20 See SRA announcement of 11 February 2000 on rolling stock orders for the Connex South Central and SouthWest Trains franchises to remove slam door stock (due to take place by January 2005. Seehttp://www.sra.gov.uk/SSRA_news/Default.htm).

23
6. ReferencesAbel, A.B., and Eberly, J.C. (1993). ‘An Exact Solution for the Investment and Market Value
of a Firm Facing Uncertainty, Adjustment Costs, and Irreversibility.’ NBER WorkingPaper No. 4412.
Abel, A.B., and Eberly, J.C. (1994). ‘A Unified Model of Investment under Uncertainty.’American Economic Review, LXXXIV, 1369-1384.
Armstrong, M., Cowan, S. and Vickers, J. (1994). Regulatory reform: Economic analysisand British experience. Regulation of Economic Activity series, vol. 20. Cambridgeand London: MIT Press.
Baltagi, B.H. (1995). Econometric Analysis of Panel Data. John Wiley and Sons, Chichester.‘British Railways. Locomotives and Coaching Stock’. Sheffield, Platform 5 Publishing Ltd..Caballero, R.J., (1991). ‘On the Sign of the Investment-Uncertainty Relationship’. American
Economic Review, LXXXI, 279-288.CRUCC, (1999). ‘Annual Report 1998/99’. Central Rail Users Consultative Committee.Demsetz, H. (1968). ‘Why Regulate Utilities?’ Journal of Law and Economics, 11, 77-97.Dixit, A.K. and Pindyck, R.S. (1994). Investment under Uncertainty. Princeton University
Press, Princeton, New Jersey.Dodgson, J. (1994). ‘Railway Privatization.’ In Bishop, Kay and Mayer (eds.), Privatization
and Economic Performance. Oxford University Press.Edlin, A.S., and Reichelstein, S. (1996). ‘Hold-ups, Standard Breach Remedies, and Optimal
Investment.’ American Economic Review, 86, 478-501.Gilbert, R.J. and D.M. Newbery (1994). ‘The Dynamic Efficiency of Regulatory Constitutions',
Rand Journal of Economics, Vol. 25 No. 4, 538-54Glaister, S. (1998). "Integrated Transport: a Future for Rail?", The Institute of Economic
Affairs. Lecture Series VIII. Reprinted in Regulating Utilities: a New Era? M. E.Beesley (ed), IEA and London Business School, Readings 49, December 1999.
Greene, W.H. (1993). Econometric Analysis. Prentice Hall, Englewood Cliffs, New Jersey.Guiso, L., and Parigi, G. (1999). ‘Investment and Demand Uncertainty.’ Quarterly Journal of
Economics, 114(1), 185-227.Grimm, C.M., Winston, C. and Evans C.A. (1992). ‘Foreclosure of Railroad Markets: A Test
of Chicago Leverage Theory.’ The Journal of Law and Economics, XXXV, 295-310.Hart, O. (1995). Firms, Contracts, and Financial Structure. Oxford: Clarendon Press.Helm, D. (1996). “Putting the Railways Back Together Again: Rail Privatisation, Franchising
and Regulation.” In Beesley, M.E. (ed.). Regulating Utilities: A Time for Change?The Institute of Economic Affairs, No.44.
Hsiao, C. (1986). Analysis of Panel Data. Econometric Society Monographs No.11.Cambridge University Press.
Jones, I. (1999). ‘Railway Franchising: Is it Sufficient?’ The Institute of Economic Affairs.Lecture Series IX.
Klein, B. Crawford, R.G. and Alchian, A.A. (1978). “Vertical Integration, Appropriable rents,and the Competitive Contracting Process.” Journal of Law and Economics, vol.21,297-326.
Laffont, J.J. and Tirole, J. (1993). A Theory of Incentives in Procurement and Regulation.The MIT Press, Cambridge, Massachusetts.

24
Leahy, J.V., and Whited, T.M., (1996). ‘The Effect of Uncertainty on Investment: SomeStylised Facts.’ Journal of Money, Credit and Banking, XXVIII, 64-83.
Liang, KY Zeger, SL (1986). ‘Longitudinal Data Analysis Using Generalized Linear Models.’Biometrika 73, 13-22.
Mundlak, Y., (1978). ‘On the Pooling of Time Series and Cross Section Data.’ Econometrica,46, 69-85.
Nash, C.A., and Preston, J., (1997). ‘Competition in Rail Transport. A New Opportunity forRailways?’ In Oum, Dodgson et al. (ed.), Transport Economics. Selected Readings.Amsterdam: Harwood Academic Publishers.
National Audit Office, 5 March 1998. Privatisation of the Rolling Stock Leasing Companies.Report by the Comptroller and Auditor General, (HC 576 1997/98).
Nerlove, M. and Balestra, P. (1992). ‘Formulation and Estimation of Econometric Models forPanel Data.’ In Matyas, L. and Sevestre, P. (eds.). The Econometrics of Panel Data:Handbook of theory and Applications. Kluwer Academic Publishers, Dordrecht.
Nichols, A. and Welsby, J. (1999). ‘The Privatisation of Britain's Railways: An Inside View.’Journal of Transport Economics and Policy. 33(1), 55-76.
OPRAF, (1997). ‘Annual Report 1996-1997’. Office for the Passenger Rail Franchising.OPRAF, (1998). ‘Annual Report 1997-1998’. Office for the Passenger Rail Franchising.OPRAF, (1999). ‘Annual Report 1998-1999’. Office for the Passenger Rail Franchising.ORR (1998). Review of the Rolling Stock Market. Office of the Rail Regulator.ORR (2000). Periodic Review of Railtrack’s Access Charges. Office of the Rail Regulator.Perry (1989). ‘Vertical Integration: Determinants and Effects’ In Schmalensee, R. and Willig,
R.D. (eds.). Handbook of industrial organization. Volume 1. Handbooks inEconomics, no. 10, Amsterdam; Oxford and Tokyo: North-Holland.
Pittman, R.W. (1990). ‘Railroads and Competition: The Santa Fe/Southern Pacific MergerProposal.’ Journal of Industrial Economics, XXXIX, 1, 25-46.
Pittman, R.W. (1991). 'Specific Investments, Contracts, and Opportunism: The Evolution ofSidetrack Agreements'. Journal of Law and Economics, XXXIV, 565-589.
Posner, R. (1972). ‘The Appropriate Scope of Regulation in the Cable Television Industry.’Bell Journal of Economics, 3, 98-129.
Preston, J., Whelan, G. and Wardman, M. (1999). ‘An Analysis of the Potential for On-TrackCompetition in the British Passenger Rail Industry.’ Journal of Transport Economicsand Policy; 33 (1), 77-94.
Railtrack (1998). 'Corporate Finance Issues: Railtrack's response to the Regulator.'SRA (1999). PLANNING CRITERIA - A Guide to the Appraisal of Support for Passenger
Rail Services. Shadow Strategic Rail Authority.The Utilities Journal, (January 2000). ‘Railway Franchising’. 28-30.Thompson, L.S. and Budin, K.J. (1997). “Global Trend to Railway Concessions Delivering
Positive Results.” Public Policy for the Private Sector. The World Bank Group. No.12, 41-48.
Welsby, J. (1997). “What Next in UK Railways?” The Institute of Economic Affairs. LectureSeries VII.
Williamson, O.E. (1985). The Economic Institutions of Capitalism. New York: Free Press.

25
Wilson, W.W. (1997). “Cost Savings and Productivity in the Railroad Industry.” Journal ofRegulatory Economics. Vol. 11, 21-40.

26
Appendix 1 The Description of the variables and data sources
1. Spontaneous Investment.This variable measures the amount spent on new rolling stock not deriving from anycontractual obligation with the franchise requirements. To take account of the delivery laginvolved in building the equipment, we decided to enter the total monetary value of theinvestment at the date when the rolling stock was ordered rather than delivered.Source: OPRAF and Modern Railways, issue March 2000.
2. Contract Length.Duration of the franchise contact measured in number of days.Source: OPRAF Annual Reports
3. Contract Length remaining.Number of days remaining to the end of the franchise contact.Source: OPRAF Annual Reports
4. Extension RequestedThis variable indicates whether there has been a request by a TOC to renegotiate the franchiseagreement in regard to the length. This is a 0/1 dummy variable, with 1 indicating that arequest was presented to OPRAF by TOC i at time t.Source: OPRAF Annual Reports
5. Extension Awarded (Renegotiation)This indicates a successful outcome of the above process. It is a 0/1 dummy where 1corresponds to the award of a franchise extension.Source: OPRAF Annual Reports
6. Asset Specificity/FlexibilitySee Appendix 2 for a detailed explanation of the construction of this variable.
7. Future CompetitionThere is no obvious way of measuring expected competition, in particular gradualintroduction of open access competition. We tried to measure this variable indirectly by tryingto capture the effect of the postponement of competition. For this purpose we introducedsome time dummies. The 1999 dummy should account for the fact that the originallyenvisaged ‘partial’ competition to be introduced from 1999 did not take place.
8. DemandTotal passenger numbers and Total passenger miles per year.Source: OPRAF
9. Demand VarianceStandard deviation of the above variables: Total passenger numbers and Total passengermiles.

27
Source: Our estimates based on data on demand as described above.
10. Age of StockWe classified all the stock in old, medium and new, and measured the percentage of rollingstock of each category adopted by each TOC. For the analysis we only adopt the fraction ofold stock leased by each TOC.Source: British Railways. Locomotives and Coaching Stock (1995 edition)
11. Horizontal ConsolidationTo capture the degree of horizontal consolidation we use a 0-1 dummy variable, with value 1in any case of contractual arrangements entered by TOCs, as well as outright changes inownership and control across TOCs. Some examples of events that are classed (or not) asinstances of horizontal consolidation are:
• Stagecoach, operators of Island Line and South West Trains, acquired a 49% stake inVirgin Rail Group, operators of CrossCountry and West Coast Trains; classed ashorizontal consolidations in 1998-99.
• MTL, operators of Northern Spirit and Merseyrail Electrics, reorganised theirfranchises into MTL Services plc with little change in control, (no extra benefitssought by Franchising Director). As it was just a technical change it was not classed.
Source: OPRAF Annual Reports and Press Notices.
12. Vertical ConsolidationTo capture the degree of vertical consolidation we also adopt a 0-1 dummy variable. Thisincludes any vertical contractual arrangements entered by TOCs. Some examples are:
• The acquisition of the ROSCO Porterbrook by the company Stagecoach.• The West Coast Main Line contractual arrangement between Railtrack and Virgin
Trains.Source: OPRAF Annual Reports and Press Notices, Industry Press.
13. Joint OwnershipThis is a stock variable, as opposed to the variables above that indicate the flow ofconsolidation in the industry. In other words this variable indicates the number of companiesthat are owned by the same parent company as company i at time t.Source: OPRAF Annual Reports and Press Notices, TOCs Annual Reports.
14. Coach-company OwnershipThis is a dummy variable, which is equal to one for those TOCs that are owned by a coachcompany and zero otherwise.Source: OPRAF Annual Reports and Press Notices, TOCs Annual Reports.
15. Subsidy RemainingThe SRA makes/receives payments to/from the TOCs under two regimes, the basic regimeand the incentive regime. This variable only takes into account the basic regime in order toavoid the interference of other elements that could alter its interpretation. The Basic Regimedefines the basic franchise payment, indexation, access charge supplement and fares incentive

28
adjustment payment.Source: OPRAF’s Annual Reports.
16. ProfitsThis variable measures the profits of the TOCs before taxation and other exceptional items.The data provided by the companies’ accounts are not directly comparable due to the fact thatin the first year of operation the accounts published refer to periods other than one year. Wecalculated this variable by adjusting the profits to be representative of homogeneous timeintervals.Source: Our calculations based on TOCs’ accounts.
17. Committed InvestmentThis variable gives the investment requirement to which a TOC committed itself when itsigned its franchising agreement with the Franchise Director.Source: OPRAF.
18. Time DummiesThese are 0-1 dummies for the years 1997, 1998 and 1999.

29
Appendix 2 Construction of the asset specificity variable
The types of rolling stock considered are: Diesel, Electric overhead, Electric third rail,Electric dual, Electro-diesel overhead, and Electro-diesel third rail. These are further dividedbetween short distance and long distance.The asset specificity index per each TOCi (Si) is calculated as follows:21
• First we calculate the proportion of TOCs that adopt each type of rolling stock, thiswill give us an index for each category Pa, where the subscript a indicates thecorresponding type of asset, for example Pd for diesel, Peo for electric overhead, etc.
• Then we calculate the number of trains of each specification per each TOC, Ti. IfTOCi has a fleet of trains of different type, then we calculate a weighted average. Thatis, if for example a TOC has 3 Diesel and 8 Electric overhead trains our calculation isas follows Ti = 3*Pd + 8*Peo. We then calculate a measure of flexibility Fi = Ti/(8+3).
• It follows that if all trains of TOC i are of the same type (e.g., Ti = 5*Petr), then theasset flexibility variable Fi is equal to the proportion of TOCs that use that type ofasset (i.e., Fi = Ti/5 = Petr).
Fi is therefore an indicator of flexibility rather than of specificity, which is independent of thesize of the fleet and only measures the degree of flexibility of each TOC's assets, rangingfrom 0 to 1. Our index of asset specificity is Si = 1- Fi which also lies between 0 and 1.
This index of asset specificity is constructed to suit the particular scope of this study.An alternative measure of specificity (flexibility) of the assets of each TOC would takeaccount of the proportion of the total network on which the assets Ti can be used. However,this would imply that diesel trains, which can run on almost all track are not specific at all, sothat Pd = 100%. Although this may be true in a technical sense, our intention is to capture themore subtle effect of the bargaining power of each TOC. Although it might be the case thatall TOCs could run diesel trains over their entire track, they typically choose not to do so,presumably as they are less suited to some routes. We choose instead to assume that an assetof a certain specification can be adopted by all other TOCs that already make use of that typeof asset.
21 Additional details on the calculation of this index are available from the authors on request.

30
Appendix 3 Summary Statistics
VARIABLE (units) Mean Std. Dev. Min Max
Length of Contract (days) 3306.6 1169.6 1826 5480Remaining Contract time(days)
2910.2 1195.4 927 5480
Application for franchise extension(0/1)
.05 .219 0 1
Renegotiation of franchise extension:(0/1)
.04 .196 0 1
Asset Flexibility: (1- Asset Specificity) .322 .117 .173 .48Number of passengers (million/yr) 33.072 32.44 .69 122.9Passenger miles (million/yr) 846.71 647.94 3.1 2291.6Standard deviation of number ofpassengers
1.38 1.26 0 5.33
Standard deviation of passenger miles 36.82 31.02 .085 164.61Age of stock (fraction old) .263 .309 0 1Horizontal Consolidation (0/1) .12 .327 0 1Coach company ownership (0/1) .66 .47 0 1
Joint ownership (no. of companiesowned)
3.08 1.3 1 5
Vertical Consolidation (0/1) .0641 .246 0 1Subsidy remaining (£ million) 311.35 519.27 -1017 1959.6Profits (£ million/yr) 5270.87 8730.5 -13227.69 38337.82Committed Investment (£million) 21.53 84.05 0 592Spontaneous Investment (£million) 3.706 16.953 0 120Committed Investment /Train Miles (£/mile)
2.213 8.614 0 55.327
Spontaneous Investment /Train Miles (£/mile)
.198 .814 0 4.347
Profits / Train Miles (£/mile) 499.83 1175.39 -3431.6 3688.2Total number of passengers/Train Miles
3.582 2.09 1.102 8.5
Total passenger miles/Train Miles
90.49 51.02 17.81 215.43

31
Table 2 Probit Results for the Spontaneous Investment per train mile (N=74)
Probit Model (Random Effects)
Independent variable (1) (2) (3) (4) (5)
Length of Contract (days) -.008***(.003)
-.007**(.003)
-.006***(.001)
-.004***(.001)
-.001***(.0004)
Request of franchiseextension♣: (0/1)
1.882(1.57)
.977(1.45)
Asset specificity -18.57*(10.43)
-16.1*(9.92)
-13.7**(6.03)
-10.24**(5.75)
-6.01**(2.7)
Total number ofpassengers/train mile
-.263~(.159)
-.357(.286)
-.325(.209)
-102(.18)
Total passenger miles/trainmile
.012(.009)
Horizontal consolidation (0/1) +Coach company ownership 1.469
(1.373)1.62**(.774)
1.41**(.60)
Joint ownership (no. ofcompanies owned)
.961**(.466)
.957**(.381)
.092***(.323)
.875**(.374)
Vertical consolidation (0/1) +Subsidy remaining/train mile(£/mile)
-.045**(.019)
-.055**(.027)
-.049***(.018)
-.025**(.012)
Profits per train mile (£/mile) .002**(.001)
.002**(.001)
.0024***(.0007)
.0018***(.0006)
.0007***(.0001)
Committed Investment pertrain mile (£/mile)
.114(.193)
.017(.163)
Age of stock (fraction oldstock)
7.506***(2.73)
6.055***(2.03)
5.28***(1.52)
4.13**(1.68)
1.44~(.99)
Time dummy: t99 1.269(1.316)
Constant 25.9**(11.61)
24.43*(14.54)
20.03**(7.4)
12.3**(5.77)
4.84**(2.15)
χ2 99.92*** 25.25*** 39.13*** 12.09* 64.8*** Robust standard errors in parentheses.+ variables dropped by the probit estimations; * p <0.10, ** p <0.05, *** p <0.01.~ marginally significant at 10%.♣ The variable award of extension had to be eliminated from the estimations of the probit.

33
Table 3 Results for the Spontaneous Investment (£ million) (N=72)
Random Effects (GLS) Fixed EffectsIndependent Variable (units) (1) (2) (3) (4)Length of Contract (days) -.0053** (.002) -.018**
(.009)-.017** (.007) dropped
Remaining Contract time (days) -.20 (.021)Application for franchiseextension (0/1)
-9.09(14.35)
-21.79(18.87)
Renegotiate extension: (0/1) -.28 (7.57) 8.99 (15.78) 21.9 (20.86)Asset Flexibility:(1- Asset specificity)
21.87(20.45)
20.47(22.25)
dropped
Total number of passengers(million)
.097(.83)
.155**(.069)
.143***(.049)
2.49(1.71)
Total passenger miles (million) -.003 (.004) -0.38 (.13)Stnd. dev. of passenger no.s + + + +Stnd. dev. of passenger miles + + + +Age of stock (fraction old stock) 11.91*
(9.82)8.62*(10.4)
dropped
Horizontal consolidation (0/1) -7.16(6.38)
-9.21*(5.62)
-7.88’(5.07)
-11.39(8.34)
Coach co. ownership (0/1) 4.71 (4.45) 3.17 (4.22) droppedJoint ownership (number ofcompanies owned)
1.71(1.47)
1.33(1.47)
1.99*(1.16)
4.0(8.71)
Vertical consolidation (0/1) 3.54(11.07)
6.48(10.57)
Subsidy remaining (£ million) -.003(.004)
-.001(.004)
-0.005(0.02)
Profits (£ million/yr) .00043*(.0002)
.00053***(.00019)
.0053***(.0017)
0.0006(0.0004)
Committed Investment (£ mill) -.009 (.023) -.002 (.074)Time dummies: t97t98t99
-2.59 (3.4).104 (3.2)2.43 (3.32)
Constant -4.03(9.26)
21.74(24.52)
-4.14(12.93)
-102.57(119.58)
F-test 1.32F test for individual effects F=0.87R2 Within/Between 0.54 0.58 0.55 0.28
χ2 20.31* 24.72** 25.16***Hausman Test χ2 8.45 7.64 3.85
Standard errors in parentheses. + eliminated from the estimations (<50 data points); * p <.10, ** p <.05,*** p <.01; ‘ p ~ 0.1.

34
Table 4 Results for the Spontaneous Investment per train mile (N=74)
Random Effects (GEE♣)
Independent variable (1) (2) (3) (4) (5) (6)
Length of Contract (days) -.0001*(.0001)
-.0001*(.0001)
-.0001*(.0001)
-.0001**(.00008)
-.0001*(.00008)
-.0001**(.00008)
Renegotiation of franchiseextension: (0/1)
.612(.687)
.560(.691)
Asset specificity -.397(.848)
-.799(.817)
-.924(.883)
-.925(.764)
Total number ofpassengers/train mile
-.036(.05)
Total passenger miles/trainmile
.003*(.002)
.0003*(.002)
.003*(.002)
.003*(.002)
Horizontal consolidation(0/1)
-.544*(.312)
-.584*(.310)
-.598**(.244)
-.497***(.183)
-.384*(.210)
-.432**(.211)
Coach company ownership .481**(.216)
.460**(.217)
.493**(.196)
.449***(.169)
.313*(.172)
.315*(.172)
Joint ownership (no. ofcompanies owned)
.083(.067)
.071(.063)
.083(.062)
.082(.055)
.080(.059)
Vertical consolidation (0/1) .404(.361)
.509(.335)
.402(.312)
Subsidy remaining/train mile(£/mile)
-.0004(.001)
-.00004(.0001)
-.00007(.001)
Profits per train mile(£/mile)
.00006(.00009)
.00006(.00008)
.00009(.00008)
.0001(.00008)
.0002**(.0001)
.0002**(.0001)
Committed Investment pertrain mile (£/mile)
-.010**(.005)
-.009*(.004)
-.003(.005)
-.005(.004)
Time dummy: t99 .40(.281)
.409(.284)
.339(.298)
Constant -.166(.739)
-.42(.63)
-.453(.654)
.562(.576)
-.20(.33)
-.26(.33)
χ2 116.6*** 57.28*** 47.72*** 19.52*** 10.41* 9.53* Robust standard errors in parentheses.+ eliminated from the estimations (<50 data points); * p <0.10, ** p <0.05, *** p <0.01.♣ Liang and Zeger (1986).