INVESTMENT COUNTRY PROFILES TUNISIA -...
20
INVESTMENT COUNTRY PROFILES TUNISIA UNITED NATIONS CONFERENCE ON TRADE AND DEVELOPMENT February 2012
Transcript of INVESTMENT COUNTRY PROFILES TUNISIA -...

INVESTMENTCOUNTRY PROFILESTUNISIA
U n i t e d n at i o n s C o n f e r e n C e o n t r a d e a n d d e v e l o p m e n t
February 2012
NOTE
The Division on Investment and Enterprise of UNCTAD is a global centre of excellence, dealing with issues related to investment and enterprise development in the United Nations System. It builds on three and a half decades of experience and international expertise in research and policy analysis, intergovernmental consensus building, and provides technical assistance to developing countries.
The terms country/economy as used in this investment country profile also refer, as appropriate, to territories or areas; the designations employed and the presentation of the material do not imply the expression of any opinion whatsoever on the part of the Secretariat of the United Nations concerning the legal status of any country, territory, city or area or of its authorities, or concerning the delimitation of its frontiers or boundaries. In addition, the designations of country groups are intended solely for statistical or analytical convenience and do not necessarily express a judgment about the stage of development reached by a particular country or area in the development process. The major country groupings used in this investment country profile follow the classification of the United Nations Statistical Office. These are:
Developed countries: the member countries of the OECD (other than Chile, Mexico, the Republic of Korea and Turkey), plus the new European Union member countries which are not OECD members (Bulgaria, Cyprus, Latvia, Lithuania, Malta, and Romania), plus Andorra, Liechtenstein, Monaco and San Marino.
Transition economies: South-East Europe and the Commonwealth of Independent States.
Developing economies: in general all economies not specified above. For statistical purposes, the data for China do not include those for Hong Kong Special Administrative Region (Hong Kong SAR), Macao Special Administrative Region (Macao SAR) and Taiwan Province of China.
Reference to companies and their activities should not be construed as an endorsement by UNCTAD of those companies or their activities.
The boundaries and names shown and designations used on the maps presented in this publication do not imply official endorsement or acceptance by the United Nations.
The following symbols have been used in the tables:
• Two dots (..) indicate that data are not available or are not separately reported. Rows in tables have been omitted in those cases where no data are available for any of the elements in the row;
• A dash (–) indicates that the item is equal to zero or its value is negligible; • A blank in a table indicates that the item is not applicable, unless otherwise indicated; • A slash (/) between dates representing years, e.g., 1994/95, indicates a financial year; • Use of an en dash (–) between dates representing years, e.g., 1994–1995, signifies the full
period involved, including the beginning and end years; • Reference to “dollars” ($) means United States dollars, unless otherwise indicated; • Annual rates of growth or change, unless otherwise stated, refer to annual compound rates;
Details and percentages in tables do not necessarily add up to totals because of rounding.
Only tables shaded in the Table of Contents are available in this investment country profile.
The material contained in this study may be freely quoted with appropriate acknowledgement.
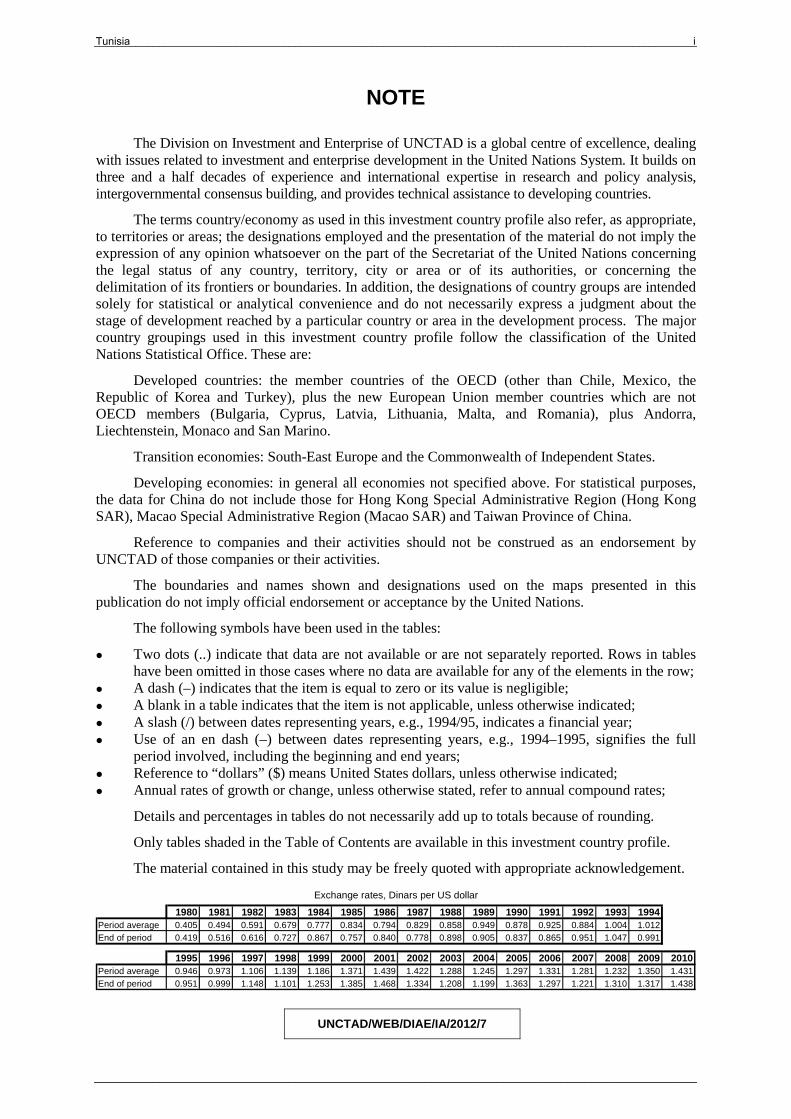
1980 1981 1982 1983 1984 1985 1986 1987 1988 1989 1990 1991 1992 1993 1994Period average 0.405 0.494 0.591 0.679 0.777 0.834 0.794 0.829 0.858 0.949 0.878 0.925 0.884 1.004 1.012End of period 0.419 0.516 0.616 0.727 0.867 0.757 0.840 0.778 0.898 0.905 0.837 0.865 0.951 1.047 0.991
1995 1996 1997 1998 1999 2000 2001 2002 2003 2004 2005 2006 2007 2008 2009 2010Period average 0.946 0.973 1.106 1.139 1.186 1.371 1.439 1.422 1.288 1.245 1.297 1.331 1.281 1.232 1.350 1.431End of period 0.951 0.999 1.148 1.101 1.253 1.385 1.468 1.334 1.208 1.199 1.363 1.297 1.221 1.310 1.317 1.438
Exchange rates, Dinars per US dollar
UNCTAD/WEB/DIAE/IA/2012/7
Tunisia______________________________________________________________________________________________________i
______________________________________________________________________________________________________
Page
Highlights 1
2
Table 1. Summary of FDI..................................................................................................................................... 3
Table 2. Summary of international production...................................................................................................... 3
Table 3. FDI flows, by type of investment............................................................................................................. 4
Table 4. FDI stocks, by type of investment........................................................................................................... 5
Table 5. FDI flows in the host economy, by industry............................................................................................. 6
Table 6. FDI flows in the host economy, by geographical origin........................................................................... 7
Table 7. FDI flows in the host economy, by industry and geographical origin....................................................... 8
Table 8. FDI flows abroad, by industry.................................................................................................................
Table 9. FDI flows abroad, by geographical destination....................................................................................... 9
Table 11. FDI stocks in the host economy, by industry.........................................................................................
Table 12. FDI stocks in the host economy, by geographical origin.......................................................................
Table 14. FDI stocks abroad, by industry.............................................................................................................
Table 15. FDI stocks abroad, by geographical destination...................................................................................
Table 19. The number of home-based TNCs, by industry in the home economy..................................................
Table 20. The number of foreign affiliates of home-based TNCs, by industry abroad...........................................
Table 21. The number of foreign affiliates of home-based TNCs, by geographical destination.............................
Table 22. The number of affiliates of foreign TNCs in the host economy, by industry........................................... 10
Table 23. The number of affiliates of foreign TNCs in the host economy, by geographical origin......................... 11
Table 26. Assets of home-based TNCs, by industry in the home economy..........................................................
Table 27. Assets of foreign affiliates of home-based TNCs, by industry abroad...................................................
Table 21. Assets of foreign affiliates of home-based TNCs, by geographical destination.....................................
Table 29. Assets of affiliates of foreign TNCs in the host economy, by industry...................................................
Table 30. Assets of affiliates of foreign TNCs in the host economy, by geographical origin..................................
Table 19. Employment of home-based TNCs, by industry in the home economy.................................................
Table 32. Employment of foreign affiliates of home-based TNCs, by industry abroad..........................................
Table 33. Employment of foreign affiliates of home-based TNCs, by geographical destination............................
Table 34. Employment of affiliates of foreign TNCs in the host economy, by industry.......................................... 12
Table 35. Employment of affiliates of foreign TNCs in the host economy, by geographical origin......................... 13
Table 36. Wages and salaries of home-based TNCs, by industry in the home economy......................................
Table 37. Wages and salaries of foreign affiliates of home-based TNCs, by industry abroad...............................
Table 38. Wages and salaries of foreign affiliates of home-based TNCs, by geographical destination.................
Table 39. Wages and salaries of affiliates of foreign TNCs in the host economy, by industry...............................
Table 40. Wages and salaries of affiliates of foreign TNCs in the host economy, by geographical origin.............
Table 41. Sales of home-based TNCs, by industry in the home economy............................................................
Table 42. Sales of foreign affiliates of home-based TNCs, by industry abroad.....................................................
Table 43. Sales of foreign affiliates of home-based TNCs, by geographical destination.......................................
Table 44. Sales of affiliates of foreign TNCs in the host economy, by industry.....................................................
Table 45. Sales of affiliates of foreign TNCs in the host economy, by geographical origin....................................
Table 46. Value added of home-based TNCs, by industry in the home economy.................................................
Table 47. Value added of foreign affiliates of home-based TNCs, by industry abroad..........................................
Table 48. Value added of foreign affiliates of home-based TNCs, by geographical destination............................
Table 49. Value added of affiliates of foreign TNCs in the host economy, by industry..........................................
Table of Contents
A. Definitions and sources of data...................................................................................B. Statistics on FDI and the operations of TNCs (shaded rows show available tables)
Tunisia_______________________________________________________________________________________________________________ii
_______________________________________________________________________________________________________________

Table of Contents (continued) Page
Table 50. Value added of affiliates of foreign TNCs in the host economy, by geographical origin.........................
Table 51. Profits after taxes of home-based TNCs, by industry in the home economy.........................................
Table 52. Profits after taxes of foreign affiliates of home-based TNCs, by industry abroad..................................
Table 53. Profits after taxes of foreign affiliates of home-based TNCs, by geographical destination....................
Table 54. Profits after taxes of affiliates of foreign TNCs in the host economy, by industry..................................
Table 55. Profits after taxes of affiliates of foreign TNCs in the host economy, by geographical origin.................
Table 56. Exports of home-based TNCs, by industry in the home economy.........................................................
Table 57. Exports of foreign affiliates of home-based TNCs, by industry abroad..................................................
Table 58. Exports of foreign affiliates of home-based TNCs, by geographical destination....................................
Table 59. Exports of affiliates of foreign TNCs in the host economy, by industry..................................................
Table 60. Exports of affiliates of foreign TNCs in the host economy, by geographical origin................................
Table 61. Imports of home-based TNCs, by industry in the home economy.........................................................
Table 62. Imports of foreign affiliates of home-based TNCs, by industry abroad..................................................
Table 63. Imports of foreign affiliates of home-based TNCs, by geographical destination....................................
Table 64. Imports of affiliates of foreign TNCs in the host economy, by industry..................................................
Table 65. Imports of affiliates of foreign TNCs in the host economy, by geographical origin.................................
Table 66. R&D of home-based TNCs, by industry in the home economy.............................................................
Table 67. R&D of foreign affiliates of home-based TNCs, by industry abroad......................................................
Table 68. R&D of foreign affiliates of home-based TNCs, by geographical destination.........................................
Table 69. R&D of affiliates of foreign TNCs in the host economy, by industry......................................................
Table 70. R&D of affiliates of foreign TNCs in the host economy, by geographical origin.....................................
Table 71. Employment in R&D of home-based TNCs, by industry in the home economy.....................................
Table 72. Employment in R&D of foreign affiliates of home-based TNCs, by industry abroad..............................
Table 73. Employment in R&D of foreign affiliates of home-based TNCs, by geographical destination................
Table 74. Employment in R&D of affiliates of foreign TNCs in the host economy, by industry..............................
Table 75. Employment in R&D of affiliates of foreign TNCs in the host economy, by geographical origin.............
Table 76. Royalty receipts of home-based TNCs, by industry in the home economy............................................
Table 77. Royalty receipts of foreign affiliates of home-based TNCs, by industry abroad.....................................
Table 78. Royalty receipts of foreign affiliates of home-based TNCs, by geographical destination.......................
Table 79. Royalty receipts of affiliates of foreign TNCs in the host economy, by industry.....................................
Table 80. Royalty receipts of affiliates of foreign TNCs in the host economy, by geographical origin....................
Table 81. Royalty payments of home-based TNCs, by industry in the home economy.........................................
Table 82. Royalty payments of foreign affiliates of home-based TNCs, by industry abroad..................................
Table 83. Royalty payments of foreign affiliates of home-based TNCs, by geographical destination....................
Table 84. Royalty payments of affiliates of foreign TNCs in the host economy, by industry..................................
Table 85. Royalty payments of affiliates of foreign TNCs in the host economy, by geographical origin.................
Table 86. Largest home-based TNCs.................................................................................................................... 14
Table 87. Largest foreign affiliates of home-based TNCs...................................................................................... 15
Table 88. Largest affiliates of foreign TNCs in the host economy.......................................................................... 16
Tunisia_______________________________________________________________________________________________________________iii
_______________________________________________________________________________________________________________
Highlights
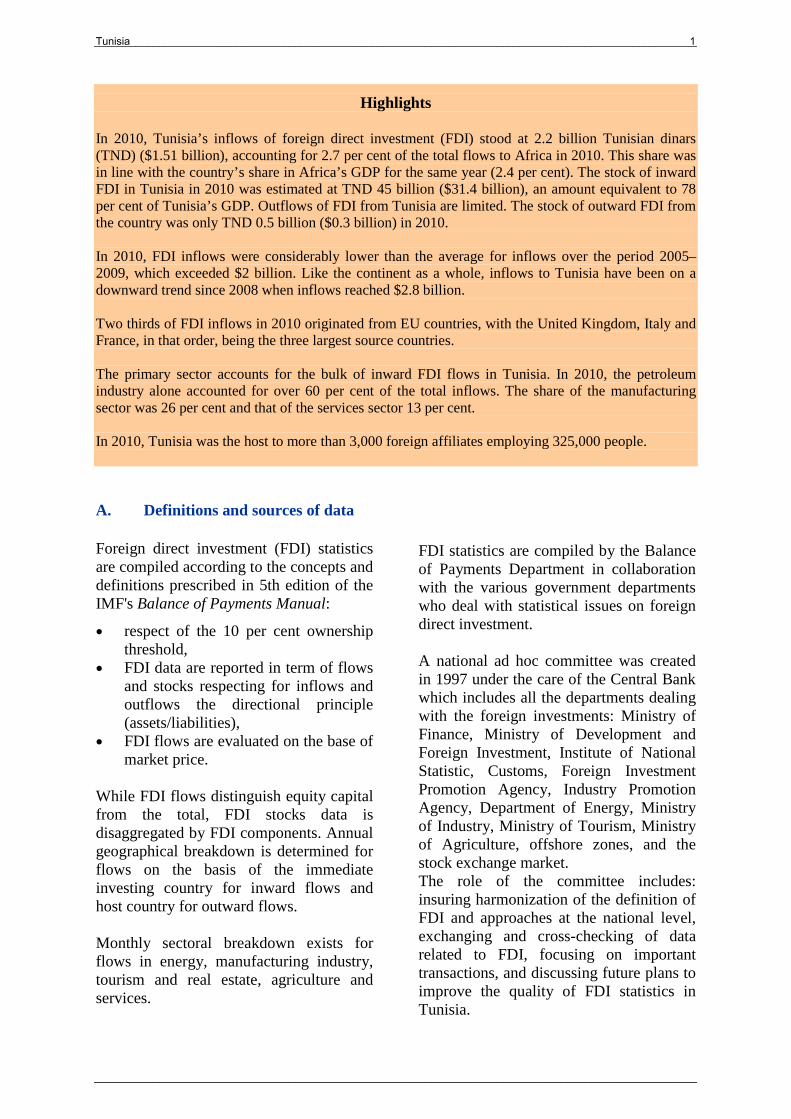
In 2010, Tunisia’s inflows of foreign direct investment (FDI) stood at 2.2 billion Tunisian dinars (TND) ($1.51 billion), accounting for 2.7 per cent of the total flows to Africa in 2010. This share was in line with the country’s share in Africa’s GDP for the same year (2.4 per cent). The stock of inward FDI in Tunisia in 2010 was estimated at TND 45 billion ($31.4 billion), an amount equivalent to 78 per cent of Tunisia’s GDP. Outflows of FDI from Tunisia are limited. The stock of outward FDI from the country was only TND 0.5 billion ($0.3 billion) in 2010. In 2010, FDI inflows were considerably lower than the average for inflows over the period 2005–2009, which exceeded $2 billion. Like the continent as a whole, inflows to Tunisia have been on a downward trend since 2008 when inflows reached $2.8 billion. Two thirds of FDI inflows in 2010 originated from EU countries, with the United Kingdom, Italy and France, in that order, being the three largest source countries. The primary sector accounts for the bulk of inward FDI flows in Tunisia. In 2010, the petroleum industry alone accounted for over 60 per cent of the total inflows. The share of the manufacturing sector was 26 per cent and that of the services sector 13 per cent. In 2010, Tunisia was the host to more than 3,000 foreign affiliates employing 325,000 people.
A. Definitions and sources of data Foreign direct investment (FDI) statistics are compiled according to the concepts and definitions prescribed in 5th edition of the IMF's Balance of Payments Manual:
• respect of the 10 per cent ownership threshold,
• FDI data are reported in term of flows and stocks respecting for inflows and outflows the directional principle (assets/liabilities),
• FDI flows are evaluated on the base of market price.
While FDI flows distinguish equity capital from the total, FDI stocks data is disaggregated by FDI components. Annual geographical breakdown is determined for flows on the basis of the immediate investing country for inward flows and host country for outward flows. Monthly sectoral breakdown exists for flows in energy, manufacturing industry, tourism and real estate, agriculture and services.
FDI statistics are compiled by the Balance of Payments Department in collaboration with the various government departments who deal with statistical issues on foreign direct investment. A national ad hoc committee was created in 1997 under the care of the Central Bank which includes all the departments dealing with the foreign investments: Ministry of Finance, Ministry of Development and Foreign Investment, Institute of National Statistic, Customs, Foreign Investment Promotion Agency, Industry Promotion Agency, Department of Energy, Ministry of Industry, Ministry of Tourism, Ministry of Agriculture, offshore zones, and the stock exchange market. The role of the committee includes: insuring harmonization of the definition of FDI and approaches at the national level, exchanging and cross-checking of data related to FDI, focusing on important transactions, and discussing future plans to improve the quality of FDI statistics in Tunisia.
Tunisia______________________________________________________________________________________________________1
______________________________________________________________________________________________________
Efforts are underway to ensure that data collection techniques evolve in accordance with the different stages of liberalization of financial transactions. FDI statistics result from the combination and cross-checking of various data sources:
• International transaction reporting system (ITRS): settlements statement prepared on the basis of the financial operations carried out by the Central Bank of Tunisia and resident financial institutions,
• Customs and National Institute Statistics: investments in the form of equipments imported from abroad,
• Industry Surveys: monthly surveys are conducted by governmental departments, members of the FDI ad hoc committee, which collect relating data in manufacturing industry, energy, tourism, agriculture and offshore zones. The surveys results are communicated to the Central Bank.
• Transactions on the stock exchange market by the foreign direct investor with equity participation of more than 10 per cent.
FDI stock statistics are derived from the accumulation of net annual FDI flows adjusted by the application of a gross fixed capital formation (GFCF) deflator. This method, which allows for a rough approximation of the FDI stock, presents some gaps and needs to be replaced with a survey approach allowing to better estimate the FDI stock in accordance with international accepted standards. FDI data are compiled and disseminated as following: FDI flows are compiled on a monthly basis (preliminary statistics), while FDI stocks on an annual basis. The flows are disseminated two months after the end of the reference period while FDI stocks six months after. The Central Bank of Tunisia future plans include: undertaking a comprehensive review of the available sources, consolidating and improving the FDI surveys within the framework of FDI committee, estimating FDI stocks on the basis of financial statements collected through by sector surveys or delivered by the Ministry of Finance, and reconciling flows and stocks according to international investment position presentation.
Tunisia______________________________________________________________________________________________________2
______________________________________________________________________________________________________
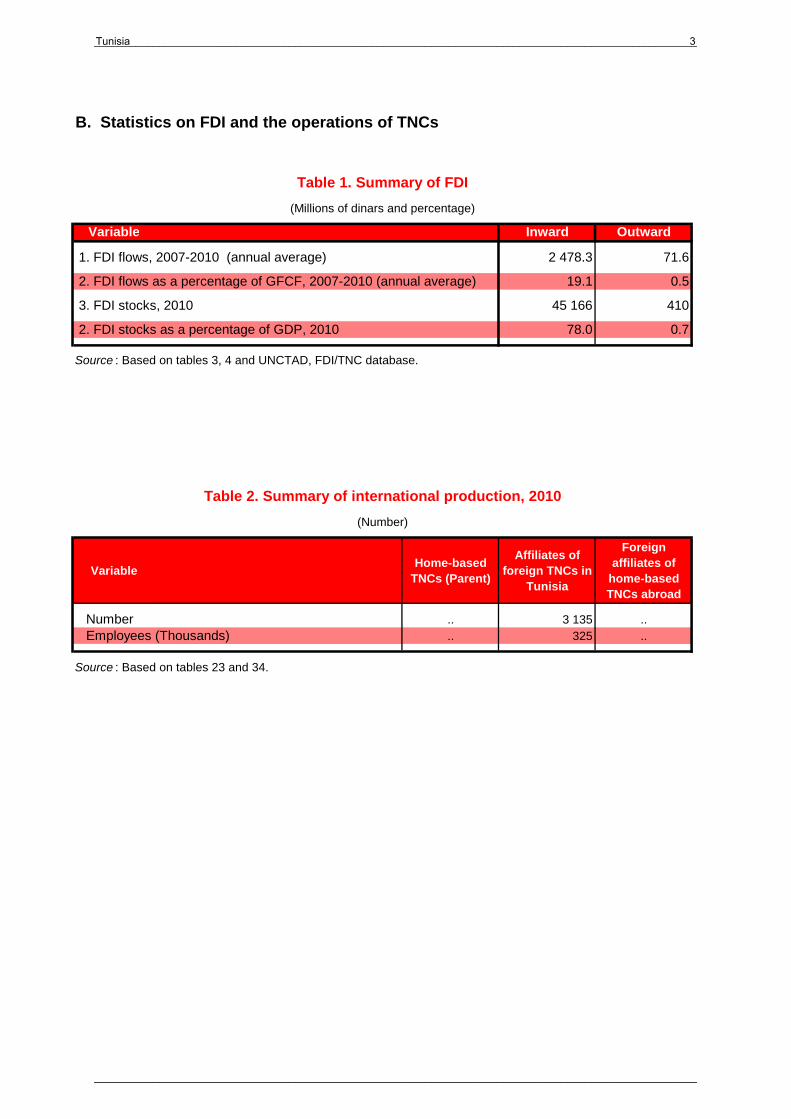
B. Statistics on FDI and the operations of TNCs
Table 1. Summary of FDI
(Millions of dinars and percentage)
Variable Inward Outward
1. FDI flows, 2007-2010 (annual average) 2 478.3 71.6
2. FDI flows as a percentage of GFCF, 2007-2010 (annual average) 19.1 0.5
3. FDI stocks, 2010 45 166 410
2. FDI stocks as a percentage of GDP, 2010 78.0 0.7
Source : Based on tables 3, 4 and UNCTAD, FDI/TNC database.
Table 2. Summary of international production, 2010
(Number)
VariableHome-based
TNCs (Parent)
Affiliates of foreign TNCs in
Tunisia
Foreign affiliates of
home-based TNCs abroad
Number .. 3 135 ..Employees (Thousands) .. 325 ..
Source : Based on tables 23 and 34.
Tunisia______________________________________________________________________________________________________3
______________________________________________________________________________________________________
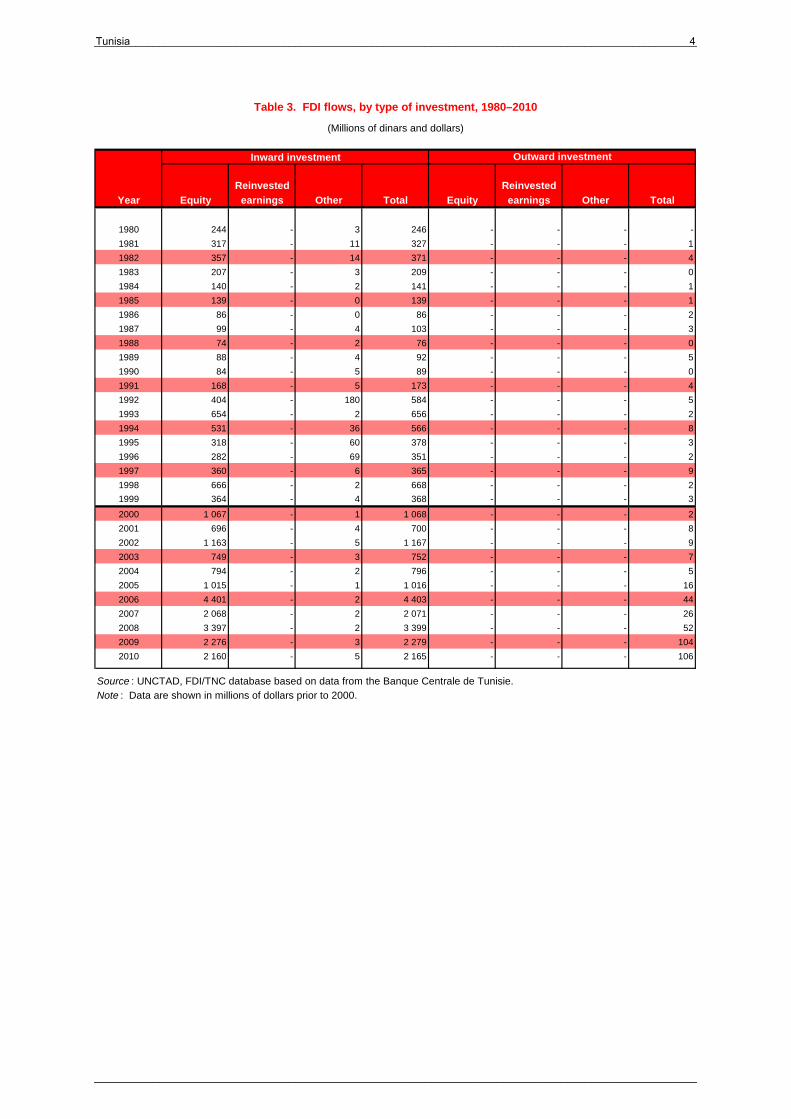
Table 3. FDI flows, by type of investment, 1980–2010
(Millions of dinars and dollars)
Reinvested Reinvested Year Equity earnings Other Total Equity earnings Other Total
1980 244 - 3 246 - - - -
1981 317 - 11 327 - - - 1
1982 357 - 14 371 - - - 4
1983 207 - 3 209 - - - 0
1984 140 - 2 141 - - - 1
1985 139 - 0 139 - - - 1
1986 86 - 0 86 - - - 2
1987 99 - 4 103 - - - 3
1988 74 - 2 76 - - - 0
1989 88 - 4 92 - - - 5
1990 84 - 5 89 - - - 0
1991 168 - 5 173 - - - 4
1992 404 - 180 584 - - - 5
1993 654 - 2 656 - - - 2
1994 531 - 36 566 - - - 8
1995 318 - 60 378 - - - 3
1996 282 - 69 351 - - - 2
1997 360 - 6 365 - - - 9
1998 666 - 2 668 - - - 2
1999 364 - 4 368 - - - 3
2000 1 067 - 1 1 068 - - - 2
2001 696 - 4 700 - - - 8
2002 1 163 - 5 1 167 - - - 9
2003 749 - 3 752 - - - 7
2004 794 - 2 796 - - - 5
2005 1 015 - 1 1 016 - - - 16
2006 4 401 - 2 4 403 - - - 44
2007 2 068 - 2 2 071 - - - 26
2008 3 397 - 2 3 399 - - - 52
2009 2 276 - 3 2 279 - - - 104
2010 2 160 - 5 2 165 - - - 106
Source : UNCTAD, FDI/TNC database based on data from the Banque Centrale de Tunisie.Note : Data are shown in millions of dollars prior to 2000.
Inward investment Outward investment
Tunisia______________________________________________________________________________________________________4
______________________________________________________________________________________________________

Table 4. FDI stocks, by type of investment, 1980–2010
(Millions of dinars and dollars)
Inward investment Outward investmentEquity & Equity &
Reinvested Reinvested Year earnings Other Total earnings Other Total
1980 - - 3 341 - - 6
1981 - - 3 346 - - 7
1982 - - 3 604 - - 8
1983 - - 3 691 - - 7
1984 - - 3 589 - - 6
1985 - - 4 917 - - 6
1986 - - 4 909 - - 7
1987 - - 6 218 - - 10
1988 - - 5 947 - - 8
1989 - - 5 888 - - 13
1990 - - 7 615 - - 15
1991 - - 8 067 - - 20
1992 - - 8 448 - - 23
1993 - - 8 725 - - 23
1994 - - 9 918 - - 31
1995 - - 10 967 - - 30
1996 - - 11 181 - - 29
1997 - - 10 629 - - 32
1998 - - 12 237 - - 34
1999 - - 11 432 - - 33
2000 - - 15 993 - - 46
2001 - - 16 914 - - 47
2002 - - 18 492 - - 49
2003 - - 19 621 - - 52
2004 - - 21 402 - - 56
2005 - - 22 959 - - 71
2006 - - 28 318 - - 115
2007 - - 31 974 - - 143
2008 - - 38 096 - - 202
2009 - - 41 965 - - 306
2010 - - 45 166 - - 410
Source : UNCTAD, FDI/TNC database based on data from the Banque Centrale de Tunisie.Note : Data are shown in millions of dollars prior to 2000.
Tunisia______________________________________________________________________________________________________5
______________________________________________________________________________________________________
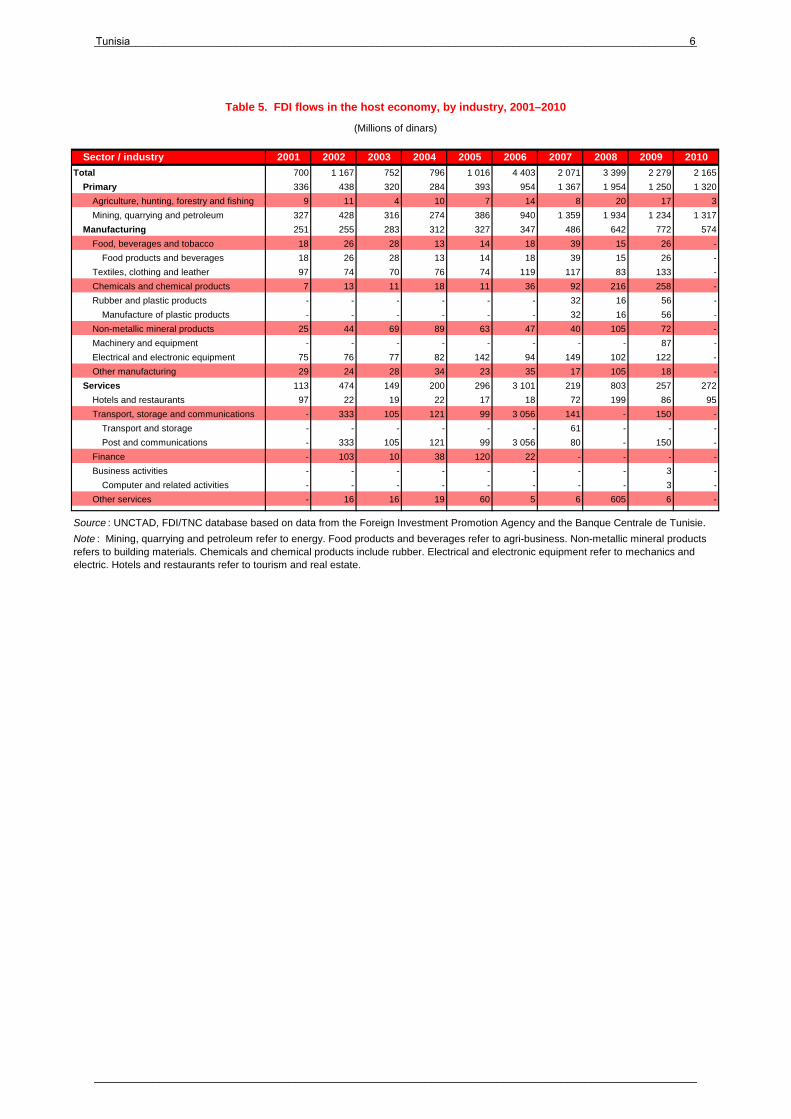
Table 5. FDI flows in the host economy, by industry, 2001–2010
(Millions of dinars)
Sector / industry 2001 2002 2003 2004 2005 2006 2007 2008 2009 2010
Total 700 1 167 752 796 1 016 4 403 2 071 3 399 2 279 2 165
Primary 336 438 320 284 393 954 1 367 1 954 1 250 1 320
Agriculture, hunting, forestry and fishing 9 11 4 10 7 14 8 20 17 3
Mining, quarrying and petroleum 327 428 316 274 386 940 1 359 1 934 1 234 1 317
Manufacturing 251 255 283 312 327 347 486 642 772 574
Food, beverages and tobacco 18 26 28 13 14 18 39 15 26 -
Food products and beverages 18 26 28 13 14 18 39 15 26 -
Textiles, clothing and leather 97 74 70 76 74 119 117 83 133 -
Chemicals and chemical products 7 13 11 18 11 36 92 216 258 -
Rubber and plastic products - - - - - - 32 16 56 -
Manufacture of plastic products - - - - - - 32 16 56 -
Non-metallic mineral products 25 44 69 89 63 47 40 105 72 -
Machinery and equipment - - - - - - - - 87 -
Electrical and electronic equipment 75 76 77 82 142 94 149 102 122 -
Other manufacturing 29 24 28 34 23 35 17 105 18 -
Services 113 474 149 200 296 3 101 219 803 257 272
Hotels and restaurants 97 22 19 22 17 18 72 199 86 95
Transport, storage and communications - 333 105 121 99 3 056 141 - 150 -
Transport and storage - - - - - - 61 - - -
Post and communications - 333 105 121 99 3 056 80 - 150 -
Finance - 103 10 38 120 22 - - - -
Business activities - - - - - - - - 3 -
Computer and related activities - - - - - - - - 3 -
Other services - 16 16 19 60 5 6 605 6 -
Source : UNCTAD, FDI/TNC database based on data from the Foreign Investment Promotion Agency and the Banque Centrale de Tunisie.
Note : Mining, quarrying and petroleum refer to energy. Food products and beverages refer to agri-business. Non-metallic mineral products refers to building materials. Chemicals and chemical products include rubber. Electrical and electronic equipment refer to mechanics and electric. Hotels and restaurants refer to tourism and real estate.
Tunisia______________________________________________________________________________________________________6
______________________________________________________________________________________________________
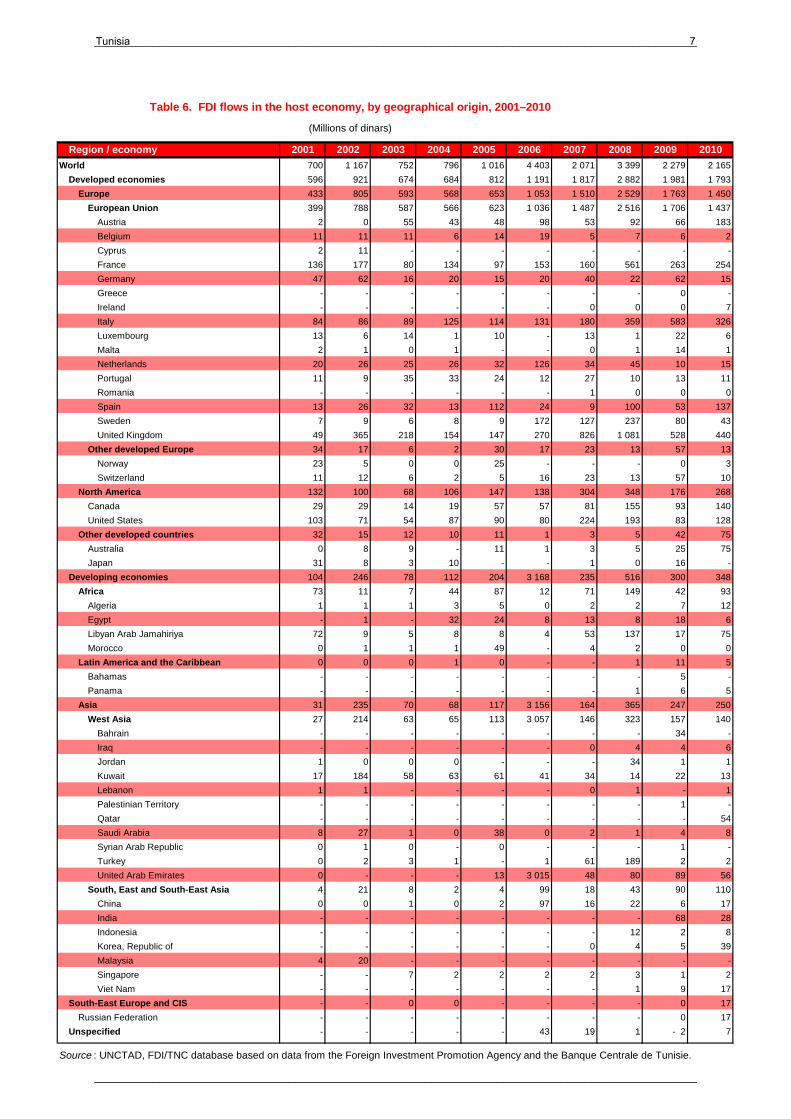
Table 6. FDI flows in the host economy, by geographical origin, 2001–2010
(Millions of dinars)
Region / economy 2001 2002 2003 2004 2005 2006 2007 2008 2009 2010
World 700 1 167 752 796 1 016 4 403 2 071 3 399 2 279 2 165
Developed economies 596 921 674 684 812 1 191 1 817 2 882 1 981 1 793
Europe 433 805 593 568 653 1 053 1 510 2 529 1 763 1 450
European Union 399 788 587 566 623 1 036 1 487 2 516 1 706 1 437
Austria 2 0 55 43 48 98 53 92 66 183
Belgium 11 11 11 6 14 19 5 7 6 2
Cyprus 2 11 - - - - - - - -
France 136 177 80 134 97 153 160 561 263 254
Germany 47 62 16 20 15 20 40 22 62 15
Greece - - - - - - - - 0 -
Ireland - - - - - - 0 0 0 7
Italy 84 86 89 125 114 131 180 359 583 326
Luxembourg 13 6 14 1 10 - 13 1 22 6
Malta 2 1 0 1 - - 0 1 14 1
Netherlands 20 26 25 26 32 126 34 45 10 15
Portugal 11 9 35 33 24 12 27 10 13 11
Romania - - - - - - 1 0 0 0
Spain 13 26 32 13 112 24 9 100 53 137
Sweden 7 9 6 8 9 172 127 237 80 43
United Kingdom 49 365 218 154 147 270 826 1 081 528 440
Other developed Europe 34 17 6 2 30 17 23 13 57 13
Norway 23 5 0 0 25 - - - 0 3
Switzerland 11 12 6 2 5 16 23 13 57 10
North America 132 100 68 106 147 138 304 348 176 268
Canada 29 29 14 19 57 57 81 155 93 140
United States 103 71 54 87 90 80 224 193 83 128
Other developed countries 32 15 12 10 11 1 3 5 42 75
Australia 0 8 9 - 11 1 3 5 25 75
Japan 31 8 3 10 - - 1 0 16 -
Developing economies 104 246 78 112 204 3 168 235 516 300 348
Africa 73 11 7 44 87 12 71 149 42 93
Algeria 1 1 1 3 5 0 2 2 7 12
Egypt - 1 - 32 24 8 13 8 18 6
Libyan Arab Jamahiriya 72 9 5 8 8 4 53 137 17 75
Morocco 0 1 1 1 49 - 4 2 0 0
Latin America and the Caribbean 0 0 0 1 0 - - 1 11 5
Bahamas - - - - - - - - 5 -
Panama - - - - - - - 1 6 5
Asia 31 235 70 68 117 3 156 164 365 247 250
West Asia 27 214 63 65 113 3 057 146 323 157 140
Bahrain - - - - - - - - 34 -
Iraq - - - - - - 0 4 4 6
Jordan 1 0 0 0 - - - 34 1 1
Kuwait 17 184 58 63 61 41 34 14 22 13
Lebanon 1 1 - - - - 0 1 - 1
Palestinian Territory - - - - - - - - 1 -
Qatar - - - - - - - - - 54
Saudi Arabia 8 27 1 0 38 0 2 1 4 8
Syrian Arab Republic 0 1 0 - 0 - - - 1 -
Turkey 0 2 3 1 - 1 61 189 2 2
United Arab Emirates 0 - - - 13 3 015 48 80 89 56
South, East and South-East Asia 4 21 8 2 4 99 18 43 90 110
China 0 0 1 0 2 97 16 22 6 17
India - - - - - - - - 68 28
Indonesia - - - - - - - 12 2 8
Korea, Republic of - - - - - - 0 4 5 39
Malaysia 4 20 - - - - - - - -
Singapore - - 7 2 2 2 2 3 1 2
Viet Nam - - - - - - - 1 9 17
South-East Europe and CIS - - 0 0 - - - - 0 17
Russian Federation - - - - - - - - 0 17
Unspecified - - - - - 43 19 1 - 2 7
Source : UNCTAD, FDI/TNC database based on data from the Foreign Investment Promotion Agency and the Banque Centrale de Tunisie.
Tunisia______________________________________________________________________________________________________7
______________________________________________________________________________________________________
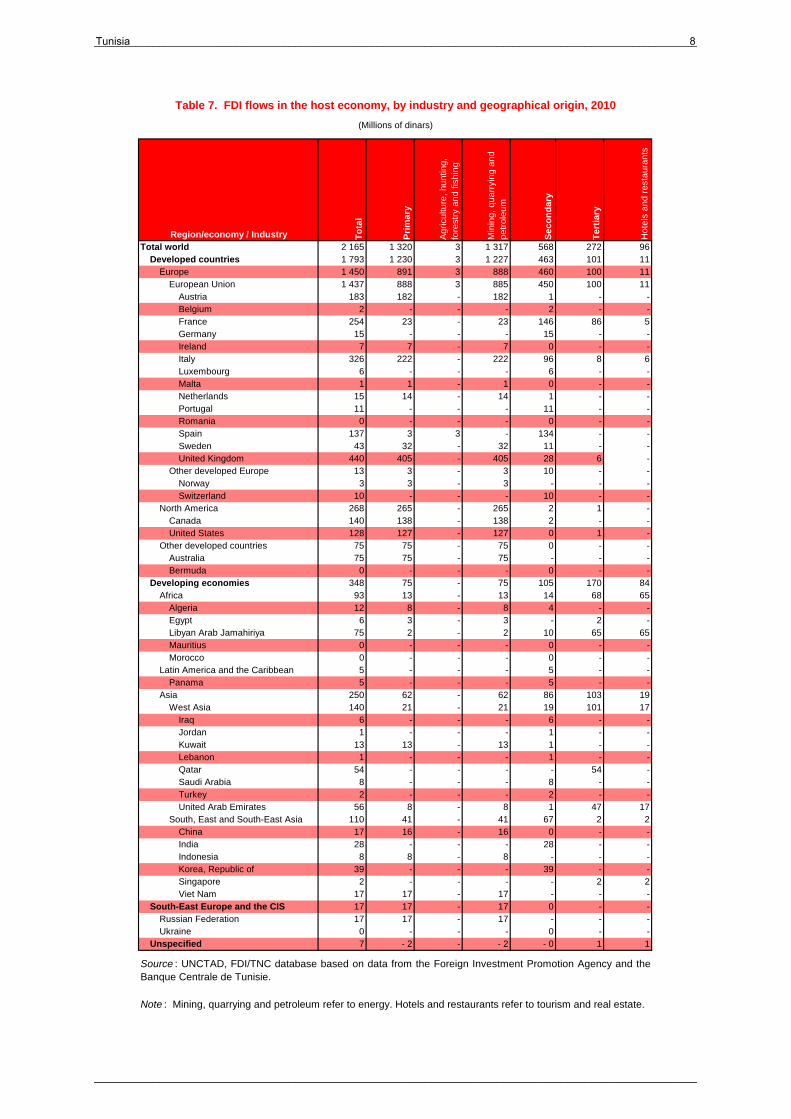
Table 7. FDI flows in the host economy, by industry and geographical origin, 2010
(Millions of dinars)
Region/economy / Industry To
tal
Pri
mar
y
Agr
icul
ture
, hun
ting,
fo
rest
ry a
nd fi
shin
g
Min
ing,
qua
rryi
ng a
nd
petr
oleu
m
Sec
on
dar
y
Ter
tiar
y
Hot
els
and
rest
aura
nts
Total world 2 165 1 320 3 1 317 568 272 96Developed countries 1 793 1 230 3 1 227 463 101 11
Europe 1 450 891 3 888 460 100 11European Union 1 437 888 3 885 450 100 11
Austria 183 182 - 182 1 - -Belgium 2 - - - 2 - -France 254 23 - 23 146 86 5Germany 15 - - - 15 - -Ireland 7 7 - 7 0 - -Italy 326 222 - 222 96 8 6Luxembourg 6 - - - 6 - -Malta 1 1 - 1 0 - -Netherlands 15 14 - 14 1 - -Portugal 11 - - - 11 - -Romania 0 - - - 0 - -Spain 137 3 3 - 134 - -Sweden 43 32 - 32 11 - -United Kingdom 440 405 - 405 28 6 -
Other developed Europe 13 3 - 3 10 - -Norway 3 3 - 3 - - -Switzerland 10 - - - 10 - -
North America 268 265 - 265 2 1 -Canada 140 138 - 138 2 - -United States 128 127 - 127 0 1 -
Other developed countries 75 75 - 75 0 - -Australia 75 75 - 75 - - -Bermuda 0 - - - 0 - -
Developing economies 348 75 - 75 105 170 84Africa 93 13 - 13 14 68 65
Algeria 12 8 - 8 4 - -Egypt 6 3 - 3 - 2 -Libyan Arab Jamahiriya 75 2 - 2 10 65 65Mauritius 0 - - - 0 - -Morocco 0 - - - 0 - -
Latin America and the Caribbean 5 - - - 5 - -Panama 5 - - - 5 - -
Asia 250 62 - 62 86 103 19West Asia 140 21 - 21 19 101 17
Iraq 6 - - - 6 - -Jordan 1 - - - 1 - -Kuwait 13 13 - 13 1 - -Lebanon 1 - - - 1 - -Qatar 54 - - - - 54 -Saudi Arabia 8 - - - 8 - -Turkey 2 - - - 2 - -United Arab Emirates 56 8 - 8 1 47 17
South, East and South-East Asia 110 41 - 41 67 2 2China 17 16 - 16 0 - -India 28 - - - 28 - -Indonesia 8 8 - 8 - - -Korea, Republic of 39 - - - 39 - -Singapore 2 - - - - 2 2Viet Nam 17 17 - 17 - - -
South-East Europe and the CIS 17 17 - 17 0 - -Russian Federation 17 17 - 17 - - -Ukraine 0 - - - 0 - -
Unspecified 7 - 2 - - 2 - 0 1 1
Note : Mining, quarrying and petroleum refer to energy. Hotels and restaurants refer to tourism and real estate.
Source : UNCTAD, FDI/TNC database based on data from the Foreign Investment Promotion Agency and theBanque Centrale de Tunisie.
Tunisia______________________________________________________________________________________________________8
______________________________________________________________________________________________________
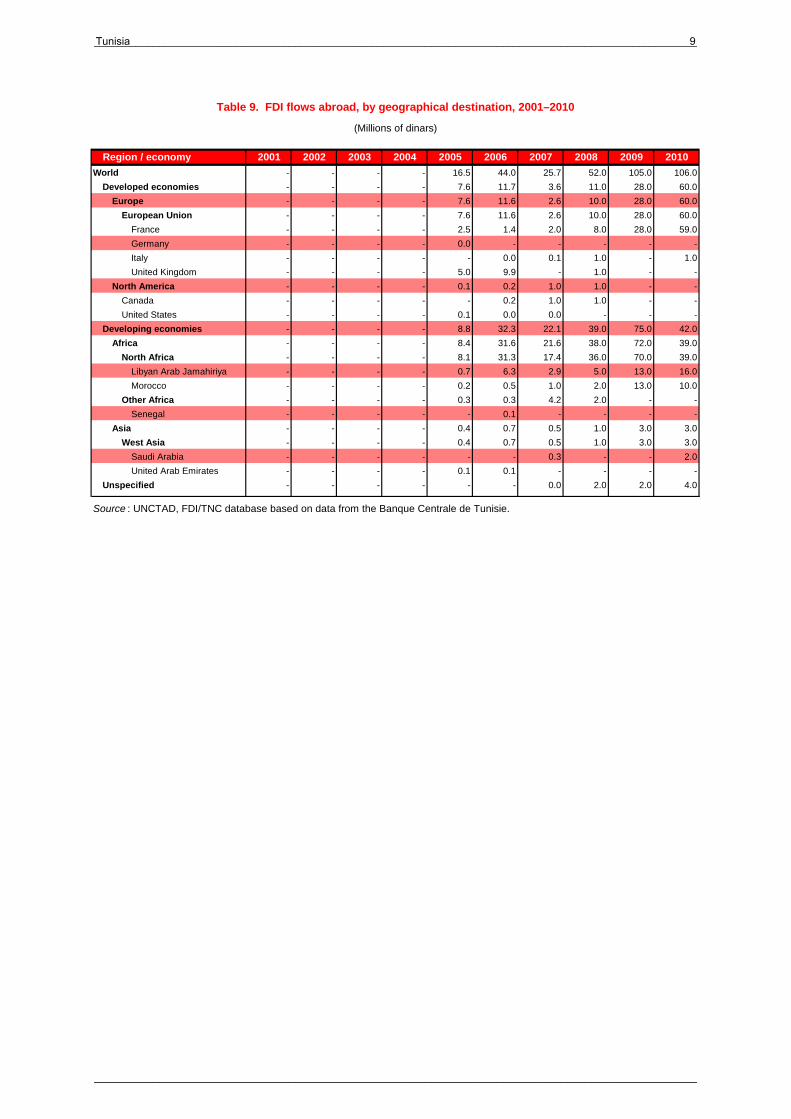
Table 9. FDI flows abroad, by geographical destination, 2001–2010
(Millions of dinars)
Region / economy 2001 2002 2003 2004 2005 2006 2007 2008 2009 2010
World - - - - 16.5 44.0 25.7 52.0 105.0 106.0
Developed economies - - - - 7.6 11.7 3.6 11.0 28.0 60.0
Europe - - - - 7.6 11.6 2.6 10.0 28.0 60.0
European Union - - - - 7.6 11.6 2.6 10.0 28.0 60.0
France - - - - 2.5 1.4 2.0 8.0 28.0 59.0
Germany - - - - 0.0 - - - - -
Italy - - - - - 0.0 0.1 1.0 - 1.0
United Kingdom - - - - 5.0 9.9 - 1.0 - -
North America - - - - 0.1 0.2 1.0 1.0 - -
Canada - - - - - 0.2 1.0 1.0 - -
United States - - - - 0.1 0.0 0.0 - - -
Developing economies - - - - 8.8 32.3 22.1 39.0 75.0 42.0
Africa - - - - 8.4 31.6 21.6 38.0 72.0 39.0
North Africa - - - - 8.1 31.3 17.4 36.0 70.0 39.0
Libyan Arab Jamahiriya - - - - 0.7 6.3 2.9 5.0 13.0 16.0
Morocco - - - - 0.2 0.5 1.0 2.0 13.0 10.0
Other Africa - - - - 0.3 0.3 4.2 2.0 - -
Senegal - - - - - 0.1 - - - -
Asia - - - - 0.4 0.7 0.5 1.0 3.0 3.0
West Asia - - - - 0.4 0.7 0.5 1.0 3.0 3.0
Saudi Arabia - - - - - - 0.3 - - 2.0
United Arab Emirates - - - - 0.1 0.1 - - - -
Unspecified - - - - - - 0.0 2.0 2.0 4.0
Source : UNCTAD, FDI/TNC database based on data from the Banque Centrale de Tunisie.
Tunisia______________________________________________________________________________________________________9
______________________________________________________________________________________________________
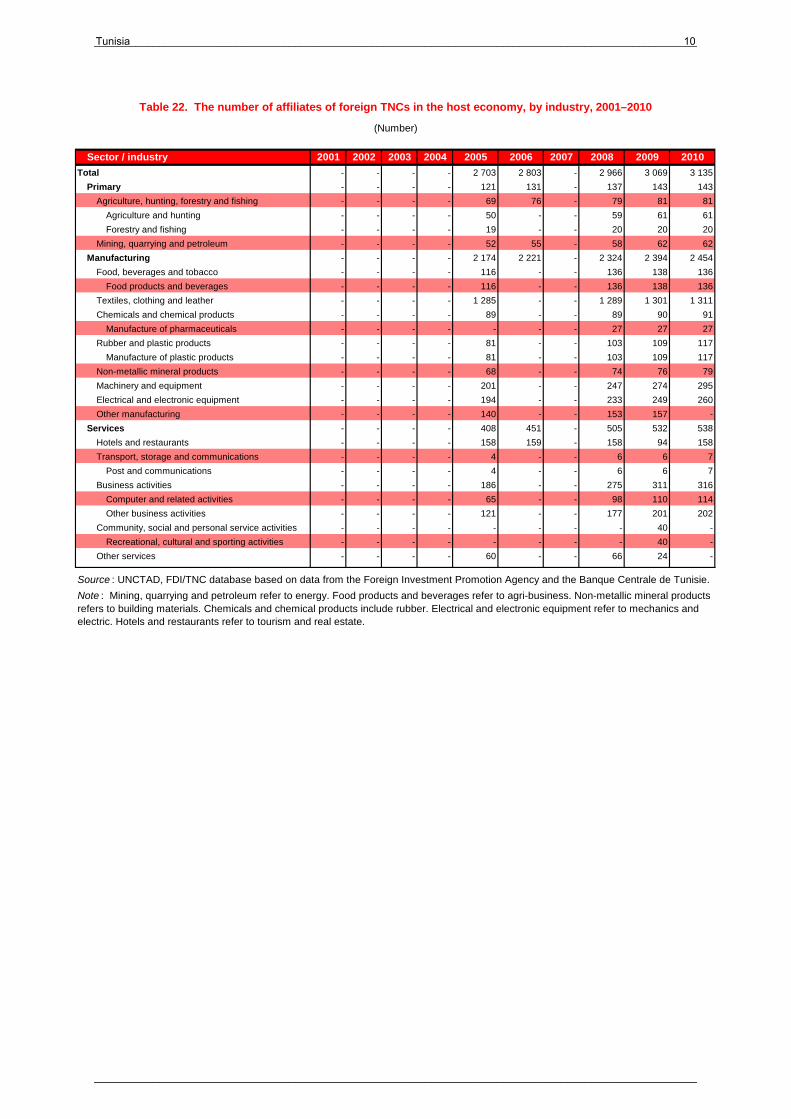
Table 22. The number of affiliates of foreign TNCs in the host economy, by industry, 2001–2010
(Number)
Sector / industry 2001 2002 2003 2004 2005 2006 2007 2008 2009 2010
Total - - - - 2 703 2 803 - 2 966 3 069 3 135
Primary - - - - 121 131 - 137 143 143
Agriculture, hunting, forestry and fishing - - - - 69 76 - 79 81 81
Agriculture and hunting - - - - 50 - - 59 61 61
Forestry and fishing - - - - 19 - - 20 20 20
Mining, quarrying and petroleum - - - - 52 55 - 58 62 62
Manufacturing - - - - 2 174 2 221 - 2 324 2 394 2 454
Food, beverages and tobacco - - - - 116 - - 136 138 136
Food products and beverages - - - - 116 - - 136 138 136
Textiles, clothing and leather - - - - 1 285 - - 1 289 1 301 1 311
Chemicals and chemical products - - - - 89 - - 89 90 91
Manufacture of pharmaceuticals - - - - - - - 27 27 27
Rubber and plastic products - - - - 81 - - 103 109 117
Manufacture of plastic products - - - - 81 - - 103 109 117
Non-metallic mineral products - - - - 68 - - 74 76 79
Machinery and equipment - - - - 201 - - 247 274 295
Electrical and electronic equipment - - - - 194 - - 233 249 260
Other manufacturing - - - - 140 - - 153 157 -
Services - - - - 408 451 - 505 532 538
Hotels and restaurants - - - - 158 159 - 158 94 158
Transport, storage and communications - - - - 4 - - 6 6 7
Post and communications - - - - 4 - - 6 6 7
Business activities - - - - 186 - - 275 311 316
Computer and related activities - - - - 65 - - 98 110 114
Other business activities - - - - 121 - - 177 201 202
Community, social and personal service activities - - - - - - - - 40 -
Recreational, cultural and sporting activities - - - - - - - - 40 -
Other services - - - - 60 - - 66 24 -
Source : UNCTAD, FDI/TNC database based on data from the Foreign Investment Promotion Agency and the Banque Centrale de Tunisie.
Note : Mining, quarrying and petroleum refer to energy. Food products and beverages refer to agri-business. Non-metallic mineral products refers to building materials. Chemicals and chemical products include rubber. Electrical and electronic equipment refer to mechanics and electric. Hotels and restaurants refer to tourism and real estate.
Tunisia______________________________________________________________________________________________________10
______________________________________________________________________________________________________
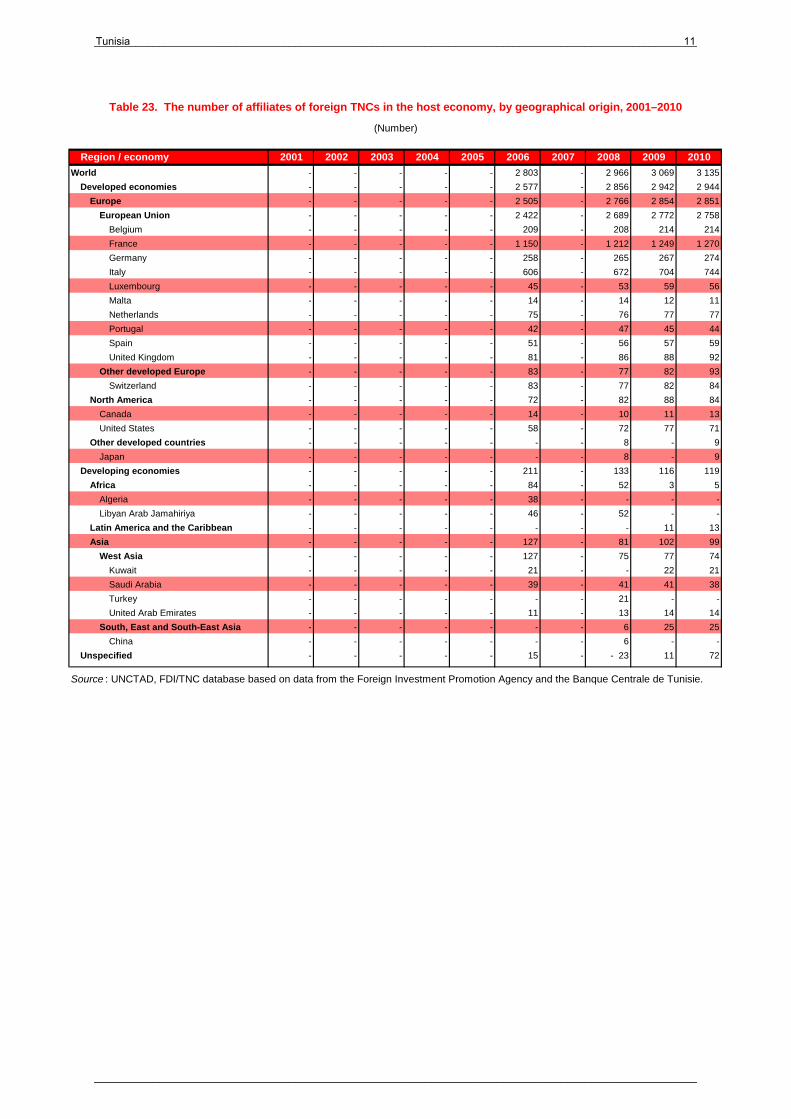
Table 23. The number of affiliates of foreign TNCs in the host economy, by geographical origin, 2001–2010
(Number)
Region / economy 2001 2002 2003 2004 2005 2006 2007 2008 2009 2010
World - - - - - 2 803 - 2 966 3 069 3 135
Developed economies - - - - - 2 577 - 2 856 2 942 2 944
Europe - - - - - 2 505 - 2 766 2 854 2 851
European Union - - - - - 2 422 - 2 689 2 772 2 758
Belgium - - - - - 209 - 208 214 214
France - - - - - 1 150 - 1 212 1 249 1 270
Germany - - - - - 258 - 265 267 274
Italy - - - - - 606 - 672 704 744
Luxembourg - - - - - 45 - 53 59 56
Malta - - - - - 14 - 14 12 11
Netherlands - - - - - 75 - 76 77 77
Portugal - - - - - 42 - 47 45 44
Spain - - - - - 51 - 56 57 59
United Kingdom - - - - - 81 - 86 88 92
Other developed Europe - - - - - 83 - 77 82 93
Switzerland - - - - - 83 - 77 82 84
North America - - - - - 72 - 82 88 84
Canada - - - - - 14 - 10 11 13
United States - - - - - 58 - 72 77 71
Other developed countries - - - - - - - 8 - 9
Japan - - - - - - - 8 - 9
Developing economies - - - - - 211 - 133 116 119
Africa - - - - - 84 - 52 3 5
Algeria - - - - - 38 - - - -
Libyan Arab Jamahiriya - - - - - 46 - 52 - -
Latin America and the Caribbean - - - - - - - - 11 13
Asia - - - - - 127 - 81 102 99
West Asia - - - - - 127 - 75 77 74
Kuwait - - - - - 21 - - 22 21
Saudi Arabia - - - - - 39 - 41 41 38
Turkey - - - - - - - 21 - -
United Arab Emirates - - - - - 11 - 13 14 14
South, East and South-East Asia - - - - - - - 6 25 25
China - - - - - - - 6 - -
Unspecified - - - - - 15 - - 23 11 72
Source : UNCTAD, FDI/TNC database based on data from the Foreign Investment Promotion Agency and the Banque Centrale de Tunisie.
Tunisia______________________________________________________________________________________________________11
______________________________________________________________________________________________________
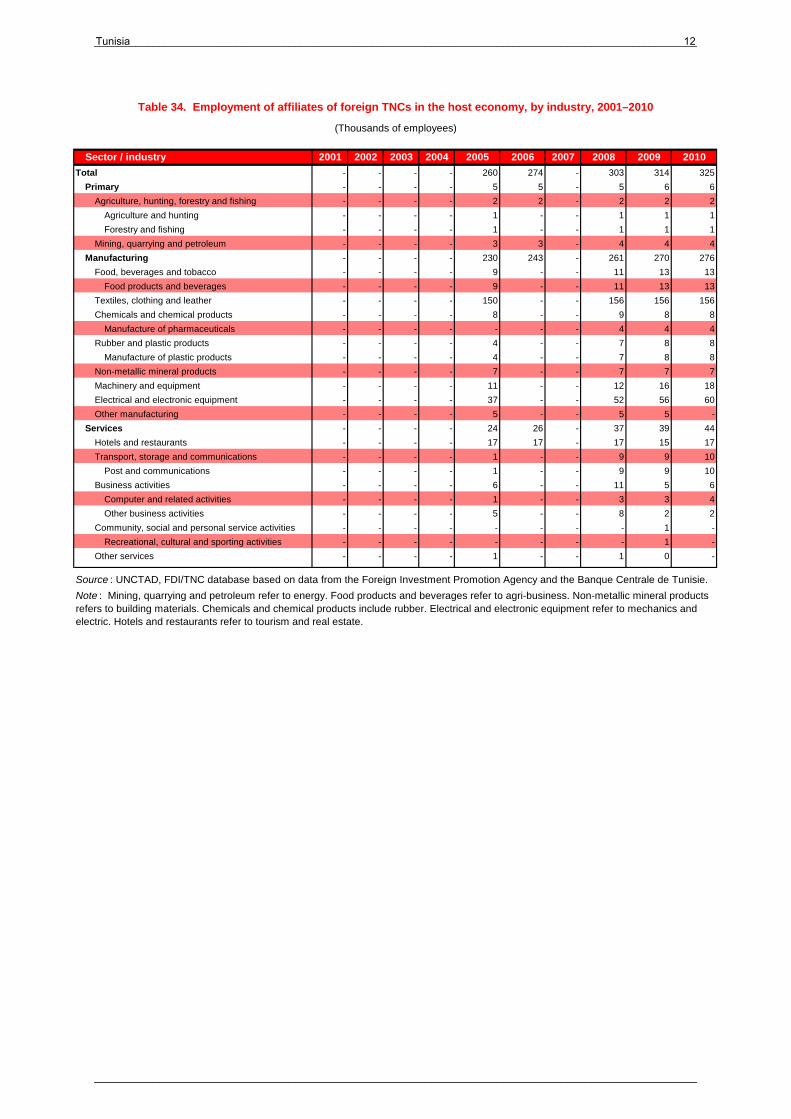
Table 34. Employment of affiliates of foreign TNCs in the host economy, by industry, 2001–2010
(Thousands of employees)
Sector / industry 2001 2002 2003 2004 2005 2006 2007 2008 2009 2010
Total - - - - 260 274 - 303 314 325
Primary - - - - 5 5 - 5 6 6
Agriculture, hunting, forestry and fishing - - - - 2 2 - 2 2 2
Agriculture and hunting - - - - 1 - - 1 1 1
Forestry and fishing - - - - 1 - - 1 1 1
Mining, quarrying and petroleum - - - - 3 3 - 4 4 4
Manufacturing - - - - 230 243 - 261 270 276
Food, beverages and tobacco - - - - 9 - - 11 13 13
Food products and beverages - - - - 9 - - 11 13 13
Textiles, clothing and leather - - - - 150 - - 156 156 156
Chemicals and chemical products - - - - 8 - - 9 8 8
Manufacture of pharmaceuticals - - - - - - - 4 4 4
Rubber and plastic products - - - - 4 - - 7 8 8
Manufacture of plastic products - - - - 4 - - 7 8 8
Non-metallic mineral products - - - - 7 - - 7 7 7
Machinery and equipment - - - - 11 - - 12 16 18
Electrical and electronic equipment - - - - 37 - - 52 56 60
Other manufacturing - - - - 5 - - 5 5 -
Services - - - - 24 26 - 37 39 44
Hotels and restaurants - - - - 17 17 - 17 15 17
Transport, storage and communications - - - - 1 - - 9 9 10
Post and communications - - - - 1 - - 9 9 10
Business activities - - - - 6 - - 11 5 6
Computer and related activities - - - - 1 - - 3 3 4
Other business activities - - - - 5 - - 8 2 2
Community, social and personal service activities - - - - - - - - 1 -
Recreational, cultural and sporting activities - - - - - - - - 1 -
Other services - - - - 1 - - 1 0 -
Source : UNCTAD, FDI/TNC database based on data from the Foreign Investment Promotion Agency and the Banque Centrale de Tunisie.
Note : Mining, quarrying and petroleum refer to energy. Food products and beverages refer to agri-business. Non-metallic mineral products refers to building materials. Chemicals and chemical products include rubber. Electrical and electronic equipment refer to mechanics and electric. Hotels and restaurants refer to tourism and real estate.
Tunisia______________________________________________________________________________________________________12
______________________________________________________________________________________________________
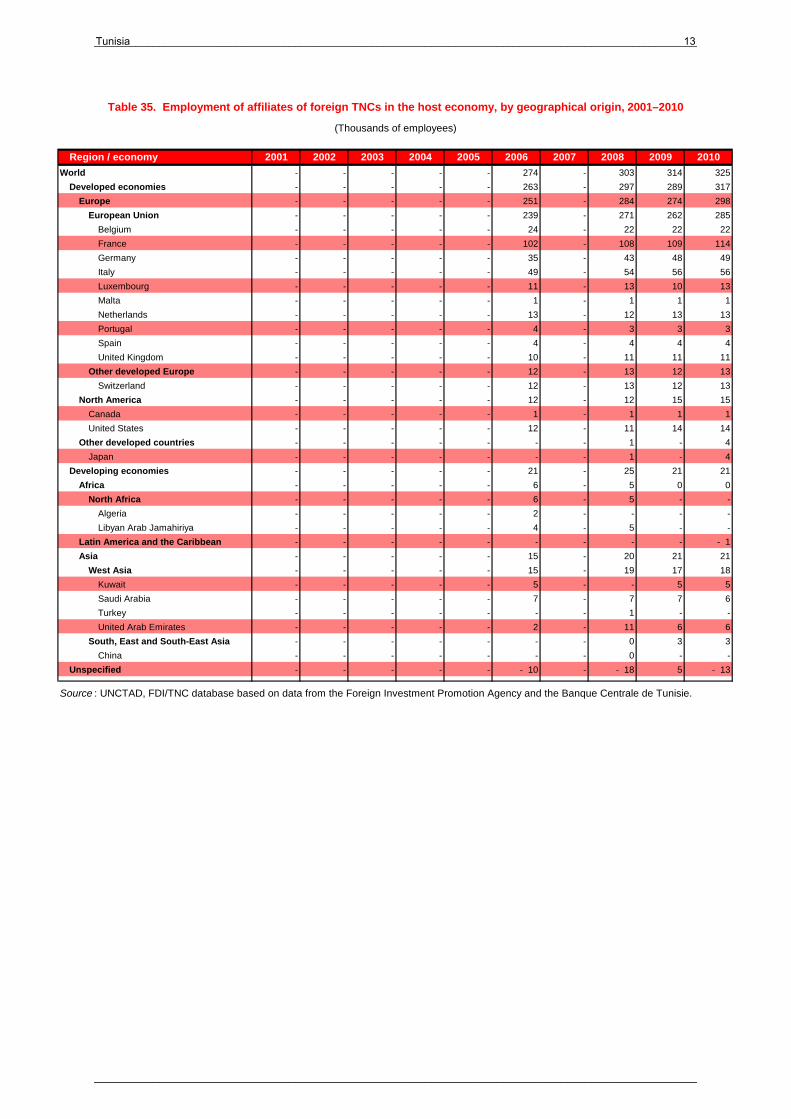
Table 35. Employment of affiliates of foreign TNCs in the host economy, by geographical origin, 2001–2010
(Thousands of employees)
Region / economy 2001 2002 2003 2004 2005 2006 2007 2008 2009 2010
World - - - - - 274 - 303 314 325
Developed economies - - - - - 263 - 297 289 317
Europe - - - - - 251 - 284 274 298
European Union - - - - - 239 - 271 262 285
Belgium - - - - - 24 - 22 22 22
France - - - - - 102 - 108 109 114
Germany - - - - - 35 - 43 48 49
Italy - - - - - 49 - 54 56 56
Luxembourg - - - - - 11 - 13 10 13
Malta - - - - - 1 - 1 1 1
Netherlands - - - - - 13 - 12 13 13
Portugal - - - - - 4 - 3 3 3
Spain - - - - - 4 - 4 4 4
United Kingdom - - - - - 10 - 11 11 11
Other developed Europe - - - - - 12 - 13 12 13
Switzerland - - - - - 12 - 13 12 13
North America - - - - - 12 - 12 15 15
Canada - - - - - 1 - 1 1 1
United States - - - - - 12 - 11 14 14
Other developed countries - - - - - - - 1 - 4
Japan - - - - - - - 1 - 4
Developing economies - - - - - 21 - 25 21 21
Africa - - - - - 6 - 5 0 0
North Africa - - - - - 6 - 5 - -
Algeria - - - - - 2 - - - -
Libyan Arab Jamahiriya - - - - - 4 - 5 - -
Latin America and the Caribbean - - - - - - - - - - 1
Asia - - - - - 15 - 20 21 21
West Asia - - - - - 15 - 19 17 18
Kuwait - - - - - 5 - - 5 5
Saudi Arabia - - - - - 7 - 7 7 6
Turkey - - - - - - - 1 - -
United Arab Emirates - - - - - 2 - 11 6 6
South, East and South-East Asia - - - - - - - 0 3 3
China - - - - - - - 0 - -
Unspecified - - - - - - 10 - - 18 5 - 13
Source : UNCTAD, FDI/TNC database based on data from the Foreign Investment Promotion Agency and the Banque Centrale de Tunisie.
Tunisia______________________________________________________________________________________________________13
______________________________________________________________________________________________________
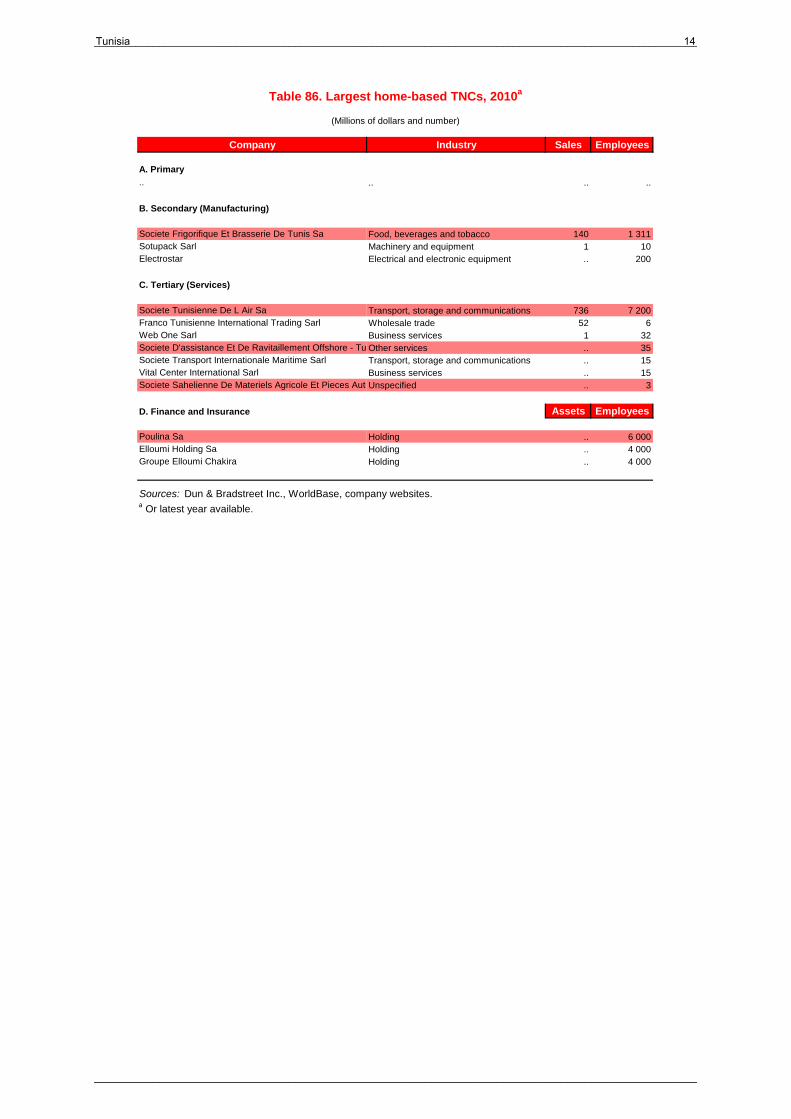
Company Industry Sales Employees
A. Primary.. .. .. ..
B. Secondary (Manufacturing)
Societe Frigorifique Et Brasserie De Tunis Sa Food, beverages and tobacco 140 1 311Sotupack Sarl Machinery and equipment 1 10Electrostar Electrical and electronic equipment .. 200
C. Tertiary (Services)
Societe Tunisienne De L Air Sa Transport, storage and communications 736 7 200Franco Tunisienne International Trading Sarl Wholesale trade 52 6Web One Sarl Business services 1 32Societe D'assistance Et De Ravitaillement Offshore - TunOther services .. 35Societe Transport Internationale Maritime Sarl Transport, storage and communications .. 15Vital Center International Sarl Business services .. 15Societe Sahelienne De Materiels Agricole Et Pieces AutoUnspecified .. 3
D. Finance and Insurance Assets Employees
Poulina Sa Holding .. 6 000Elloumi Holding Sa Holding .. 4 000Groupe Elloumi Chakira Holding .. 4 000
Sources: Dun & Bradstreet Inc., WorldBase, company websites.a Or latest year available.
(Millions of dollars and number)
Table 86. Largest home-based TNCs, 2010a
Tunisia______________________________________________________________________________________________________14
______________________________________________________________________________________________________
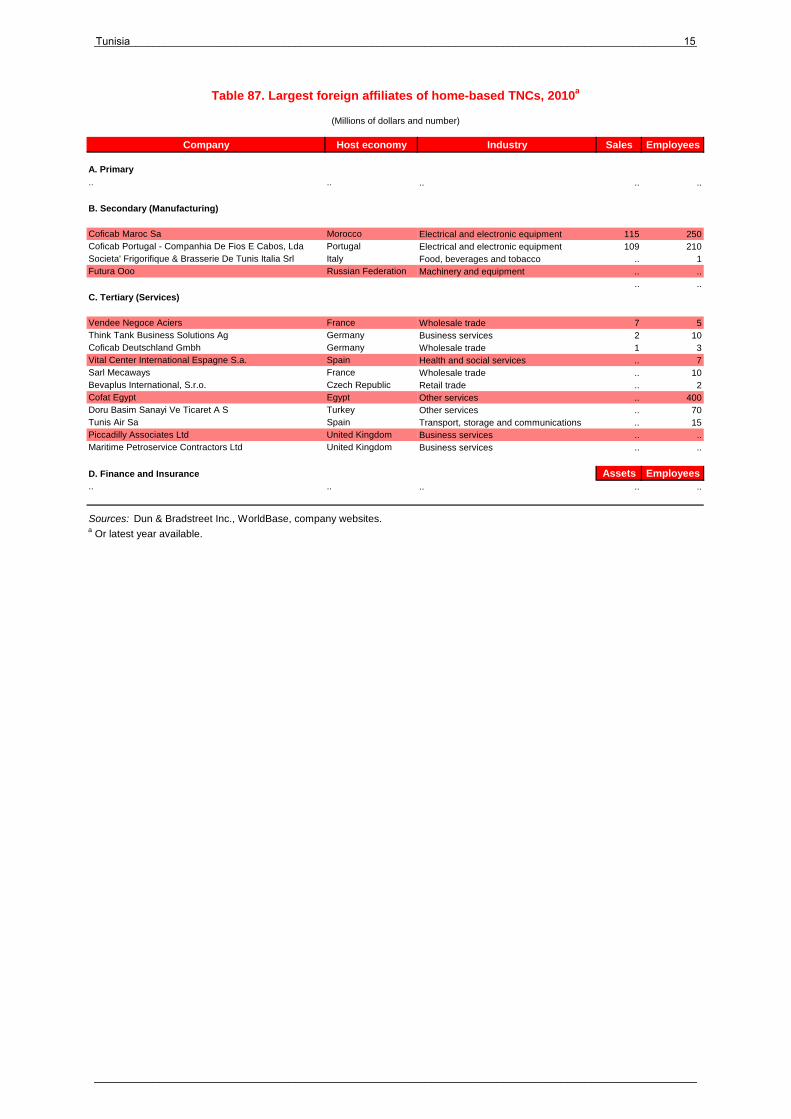
Table 87. Largest foreign affiliates of home-based TNCs, 2010a
Company Host economy Industry Sales Employees
A. Primary.. .. .. .. ..
B. Secondary (Manufacturing)
Coficab Maroc Sa Morocco Electrical and electronic equipment 115 250Coficab Portugal - Companhia De Fios E Cabos, Lda Portugal Electrical and electronic equipment 109 210Societa' Frigorifique & Brasserie De Tunis Italia Srl Italy Food, beverages and tobacco .. 1Futura Ooo Russian Federation Machinery and equipment .. ..
.. ..
C. Tertiary (Services)
Vendee Negoce Aciers France Wholesale trade 7 5Think Tank Business Solutions Ag Germany Business services 2 10Coficab Deutschland Gmbh Germany Wholesale trade 1 3Vital Center International Espagne S.a. Spain Health and social services .. 7Sarl Mecaways France Wholesale trade .. 10Bevaplus International, S.r.o. Czech Republic Retail trade .. 2Cofat Egypt Egypt Other services .. 400Doru Basim Sanayi Ve Ticaret A S Turkey Other services .. 70Tunis Air Sa Spain Transport, storage and communications .. 15Piccadilly Associates Ltd United Kingdom Business services .. ..Maritime Petroservice Contractors Ltd United Kingdom Business services .. ..
D. Finance and Insurance Assets Employees.. .. .. .. ..
Sources: Dun & Bradstreet Inc., WorldBase, company websites.a Or latest year available.
(Millions of dollars and number)
Tunisia______________________________________________________________________________________________________15
______________________________________________________________________________________________________
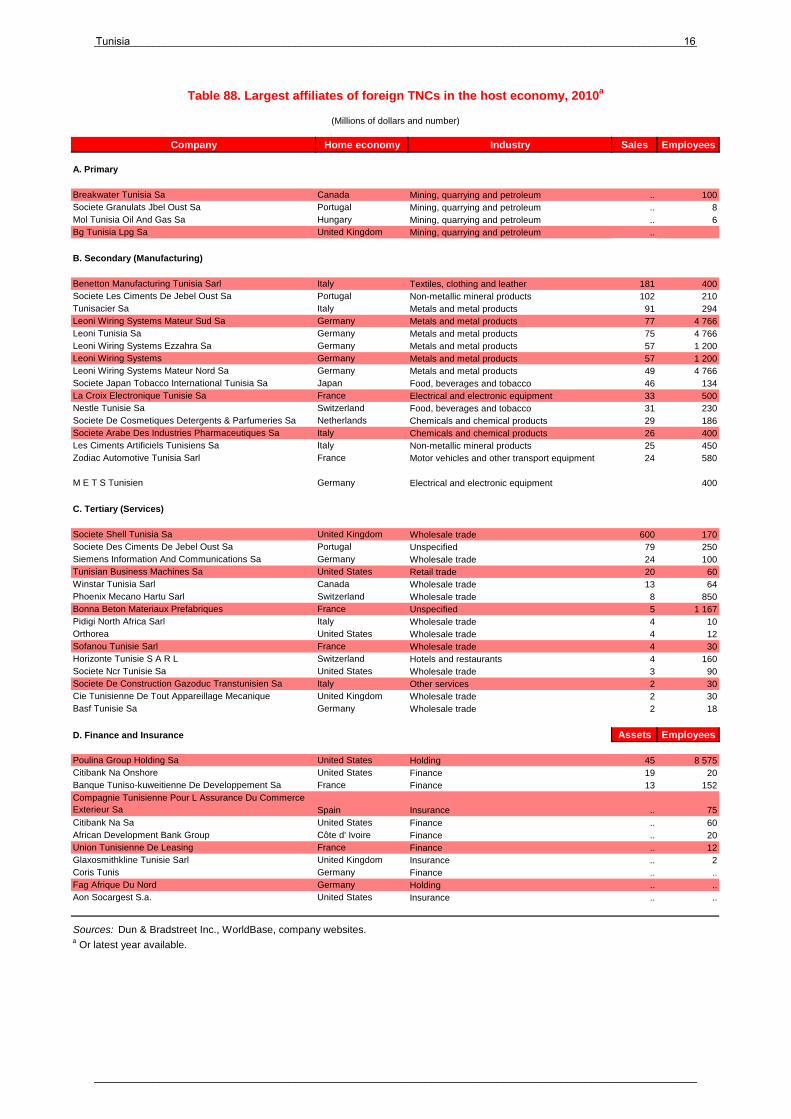
Table 88. Largest affiliates of foreign TNCs in the host economy, 2010a
Company Home economy Industry Sales Employees
A. Primary
Breakwater Tunisia Sa Canada Mining, quarrying and petroleum .. 100Societe Granulats Jbel Oust Sa Portugal Mining, quarrying and petroleum .. 8Mol Tunisia Oil And Gas Sa Hungary Mining, quarrying and petroleum .. 6Bg Tunisia Lpg Sa United Kingdom Mining, quarrying and petroleum ..
B. Secondary (Manufacturing)
Benetton Manufacturing Tunisia Sarl Italy Textiles, clothing and leather 181 400Societe Les Ciments De Jebel Oust Sa Portugal Non-metallic mineral products 102 210Tunisacier Sa Italy Metals and metal products 91 294Leoni Wiring Systems Mateur Sud Sa Germany Metals and metal products 77 4 766Leoni Tunisia Sa Germany Metals and metal products 75 4 766Leoni Wiring Systems Ezzahra Sa Germany Metals and metal products 57 1 200Leoni Wiring Systems Germany Metals and metal products 57 1 200Leoni Wiring Systems Mateur Nord Sa Germany Metals and metal products 49 4 766Societe Japan Tobacco International Tunisia Sa Japan Food, beverages and tobacco 46 134La Croix Electronique Tunisie Sa France Electrical and electronic equipment 33 500Nestle Tunisie Sa Switzerland Food, beverages and tobacco 31 230Societe De Cosmetiques Detergents & Parfumeries Sa Netherlands Chemicals and chemical products 29 186Societe Arabe Des Industries Pharmaceutiques Sa Italy Chemicals and chemical products 26 400Les Ciments Artificiels Tunisiens Sa Italy Non-metallic mineral products 25 450Zodiac Automotive Tunisia Sarl France Motor vehicles and other transport equipment 24 580
M E T S Tunisien Germany Electrical and electronic equipment 400
C. Tertiary (Services)
Societe Shell Tunisia Sa United Kingdom Wholesale trade 600 170Societe Des Ciments De Jebel Oust Sa Portugal Unspecified 79 250Siemens Information And Communications Sa Germany Wholesale trade 24 100Tunisian Business Machines Sa United States Retail trade 20 60Winstar Tunisia Sarl Canada Wholesale trade 13 64Phoenix Mecano Hartu Sarl Switzerland Wholesale trade 8 850Bonna Beton Materiaux Prefabriques France Unspecified 5 1 167Pidigi North Africa Sarl Italy Wholesale trade 4 10Orthorea United States Wholesale trade 4 12Sofanou Tunisie Sarl France Wholesale trade 4 30Horizonte Tunisie S A R L Switzerland Hotels and restaurants 4 160Societe Ncr Tunisie Sa United States Wholesale trade 3 90Societe De Construction Gazoduc Transtunisien Sa Italy Other services 2 30Cie Tunisienne De Tout Appareillage Mecanique United Kingdom Wholesale trade 2 30Basf Tunisie Sa Germany Wholesale trade 2 18
D. Finance and Insurance Assets Employees
Poulina Group Holding Sa United States Holding 45 8 575Citibank Na Onshore United States Finance 19 20Banque Tuniso-kuweitienne De Developpement Sa France Finance 13 152Compagnie Tunisienne Pour L Assurance Du Commerce Exterieur Sa Spain Insurance .. 75Citibank Na Sa United States Finance .. 60African Development Bank Group Côte d' Ivoire Finance .. 20Union Tunisienne De Leasing France Finance .. 12Glaxosmithkline Tunisie Sarl United Kingdom Insurance .. 2Coris Tunis Germany Finance .. ..Fag Afrique Du Nord Germany Holding .. ..Aon Socargest S.a. United States Insurance .. ..
Sources: Dun & Bradstreet Inc., WorldBase, company websites.a Or latest year available.
(Millions of dollars and number)
Tunisia______________________________________________________________________________________________________16
______________________________________________________________________________________________________