
Investment Banker Directors and Capital Raising Activities finance conf/Huang.pdf · Investment...
69
Investment Banker Directors and Capital Raising Activities * Qianqian Huang College of Business City University of Hong Kong Kowloon Tong, HK [email protected] Kai Li Sauder School of Business University of British Columbia 2053 Main Mall, Vancouver, BC V6T 1Z2 [email protected] Ting Xu Sauder School of Business University of British Columbia 2053 Main Mall, Vancouver, BC V6T 1Z2 [email protected] This version: December, 2016 * We are grateful for helpful comments from Xueping Wu and Iftekhar Hasan. Li acknowledges financial support from the Social Sciences and Humanities Research Council of Canada. All errors are ours.
Transcript of Investment Banker Directors and Capital Raising Activities finance conf/Huang.pdf · Investment...

Investment Banker Directors and Capital Raising Activities*
Qianqian Huang
College of Business
City University of Hong Kong
Kowloon Tong, HK
Kai Li
Sauder School of Business
University of British Columbia
2053 Main Mall, Vancouver, BC V6T 1Z2
Ting Xu
Sauder School of Business
University of British Columbia
2053 Main Mall, Vancouver, BC V6T 1Z2
This version: December, 2016
* We are grateful for helpful comments from Xueping Wu and Iftekhar Hasan. Li acknowledges financial support
from the Social Sciences and Humanities Research Council of Canada. All errors are ours.

Investment Banker Directors and Capital Raising Activities
Abstract
We examine how directors with investment banking experience affect firms’ capital raising
activities. We find that firms with investment bankers on their boards have a higher probability of
making seasoned equity offerings (SEOs), and that these offerings are associated with higher
announcement returns, lower underpricing, and lower underwriter spreads. These results are
consistent with the idea that investment banker directors reduce information asymmetry between
issuers and the equity market. We find a limited role of investment banker directors in firms issuing
bonds or obtaining loans, which are less information-sensitive than equity. Overall, our results
highlight the advisory role of specialist directors in shaping corporate policies.
Keywords: Seasoned equity offerings; board of directors; investment banking experience;
information asymmetry; advisory role of directors
JEL Classification: G14, G24, G32
1
I. Introduction
Much of the discussions on corporate boards has centered on their monitoring role, yet boards
spend a significant portion of their time advising rather than monitoring (Adams and Ferreira
(2007) and Adams, Hermalin, and Weisbach (2010)). This leads to some important questions:
Which type of specialist directors can be expected to best serve their advising roles? How do
specialist directors affect corporate policies?
One of the most common specialist directors on corporate boards in the United States is
an investment banker (IB). Investment banks provide a wide range of services in the capital
market. Their primary responsibility is to underwrite securities. They also provide advice about
takeovers, provide earnings forecasts, make stock recommendations, and make a market for a
company’s securities. During our sample period 2000-2014, over a third of U.S. firms have
directors who have had some investment banking experience. Despite the prevalence of
investment banker (IB) directors on U.S. corporate boards, there is a lack of general
understanding of their advisory role in corporate policies (with notable exceptions of Güner,
Malmendier, and Tate (2008) and Huang, Jiang, Lie, and Yang (2014)). In this paper, using a
large hand-collected data set on board composition of over 7,000 firms for the period 2001-2015,
we examine whether and how the presence of this particular type of specialist directors, IB
directors, is related to securities issuances and underwriting activities.
According to Eckbo, Masulis, and Norli (2007), only about one-half of newly public
firms undertake a public security offering of any type (i.e., either debt or equity), and only about
one-quarter undertake a seasoned equity offering (SEO). The relatively rare occurrence of SEOs
is consistent with adverse selection costs driven by information asymmetry (Myers and Majluf
(1984)) being an important consideration when firms raise cash externally. Lee and Masulis

2
(2009) document that SEO announcement returns range between -2% to -3%, and underwriting
fees range between 3% to 8% of gross proceeds, suggesting that such information asymmetry
contributes to a substantial part of SEO flotation costs, which represent an economically
important portion of SEO gross proceeds.
We conjecture that there are a number of ways that IB directors could help mitigate
information asymmetry between an issuer and the equity market. First, as board members, IB
directors have regular access to the Chief Financial Officer (CFO) and/or the Chief Executive
Officer (CEO) of a firm and with whom they could ask probing questions based on their capital
market experience, thereby reducing information asymmetry among corporate insiders (the
management and members of the board) and enabling them to be credible certifiers of firm value.
Second, because IB directors have a similar professional background as the underwriters hired
for capital raising activities, they speak the same language as the underwriters and can
communicate more effectively their inside information about the issuer to the capital market.
This helps improve the informational environment of the issuer and allows it to access capital
markets more easily and cheaply. Third, with their own experience in investment banking, IB
directors have superior knowledge about the industry that allows them to select underwriters that
work the best with the issuer; they also have the expertise to negotiate fees for the underwriting
services. Based on the above arguments, we expect that firms with IB directors do more SEOs,
and more importantly, their SEOs are associated with more positive announcement returns and
lower underwriter spreads.
Our empirical analysis proceeds in the following way. First, we start with both the
BoardEx database and hand-matching to obtain information on whether a director has investment
banking experience for 65,091 directors in 7,036 firms over the period 2000-2014. We find that

3
over the sample period, about a third of U.S. firms have IB directors. Second, we relate the
presence of IB directors to firms’ SEO activities by focusing on the propensity of doing an SEO,
SEO announcement period returns, underpricing, and underwriter gross spreads. We find that
when there are IB directors on their boards, firms are 13.8% more likely to do SEOs. Further, we
find that for an average issuer in our sample, the presence of IB directors is associated with a 70
basis points higher two-day announcement returns, a 50 basis points lower underpricing, and a
5% decrease in gross spreads. In terms of economic significance, an average issuer in our sample
has a market capitalization of $1.59 billion, a 70 basis points higher price reaction corresponds to
value creation of $11.1 million; an average issue in our sample is $131 million, a 50 basis points
lower underpricing corresponds to an increase in proceeds by $0.66 million; and a 5% decrease
in underwriting fees corresponds to a savings of $0.33 million in fees to the issuers.
A key concern for any analysis of director effects is the endogeneity of board
composition. In particular, there could be reverse causality: Instead of IB directors leading firms
to do more SEOs, firms with funding needs may choose to hire directors with investment
banking experience. We take a number of approaches to addressing this endogeneity concern.
First, we instrument for the presence of IB directors on corporate boards using directors’
network—their exposure to IB directors on other boards. Our instrument is the fraction of non-IB
directors on a board who sit (either now or in the past) on other boards on which there are IB
directors. This captures the general connectedness of non-IB directors especially their exposure
to IB directors on other boards.
Second, we identify and remove firm-year observations where IB directors have a tenure
less than three years prior to the SEO offering to address the reverse causality concern that firms

4
strategically hire IB directors for subsequent SEOs. This ensures that IB directors are hired long
before a firm’s capital raising activities and the relation we identify is more likely to be causal.
Finally, in our analysis of offer performance such as underpricing and gross spreads, we
always remove firm-year observations where conflicts of interest might play a significant role,
that is, affiliated IB directors whose employers are the lead underwriters for the SEO. In all
cases, our main findings of the effect of IB directors on SEOs remain unchanged or become
stronger.
We explore possible economic mechanisms through which IB directors help improve
firms’ access to equity markets. We find that the presence of IB directors is associated with a
significantly improved firm informational environment as measured by lower return volatility,
better earnings quality, and smaller analyst forecast error. We further explore the role of IB
directors in issuing securities that are less information-sensitive than equity, including corporate
bonds and bank loans. We find IB directors play a limited role in the bond market and have no
effect in the loan market. These results are consistent with IB directors reducing information
asymmetry between issuers and investors when the pricing of those financial instruments is
information-sensitive.
Finally, we conduct a number of robustness checks on our main findings. We implement
the analysis using a sample of SEOs that include private placements of common equity. Our
main findings remain unchanged. We use the volume and the number of SEO deals to capture
the propensity of doing SEOs and find a similar relation between the presence of IB directors and
the SEO volume. Using a different event window to measure SEO announcement returns, we
still observe the same significant relation between the presence of IB directors and
announcement returns.

5
Our paper contributes to the literature in a number of dimensions. First, our paper
contributes to the growing finance literature that studies the advisory role of corporate directors.
Güner, Malmendier, and Tate (2008) examine how directors with financial expertise affect
corporate decisions including investment, mergers and acquisitions (M&As), bond issues, and
CEO compensation, and conclude that financial expertise on boards may not benefit shareholders
if conflicting interests are present. Huang et al. (2014) examine how directors with investment
banking experience affect firms’ acquisition behavior and find that firms with IB directors do
more deals with higher announcement returns, lower takeover premiums and advisory fees, and
better long-run performance. Huang et al. (2014) focus on the role of IB directors in M&As
through better deal screening and negotiation, while our paper focuses on the role of IB directors
in securities issuances through reducing information asymmetry. As such, our paper
complements prior studies by highlighting a different advisory role of IB directors in one of the
most important corporate policies—capital raising activities.
Second, our paper also contributes to the literature that examines the relation between
personal characteristics of corporate decision makers and corporate policies starting with the
seminal paper by Bertrand and Schoar (2003). For CEOs, there is evidence that their style
(Adams, Almeida, and Ferreira (2005) and Bennedsen, Nielsen, Perez-Gonzalez, and Wolfenzon
(2007)), personal characteristics, or personality traits (Malmendier and Tate (2005, 2008),
Kaplan, Klebanov, and Sorensen (2012), Graham, Harvey, and Puri (2013), and Hirshleifer,
Low, and Teoh (2012)), prior experience (Malmendier, Tate, and Yan (2011), Custodio and
Metzger (2013, 2014), Benmelech and Frydman (2015), Bernile, Bhagwat, and Rau (2015), and
Dittmar and Duchin (2016)), and gender (Huang and Kisgen (2013) and Tate and Yang (2015))
matter in corporate policies. For corporate directors, there is evidence that their expertise and

6
prior experience (Güner, Malmendier, and Tate (2008), Huang et al. (2014), and Adams, Akyol,
and Vewijmeren (2015)), gender (Adams and Ferreira (2009), Ahern and Dittmar (2012), and
Matsa and Miller (2013)), and board diversity (Bernile, Bhagwat, and Yonker (2016) and
Giannetti and Zhao (2016)) matter in corporate policies. We contribute to the literature on
director characteristics by providing new evidence on how directors’ investment banking
experience operates in their firms’ capital raising activities.
Finally, our paper contributes to the voluminous SEO literature. The questions of why we
observe SEO underpricing and how to reduce it are still not fully answered (see, for example,
Altınkılıç and Hansen (2003), Corwin (2003), and the survey by Eckbo, Masulis, and Norli
(2007)). Possible explanations include information asymmetry (Myers and Majluf (1984), and
Lee and Masulis (2009)), price pressure (Scholes (1972)), manipulative trading (Gerard and
Nanda (1993)), transaction cost savings (Loderer, Sheehan, and Kadlec (1991)), and underwriter
pricing practices such as offer-price rounding and pricing at the bid (Lee, Lochhead, Ritter, and
Zhao (1996)). Our paper adds to this literature by showing that one important way to mitigate
information asymmetry in SEOs is to have some capital market expertise on the issuer’s board.
The remainder of the paper is organized as follows. In Section II we discuss sample
formation and provide a sample overview. We examine the role of IB directors in capital raising
activities in Section III. We investigate the underlying mechanisms and provide suggestive
evidence on post-SEO operating and stock performance in Section IV, and conduct additional
investigation in Section V. We conclude in Section VI.
II. Sample Formation and Overview
A. Identifying IB directors

7
The data for our analyses are collected from multiple sources. We start with all U.S.
publicly traded industrial firms (after removing financial (SIC 6000-6999) and utilities (SIC
4910-4940) firms) for the period 2000–2014 from the CRSP/Compustat merged database. To
obtain directors’ background information, we merge the sample with the BoardEx database,
which provides extensive biographical information, such as employment history and educational
background, of corporate directors and senior executives in public and major private firms. We
match CRSP/Compustat with BoardEx based on firm identifiers and firm names. We also
manually check all matches and make necessary adjustment to ensure each CRSP/Compustat
firm is associated with a unique identifier in BoardEx. Our matching procedure yields a sample
of 7,036 unique firms and 61,167 firm-year observations.
To identify directors with investment banking experience, we first rank all investment
banks based on the aggregate deal value of M&As made by U.S. acquirers that they have advised
and equity and bond issues that they have underwritten over the period 1980-2014. We take the
100 most active investment banks by the aggregate deal value and manually match their names
with employer names given in the BoardEx Employment History file.1 When matching, we
account for name changes, mergers and acquisitions, and parent-subsidiary relationships among
investment banks. In the case of financial conglomerates, we use their investment banking arm to
identify investment banking experience whenever possible.
A director serving on the board of a public firm is identified as an IB director if she is an
independent director and is holding, or at some point in her career, has held a senior position at
any of these top 100 investment banks. We define senior position as a top executive position
(e.g., CEO, CFO, Chairman or President) or a senior manager position (e.g., managing director,
1 The 100 most active investment banks are involved in 91% of the aggregate deal value over the period 1980-2014.
Our main findings are unchanged if we use the 50 or 150 most active investment banks.

8
regional CEO/CFO, group executive, or executive president). Junior job titles, such as divisional
vice president, analyst, associate, and consultant, are excluded.
Table 1 provides a list of the ten most active underwriters by the aggregate deal value and
by the number of connected directors at public firms with whom they have shared an
employment relation. As expected, there is a large overlap between the two lists. Figure 1 plots
the time trend of IB directors on corporate boards. IB directors take up about 6% of the board
seats in U.S. public firms and sit on the boards of more than a third of these firms. These
numbers have been steadily increasing over the past decade, suggesting an increasing importance
of IB directors to U.S. firms.
B. The SEO sample
To examine the role of IB directors in a firm’s equity market capital raising activities, we
start with all U.S. SEOs over the period 2001-2015, collected from the Securities Data
Company’s (SDC) Global New Issues database. We remove issues made by financial (SIC 6000-
6999) and utilities (SIC 4910-4940) companies, require issues to be common stock made by U.S.
firms listed on the NYSE, AMEX, or NASDAQ, and exclude units, right offerings, Real Estate
Investment Trusts (REITs), and closed-end funds. We also exclude withdrawn offerings and pure
secondary offerings (or offerings where the information on the percentage of secondary shares
issued is missing). Finally, we remove issues with offer price less than $1.00 to ensure that our
results are not driven by small firms and to prevent bid-ask bounce from contaminating our
analysis on floatation costs later (Blume and Stambaugh (1983)). Our main SEO sample consists

9
of 2,508 deals, three-quarters of which have Rule 415 Shelf Registrations.2 Table 2 Panel A lists
the steps taken to form our SEO sample.3
Table 2 Panel B presents the distribution of SEO deals over time. It shows a big spike in
SEO activities in 2009 that coincides with the end of the financial crisis and the beginning of
economic recovery. The temporal pattern in SEOs around the financial crisis is also confirmed
by Kahle and Stulz (2013).
Announcement period return (CAR) is the cumulative market-adjusted return around the
SEO filing date.4 We estimate CAR over the event window (0, 1),5 using the market model over
a 200-day period ending 11 days before the filing date (day 0) with the return on the CRSP
value-weighted index as the market return.
Underpricing is defined as negative one times the close-to-offer return. This variable is
constructed in such a way that underpricing is positive when the offer price is less than the prior
day’s closing price. Prior work has shown that many SEOs take place after the close of trading
(Safieddine and Wilhelm (1996), Altınkılıç and Hansen (2003), and Corwin (2003)). Following
prior research, we use a volume-based adjustment method to correct for errors in the offer date.
In particular, if trading volume on the day after the SDC offer date is more than twice the trading
2 In March 1982, the Securities and Exchange Commission (SEC) adopted Rule 415 Shelf Registration, which
enabled public companies to sell securities more quickly. Under the Rule, issuers register securities that can be sold
over a two-year period, with offer terms at each sale set based on current market conditions and other factors. In
practice, the SEC has allowed shelf registration statements to remain effective for many years. Since 2005, Rule 415
no longer limit the amount of securities registered on a shelf registration statement to an amount intended to be
offered and sold, but limit the term of each shelf registration to be three years. 3 As a robustness check, our secondary SEO sample consists of 3,168 deals that include private placements of
common stock and Rule 144A resale of securities to qualified institutional buyers. Our main findings remain
unchanged. 4 About three-quarters of the SEOs in our sample are made under the shelf registration. As such, there would be one
formal filing with the SEC and multiple issues after the filing. CAR is measured at the filing (not at the issuance)
following prior literature (Jegadeesh, Weinstein, and Welch (1993), Denis (1994), Datta, Iskandar-Datta, and Roman
(2005), Ferreira and Laux (2016)). The Heckman specification is based on the filing date as well. 5 A search of the Factiva and CapitalIQ database indicates that the announcement day is either the filing day (usually
after market close) or the day following the filing day. Following Ferreira and Laux (2016), our announcement
window covers both the filing day (day 0) and the day after (day 1).

10
volume on the SDC offer date and more than twice the average daily volume over the 250
trading days prior to the SDC offer date, then the day following the SDC offer date is used as the
“correct” offer date.
Gross spread is the dollar gross spread divided by the total proceeds. The dollar gross
spread is the difference between the offer price and the price at which the underwriting syndicate
buys shares from the issuer times the number of shares to be issued. The spread is shared among
the book managers, co-managers, and the selling syndicate, and includes the management fee
(payable to the book managers), the underwriting fee (payable to co-managers), the selling
concession (payable to the selling syndicate), and the reallowance fee (payable to secondary
sellers of the securities).
In Panel C, we report summary statistics for key deal and firm characteristics for our SEO
sample. The numbers are largely in line with other SEO studies (see, for example, Kim and Park
(2005), Lee and Masulis (2009), and Ferreira and Laux (2016). In Panel D, we compare deal and
firm characteristics for the two subsample of SEOs partitioned by the presence of IB directors on
the issuer’s board. We find that SEOs with IB directors have on average higher announcement
returns, lower underpricing, and lower underwriter spreads. Given that omitted variable bias in
univariate correlations can mask the true relations between the variables, we will employ
regression analysis to examine the factors associated with SEOs.
C. Sample overview
Table 3 presents summary statistics for the panel of 37,844 firm-year observations used
to examine the SEO propensity. Detailed definitions of the variables are given in the Appendix.
All continuous variables are winsorized at their 1st and 99th percentiles to reduce the influence of
outliers, and all dollar values are adjusted to 2015 dollars. Panel A presents summary statistics

11
for the full sample. We show that about 40% of the sample firms have IB directors. By
comparison, over 80% of the directors are independent. Other firm characteristics are typical of
the Compustat population.
Panel B presents the mean and median values of key firm characteristics for two
subsamples of firms partitioned by the presence of IB directors. We show that firms in these two
subsamples have statistically (if not economically) different characteristics. For example, firms
with IB directors have more independent directors (not surprisingly as IB directors are
independent), and are larger, older, and more likely to be rated than firms without IB directors.
Panel C presents the correlation matrix (based on the variables in Panel A), suggesting little
problem of multicollinearity.
III. The Role of IB Directors in SEOs
A. IB directors and the SEO propensity
To explore the impact of IB directors on a firm’s equity market capital raising activities,
we first investigate whether IB directors affect firms’ likelihood of doing SEOs. We estimate a
probit regression where the dependent variable, SEO, is an indicator variable that takes the value
of one if a firm makes at least one SEO in the year, and zero otherwise. The variable of interest is
an indicator variable, IB Director, that takes the value of one if a firm has at least one IB director
in the prior year, and zero otherwise. We control for board monitoring using the fraction of
independent directors to make sure that our IB director results are not driven by (omitted) board
characteristics. To ensure that our results are not driven by inter-board linkages, we control for
the SEO activities of industry peer firms that are connected by interlocking directors, which
captures potential SEO peer effects. We also control for the presence of directors sitting on
12
boards of capital providers (SIC 6000-6299, including depository institutions, non-depository
credit institutions, and security and commodity brokers, dealers, exchanges, and services) to
make sure that our results are not driven by board connections with SEO underwriters or
investors. Finally, we control for a number of known determinants of a firm’s propensity to do a
SEO, including firm size, firm age, ROA, dividend payer, Tobin’s Q, prior year return, prior year
SEO, leverage, rated, tangibility, cash holdings, capital expenditures, as well as year and industry
fixed effects (see, for example, Corwin (2003) and Eckbo, Masulis, and Norli (2007)).
Table 4 Panel A column (1) presents the probit regression results in terms of marginal
effects. The estimated coefficients of the control variables all exhibit the expected signs. Smaller
firms, younger firms, underperforming firms, non-dividend payer, and firms with higher Tobin’s
Q, higher prior year returns, prior year SEOs, higher leverage, credit ratings, higher cash
holdings, and higher capital expenditures are more likely to do SEOs. Importantly, we find that
the marginal effect of IB Director is 0.008 and is statistically significant at the 1% level. The
effect of IB directors on the SEO propensity is also economically meaningful. Ceteris paribus,
firms with IB directors on their boards are 0.8 percentage points more likely to do an SEO than
firms without, which is a 13.8% increase compared with the average SEO propensity in our
sample of 5.8 percentage points.6 It is worth noting that the marginal effect of having IB
directors on a board is about as large as the marginal effect of a one standard deviation increase
in capital expenditures (or two standard deviation increase in Tobin’s Q).
6 We also examine whether our results are affected by differences in firm characteristics between firms with and
without IB directors using a propensity score matching approach (Rosenbaum and Rubin (1983)). We estimate the
propensity score using a set of covariates that includes firm size, firm age, ROA, dividend payer, Tobin’s Q, prior
year return, prior year SEO, leverage, rated, tangibility, cash holdings, capital expenditures, and firm industry. We
then identify two groups of firms that are virtually indistinguishable from one another except for the presence of IB
directors on their boards. Our results are the same after adjusting for covariate differences between these two groups.

13
While our results are consistent with the hypothesis that IB directors help firms reduce
information asymmetry, thus leading to easier and cheaper access to capital markets, a potential
concern is endogeneity, i.e., IB directors are not randomly assigned and the presence of IB
directors could be related to firms’ unobserved growth opportunities or needs for funding. The
evidence so far is also consistent with a reverse causality interpretation. Consider a firm with
funding needs and equity issuance is costly. Realizing that information asymmetry between
corporate insiders and outside investors could be severe, the firm could appoint a capital market
expert, such as an IB director, to its board to facilitate those planned fund raising activities.
To address the potential endogeneity concern, we adopt an instrumental variable
approach. Our instrumental variable for the presence of IB directors on a board follows Adams
and Ferreira (2009) and is the fraction of non-IB directors on a board who sit or have sat on
boards on which there are IB directors. The network of non-IB directors on other boards includes
all firms covered by BoardEx, i.e., both public and large private firms. We expect this instrument
to meet the relevance condition—it captures the degree to which non-IB directors are connected
to IB directors and therefore appreciate the role of IB directors on a corporate board. In the
meantime, these non-IB directors’ network on other boards is unlikely related to their home
firms’ funding needs and/or investment opportunities, especially after we have controlled for the
SEO activities of interlocked peer firms (the exclusion restriction).
Angrist (2001) and Angrist and Krueger (2001) point out that when the endogenous
regressor is binary, using the predicted probability from a nonlinear model in the second stage
does not generate consistent estimates unless the nonlinear model is exactly correct. Therefore,
we estimate a recursive bivariate probit model, which assumes that the binary dependent and
independent variables are each determined by latent linear models with jointly normal error

14
terms (Evans and Schwab (1995)). In this model, the probit equations on the indicator variable
IB Director and the indicator variable SEO are estimated simultaneously using the maximum
likelihood method, where the instrument is used in predicting IB directors’ presence.7
Table 4 Panel A column (2) presents results of the biprobit regression in terms of
marginal effects. For brevity, we present the full regression results from the second-stage
regression, as well as the coefficient on the instrument in the first-stage regression (Table IA1 in
the Internet Appendix presents the full results of the first-stage regressions). We note that our
instrument is positively and significantly associated with a firm’s likelihood of having an IB
director on its board at the 1% level. More importantly, after instrumentation, we show that firms
with IB directors are 2.8 percentage points more likely to do SEOs than firms without.
For comparison, we also estimate a standard two-stage least squares (2SLS) regression
with our instrument, assuming both binary outcome variables to be linear. Table 4 Panel A
column (3) presents the results. We show that the coefficient on the indicator variable IB
Director is positive and significant at the 1% level, confirming the positive effect of IB directors
on a firm’s SEO propensity. Lastly, in column (4), we present the 2SLS estimation with firm
fixed effects. IB directors continue to be positively and significantly associated with a firm’s
propensity to do an SEO after absorbing time-invariant firm-level heterogeneities. A direct
inference of the magnitude of the coefficient is that firms with IB directors are 5-7 percentage
points more likely to make SEOs. However, we caution against such a direct inference, because
7 In our current setting, the latent linear model can be specified as follows:
01,
01,
*
222
*
122
*
2
*
11111
*
1
yforyyXy
yforyXy
where y1 and y2 represent the presence of IB directors and SEO activities, respectively. When the error terms ε1 and ε2 are uncorrelated, both equations can be estimated separately as single probit models, but when the error terms might
be correlated, a bivariate probit model is required. Greene (1998, 2002) shows that the endogeneity of y1 does not
affect the likelihood of the bivariate probit.

15
2SLS can produce predicted values that are out of bounds when a model has both a binary
dependent variable and binary explanatory variables. Instead, we rely on probit and bivariate
probit estimates to infer the marginal effect of IB directors on a firm’s SEO propensity, because
these estimates are considered more appropriate and efficient in a setting like ours (Greene
(1998) and Chiburis, Das, and Lokshin (2012)).
To address the potential reverse causality concern, we identify and remove firm-year
observations where IB directors have a tenure less than three years prior to the SEO offering.8
This removes about 15% of the sample. In this case, IB directors are hired long before a firm’s
capital raising activities and the relation we identify is more likely to be causal. Table 4 Panel B
presents the results. Our main findings on the positive association between IB directors and a
firm’s SEO propensity remain unchanged.
Next, we also remove around 5% of firm-year observations where conflicts of interest
might be the driver behind the SEO decision, that is, affiliated IB directors whose (former)
employers are the lead underwriters for the SEO. Untabulated results show that our main
findings remain unchanged after removing those firm-year observations.9
B. IB directors and SEO announcement returns
If IB directors help reduce information asymmetry about SEO issuers, we expect firms
with such directors to receive more favorable price reactions at the time of SEO announcements.
8 Our main findings remain unchanged if we require IB directors to have tenure of at least six years, i.e., two
election cycles away from the SEO offerings (for staggered boards). 9 If investment banking experience is a required attribute for director appointment, directors who join the board
before gaining investment banking experience should be free of such endogeneity concerns. We therefore limit the
SEO propensity tests to a subsample of IB directors who gain investment banking experience after joining the board.
However, only 1.9% of the firms have this type of IB directors. The sample is too small to generate any significant
effect.

16
In this section, we examine whether issuers experience higher abnormal announcement returns
when they have at least one IB director on their boards.
Table 5 Panel A lists the steps taken to form the SEO sample to study announcement
returns. Table 2 Panel D shows that the mean/median SEO announcement returns (CAR) for the
full sample is negative (-2%). When we separate the sample based on the presence of IB
directors on the issuers’ boards, we show that the mean/median CAR for SEO firms with IB
directors are significantly different from those for SEO firms without IB directors. This suggests
that unconditionally, the presence of IB directors is associated with an increase in issuer
shareholder wealth upon the SEO announcement, consistent with our conjecture on the role of IB
directors in the capital market.
Next, we estimate regressions of SEO announcement returns, controlling for known
determinants documented in previous studies (Lee and Masulis (2009) and Ferreira and Laux
(2016)). The set of control variables includes both firm and SEO deal characteristics, such as
firm size, prior year return, relative size (of the issue to the issuer market capitalization), and the
percent of secondary offering. We also control for year and industry fixed effects in all of our
regressions.
Table 5 Panel B presents the regression results. In column (1), where the regression
specification is OLS, we show that the coefficient on the indicator IB director is positive and
significant at the 5% level. The presence of IB directors increases the issuers’ two-day CAR by
70 basis points compared to the sample average of –200 basis points. In terms of economic
significance, the average market capitalization for SEO issuers in the sample is $1.59 billion, so
a 70 basis point increase corresponds to $11.1 million value creation to the shareholders of a

17
typical issuer. This effect is similar in magnitude to the effect of a one standard deviation
increase in share turnover (a proxy for stock liquidity).
To control for potential self-selection bias whereby a firm’s SEO decision might be
influenced by management’s expectations of the market reaction to the announcement (Li and
Prabhala (2007)), we employ a two-stage Heckman selection model (Heckman (1979)). In the
first stage, we estimate a probit regression of the SEO propensity using the same specification as
in Table 4 Panel A column (1). In the second stage, we add the Inverse Mills ratio as an
additional control variable in our estimation of SEO announcement returns. Panel B column (2)
presents the results. We show that the coefficient on the indicator IB Director is positive and
significant at the 10% level and with a similar magnitude as that in column (1) without
controlling for selection. The coefficient on the inverse Mills ratio is insignificant, suggesting
little evidence of selection. We conclude that firms with IB directors are associated with higher
SEO announcement returns.10
C. IB directors and SEO underpricing
The univariate statistics in Table 2 Panel D show that SEOs made by issuers with IB
directors on their boards are significantly less underpriced than their counterparts without IB
directors.
Table 6 presents the regression results when the dependent variable is SEO underpricing.
We control for known determinants of SEO underpricing documented in previous studies
(Loderer, Sheehan, and Kadlec (1991), Jegadeesh, Weinstein, and Welch (1993), Altınkılıç and
10 When examining CAR, we do not employ a 2SLS specification as the outcome variable CAR is forward looking
and thus reverse causality is unlikely to be a big concern: Even if firms appoint IB directors in anticipation of their
funding needs and capital raising activities, it is still consistent with our argument that IB directors add value (and
managers are aware of it).

18
Hansen (2003), and Corwin (2003)). In column (1) where the regression specification is OLS, we
show that the coefficient on the indicator IB director is negative and significant at the 5% level.
The presence of IB directors reduces SEO underpricing by 50 basis points compared to the
sample average of 400 basis points. This effect is similar in magnitude to the effect of a one
standard deviation decrease in stock return volatility. In terms of economic significance, given
an average issue size of $131 million in our sample, a 50 basis point decrease in underpricing
corresponds to $0.66 million value creation to a typical issuer. We also note that other control
variables have similar effects on SEO underpricing as prior work has shown: SEOs whose
issuers have lower return volatility, lower price run-up leading to the issue, higher priced stock,
and more analyst coverage are associated with lower underpricing.
Column (2) presents the second-stage regression results controlling for selection in SEO
decisions. We show that the coefficient on the indicator IB Director is negative and significant at
the 5% level and with a similar magnitude as that in column (1) without controlling for selection.
We obtain similar results after instrumenting IB Director in a 2SLS specification (column (3))
and in a subsample that excludes firm-year observations where the IB director’s tenure on the
board is less than three years (column (4)). We conclude that firms with IB directors are
associated with smaller SEO underpricing.
D. IB directors and gross spread
The univariate statistics in Table 2 Panel D also show that issuers with IB directors on
their boards are charged a significantly lower spread on their SEO deals than those without IB
directors.
Table 7 presents the regression results when the dependent variable is the natural
logarithm of SEO gross spread in percentage points following Butler, Grullon and Weston

19
(2005). We control for known determinants of SEO gross spreads documented in previous
studies (Lee and Masulis (2009) and Butler, Grullon and Weston (2005)), as well as year and
industry fixed effects. In column (1) where the regression specification is OLS, we show that the
coefficient on the indicator IB director is negative and significant at the 5% level, and the
presence of IB directors reduces the issuer’s underwriting fees by 5%. In terms of economic
significance, with an average issue size of $131 million and an average gross spread of 5.1
percentage points in our sample, a 5% decrease in underwriting fees corresponds to a savings of
$0.33 million in fees to a typical SEO issuer (= 131 × 0.051 × 0.05); this effect is larger than that
of a one standard deviation increase in log (Stock price). We further note that, consistent with
prior studies, SEOs whose issuers are larger, have better performance and credit ratings, higher
priced stock, larger deals, and deals with fewer book runners are associated with lower gross
spreads.
Column (2) presents the second-stage regression results controlling for selection in SEO
decisions. We show that the coefficient on the indicator IB Director is negative and significant at
the 5% level and with a similar magnitude as that in column (1) without controlling for selection.
Columns (3) and (4) present the instrumented 2SLS regressions for the full sample and for a
subsample that excludes firm-year observations where the IB director’s tenure on a board is less
than three years, respectively. We conclude that firms with IB directors are associated with lower
gross spreads.
In summary, we present evidence that the presence of IB directors on boards is associated
with a higher SEO propensity, higher announcement returns, less underpricing, and lower gross
spreads. These findings are consistent with IB directors reducing information asymmetry

20
between issuers and the capital market. In the next section, we further explore the channels as
well as the implications of IB directors for firm policies and performance.
IV. Underlying Mechanisms and Policy and Performance Implications
A. Underlying mechanisms
If IB directors are effective communicators of firm value to capital markets, we expect
their presence to improve firms’ informational environments, which in turn leads to more
frequent SEOs and lower floatation costs (Taggart (1977), Choe, Masulis and Nanda (1993), Lee
and Masulis (2009), and Billett and Yu (2016)).
Our first proxy for firm informational environment is stock return volatility following
Billett and Yu (2016). With a more transparent informational environment, new information is
promptly incorporated into stock prices, leading to less variation in stock returns. We expect the
presence of IB directors leads to lower return volatility.
Our second proxy focuses on the quality of accounting information, and we use accrual
quality following Lee and Masulis (2009). IB directors, very often (about 70% of the time in our
sample), sit on the audit committee, and their presence can help firms to communicate their
financial information to the broad capital markets in a more timely and effective manner. Prior
work has shown that financial expertise on the audit committee is associated with better earnings
quality (Defond, Hann, and Hu (2005)). Lee and Masulis (2009) show that poor accounting
information quality raises uncertainty about a firm’s financial condition for outside investors,
lowers demand for a firm’s stock, and raises underwriting costs and risk. We thus expect that
another important channel for IB directors to have an effect on SEO decisions is that their
presence is associated with a higher quality of accounting information.

21
Our third and final proxy is analyst forecast error. One potential mechanism through
which IB directors help issuers get better access to capital markets is improved communication
between management and financial intermediaries like analysts who are financial experts
themselves. Having a similar professional background means the IB directors speak the same
language as and can communicate more effectively with the analyst community. Custodio and
Metzger (2014) find that firms whose CEOs have finance experience are associated with more
accurate analyst forecasts. Similarly, we expect that IB directors could improve the accuracy of
analyst forecasts, lowering the uncertainty surrounding SEOs.
Table 8 presents our investigation of the underlying mechanisms using the 2SLS
regressions. Consistent with our conjecture, the coefficient on the indicator IB director is
negative and significant at the 5% or lower level when the dependent variables are different
proxies of firm informational environment, suggesting that the presence of IB directors helps
reduce stock return volatility, improve earnings quality, and reduce analyst forecasts error.
In summary, we show that the positive effect of IB directors on SEO outcome variables is
due to their ability in reducing information asymmetry between the issuer and capital markets.
B. Firm policies post SEOs
So far, we have shown that IB directors enable firms to access the capital market more
easily and cheaply. As a result, the precautionary motive of holding cash becomes less important,
and we would expect that firms with IB directors are more likely to spend the proceeds in
valuable investments than hoarding them. To examine the real implications of firms having IB
directors on corporate policies, we adopt two approaches.
The first approach uses matching firms. For each SEO firm with IB directors, we find a
matching SEO firm without IB directors using the following algorithm: i) If there is at least one

22
SEO firm without IB directors in the same four-digit SIC industry in the same year, the one with
the closest operating performance measured in year -1 is used (year 0 is the offer year); ii) if no
matching firm is found, we then search for a match at a broader SIC level. We then compare post
SEO firm policies between these two groups.
The second approach relies on industry-performance benchmarking. Specifically, we pair
each SEO firm with a set of non-SEO firms that have the same SIC code (starting with four-digit
SIC) and operating performance within 90% to 110% of the SEO firms’ performance in year -1.
Benchmark-adjusted measures are then calculated as the difference between the measures of the
SEO firm and the median measures of the matching firms. We measure operating performance as
operating income before depreciation (OIBD) scaled by sales. As pointed out by Barber and
Lyon (1996), unlike measures based on earnings, OIBD mitigates the effects of different
financing methods. Table 9 presents the results, where we compare the median changes in SEO
firms’ cash holdings, investment (Capex + R&D), and operating performance for two
subsamples grouped by the presence of IB directors or not from year +1 up to year +3 relative to
year -1.
Consistent with our conjecture on the role of IB directors in firm policies, Panel A shows
that post SEOs, firms with IB directors hold less cash and invest more than their matched peers
without IB directors. These findings are consistent with the notion that IB directors help firms
relax their financial constraints, leading to less (precautionary) cash holdings and more real
investment. Supporting the above findings, we find that IB directors have performance
implications: SEO firms with IB directors significantly outperform their peers without IB

23
directors in terms of operating performance. Panel B shows similar results when we compare
median changes in benchmark-adjusted measures for SEO firms with and without IB directors.
C. Long-run buy-and-hold abnormal returns
We next examine whether firms with IB directors outperform other firms in terms of
long-run abnormal stock performance after SEO. Specifically, we analyze the market-adjusted
returns, Fama-French adjusted returns, and benchmark-adjusted returns over three years after the
offer date. To calculate the Fama-French adjusted buy-and-hold abnormal returns (BHARs) we
first regress monthly returns on the Fama-French three factors using five years of data leading up
to the SEO, and then use the estimated coefficients to calculate monthly abnormal returns before
compounding (Kothari and Warner (1997)). To obtain benchmark-adjusted returns, we follow
Barber and Lyon (1997) and calculate abnormal returns as the return of the SEO firm less the
return on a control firm, which is chosen among all firms that have market values of equity
between 70% and 130% of that of the SEO firm and whose book-to-market ratio is closest to that
of the SEO firm. Table 10 presents the results.
We show that SEO firms with IB directors outperform other SEO firms in a statistically
significant and economically meaningful way. Take Fama-French BHARs as an example, over a
one-year horizon starting at the offer date, SEO firms with IB directors outperform those without
by 8%, and the outperformance goes up to 16% over a three-year horizon.
Overall, we provide evidence suggesting that IB directors improves firms’ access to
equity market, leading to less cash hoarding, more timely investments, and better performance.

24
V. Additional Investigation
In this section, we conduct a number of robustness tests on our main findings, explore
alternative explanations for our main findings, and examine the role of IB directors in other
capital raising activities.
A. Robustness checks and alternative explanations
First, we re-do our analysis of the SEO propensity in Table 3 using different measures of
SEO activity. Table IA2 in the Internet Appendix presents the results. We show that using a
number of volume-based measures to capture SEO activity, the positive effect of IB directors
remains.
Second, we examine whether and how IB directors affect issue size. IB directors help
reduce information asymmetry, leading firms to raise capital more frequently and more cheaply.
As a result, firms might not need to lump their issues to benefit from economies of scale. This
channel suggests that there is either no or a negative association between the presence of IB
directors and the size of SEO issues. Table IA3 presents the results where the dependent variable
is the size of SEO deal. We show that the presence of IB directors is not significantly associated
with the size of the SEO deal, as measured by both the absolute and normalized net proceeds. It
is clear that our main findings are not driven by SEO deal size.
Finally, we rule out an alternative explanation of our results, i.e., IB directors have
superior abilities to time the market, thereby making firms more likely to conduct SEOs. First,
our results on long-run stock performance are inconsistent with the market timing story: If firms
with IB directors are more likely to time the market, their long-run stock performance post SEO
should be lower instead of higher (Loughran and Ritter (1995) and Baker and Wugler (2000)).
We then directly test for market timing in Table IA4. We find that firms with IB directors are not

25
more likely to issue equity when prior year stock return is high, suggesting that IB directors do
not have superior abilities to time the market.
B. IB directors and debt markets
We further explore the heterogeneity in the role of IB directors in capital raising activities
across different security types. If the effect of IB directors operates primarily through reducing
information asymmetry, such effect should be weaker in securities that are less information-
sensitive in the first place. Among different securities, common equity is the most sensitive to
information asymmetry between corporate insiders and the capital market, while corporate bonds
and bank loans are less information-sensitive. We thus expect IB directors to have less of an
effect on the issuance and pricing of bonds and loans. Consistent with our conjecture, we find
some weak effects of IB directors on a firm’s propensity to issue bonds (Table IA5) and no
significant effect on bond spreads at issuance (Table IA6). We also find no effect of IB directors
on a firm’s propensity to obtain bank loans or the cost of bank loans (Tables IA7 and IA8).
These results are consistent with the ordering of equity (the most information-sensitive),
corporate bonds, and bank loans (the least information-sensitive) along the spectrum of the
sensitivity to information asymmetry across different security types. Moreover, these results also
help rule out alternative explanations such as conflicts of interests or reverse causality for our IB
director results in SEOs, as these explanations should also apply for corporate bonds and bank
loans.
Overall, these results are consistent with IB directors improving firms’ access to capital
markets when the potential for information asymmetry is severe.
VI. Conclusions

26
We examine whether and how directors with investment banking experience affect firms’
capital raising activities. We find that firms with investment bankers on their boards have a
higher propensity to do SEOs. Furthermore, issuers with IB directors experience higher
announcement returns and lower underpricing, and they have lower gross spreads. We find some
limited effect of IB directors on firms’ issuances of corporate bonds and bank loans, which are
less information-sensitive than equity. Overall, our results suggest that directors with investment
banking experience help firms mitigate information asymmetry, resulting in better access to
equity capital market. Our study highlights the advisory role of specialist directors in shaping
corporate policies.

27
Appendix. Variable definitions
All Compustat firm characteristics are measured as of the fiscal year-end before the SEO announcement, and all continuous variables are winsorized at the 1st and
99th percentiles. All dollar values are in 2015 dollars.
Variables Definitions
Dependent variables
SEO An indicator variable that takes the value of one if a firm does at least one SEO during the year, and zero otherwise.
Source: SDC.
CAR Two-day cumulative abnormal return over the SEO filing date (day 0) and the day after (day 1), calculated using the
market model estimated over the 200-day period ending 11 days before the SEO filing date, with the return on the
CRSP value-weighted index as the market return. Source: CRSP.
Underpricing Negative one times the return from the closing price on the day prior to the offer date to the offer price. Source:
CRSP.
Gross spread Total compensation to IBs as a percentage of total SEO proceeds. Source: SDC
Stock return volatility The standard deviation of monthly stock returns during the year. Source: CRSP.
Accrual quality The standard deviation of the five most recent firm-specific residuals from the regression of total current accruals on
lagged, contemporaneous, and leading cash flow from operations: CAj,t = c + γ1CFOj, t-1 + γ2CFOj, t + γ3CFOj, t+1 + νj,t.
CA (Total current accruals) = Δcurrent assets - Δcurrent liabilities + Δdebt in current liabilities – Δcash. CFO (Cash
flow from operations) = earnings before extraordinary items - total accruals, where total accruals = total current
accruals - depreciation and amortization. All variables are scaled by total assets. The regression is estimated annually
for each two-digit SIC industry groups with at least 20 firms with available data for each of the past five years.
Source: Compustat.
Analyst forecast error The absolute difference between the actual annual earnings per share and the median analyst earnings forecast,
scaled by actual earnings per share. Source: I/B/E/S.
Board characteristics
IB director An indicator variable that takes the value of one if there is at least one outside director on a board with investment
banking experience, and zero otherwise. Source: BoardEx.
IB director (%) The fraction of outside directors on a board with investment banking experience. Source: BoardEx.
Board size The number of directors on a board. Source: BoardEx.
Board independence The fraction of independent directors on a board. Source: BoardEx.
Connection to IB directors The fraction of non-IB directors on the board who sit on other boards (either now or in the past) on which there are
IB directors. Source: BoardEx.

28
Connection to capital providers An indicator variable that takes the value of one if there is at least one director on a board who sits on the board of a
capital provider (SIC 6000-6299). Source: BoardEx.
Firm characteristics
Total assets Total assets. Source: Compustat.
Firm age The number of years since a firm first appeared in CRSP. Source: CRSP.
ROA Net income /Total assets. Source: Compustat.
Dividend payer An indicator variable that takes the value of one if a firm pays any dividend during the year, and zero otherwise.
Source: Compustat.
Tobin’s Q (Total assets - Book value of equity + Market value of equity) / Total Assets. Source: Compustat.
Leverage (Long-term debt + Debt in current liabilities)/ Total assets. Source: Compustat.
Prior year return The annual return on the common stock of a firm. Source: CRSP.
Prior year SEO An indicator variable that takes the value of one if a firm did SEOs in the past year, and zero otherwise. Source:
SDC.
Interlocked peer SEO An indicator variable that takes the value of one if a peer firm with interlocking directors makes SEOs during the
year, and zero otherwise. Peers are first defined at the four-digit SIC level and if there are fewer than five peer firms
(at the four-digit level) in the sample, we move up to three-digit SIC level and if there are fewer than five firms (at
the three-digit level), we move up to two-digit SIC level. Source: SDC
Rated An indicator variable that takes the value of one if a firm has credit ratings, and zero otherwise. Source: Compustat.
Tangibility Net property, plant, and equipment /Total assets. Source: Compustat.
Cash Cash and cash equivalent holdings /Total assets. Source: Compustat.
Capex Capital expenditures/Total assets. Source: Compustat.
PreCAR Five-day cumulative abnormal return relative to the market return ending the day prior to the offer date, where the
return on the CRSP value-weighted index is the market return. Source: CRSP.
Stock price The closing price on the day prior to the offer date. Source: CRSP.
Return std The standard deviation of daily stock returns during the trading days -90 to -11 prior to the filing date (or offer date).
Source: CRSP.
Share turnover The average daily share trading volume during the trading days -90 to -11 prior to the filing date (or offer date),
divided by the pre-SEO total number of shares outstanding. Source: CRSP.
#Analysts The number of analysts issuing earnings forecasts. Source: I/B/E/S.
Cash flow volatility The standard deviation of annual cash flows in the past ten years. Source: Compustat.
Operating performance Operating income before depreciation (OIBD) scaled by sales. Source: Compustat.
SEO characteristics
Relative size The number of shares offered divided by the number of shares outstanding prior to the offer date. Source: SDC.

29
Secondary The fraction of shares offered that are sold by existing shareholders. Source: SDC.
Underwriter ranking The Carter and Manaster reputation measure in the year prior to the offer date. Source: Jay Ritter’s website
#Bookrunners The number of book runners involved in the SEO offer. Source: SDC.
IPO underpricing The average underpricing of IPOs in the same month as the SEO offer. Source: Jay Ritter’s website

30
References:
Adams, R.B., A.C. Akyol, and P. Verwijmeren, 2015. Director skill sets, UNSW working paper.
Adams, R.B., H. Almeida, and D. Ferreira, 2005. Powerful CEOs and their impact on corporate
performance, Review of Financial Studies 18, 1403–1432.
Adams, R.B., and D. Ferreira, 2007. A theory of friendly boards, Journal of Finance 62, 217–
250.
Adams, R.B., and D. Ferreira, 2009. Women in the boardroom and their impact on governance
and performance, Journal of Financial Economics 94, 291–309.
Adams, R.B., B.E. Hermalin, and M.S. Weisbach, 2010. The role of boards of directors in
corporate governance: A conceptual framework and survey, Journal of Economic Literature
48, 58–107.
Ahern, K.R., and A.K. Dittmar, 2012. The changing of the boards: The impact on firm valuation
of mandated female board representation, Quarterly Journal of Economics 127, 137–197.
Altınkılıç, O., and R.S. Hansen, 2003. Discounting and underpricing in seasoned equity offers,
Journal of Financial Economics 69, 285–323.
Angrist, J.D., 2001. Estimation of limited dependent variable models with dummy endogenous
regressors: Simple strategies for empirical practice, Journal of Business & Economic
Statistics 19, 2–28.
Angrist, J.D., and A.B. Krueger, 2001. Instrumental variables and the search for identification:
From supply and demand to natural experiments, Journal of Economic Perspectives 15, 69–
85.
Baker, M., and J. Wurgler, 2000. The equity share in new issues and aggregate stock returns,
Journal of Finance 55, 2219–2257.
Barber, B., and J. Lyon, 1996. Detecting abnormal operating performance: The empirical power
and specification of test statistics, Journal of Financial Economics 41, 359–399.
Barber, B., and J. Lyon, 1997. Detecting long-run abnormal stock returns: The empirical power
and specification of test statistics, Journal of Financial Economics 43, 341–372.
Benmelech, E., and C. Frydman, 2015. Military CEOs, Journal of Financial Economics 117, 43–
59.
Bennedsen, M., K.M. Nielsen, F. Perez-Gonzalez and D. Wolfenzon, 2007. Inside the family
firm: The role of families in succession decisions and performance, Quarterly Journal of
Economics 122, 647–691.

31
Bernile, G., V. Bhagwat, and P.R. Rau, 2015. What doesn’t kill you will only make you more
risk-loving: Early-life disasters and CEO behavior, Journal of Finance forthcoming.
Bernile, G., V. Bhagwat, and S. Yonker, 2016. Board diversity, firm risk, and corporate policies,
University of Miami working paper.
Bertrand, M., and A. Schoar, 2003. Managing with style: The effect of managers on firm
policies, Quarterly Journal of Economics 118, 1169–1208.
Billett, M.T., and M. Yu, 2016. Asymmetric information, financial reporting, and open market
share repurchases, Journal of Financial and Quantitative Finance forthcoming.
Blume, E., and R. F. Stambaugh, 1983. Biases in computed returns: An application to the size
effect. Journal of Financial Economics 12, 387-404.
Butler, A.W., G. Grullon, and J.P. Weston, 2005. Stock market liquidity and the cost of issuing
equity, Journal of Financial and Quantitative Analysis 40, 331–348.
Chiburis, R., J. Das, and M. Lokshin, 2012. A practical comparison of the bivariate probit and
linear IV estimators, Economics Letters 117, 762–766.
Choe, H., R. Masulis and V. Nanda, 1993. Common stock offerings across the business cycle:
Theory and evidence, Journal of Empirical Finance 1, 3–31.
Corwin, S.A., 2003. The determinants of underpricing for seasoned equity offers, Journal of
Finance 58, 2249–2279.
Custódio, C., and D. Metzger, 2013. How do CEOs matter? The effect of industry expertise on
acquisition returns, Review of Financial Studies 26, 2008–2047.
Custódio, C., and D. Metzger, 2014. Financial expert CEOs: CEO’s work experience and firm’s
financial policies, Journal of Financial Economics 114, 125–154.
Datta, S., M.Iskandar-Datta, and K. Raman, 2005. Executive compensation structure and
corporate equity financing decisions, Journal of Business 78, 1859–1889.
DeFond, M.L., R.N. Hann, and X. Hu, 2005. Does the market value financial expertise on audit
committees of boards of directors? Journal of Accounting Research 43, 153–193.
Denis, D.J., 1994. Investment opportunities and the market reaction to equity offerings, Journal
of Financial and Quantitative Analysis 29, 159–177.
Dittmar, A., and R. Duchin, 2016. Looking in the rearview mirror: The effect of managers’
professional experience on corporate financial policy, Review of Financial Studies 29, 565–
602.

32
Eckbo, B.E., R.W. Masulis, and O. Norli, 2007. Security offerings, in: Eckbo, B.E. (Ed.),
Handbook of Corporate Finance: Empirical Corporate Finance, Elsevier/North-Holland,
Amsterdam (Chapter 13).
Evans, W.N., and R.M. Schwab, 1995. Finishing high school and starting college: Do Catholic
schools make a difference? Quarterly Journal of Economics, 941–974.
Ferreira, M., and P. Laux, 2016. Corporate boards and SEOs: The effect of certification and
monitoring, Journal of Financial and Quantitative Analysis forthcoming.
Gerard, B., and V. Nanda, 1993. Trading and manipulation around seasoned equity offerings,
Journal of Finance 48, 213–245
Giannetti, M., and M. Zhao, 2016. Board diversity and firm performance volatility, ECGI
Working Paper Series in Finance.
Graham, J.R., C.R. Harvey, and M. Puri, 2013. Managerial attitudes and corporate actions,
Journal of Financial Economics 109, 103–121.
Greene, W., 1998. Gender economics courses in liberal art colleges: Further results, Journal of
Economic Education 29, 291–300.
Güner, A.B., U. Malmendier, and G. Tate, 2008. Financial expertise of directors, Journal of
Financial Economics 88, 323–354.
Heckman, J. J., 1979. Sample selection bias as a specification error, Econometrica, 47, 53–161.
Hirshleifer, D., A. Low, and S.H. Teoh, 2012. Are overconfident CEOs better innovators?
Journal of Finance 67, 1457–1498.
Huang, Q., F. Jiang, E. Lie, and K. Yang, 2014. The role of investment banker directors in
M&A, Journal of Financial Economics 112, 269–286.
Huang, J., and D.J. Kisgen, 2013. Gender and corporate finance: Are male executives
overconfident relative to female executives? Journal of Financial Economics 108, 822–839.
Jegadeesh, N., M. Weinstein, and I. Welch, 1993. An empirical investigation of IPO returns and
subsequent equity offerings, Journal of Financial Economics 34, 153–175.
Kahle, K.M. and R.M. Stulz, 2013. Access to capital, investment, and the financial crisis, Journal
of Financial Economics 110, 280–299.
Kaplan, S.N., M.M. Klebanov, and M. Sorensen, 2012. Which CEO characteristics and abilities
matter? Journal of Finance 67, 973–1007.

33
Kothari, S.P., and J.B. Warner, 1997. Measuring long-horizon security price performance,
Journal of Financial Economics 43, 301–339.
Kim, Y., and M. Park, 2005. Pricing of seasoned equity offers and earnings management, Journal
of Financial and Quantitative Analysis 40, 435–463.
Lee, I., S. Lochhead, J. Ritter, and Q. Zhao, 1996. The costs of raising capital, Journal of
Financial Research 19, 59–74.
Lee, G., and R.W. Masulis, 2009. Seasoned equity offerings: Quality of accounting information
and expected flotation costs, Journal of Financial Economics 92, 443–469.
Li, K., and Prabhala, N.R., 2007. Self-Selection Models in Corporate Finance, in: Eckbo, B.E.
(Ed.), Handbook of Corporate Finance: Empirical Corporate Finance, Elsevier, North-
Holland, Amsterdam (Chapter 2).
Loderer, C.F., D.P. Sheehan, and G.B. Kadlec, 1991. The pricing of equity offerings, Journal of
Financial Economics 29, 35–57.
Loughran, T., and J.R. Ritter, 1995. The new issues puzzle, Journal of Finance 50, 23–51.
Malmendier, U., and G. Tate, 2005. CEO overconfidence and corporate investment, Journal of
Finance 60, 2661–2700.
Malmendier, U., and G. Tate, 2008. Who makes acquisitions? CEO overconfidence and the
market’s reaction, Journal of Financial Economics 89, 20–43.
Malmendier, U., G. Tate, and J. Yan, 2011. Overconfidence and early-life experiences: The
effect of managerial traits on corporate financial policies, Journal of Finance 66, 1687–1733.
Matsa, D.A., and A.R. Miller, 2013. A female style in corporate leadership? Evidence from
quotas, American Economic Journal: Applied Economics 5, 136–169.
Myers, S.C., and N.S. Majluf, 1984. Corporate financing and investment decisions when firms
have information that investors do not have, Journal of Financial Economics 13, 187–221.
Rosenbaum, P.R., and D.B. Rubin, 1983. The central role of the propensity score in
observational studies for causal effects, Biometrika 70, 41–55.
Safieddine, A., and W.J. Wilhelm, 1996. An empirical investigation of short-selling activity prior
to seasoned equity offerings, Journal of Finance 51, 729–749.
Scholes, M.S., 1972. The market for securities: Substitution versus price pressure and the effects
of information on share prices, Journal of Business 45, 179–211.

34
Taggart, R.A., 1977. A model of corporate financing decisions, Journal of Finance 32, 1467–
1484.
Tate, G., and L. Yang, 2015. Female leadership and gender equity: Evidence from plant closure,
Journal of Financial Economics 117, 77–97.

35
Figure 1. IB directors on corporate boards
This figure plots the presence of IB directors over time. A director is an IB director if she, at some point in her career,
held a senior position at any of the one hundred most active investment banks over the period 1980-2014.
4%
5%
6%
7%
8%
9%
10%
25%
27%
29%
31%
33%
35%
37%
39%
41%
43%
45%
2003 2004 2005 2006 2007 2008 2009 2010 2011 2012 2013 2014
Avg
. fra
ctio
n o
f IB
dir
ecto
rs
% o
f fi
rms
wit
h IB
dir
ecto
rs
% of firms with IB directors Average fraction of IB directors on board

36
Table 1. Top ten investment banks
This table presents two ranking lists of investment banks. The first list is the ten most active investment banks in
terms of the aggregate deal value that they advise (M&As) and/or underwrite (securities issuances) in the U.S. market
over the period 1980-2014, based on data from SDC. The second list is the ten investment banks that have the largest
number of connected directors at public firms with whom they once shared an employment relation.
Ranking By aggregate deal values By number of affiliated directors
1 Goldman Sachs Goldman Sachs
2 Morgan Stanley JP Morgan
3 JP Morgan Citigroup
4 Merrill Lynch Bank Of America
5 Credit Suisse Morgan Stanley
6 Bank Of America Merrill Lynch
7 Citigroup Lehman Brothers
8 Lehman Brothers Credit Suisse
9 Deutsche Bank Deutsche Bank
10 UBS UBS
37
Table 2. The SEO sample
This table presents summary statistics of the SEO sample, obtained from SDC’s New Issues Database. The SEO
sample consists of 2,508 offers over the period 2001-2015. Panel A presents the sample formation process. Panel B
presents the distribution of SEOs by year. Panel C presents descriptive statistics for selected variables. Panel D
presents the mean and median values of these variables for two subsamples of SEOs partitioned by the presence of IB
directors. t-tests for the differences in mean values and Wilcoxon tests for the differences in median values are
presented in the last two columns. Detailed variable definitions are provided in the Appendix. ***, **, and * denote
statistical significance at the 1%, 5%, and 10% levels, respectively.
Panel A: Sample formation
Number of deals
Total follow-on issuance by BoardEx-covered firms during 2001-2015 7,818
Exclude issues by utilities and financial firms 5,190
Common stocks (share codes 10 and 11) listed on NYSE, AMEX, and NASDAQ 4,644
Exclude units, rights offer, REITs, and closed-end funds 4,479
Exclude withdrawn cases 4,406
Exclude pure secondary offers (or no share information) 3,538
Offer price ≥ $1 3,168
Public offering 2,508
R415 Rule Shelf 1,884
Non-Shelf 624
Private placement 650
R144A resale 10
Panel B: SEOs over time
Year Number of SEOs Frequency (%)
2001 73 2.91
2002 75 2.99
2003 106 4.23
2004 182 7.26
2005 151 6.02
2006 157 6.26
2007 142 5.66
2008 81 3.23
2009 297 11.84
2010 206 8.21
2011 179 7.14
2012 200 7.97
2013 228 9.09
2014 223 8.89
2015 208 8.29
Total 2,508 100

38
Panel C: SEO and firm characteristic
Panel D: Mean and median values for SEO and firm characteristics across subsamples
Obs. Mean Std 25th
percentile Median
75th
Percentile
CAR 2,050 -0.020 0.062 -0.054 -0.020 0.007
Underpricing 2,254 0.040 0.041 0.011 0.030 0.057
Gross spread 2,143 0.051 0.014 0.045 0.055 0.060
Relative size 2,506 0.179 0.136 0.093 0.148 0.218
Secondary 2,508 0.069 0.197 0.000 0.000 0.000
Return std 2,504 0.042 0.024 0.027 0.036 0.050
Share turnover 2,504 0.014 0.015 0.005 0.009 0.016
PreCAR 2,254 -0.010 0.090 -0.061 -0.014 0.032
Stock price 2,254 19.620 24.510 5.040 12.855 25.590
IPO underpricing 2,254 0.137 0.097 0.079 0.123 0.193
#Analysts 2,508 7.678 7.693 2.000 6.000 11.000
#Bookrunners 2,507 1.544 0.934 1.000 1.000 2.000
Underwriter ranking 2,165 6.934 2.909 6.001 8.001 9.001
SEOs with IB directors SEOs without IB directors Test of difference
Obs. Mean Median Obs. Mean Median T-test Wilcoxon test
CAR 793 -0.018 -0.017 1,257 -0.028 -0.023 *** ***
Underpricing 879 0.037 0.028 1,375 0.043 0.030 *** **
Gross spread 831 0.049 0.050 1,312 0.053 0.055 *** ***
Relative size 998 0.171 0.142 1,508 0.184 0.153 * **
Secondary 998 0.079 0.000 1,510 0.061 0.000 ** *
Return std 997 0.039 0.034 1,507 0.044 0.037 *** ***
Share turnover 997 0.013 0.009 1,507 0.014 0.009 PreCAR 879 -0.014 -0.014 1,375 -0.008 -0.014 Stock price 879 21.701 15.090 1,375 18.298 11.610 *** ***
IPO underpricing 879 0.138 0.122 1,375 0.136 0.125 #Analysts 998 8.798 7.000 1,510 6.938 5.000 #Bookrunners 998 1.709 1.000 1,509 1.435 1.000 *** ***
Underwriter ranking 901 7.137 8.501 1,264 6.789 8.001 *** ***

39
Table 3. Summary statistics
This table presents summary statistics of the sample used in SEO propensity analysis. The sample consists of 37,844
firm-year observations by merging CRSP, Compustat, and BoardEx databases over the period 2001-2015. Panel A
presents descriptive statistics for the full sample. Panel B presents the mean and median values of firm characteristics
for two subsamples of firms partitioned by the presence of IB directors. t-tests for the differences in mean values and
Wilcoxon tests for the differences in median values are presented in the last two columns. Panel C presents the
correlations among variables. Detailed variable definitions are provided in the Appendix. ***, **, and * denote
statistical significance at the 1%, 5%, and 10% levels, respectively.
Panel A: Summary statistics
Full sample (N = 37,844)
Mean P25 Median P75 Std
SEO 0.058 0.000 0.000 0.000 0.233
IB director 0.387 0.000 0.000 1.000 0.487
IB director (%) 0.064 0.000 0.000 0.125 0.095
Board independence 0.808 0.750 0.833 0.875 0.102
Connection to IB directors 0.307 0.111 0.286 0.500 0.245
Interlocked peer SEO 0.024 0.000 0.000 0.000 0.153
Connection to capital providers 0.247 0.000 0.000 0.000 0.431
Log (Total assets) 6.284 4.878 6.280 7.640 1.983
Firm age 17.821 7.000 14.000 26.000 13.935
ROA -0.050 -0.042 0.032 0.076 0.332
Dividend payer 0.327 0.000 0.000 1.000 0.469
Tobin’s Q 2.166 1.187 1.599 2.418 1.910
Prior year return 0.177 -0.210 0.071 0.391 0.674
Prior year SEO 0.057 0.000 0.000 0.000 0.232
Leverage 0.208 0.006 0.156 0.323 0.231
Rated 0.301 0.000 0.000 1.000 0.459
Tangibility 0.245 0.066 0.163 0.355 0.232
Cash 0.222 0.039 0.130 0.328 0.240
Capex 0.051 0.015 0.031 0.061 0.061

40
Panel B: Mean and median values for board and firm characteristics between subsamples
Firm-year with IB directors Firm-year without IB directors Test of difference (N = 14,645) (N = 23,199)
Mean Median Mean Median T-test Wilcoxon test
SEO 0.060 0.000 0.056 0.000 * *
IB director 1.000 1.000 0.000 0.000 - -
IB director (%) 0.165 0.143 0.000 0.000 *** ***
Board independence 0.826 0.857 0.796 0.833 *** ***
Connection to IB directors 0.401 0.400 0.247 0.200 *** ***
Interlocked peer SEO 0.023 0.000 0.025 0.000
Connection to capital providers 0.328 0.000 0.196 0.000 *** ***
Log (Total assets) 6.880 6.860 5.907 5.905 *** ***
Firm age 18.405 14.000 17.452 14.000 *** ***
ROA -0.027 0.035 -0.064 0.030 *** ***
Dividend payer 0.375 0.000 0.297 0.000 *** ***
Tobin’s Q 2.094 1.589 2.211 1.607 ***
Prior year return 0.174 0.082 0.179 0.063 ***
Prior year SEO 0.060 0.000 0.055 0.000 * *
Leverage 0.247 0.209 0.183 0.120 *** ***
Rated 0.412 0.000 0.231 0.000 *** ***
Tangibility 0.271 0.182 0.229 0.152 *** ***
Cash 0.195 0.104 0.240 0.149 *** ***
Capex 0.054 0.033 0.049 0.029 *** ***

41
Panel C: Pearson correlation
Variable SEO IB
director
IB
director
(%)
Board
independence
Connections
to IB
directors
Interlocked
peer SEO
Connection
to capital
providers
Log
(Total
assets)
Firm
age
ROA Dividend
payer
Tobin’s
Q
Prior
year
return
Prior
year
SEO
Leverage Rated Tangibility Cash Capex
SEO 1.00
IB director 0.01 1.00
IB director (%) 0.02 0.84 1.00
Board independence 0.00 0.14 0.11 1.00
Connection to IB directors 0.00 0.31 0.18 0.36 1.00
Interlocked peer SEO 0.12 -0.01 -0.01 0.06 0.10 1.00
Connection to capital providers -0.05 0.15 0.09 0.16 0.35 -0.05 1.00
Log (Total assets) -0.10 0.24 0.15 0.25 0.51 -0.05 0.35 1.00
Firm age -0.11 0.03 -0.04 0.15 0.19 -0.09 0.22 0.33 1.00
ROA -0.17 0.05 0.03 0.02 0.08 -0.12 0.12 0.38 0.17 1.00
Dividend payer -0.11 0.08 0.02 0.09 0.21 -0.08 0.24 0.41 0.42 0.23 1.00
Tobin’s Q 0.13 -0.03 -0.03 -0.06 -0.02 0.11 -0.06 -0.22 -0.17 -0.29 -0.11 1
Prior year return 0.05 0.00 -0.01 -0.03 -0.02 0.01 -0.01 0.00 0.00 0.15 -0.01 0.08 1.00
Prior year SEO 0.18 0.01 0.02 0.01 0.00 0.12 -0.05 -0.06 -0.10 -0.12 -0.12 0.02 0.08 1.00
Leverage 0.03 0.14 0.14 0.08 0.13 0.00 0.09 0.27 0.02 -0.07 0.06 0.00 -0.04 0.00 1.00
Rated -0.04 0.19 0.12 0.21 0.37 -0.05 0.26 0.67 0.30 0.16 0.30 0.04 0.00 -0.03 0.39 1.00
Tangibility 0.00 0.09 0.09 0.00 0.01 -0.05 0.07 0.24 0.08 0.12 0.17 -0.01 -0.01 -0.02 0.29 0.23 1.00
Cash 0.14 -0.09 -0.07 -0.03 -0.06 0.22 -0.17 -0.40 -0.27 -0.31 -0.29 0.03 0.03 0.17 -0.33 -0.34 -0.43 1.00
Capex 0.05 0.04 0.05 -0.04 -0.04 -0.01 -0.01 0.10 -0.05 0.06 0.02 0.00 -0.04 0.03 0.12 0.07 0.66 -0.22 1.00

42
Table 4. SEO propensity
This table presents results of regression analysis of the probability that a firm does at least one SEO in a given year.
The sample consists of 37,844 firm-year observations by merging CRSP, Compustat, and BoardEx databases over the
period 2001-2015. The dependent variable is an indicator variable, SEO, that takes the value of one if a firm does at
least one SEO in a given year, and zero otherwise. Panel A presents the estimation results for the full sample. Panel B
presents results for the subsample that excludes firm-year observations where the IB director’s tenure on a board is
less than three years. Column (1) presents the standard probit regression results. Column (2) presents the recursive
bivariate probit regression results. Columns (3) and (4) report the two-stage least squares (2SLS) regression results
without and with firm fixed effects, respectively. Detailed definitions of all variables are provided in the Appendix.
All regressions include year fixed effects and industry (two-digit SIC) fixed effects. Robust standard errors, adjusted
for firm-level clustering, are in parentheses. ***, **, and * denote statistical significance at the 1%, 5%, and 10%
levels, respectively.
Panel A: Full sample
SEO
Probit Biprobit 2SLS
Variable (1) (2) (3) (4)
IB director 0.008*** 0.028*** 0.050*** 0.077** (0.003) (0.011) (0.013) (0.037)
Board independence 0.010 0.003 -0.003 -0.008 (0.013) (0.014) (0.013) (0.023)
Interlocked peer SEO 0.031*** 0.032*** 0.088*** 0.015 (0.005) (0.005) (0.015) (0.015)
Connection to capital providers -0.000 -0.003 -0.004 -0.006 (0.003) (0.003) (0.003) (0.004)
Log (Total assets) -0.005*** -0.006*** -0.006*** -0.045*** (0.001) (0.001) (0.001) (0.004)
Log (1+Firm age) -0.017*** -0.017*** -0.016*** -0.029*** (0.001) (0.001) (0.002) (0.007)
ROA -0.022*** -0.026*** -0.061*** -0.002
(0.003) (0.003) (0.008) (0.008)
Dividend payer -0.024*** -0.024*** -0.014*** 0.009**
(0.003) (0.003) (0.003) (0.004)
Tobin’s Q 0.002*** 0.002*** 0.005*** 0.008
(0.001) (0.001) (0.001) (0.004)
Prior year return 0.015*** 0.017*** 0.022*** 0.017***
(0.002) (0.002) (0.003) (0.003)
Prior year SEO 0.074*** 0.073*** 0.114*** -0.071***
(0.007) (0.007) (0.009) (0.010)
Leverage 0.032*** 0.030*** 0.030*** 0.075***
(0.007) (0.006) (0.009) (0.015)
Rated 0.013*** 0.013*** 0.009** 0.009
(0.004) (0.004) (0.004) (0.009)
Tangibility 0.001 -0.001 -0.008 -0.047
(0.010) (0.010) (0.011) (0.031)
Cash 0.024*** 0.023*** 0.035*** -0.119***
(0.006) (0.007) (0.009) (0.017)

43
Capex 0.132*** 0.147*** 0.207*** 0.142***
(0.025) (0.024) (0.039) (0.049)
Year FE Yes Yes Yes Yes
Industry FE Yes Yes Yes No
Firm FE No No No Yes
Observations 37,615 37,844 37,844 37,844
R2 (Pseudo R2 for probit and within R2
for fixed-effect 2SLS ) 0.167 - 0.088 0.024
First stage:
Instrument: Connection to IB directors 1.391*** 0.493*** 0.241***
(0.089) (0.031) (0.032)
λ2-statistics - 4.031 - -
Prob > λ2 - 0.045 - -
F-statistics - - 162.756 352.270
Prob > F - - 0.000 0.000

44
Panel B: Removing firm-years with recently hired IB directors
SEO Probit Biprobit 2SLS
Variable (1) (2) (3) (4)
IB director 0.007** 0.025* 0.048*** 0.094* (0.003) (0.014) (0.016) (0.057)
Board independence 0.018 0.012 0.004 -0.018 (0.013) (0.014) (0.014) (0.024)
Peer interlock SEO 0.028*** 0.028*** 0.076*** 0.013 (0.006) (0.006) (0.016) (0.010)
Connection to capital providers -0.001 -0.002 -0.004 -0.009 (0.003) (0.004) (0.003) (0.005)
Log (Total assets) -0.005*** -0.006*** -0.006*** -0.048*** (0.001) (0.001) (0.001) (0.003)
Log (1+Firm age) -0.017*** -0.018*** -0.019*** -0.028*** (0.002) (0.002) (0.002) (0.006)
ROA -0.021*** -0.021*** -0.059*** -0.004 (0.003) (0.003) (0.008) (0.006)
Dividend payer -0.023*** -0.024*** -0.013*** 0.009* (0.003) (0.003) (0.003) (0.005)
Tobin’s Q 0.002*** 0.002*** 0.005*** 0.007** (0.000) (0.001) (0.001) (0.001)
Prior year return 0.014*** 0.014*** 0.019*** 0.016*** (0.002) (0.002) (0.003) (0.002)
Prior year SEO 0.074*** 0.073*** 0.115*** -0.075*** (0.007) (0.007) (0.010) (0.010)
Leverage 0.028*** 0.027*** 0.031*** 0.079*** (0.006) (0.006) (0.010) (0.010)
Rated 0.015*** 0.015*** 0.010*** 0.009 (0.005) (0.005) (0.004) (0.008)
Tangibility -0.003 -0.004 -0.015 -0.052** (0.010) (0.010) (0.011) (0.023)
Cash 0.017*** 0.016*** 0.032*** -0.121*** (0.007) (0.007) (0.009) (0.014)
Capex 0.150*** 0.152*** 0.233*** 0.161***
(0.026) (0.027) (0.042) (0.039)
Year FE Yes Yes Yes Yes
Industry FE Yes Yes Yes No
Firm FE No No No Yes
Observations 32,073 32,313 32,313 32,313
R2 (Pseudo R2 for probit and within R2
for fixed-effect 2SLS ) 0.165 - 0.087 0.026
First stage:
Instrument: Connection to IB directors 1.460*** 0.466*** 0.154*** (0.099) (0.031) (0.013)

45
λ2-statistics - 2.187 - -
Prob > λ2 - 0.139 - -
F-statistics - - 121.913 141.560
Prob > F - - 0.000 0.000

46
Table 5. SEO announcement returns
This table presents results of regression analysis of two-day cumulative abnormal returns (CARs) around the SEO
filing date. Panel A presents the sample formation process. Panel B presents regression results of CARs around the
SEO filing date. Column (1) presents the OLS regression results. Column (2) presents results from a two-stage
Heckman selection model, where the Inverse Mills ratio is added as an additional independent variable in the second-
stage estimation of CARs. Detailed definitions of all variables are provided in the Appendix. All regressions include
year fixed effects and industry (two-digit SIC) fixed effects. Robust standard errors, adjusted for firm-level clustering,
are in parentheses. ***, **, and * denote statistical significance at the 1%, 5%, and 10% levels, respectively.
Panel A: Sample formation
Total SEO announcements 2,508
- announcements with missing data to compute CAR -228
- announcements with confounding earnings announcements during the event window -205
- announcements with concurrent affiliation of IB directors -25
- announcements with missing control variable information -35
Final sample 2,015

47
Panel B: Multivariate regressions
CAR OLS Heckman
Variable (1) (2)
IB director 0.007** 0.006* (0.003) (0.003)
Board independence -0.008 -0.008 (0.017) (0.017)
Interlocked peer SEO -0.002 -0.002 (0.005) (0.005)
Connection to capital providers -0.001 0.000 (0.004) (0.004)
Log (Total assets) 0.005** 0.005** (0.002) (0.002)
ROA -0.006 -0.005 (0.007) (0.007)
Tobin’s Q 0.000 -0.000 (0.000) (0.001)
Prior year return 0.001 0.002 (0.002) (0.002)
Prior year SEO -0.003 -0.004 (0.004) (0.004)
Leverage 0.019** 0.017* (0.009) (0.009)
Rated -0.003 -0.003 (0.005) (0.006)
Tangibility -0.001 0.004 (0.014) (0.013)
Cash 0.014 0.018 (0.010) (0.011)
Capex -0.049* -0.048 (0.027) (0.030)
Return std -0.169 -0.188 (0.117) (0.116)
Share turnover -0.602*** -0.587*** (0.179) (0.178)
Relative size -0.011 -0.005 (0.013) (0.013)
Secondary -0.018* -0.018* (0.009) (0.010)
Underwriter ranking 0.0001 0.000 (0.001) (0.001)
Log (1+#Analysts) -0.003 -0.003 (0.002) (0.003)
Inverse Mills Ratio 0.001 (0.008)
Year FE Yes Yes
Industry FE Yes Yes
Observations 2,015 2,003
R2 0.10 0.10

48
Table 6. SEO underpricing
This table presents results of regression analysis of SEO underpricing. Column (1) presents the OLS regression results.
Column (2) presents results from a two-stage Heckman selection model, where the Inverse Mills ratio is added as an
additional independent variable in the second-stage estimation of SEO underpricing. Column (3) presents the 2SLS
results for the full sample. Column (4) presents the 2SLS results for the subsample that excludes firm-year
observations where the IB director’s tenure on a board is less than three years. Detailed definitions of all variables are
provided in the Appendix. All regressions include year fixed effects and industry (two-digit SIC) fixed effects. Robust
standard errors, adjusted for firm-level clustering, are in parentheses. ***, **, and * denote statistical significance at
the 1%, 5%, and 10% levels, respectively.
Underpricing
OLS Heckman 2SLS Subsample 2SLS
Variable (1) (2) (3) (4)
IB director -0.005** -0.004** -0.019* -0.026*
(0.002) (0.002) (0.010) (0.014)
Board independence 0.009 0.009 0.017 0.012
(0.011) (0.011) (0.013) (0.015)
Interlocked peer SEO -0.006* -0.004 -0.006 -0.005
(0.003) (0.004) (0.004) (0.004)
Connection to capital providers -0.000 -0.001 0.000 -0.001
(0.003) (0.003) (0.003) (0.003)
Log (Total assets) -0.001 -0.001 -0.001 0.000
(0.001) (0.001) (0.002) (0.002)
ROA -0.006 -0.008 -0.007 -0.010
(0.005) (0.005) (0.005) (0.006)
Tobin’s Q -0.000 -0.000 -0.000 -0.000
(0.000) (0.001) (0.001) (0.001)
Prior year return -0.002* -0.001 -0.002* -0.002*
(0.001) (0.001) (0.001) (0.001)
Prior year SEO -0.001 0.001 0.000 -0.001
(0.002) (0.003) (0.002) (0.003)
Leverage 0.005 0.008 0.008 0.011**
(0.005) (0.005) (0.005) (0.006)
Rated 0.000 0.001 -0.000 -0.002
(0.003) (0.003) (0.003) (0.004)
Tangibility 0.001 0.002 0.003 -0.002
(0.006) (0.007) (0.007) (0.007)
Cash 0.003 0.007 0.003 -0.002
(0.006) (0.007) (0.006) (0.007)
Capex 0.017 0.028* 0.016 0.029
(0.016) (0.017) (0.016) (0.019)

49
Return std 0.331*** 0.338*** 0.322*** 0.293***
(0.089) (0.090) (0.089) (0.095)
Relative size 0.017 0.016 0.013 0.003
(0.014) (0.014) (0.014) (0.018)
PreCAR 0.040*** 0.039*** 0.038*** 0.045***
(0.014) (0.014) (0.014) (0.017)
Log (Stock price) -0.012*** -0.011*** -0.012*** -0.011***
(0.002) (0.002) (0.002) (0.002)
IPO underpricing 0.0001 0.000 0.000 0.000
(0.000) (0.000) (0.000) (0.000)
Underwriter ranking -0.001 -0.001 -0.001 -0.001*
(0.000) (0.000) (0.000) (0.001)
Log (1+#Analysts) -0.003* -0.003** -0.003* -0.001
(0.001) (0.001) (0.002) (0.002)
Inverse Mills ratio 0.007*
(0.004)
Year FE Yes Yes Yes Yes
Observations 2,196 2,196 2,196 1,806
R2 0.20 0.20 0.17 0.16
First stage:
Instrument: Connection to IB directors 0.545*** 0.504***
(0.065) (0.091)
F-statistics 21.446 16.514
Prob > F 0.000 0.000

50
Table 7. SEO gross spread
This table presents results of regression analysis of gross spreads paid to investment banks. Column (1) presents the
OLS regression results. Column (2) presents results from a two-stage Heckman selection model, where the Inverse
Mills ratio is added as an additional independent variable in the second-stage estimation of gross spreads. Column (3)
presents the 2SLS estimation results for the full sample. Column (4) presents the 2SLS results for the subsample that
excludes firm-year observations where the IB director’s tenure on a board is less than three years respectively. Detailed
definitions of all variables are provided in the Appendix. All regressions include year fixed effects and industry (two-
digit SIC) fixed effects. Robust standard errors, adjusted for firm-level clustering, are in parentheses. ***, **, and *
denote statistical significance at the 1%, 5%, and 10% levels, respectively.
Log (Gross spread)
OLS Heckman 2SLS Subsample 2SLS
Variable (1) (2) (3) (4)
IB director -0.050** -0.046** -0.261*** -0.307** (0.023) (0.024) (0.096) (0.131)
Board independence 0.122 0.111 0.224* 0.159 (0.116) (0.117) (0.129) (0.127)
Interlocked peer SEO 0.011 0.017 0.017 0.010 (0.040) (0.041) (0.041) (0.052)
Connection to capital providers 0.011 0.015 0.029 0.014 (0.040) (0.031) (0.031) (0.035)
Log (Total assets) -0.119*** -0.122*** -0.108*** -0.118*** (0.022) (0.023) (0.024) (0.025)
ROA 0.102*** 0.099*** 0.106*** 0.092*** (0.031) (0.035) (0.035) (0.036)
Tobin’s Q -0.013 -0.013* -0.013* -0.016* (0.007) (0.007) (0.007) (0.008)
Prior year return 0.010 0.011 0.017* 0.012 (0.008) (0.008) (0.010) (0.010)
Prior year SEO 0.026 0.034 0.031 0.019 (0.023) (0.024) (0.024) (0.026)
Leverage 0.025 0.033 0.049 0.063 (0.048) (0.050) (0.051) (0.052)
Rated -0.077* -0.078* -0.086** -0.077** (0.041) (0.042) (0.043) (0.047)
Tangibility 0.019 0.021 0.018 -0.034 (0.080) (0.081) (0.084) (0.102)
Cash -0.080 -0.074 -0.096 -0.116** (0.061) (0.062) (0.063) (0.063)
Capex -0.065 -0.035 -0.104 -0.054 (0.154) (0.163) (0.164) (0.193)
Return std -0.216 -0.226 -0.015 -0.624* (0.679) (0.697) (0.694) (0.726)
Share turnover -1.489 -1.448 -1.935 -1.337 (1.208) (1.213) (1.292) (1.309)
Relative size 0.370*** 0.380*** 0.351*** 0.257*** (0.106) (0.106) (0.106) (0.095)
Log (Stock price) -0.044*** -0.042*** -0.050*** -0.058*** (0.015) (0.015) (0.017) (0.020)
Underwriter ranking 0.008* 0.009** 0.007 0.006 (0.004) (0.004) (0.004) (0.005)

51
Log (1+#Analysts) -0.034** -0.035** -0.038** -0.022 (0.015) (0.015) (0.016) (0.018)
Log (1+#Bookrunners) 0.337*** 0.337*** 0.371*** 0.385*** (0.054) (0.055) (0.061) (0.069)
Inverse Mills ratio 0.024
(0.044)
Year FE Yes Yes Yes Yes
Industry FE Yes Yes Yes Yes
Observations 2,097 2,097 2,097 1,685
R2 0.29 0.29 0.25 0.26
First stage:
Instrument: Connections to IB directors 0.606*** 0.508***
(0.052) (0.057)
F-statistics 31.071 18.493
Prob > F 0.000 0.000

52
Table 8: Mechanisms
This table explores the mechanism underlying the effect of IB directors in SEOs. The second-stage results of 2SLS
regressions are reported. In column (1), the dependent variable is a firm’s stock return volatility. In column (2), the
dependent variable is accrual quality, constructed following Lee and Masulis (2009), which is based on the standard
deviation of residuals from regressing current accruals on operating cash flows in the prior, current, and subsequent
years. Larger standard deviation implies poorer quality accounting information. In column (3), the dependent variable
is analyst forecast errors. Detailed definitions of all variables are provided in the Appendix. All regressions include
year fixed effects and industry (two-digit SIC) fixed effects. Robust standard errors, adjusted for firm-level clustering,
are in parentheses. ***, **, and * denote statistical significance at the 1%, 5%, and 10% levels, respectively.
Second-Stage of 2SLS
Stock return volatility Accrual quality Analyst forecast error
Variable (1) (2) (3)
IB director -0.009** -0.017*** -0.078** (0.005) (0.007) (0.031)
Board independence 0.007 -0.005 0.020 (0.006) (0.009) (0.038)
Log (Total assets) -0.010*** 0.002* -0.012*** (0.001) (0.001) (0.004)
Log (1+Firm age) -0.006*** -0.004*** -0.005 (0.001) (0.001) (0.005)
ROA -0.068*** -0.054*** -0.071*** (0.004) (0.007) (0.017)
Dividend payer -0.024*** 0.001 -0.049*** (0.001) (0.001) (0.008)
Tobin’s Q -0.003*** 0.005*** -0.013*** (0.000) (0.001) (0.003)
Prior year return 0.001 0.001 -0.031*** (0.001) (0.001) (0.005)
Leverage 0.038*** 0.008 0.096*** (0.003) (0.006) (0.020)
Rated 0.003* -0.003 0.016 (0.002) (0.002) (0.014)
Tangibility 0.000 -0.001 0.066** (0.004) (0.005) (0.030)
Cash 0.008** -0.017*** 0.048** (0.003) (0.005) (0.021)
Capex 0.025** 0.054*** -0.035 (0.012) (0.017) (0.086)
Cash flow volatility 0.002*** 0.015*** -0.000 (0.001) (0.002) (0.003)
Log (1+#Analysts) -0.001 -0.007*** -0.064*** (0.001) (0.001) (0.007)
Year FE Yes Yes Yes
Industry FE Yes Yes Yes
Observations 30,420 27,235 19,908
R2 0.38 0.18 0.07
First stage:
Instrument: Connection to IB directors 0.510*** 0.521*** 0.491*** (0.013) (0.015) (0.017)
F-statistics 145.149 135.454 106.868
Prob > F 0.000 0.000 0.000

53
Table 9. Use of SEO proceeds and long-run operating performance
This table presents median changes in SEO firms’ cash holdings, investment, and operating performance for two
subsamples partitioned by the presence of IB directors. Panel A presents median changes in raw measures for SEO
firms with IB directors and matching SEO firms without IB directors. Matching firms are chosen using the following
algorithm: 1) If there is at least one SEO firm without IB directors in the same four-digit SIC industry in the same
year, the one with the closest operating performance measured in year -1 is used (year 0 is the SEO year); ii) if no
matching firm is found, we then search for a match at a broader SIC level. Panel B presents median changes in
benchmark-adjusted measures for SEO firms with and without IB directors, respectively. To obtain benchmark firms,
we pair each SEO firm with a set of matching non-SEO firms by selecting firms with the same SIC code (starting with
four-digit SIC) and operating performance within 90% to 110% of the SEO firms’ performance in year -1. Benchmark-
adjusted measure is then calculated as the difference between the measure of SEO firm and the median measure of
matching firms. Changes in both the raw measures and the benchmark-adjusted measures are reported for three
different event windows ranging from the one year prior to the SEO to one year, two years, and three years after the
offer, respectively. Numbers in parentheses indicate the number of observations in each matching sample. ***, **,
and * denote statistical significance at the 1%, 5%, and 10% levels based on the Wilcoxon tests.
Panel A: Raw measures for SEO firms with IB directors and matching SEO firms without IB directors
Variables Event windows SEOs with IB directors SEOs without IB directors Difference
Cash
(-1,+1) 0.002 0.002
(630) (630)
(-1,+2) 0.000 0.002
(518) (518)
(-1,+3) -0.005 0.001 **
(407) (407)
Investment
(-1,+1) -0.003 -0.016 ***
(630) (630)
(-1,+2) -0.003 -0.012 **
(518) (518)
(-1,+3) -0.004 -0.017 ***
(405) (405)
Operating
performance
(-1,+1) 0.009 0.005 **
(633) (633)
(-1,+2) 0.011 0.006 *
(518) (518)
(-1,+3) 0.017 0.000 **
(407) (407)

54
Panel B: Benchmark-adjusted measures for SEO firms with IB directors and SEO firms without IB directors
Variables Event windows SEOs with IB directors SEOs without IB directors Difference
Cash
(-1,+1) -0.005 0.001
(612) (886)
(-1,+2) 0.001 0.005 **
(509) (720)
(-1,+3) 0.000 0.004
(424) (596)
Investment
(-1,+1) -0.002 -0.004
(607) (880)
(-1,+2) 0.001 -0.011 ***
(507) (729)
(-1,+3) -0.001 -0.011 **
414 590
Operating
performance
(-1,+1) 0.011 0.001 ***
(621) (887)
(-1,+2) 0.011 0.005 *
(517) (715)
(-1,+3) 0.020 0.003 **
(422) (581)
55
Table 10. Long-run stock performance
This table presents the median buy-and-hold abnormal returns (BHARs) across subsamples partitioned by the presence
of IB directors. A buy-and-hold return is calculated for the SEO firm for up to three years after the offer. Panel A
presents market-adjusted BHARs where the return on the CRSP value-weighted index is the market return. Panel B
presents Fama-French adjusted BHARs, calculated by first regressing the five-year monthly returns leading up to
SEOs on the monthly Fama-French three factors and then using the estimated coefficients to calculate the firm’s
monthly abnormal returns before compounding. Panel C presents benchmark-adjusted BHARs. Each SEO firm is
matched to a control firm that has market values of equity between 70% and 130% of that of the SEO sample firm and
whose book-to-market ratio is closest to that of the sample firm. Benchmark-adjusted BHARs is then calculated as
the difference between the BHARs of a SEO firm and the median BHARs of matching firms. Numbers in parentheses
indicate the number of observations in each matching sample. ***, **, and * denote statistical significance at the 1%,
5%, and 10% levels based on the Wilcoxon tests.
Panel A: Market-adjusted buy-and-hold returns
Panel B: Fama-French adjusted buy-and-hold returns
Panel C: Benchmark-adjusted buy-and-hold returns
Event windows SEOs with IB directors SEOs without IB directors Difference
(0, +1) -0.079 -0.178 *** (872) (1349)
(0, +2) -0.106 -0.243 *** (762) (1160)
(0, +3) -0.211 -0.331 ***
(644) (972)
Event windows SEOs with IB directors SEOs without IB directors
(0, +1) -0.133 -0.221 *** (609) (910)
(0, +2) -0.239 -0.327 ** (539) (792)
(0, +3) -0.187 -0.347 **
(458) (670)
Event windows SEOs with IB directors SEOs without IB directors Difference
(0, +1) -0.014 -0.078 ** (865) (1,333)
(0, +2) -0.035 -0.103 * (755) (1,145)
(0, +3) -0.097 -0.105
(639) (960)

1
Internet Appendix for “Investment Banker Directors and Seasoned Equity
Offerings”
Table IA1. First-stage instrumental variable (IV) regressions This table presents results of the first-stage IV regressions. Column (1) presents the results for the first-stage bivariate
probit regression (column (2) in Panel A of Table 4). Column (2) presents the first-stage results of 2SLS regressions
(column (3) in Panel A of Table 4). Detailed definitions of all variables are provided in the Appendix. All regressions
include year fixed effects and industry (two-digit SIC) fixed effects. Robust standard errors, adjusted for firm-level
clustering, are in parentheses. ***, **, and * denote statistical significance at the 1%, 5%, and 10% levels, respectively.
Biprobit first stage 2SLS first stage
Variable (1) (2)
Connection to IB directors 1.391*** 0.493***
(0.089) (0.031)
Log (Board size) 0.556*** 0.182***
(0.078) (0.025)
Board independence 0.435** 0.133** (0.176) (0.057)
Interlocked peer SEO -0.246*** -0.086*** (0.068) (0.023)
Connection to capital providers 0.049 0.019 (0.038) (0.013)
Log (Total assets) -0.002 -0.001 (0.016) (0.005)
Log (1+Firm age) -0.079*** -0.027*** (0.020) (0.007)
ROA 0.032 0.012 (0.044) (0.014)
Dividend payer -0.030 -0.009 (0.042) (0.014)
Tobin’s Q -0.001 0.000 (0.008) (0.002)
Prior year return 0.012 0.003 (0.012) (0.004)
Prior year SEO 0.109*** 0.036*** (0.036) (0.013)
Leverage 0.324*** 0.111*** (0.076) (0.027)
Rated 0.040 0.019 (0.053) (0.019)
Tangibility 0.286*** 0.097** (0.124) (0.043)
Cash -0.045 -0.019 (0.092) (0.030)
Capex -0.415 -0.150 (0.292) (0.100)
Year FE Yes Yes
Industry FE Yes Yes
Observations 37,844 37,844
R2 (Pseudo R2 for probit) 0.1151 0.1455

2
Table IA2. SEO propensity: robustness checks
This table presents results of regression analysis of the number of SEOs and the size of SEO deals in a given year.
The sample consists of 37,844 firm-year observations by merging CRSP, Compustat, and BoardEx databases over the
period 2001-2015. In Panel A, the dependent variable is the natural logarithm of one plus the number of SEOs during
the year. In Panel B, the dependent variable is the natural logarithm of one plus total SEO proceeds scaled by issuers’
market capitalization. Column (1) presents the OLS regression results. Columns (2) and (3) report the 2SLS results
for the full sample and for the subsample that excludes firm-year observations where the IB director’s tenure on board
is less than three years, respectively. Column (4) presents the 2SLS results with firm fixed effects. Detailed definitions
of all variables are provided in the Appendix. All regressions include the same set of control variables as in Table 4.
Robust standard errors, adjusted for firm-level clustering, are in parentheses. ***, **, and * denote statistical
significance at the 1%, 5%, and 10% levels, respectively.
Panel A: The number of SEOs
Log (1 + #SEOs)
OLS 2SLS
Variable (1) (2) (3) (4)
IB director 0.006*** 0.035*** 0.035*** 0.058** (0.002) (0.010) (0.012) (0.028)
Board independence 0.011 -0.002 0.001 -0.006 (0.010) (0.011) (0.011) (0.017)
Firm characteristics Yes Yes Yes Yes
Year FE Yes Yes Yes Yes
Industry FE Yes Yes Yes No
Firm FE No No No Yes
Observations 37,844 37,844 32,313 37,844
R2 0.1011 0.0953 0.0939 0.0267
Panel B: The volume of SEOs
Log (1 + Proceeds / Mktcap)
OLS 2SLS
Variable (1) (2) (3) (4)
IB director 0.002*** 0.010*** 0.010*** 0.021*** (0.001) (0.003) (0.003) (0.007)
Board independence 0.004 0.000 0.000 -0.001 (0.003) (0.003) (0.003) (0.005)
Firm characteristics Yes Yes Yes Yes
Year FE Yes Yes Yes Yes
Industry FE Yes Yes Yes No
Firm FE No No No Yes
Observations 37,844 37,844 32,313 37,844
R2 0.0796 0.0735 0.0694 0.0251

3
Table IA3. IB directors and SEO issue size
This table presents results of regression analysis of the size of SEO deals. In columns (1) - (3), the dependent variable
is the natural logarithm of net proceeds, the natural logarithm of one plus net proceeds scaled by issuer’s market
capitalization, and the natural logarithm of one plus net proceeds scaled by issuer’s total assets, respectively. Detailed
definitions of all variables are provided in the Appendix. All regressions include the same set of control variables as
in Table 4. Robust standard errors, adjusted for firm-level clustering, are in parentheses. Detailed definitions of all
variables are provided in the Appendix. ***, **, and * denote statistical significance at the 1%, 5%, and 10% levels,
respectively.
Log (Proceeds) Log (1 + Proceeds / Mktcap) Log (1+Proceeds / Total
assets)
Variable (1) (2) (3)
IB director -0.033 -0.008 -0.009
(0.032) (0.009) (0.007)
Firm characteristics Yes Yes Yes
Year FE Yes Yes Yes
Industry FE Yes Yes Yes
Observations 2,220 2,220 2,220
R2 0.7581 0.6229 0.2713
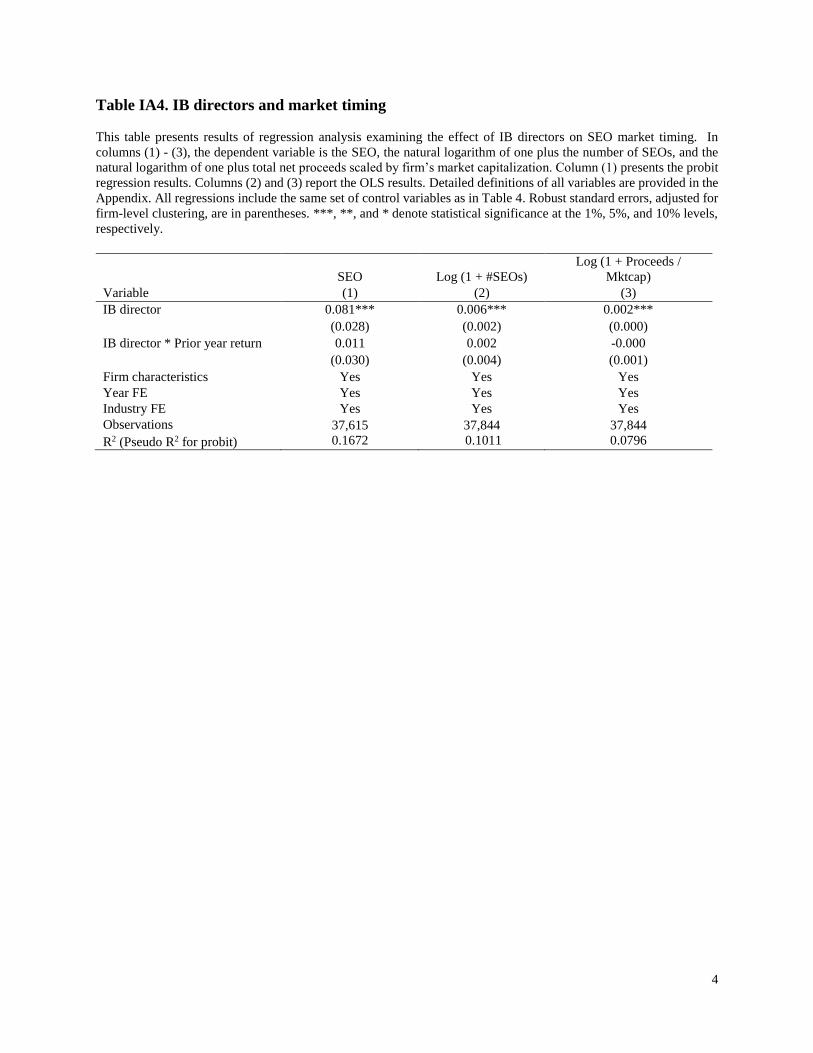
4
Table IA4. IB directors and market timing
This table presents results of regression analysis examining the effect of IB directors on SEO market timing. In
columns (1) - (3), the dependent variable is the SEO, the natural logarithm of one plus the number of SEOs, and the
natural logarithm of one plus total net proceeds scaled by firm’s market capitalization. Column (1) presents the probit
regression results. Columns (2) and (3) report the OLS results. Detailed definitions of all variables are provided in the
Appendix. All regressions include the same set of control variables as in Table 4. Robust standard errors, adjusted for
firm-level clustering, are in parentheses. ***, **, and * denote statistical significance at the 1%, 5%, and 10% levels,
respectively.
SEO Log (1 + #SEOs)
Log (1 + Proceeds /
Mktcap)
Variable (1) (2) (3)
IB director 0.081*** 0.006*** 0.002*** (0.028) (0.002) (0.000)
IB director * Prior year return 0.011 0.002 -0.000 (0.030) (0.004) (0.001)
Firm characteristics Yes Yes Yes
Year FE Yes Yes Yes
Industry FE Yes Yes Yes
Observations 37,615 37,844 37,844
R2 (Pseudo R2 for probit) 0.1672 0.1011 0.0796

5
Table IA5. IB directors and the propensity of issuing corporate bonds
This table presents results of regression analysis of the probability that a firm does at least one public bond offering
in a given year. The dependent variable is an indicator variable, Bond issuance, that takes the value of one if a firm
does at least one bond offering in a given year, and zero otherwise. Column (1) presents the standard probit regression
results. Column (2) presents the recursive bivariate probit regression results. Column (3) presents 2SLS results.
Detailed definitions of all variables are described in the Appendix. All regressions control for calendar year-fixed
effects and industry (2-digit SIC) fixed effects whose coefficients are suppressed for brevity. Robust standard errors,
adjusted for firm-level clustering, are in parentheses. ***, **, and * denote statistical significance at the 1%, 5%, and
10% levels, respectively.
Bond issuance
Probit Biprobit 2SLS
Variable (1) (2) (3)
IB director 0.003 0.022* 0.050*** (0.003) (0.013) (0.017)
Board independence 0.043** 0.033 -0.008 (0.019) (0.020) (0.018)
Interlocked peer bond issuance -0.006 -0.006 -0.010
(0.005) (0.005) (0.007)
Connection to capital providers -0.001 -0.003 0.004 (0.003) (0.004) (0.005)
Log (Total assets) 0.041*** 0.040*** 0.031*** (0.001) (0.002) (0.002)
Log (1+Firm age) 0.001 0.002 0.009*** (0.002) (0.002) (0.002)
ROA -0.025*** -0.025*** -0.031*** (0.006) (0.006) (0.004)
Dividend payer -0.029*** -0.029*** -0.023*** (0.004) (0.004) (0.005)
Tobin’s Q 0.003*** 0.003** 0.002** (0.001) (0.001) (0.001)
Prior year return 0.015*** 0.015*** 0.010*** (0.003) (0.003) (0.002)
Prior year bond issuance 0.103*** 0.103*** 0.210***
(0.006) (0.006) (0.010)
Leverage 0.076*** 0.074*** 0.034*** (0.009) (0.009) (0.011)
Rated 0.060*** 0.059*** 0.102*** (0.005) (0.005) (0.007)
Tangibility 0.001 -0.001 0.008 (0.014) (0.013) (0.016)
Cash 0.006 0.005 0.007 (0.011) (0.011) (0.008)
Capex 0.185*** 0.189*** 0.149*** (0.038) (0.038) (0.044)

6
Year FE Yes Yes Yes
Industry FE Yes Yes Yes
Observations 37,598 37,844 37,844
R2 (Pseudo R2 for probit) 0.284 - 0.222
First stage:
Instrument: Connection to IB directors 1.383*** 0.490***
(0.089) (0.031)
λ2-statistics - 2.561 -
Prob > λ2 - 0.094 -
F-statistics - - 160.581
Prob > F - - 0.000

7
Table IA6. IB directors and the cost of corporate bonds
This table presents results of regression analysis of the cost of corporate bonds. Panel A presents univariate results for
the relation between the presence of IB directors and a firm’s cost of corporate bonds. Panel B presents results of
multivariate regression analysis. The dependent variable is the natural logarithm of the bond spread, defined as the
difference between the offering yield of a corporate bond at issue minus the yield of the maturity-matched Treasury
bond. Column (1) presents the OLS regression results. Column (2) presents the 2SLS second-stage results. Bond
seniority includes indicator variables flagging whether the bond is secured or subordinated. Bond features includes
indicator variables flagging whether the bond is puttable, convertible, redeemable or exchangeable. Macroeconomic
controls include default spread, which is the yield spread between BAA and AAA corporate bond indices, and term
spread, which is the yield spread between ten-year Treasury bonds and three-month Treasury bills. Detailed definitions
of all variables are provided in the Appendix. All regressions include year fixed effects and industry (two-digit SIC)
fixed effects. Robust standard errors, adjusted for firm-level clustering, are in parentheses. ***, **, and * denote
statistical significance at the 1%, 5%, and 10% levels, respectively.
Panel A: Univariate analysis
With IB directors Without IB directors
# obs Mean Median # obs Mean Median
Bond spread 3,396 188.87 148.60 2,540 178.72 143.48**
Log (Bond spread) 3,035 5.13 5.13 2,086 5.21*** 5.24***
Panel B: Multivariate analysis
Log (Bond spread)
OLS 2SLS
Variable (1) (2)
IB director 0.004 0.116
(0.019) (0.109)
Board independence -0.103 -0.144
(0.126) (0.133)
Connection to capital providers -0.001 -0.013
(0.018) (0.022)
Log (Total assets) -0.098*** -0.105***
(0.014) (0.016)
ROA -0.326** -0.364**
(0.138) (0.144)
Tobin’s Q -0.091*** -0.095***
(0.020) (0.021)
Prior year return -0.088*** -0.086***
(0.022) (0.022)
Leverage 0.144* 0.131*
(0.078) (0.079)
Tangibility -0.022 -0.036
(0.084) (0.085)
Cash 0.159 0.124
(0.116) (0.120)
Capex 0.017 0.049
(0.201) (0.202)
Return std 9.009*** 9.190***
(1.239) (1.255)

8
Log (1+#Analysts) -0.036** -0.032*
(0.018) (0.019)
Z-Score -0.012 -0.011
(0.009) (0.009)
Log (Bond size) 0.086*** 0.085***
(0.018) (0.018)
Log (Bond maturity) 0.182*** 0.183***
(0.018) (0.018)
Bond ratings Yes Yes
Bond seniority Yes Yes
Bond features Yes Yes
Macro controls Yes Yes
Year FE Yes Yes
Industry FE Yes Yes
Observations 4,760 4,760
R2 0.7322 0.7289
F-statistics 19.655
Prob > F 0.000

9
Table IA7. IB directors and the propensity of obtaining bank loans
This table presents results of regression analysis of the probability that a firm obtains at least one bank loan in a given
year. The dependent variable is an indicator variable, Obtaining loan, that takes the value of one if a firm obtains at
least one bank loan in a given year, and zero otherwise. Column (1) presents the standard probit regression results.
Column (2) presents the recursive bivariate probit regression results. Column (3) presents 2SLS results. Detailed
definitions of all variables are described in the Appendix. All regressions control for calendar year-fixed effects and
industry (2-digit SIC) fixed effects whose coefficients are suppressed for brevity. Robust standard errors, adjusted for
firm-level clustering, are in parentheses. ***, **, and * denote statistical significance at the 1%, 5%, and 10% levels,
respectively.
Obtaining loan
Probit Biprobit 2SLS
Variable (1) (2) (3)
IB director -0.006 0.006 0.033 (0.006) (0.028) (0.030)
Board independence 0.144*** 0.144*** 0.127*** (0.032) (0.034) (0.033)
Interlocked peer loan -0.002 -0.002 -0.005 (0.009) (0.009) (0.010)
Connection to capital providers 0.016** 0.015** 0.019** (0.007) (0.007) (0.008)
Log (Total assets) 0.054*** 0.053*** 0.048*** (0.003) (0.003) (0.003)
Log (1+Firm age) -0.017*** -0.017*** -0.012*** (0.004) (0.004) (0.004)
ROA 0.018 0.019 -0.028 (0.023) (0.023) (0.017)
Dividend payer 0.020*** 0.020*** 0.026*** (0.007) (0.007) (0.008)
Tobin’s Q 0.003 0.003 0.000 (0.004) (0.004) (0.003)
Prior year return 0.019*** 0.019*** 0.017***
(0.005) (0.005) (0.005)
Prior year loan 0.013** 0.013** 0.022** (0.007) (0.007) (0.007)
Leverage 0.044** 0.042** 0.027** (0.019) (0.019) (0.019)
Rated 0.024*** 0.023*** 0.046*** (0.009) (0.009) (0.009)
Tangibility -0.044* -0.044* -0.041* (0.023) (0.023) (0.025)
Cash -0.399*** -0.398*** -0.314*** (0.025) (0.025) (0.020)
Capex 0.325*** 0.328*** 0.302*** (0.067) (0.068) (0.072)
10
Year FE Yes Yes Yes
Industry FE Yes Yes Yes
Observations 23,342 23,344 23,344
R2 (Pseudo R2 for probit) 0.1323 - 0.088
First stage:
Instrument: Connection to IB directors 1.409*** 0.500***
(0.110) (0.038)
λ2-statistics - 0.1997 -
Prob > λ2 - 0.655 -
F-statistics - - 114.680
Prob > F - - 0.000

11
Table IA8. IB directors and the cost of bank loans
This table presents results of regression analysis of the cost of bank loans. Panel A presents univariate results for the
relation between the presence of IB directors and a firm’s cost of bank loans. Panel B presents the results of
multivariate regression analysis. The dependent variable is the natural logarithm of the all-in spread. Column (1)
presents the OLS regression results. Column (2) presents the 2SLS second-stage results. Loan seniority is an indicator
variable flagging whether the loan is secured. Loan type variables are indicators flagging whether the loan is a term
loan, revolver greater than one year, revolver less than one year, or 364-day facility. Macroeconomic controls include
default spread, which is the yield spread between BAA and AAA corporate bond indices, and term spread, which is
the yield spread between ten-year Treasury bonds and three-month Treasury bills. Detailed definitions of all variables
are provided in the Appendix. All regressions include year fixed effects and industry (two-digit SIC) fixed effects.
Robust standard errors, adjusted for firm-level clustering, are in parentheses. ***, **, and * denote statistical
significance at the 1%, 5%, and 10% levels, respectively.
Panel A: Univariate analysis
With IB directors Without IB directors
# obs Mean Median # obs Mean Median
All-in spread 4,819 184.77 162.50 5,443 196.13*** 175.00***
Log (All-in spread) 4,819 4.90 5.09 5,443 5.01*** 5.17***
Panel B: Multivariate analysis
Log (All-in spread)
OLS 2SLS
Variable (1) (2)
IB director -0.009 -0.081 (0.013) (0.067)
Board independence 0.028 0.063 (0.072) (0.078)
Connection to capital providers -0.035*** -0.032** (0.013) (0.013)
Log (Total assets) -0.017 -0.012 (0.010) (0.011)
ROA -0.634*** -0.620*** (0.082) (0.083)
Tobin’s Q -0.033*** -0.031** (0.012) (0.012)
Prior year return -0.007 -0.007 (0.010) (0.010)
Leverage 0.245*** 0.260*** (0.046) (0.048)
Tangibility -0.151*** -0.151*** (0.048) (0.049)
Cash 0.122* 0.124* (0.066) (0.066)
Capex 0.387** 0.393** (0.152) (0.152)
Return std 4.985*** 5.047*** (0.656) (0.656)

12
Log (1+#Analysts) -0.054*** -0.055***
(0.011) (0.011)
Z-Score -0.019*** -0.019*** (0.004) (0.004)
Log (Loan size) -0.065*** -0.065*** (0.008) (0.008)
Log (Loan maturity) -0.029* -0.026 (0.016) (0.016)
Log (1+# Syndicated lenders) -0.033*** -0.034*** (0.011) (0.011)
Performance pricing dummy -0.074*** -0.071***
(0.013) (0.013)
Credit rating Yes Yes
Loan seniority Yes Yes
Loan type Yes Yes
Macro controls Yes Yes
Year FE Yes Yes
Industry FE Yes Yes
Observations 10,260 10,260
R2 0.7554 0.7538
F-statistics 65.346
Prob > F 0.000