Investment and the Stock Market: Evidence from Arab
59
AMF Economic Papers, Number 8 Arab Stock Markets and Capital Investment Ali A. Bolbol Mohammed M. Omran Economic Policy Institute, AMF Arab Monetary Fund Abu Dhabi, February 2004
Transcript of Investment and the Stock Market: Evidence from Arab

AMF Economic Papers, Number 8
Arab Stock Markets and Capital Investment
Ali A. BolbolMohammed M. Omran
Economic Policy Institute, AMF
Arab Monetary FundAbu Dhabi, February 2004

Arab Stock Markets and Capital Investment
Ali A. Bolbol and Mohammed M. Omran∗ Economic Policy Institute
Arab Monetary Fund
∗ Bolbol, Senior Economist, Omran, Economist, in the Economic Policy Institute
of the Arab Monetary Fund. The authors would like to thank Miss Ayten Fatheldin for her excellent research assistance. The views expressed in the paper are not necessarily those of the Arab Monetary Fund.

AMF Economic papers are written by members of the Economic Policy Institute of the Arab Monetary Fund, from time to time by other economists, and are published by the Fund. The papers are on subjects of topical interest to the Arab countries. The views expressed in them are those of their authors and do not necessarily reflect the views of the Arab Monetary Fund. Copies of publications are available from: Arab Monetary Fund P. O. Box 2818 Abu Dhabi, United Arab Emirates Fax: 971-2-6326454 Arab Monetary Fund 2004. All rights reserved. Brief excerpts may be produced or translated provided the source is stated.

Table of Contents
Abstract..................................................................................2
I- Introduction....................................................................3
II- Model and Methodology................................................8
III- Data and Descriptive Statistics ....................................14
IV- Results and Analysis ....................................................18
V- Payout Ratios and Investment......................................23
VI- Conclusion ...................................................................26
Appendix I ...........................................................................28
Appendix II ..........................................................................31
Tables:..................................................................................32
References............................................................................51
1

Arab Stock Markets and Capital Investment
Abstract
What role do stock returns play in determining investment? In this
paper, we investigate the independent effect of stock returns on
investment within the context of four hypotheses: passive informant,
active informant, financing, and stock market pressure. Using a
sample of 83 firms from five Arab countries during 1996-2001, we find
that the passive informant hypothesis holds true, with only sales and
debt growth as significant determinants of capital expenditures.
Surprisingly, cash flow has no effect on investment, which could
mostly be due to the dividend policy of Arab firms. The fact that Arab
stock markets do not allocate capital expenditures unwarranted by
fundamentals gives support to current efforts at strengthening Arab
stock markets.
2

I- Introduction
It is well recognized that stock markets perform at least three
functions: a signaling mechanism to managers regarding investment, a
source of finance, and a catalyst for corporate governance. It is the
first function, however, that has attracted a lot of investigation,
focusing on whether stock markets or market sentiments influence
investment over and above the influence exerted by fundamentals or
managerial sentiments.1 This issue is important for two reasons. First,
if stock prices affect investment independently of fundamentals, then
the ensuing misallocation of capital can have considerable damage,
especially at the sectoral level.2 Second, in such a case, emerging
economies that are keen on developing stock markets should seriously
reconsider these endeavors in light of the unproductive role that stock
markets could play.
Luckily, the investigations concerning this issue do not seem to
provide much support to the above implications. These investigations
have followed largely two tracks, one tracing investments at the
aggregate level and the other at the firm level. Initially, they were
primarily concerned with developed countries, but increasingly they 1 For a good survey on this literature, see Stein (2001). There are a number of
reasons why market sentiments would differ from managerial sentiments: (i) the market may have less information than managers; (ii) even if their information sets are the same, the market may not value assets at their fundamental value and market valuation may involve a rational bubble; (iii) the market may be liable to fads that make valuations depart from fundamentals for long periods.
3

have included developing countries. At the aggregate level and
focusing primarily on US data, the early evidence supporting a positive
independent relation between stock prices and investment appeared in
Fischer and Merton (1984) who argued that, when stock market
valuation reduces the cost of equity capital, then firms should increase
their investments until the marginal product of capital (MPK) is equal
to the reduced cost of capital. These results were corroborated by
Barro (1990) using q ratios for stock market valuations.3 But it was
Blanchard, Rhee, and Summers (1993) who casted doubt on the
validity of these results by arguing that, if investment proceeds at more
than what is warranted by fundamentals, then MPK would fall below
the cost of capital.4 As a result, they found that market valuations,
based on q ratios, play a limited role in determining investment
decisions after controlling for fundamentals. Extending the analysis to
developing countries, a salient paper by Durham (2000) showed that
stock returns play even a smaller independent role in developing
2 At the aggregate level, investment variations caused by false signals from the
stock market translate to less harmful intertemporal substitution of investment. 3 The q ratio is equal to the firm’s market value divided by its replacement cost;
for early and key analysis of q, see Brainard and Tobin (1968) and Hayashi (1982).
4 According to Morck, Shleifer, and Vishny (1990) this implies that “firms instead may issue the overvalued equity and then invest the proceeds in financial securities which are zero net-present value investments, rather than in negative net-present value projects. In other words, firms issue equity when equity is overpriced, but issue debt or finance internally when equity is not overpriced; investment is the same in either case”. (p. 166).
4

countries, because equity markets there are less effective in distributing
information and signaling productive activities.5
Important as aggregate investment is, it is however investment at the
firm level that deserves more attention, because of its impact on
efficient resource allocation and the development of small-and
medium-sized firms. For developed countries, the paper that pioneered
such studies is Morck, Shleifer, and Vishny (1990). In it, the authors
proposed and tested four stock market hypotheses (passive and active
informant, financing, and market pressure), and found that for US non-
financial firms the stock market is neither a sideshow nor very central
for investment. This ambivalent view toward stock markets, and the
prominence it gave to fundamentals in determining investment, was
reinforced by Samuel (1996) using individual q ratios as a proxy for
the market valuations of firms. In a departure from these results,
however, Stein (1996) and Baker, Stein, and Wurgler (2001) showed
that if managers are financially constrained, then deviations from
fundamentals can increase investments for firms that are in need of
equity capital. These firms are most likely to be young, and to have
high leverage, low cash flows but high cash volatility, and strong
5 Fore more on the differences between developed and developing stock markets
as they relate to aspects dealing with microstructure, asset pricing, and trading systems, see Green, Murinde, and Ngugi (2000). Also, Mauro (2000), capturing a long line of research where income per capita is the dependent variable, showed that stock returns could have a significant effect on income growth if market capitalization to GDP is high and the legal system is of English origin.
5

investment opportunities.6 As a result, in these situations market
inefficiencies may actually be helpful. However, these inefficiencies
may not be as helpful if other firm and market characteristics are
present. Specifically, as in Polk and Sapienza (2002), investment tends
to over-react to stock mispricing for firms with higher R & D intensity
(suggesting longer periods of information asymmetry) and/or higher
share turnover (suggesting that the firms’ shareholders are short-term
investors).7 On balance, though, the bulk of the evidence still does not
seem to seriously challenge the Morck, Shleifer, and Vishny (1990)
finding nor its implication that market inefficiencies play a limited role
in distorting investments.
In the case of developing countries, the importance of stock market
valuations to investment at the firm level acquires an added
significance. This is because of three reasons. First, there is evidence
that, unlike the pecking-order pattern of corporate finance prevailing in
developed countries, some developing countries’ equity finance
exceeds their debt or internal funds finance.8 Second, in the aim of
minimizing the destabilizing impact of capital flows to developing
countries, equity finance introduces risk sharing via reductions in
6 Baker, Stein, and Wurgler (2001) used an index developed by Kaplan and
Zingales (1997) to rank these firms, and found that the sensitivity of investment to q is almost three times as large for firms in the top quintile than for those in the bottom quintile of the index.
7 The excessive capital investments that accompanied the rise in technology stocks on US markets in the second half of the 1990s could be a good example of that; see also Bolbol and Lovewell (2001).
8 See Singh and Hamid (1993).
6

moral hazard with ownership as well as more efficient resource
allocation via share-price signaling.9 Third, developing countries
undergoing liberalization of their trade and interest rates would
experience higher borrowing costs (bankruptcy risk) and higher but
unpredictable returns (risk of losing domestic markets and not
succeeding in foreign markets). As a result, a high perceived variance
of returns would likely reduce the level of borrowing and increase the
resort to equity finance for new investment opportunities.10 This added
level of significance, however, has not been matched by an adequate
interest in research studies. One paper that stands out in this regard is
Demirguc-Kunt and Maksimovic (1996) concerning the financing
choices of firms in developing and developed countries. The authors
found that stock market developments are associated with more
leverage by large firms, whereas small firms do not appear to be
significantly affected.
There is a need, then, to study the effect of stock market performance
on real capital expenditures at the firm level for developing countries.
The aim of our paper is to fill this gap for a group of Arab countries, a
part of the world that is much understudied in the area of financial
economics. A lot of Arab countries have embarked on a process of
privatization and stock market liberalization in the aim – among others
– of deepening their markets and improving their corporate governance
9 See Rogoff (1999).
10 See Snowden (1997).
7

for a nascent private sector.11 As a result, it is worthwhile to see what
impact these reforms have had on stock returns and consequently on
private investment. We will proceed by first outlining the model and
methodology in section II, and there we follow closely the framework
of Morck, Vishny, and Shleifer (1990) as our benchmark model. In
section III we present the data for our cross-section of Arab firms, and
provide descriptive statistics for the variables comprising the estimated
model. Section IV analyzes the results, and they indicate that Arab
stock markets do not seem to provide much input to managers in
designing their investment decisions; they also point that stock market
developments tend to mostly enhance debt financing. In section V we
investigate the reasons behind the lack of a significant relation between
cash flows and investment, and propose some answers that rely on the
dividend policy of Arab firms. Section VI concludes the paper, and
reaffirms the need to further strengthen Arab stock markets.
II- Model and Methodology
To what extent managers of firms pay attention to the stock market in
the Arab world? Arab stock markets have witnessed an expansion in
recent years, and they are relatively active in the reform countries of
Egypt, Jordan, Morocco, and Tunisia, and among the Gulf Cooperation
11 For more on development of Arab stock markets, see AMF (Various Issues).
8

Council (GCC) countries especially in Kuwait and Saudi Arabia.12
There is also evidence of considerable inefficiencies in these markets.13
Given then the degree of Arab stock market development and the
extent of its inefficiency, we will try to answer the above question
using the atheoretical framework of Morck, Shleifer, and Vishny
(1990) as our working model. Specifically, we will investigate the
independent effect of stock returns (as they deviate from fundamentals)
on investment within the context of four hypotheses: (i) passive
informant, which says that stock returns do not carry added
information and managers do not rely on them to undertake
investments. In other words, managers know more than the public or
the econometrician about the investment opportunities facing the firm;
(ii) active informant, where managers sometimes rely on market
information which may or may not be true about fundamentals. This is
mainly because stock prices could be contaminated by sentiments that
managers can not separate from fundamentals;14 (iii) financing, which
12 There are stock markets currently in Algeria, Egypt, Jordan, Lebanon, Morocco,
Sudan, and Tunisia; and in the GCC including Abu Dhabi, Bahrain, Dubai, Kuwait, Qatar, Oman, and Saudi Arabia. The markets, however, are still smaller and less active than the developing countries’ average; for example, in 2001 Arab market capitalization to GDP and turnover ratios averaged 26% and 6% respectively against corresponding averages of 33% and 20% for developing countries. They also suffer from concentrated ownership, modest number of listings, and a fair number of closed companies. As a result, the Arab financial system is still considered largely bank based. For more on these characteristics, see AMF (Various Issues), Bolbol (2001), and Shachmurove (2003).
13 See Omran and Farrar (Forthcoming), and El-Erian and Kumar (1996).
14 As Morck, Shleifer, and Vishny (1990) argue, it is plausible that aggregate stock returns are what matters for this hypothesis, for managers know more things from the stock market about the economy as a whole than about their own firms.
9

argues the common view that the stock market affects investment
through its influence on the cost of funds and external financing. In
this case, stock price appreciations would increase not only the issuing
of equity but also the capacity for transacting more debt due to its
lower cost made feasible by the higher worth of firms; (iv) stock
market pressure, where stock returns could have a separate effect on
investment because managers need to cater to shareholders’ opinions
so as to protect their jobs – as when market sentiment depresses
unnecessarily a firm’s stock prices, and managers refrain from
undertaking worthy investments because of their fear of antagonizing
further sensitive shareholders.
Before we introduce the unstructured equations that capture the
validity of these hypotheses, it is instructive to mention three crucial
points. First, the first hypothesis (passive informant) does not allow
market sentiment to affect investment, i.e. stock prices forecast
investment only to the extent that they forecast fundamentals, but the
other hypotheses do allow it through deviational signals, financing
costs, and pressure on managers. Second, the first hypothesis also can
never be rejected because the independent ability of stock prices to
predict investment might be due to the inability of the econometrician
to model fundamentals adequately. Third, after controlling for
fundamentals and financing, the impact of the active (but faulty)
informant and market pressure hypotheses could be captured but there
is no way to differentiate between either one.
10

Following Morck, Shleifer, and Vishny (1990), we use the following
unstructured four-equations model, placing few restrictions on how the
independent variables enter the investment equations:
}{ ,3,2,1TSALCFINVT
1ti2
T
1ti1
T
1ti =+++=
===εββα (1)
}{ ,3,2,1TRSALCFINV1T
1ti3
T
1ti2
T
1ti1
T
1ti =++++=
−
−====εβββα (2)
}{ 3,2,1TDBTEQSALCFINVT
1ti4
T
1ti3
T
1ti2
T
1ti1
T
1ti =+++++=
=====εββββα
}{ 3,2,1TRDBTEQSALCFINV1T
1ti5
T
1ti4
T
1ti3
T
1ti2
T
1ti1
T
1ti =++++++=
−
−======εβββββα
, (3)
, (4)
where:
T
1tiINV
= is the growth rate of real investment expenditure of firm i over T
periods, in which T takes 1, 2 and 3 years. T
1tiCF
=is the growth rate of real cash flow (after-tax profits plus
depreciation) of firm i over T periods, T
1tiSAL
=is the growth rate of real sales of firm i over T periods,
1T
1tiR
−
−=is the abnormal return of firm i over the period t= -1 to T-1,
T
1tiEQ
=is a dummy variable that takes one if the firm i issued new equity
over T periods, and zero otherwise,
11

T
1tiDBT
= is a dummy variable that takes one if the growth rate in debt of
firm i was positive over T periods, and zero otherwise.
As we can see from the above, all variables are in growth rates rather
than levels so as to ensure that residuals in regressions are not serially
correlated. The dependent variable, investment expenditures, excludes
acquisitions; and fundamentals are represented by cash flows and sales
where both reflect current and future profitability and the ability to
finance internally. We use dummy variables to express growth rates in
equity and debt financing because using continuous variables instead
would have resulted in many outliers. We do not use q ratios to
measure market valuations because of the exacting data requirements
that are needed in their computation, especially in relation to the
replacement costs of firms’ capital stock.15 As a result, we use
abnormal returns, , which are calculated using monthly prices of
stocks and are customarily lagged by a one-year period. In this
context, there is no consensus on the appropriate methodology of
calculating the requisite long-run returns.
1T
1tiR
−
−=
16 Researchers use two
methods to calculate these returns: cumulative return and buy-and-hold
return. Since each method has been shown to yield different results, it
is appropriate to consider both methods in calculating long-run returns.
To arrive at the corresponding cumulative abnormal returns (CARs)
15 See Salinger and Summers (1983) for a suggested methodology on how to
calculate q ratios and Samuel (1996) for its application to US firms. 16 See Kothari and Warner (1997) and Barber, Lyon, and Tsai (1999).
12

and buy-and-hold abnormal returns (BHARs), we utilize both the
market-adjusted model and the Sharp-Lintner Capital Asset Pricing
Model (CAPM), the latter having the advantage of explicitly adjusting
returns for betas and taking as a result the risk factor into consideration
(see Appendix I for derivation of returns). We adopt one-, two-, and
three year non-overlapping periods as our time horizons, so as to
capture any delayed changes in investment due to changes in the
independent variables without unduly adding to the endogeneity
problems that longer horizons usually entail. Lastly, since firms’
characteristics also shape investment expenditures, we repeat
regression equation (4) with dummy variables in order to see the effect
of size (SIZi), industry (INDi), and ownership (OWNi), as follows:
}{ 3,2,1OWNINDSIZERDBTEQSALCFI Ti8i7i6
1T
1ti5
T
1ti4
T
1ti3
T
1ti2
T
1ti1
T
1tiNV =++++
−
−=+
=+
=+
=+
=+=
=εββββββββα , (5)
In addition, we employ both the parametric t test and the non-
parametric Mann-Whitney test to validate the results obtained from the
above use of dummy variables.
As important, the empirical design involves a methodology that can
capture the incremental impact of the determinants of investment
presented in equations (1) – (4). That is, if the faulty informant and
market pressure hypotheses hold true, the coefficient of in
equation (2) should be significant and the R
1−tR2 should be much larger
than in equation (1). Also, when we control for financing and
fundamentals variables, the return variable in equation (4) should be
13

significant and the incremental R2 should be larger relative to equation
(3). However, if the financing hypothesis is true, which means that
financing is the main channel through which the stock market affects
investment, we expect the following: (i) the financing variables in
equation (3) should be significant and large, and the incremental R2
should be relatively large compared with equation (1); (ii) moving
from equation (3) to equation (4) should produce an insignificant
coefficient of the lagged stock returns and no significant increase in the
value of R2; and (iii) the coefficient of the lagged stock returns in
equation (4) should fall compared with equation (2), since the
sensitivity of investment to return should be reduced once the
financing variables are included in the estimated regression. But
before we undertake these estimations, an analysis of data
characteristics and the descriptive statistics of the various variables
used is relevant.
III- Data and Descriptive Statistics
The data set for this study was obtained by analyzing firms from five
Arab countries that are listed in the International Finance Corporation
(IFC) indices over the period during 1996-2001. These are Egypt,
Jordan, Morocco, Saudi Arabia, and Tunisia. We limited our sample
to firms in these countries, because some countries have not yet
established stock markets (Iraq, Libya, Syria, and Yemen), and other
countries have established stock markets only recently (Algeria, Sudan,
Qatar, and United Arab Emirates), while for the rest of the Arab
countries, though stock markets do exist, data on listed firms could not
14

be easily obtained.17 However, we believe that those five countries
dominate Arab stock markets as they have the biggest and most active
markets in the region, and consequently provide a representative
evidence of Arab firms’ behavior in relation to stock valuations.18
Listed firms in IFC indices were targeted in preference to local market
indices for a number of reasons. IFC indices are widely accepted in the
international investment industry, forming the basis for index funds
and structured financial instruments. The firms included in the IFC
indices are selected on the basis of market size, trading activity, and
sector representation, whereas selecting firms based on local indices
may be misleading since they contain a large number of firms that are
traded infrequently.19 Additionally, the IFC provides a price index for
each firm that is adjusted for dividend payments, stock splits, capital
increases, and any other event, all making for an accurate calculation
of stock returns. Depending on the availability of accounting data on
listed firms, the study period differs for different countries. It ends in
2001 for all five countries, but starts from 1996 for Egypt, 2000 for
Jordan, 1998 for Morocco, 1997 for Saudi Arabia, and 1996 for
Tunisia. 17 The countries whose firms are listed in the IFC index are (data of listing):
Bahrain (1998); Egypt (1995); Jordan (1978); Lebanon (1998); Morocco (1995); Oman (1998); Saudi Arabia (1996); and Tunisia (1995).
18 Of course, Kuwait has a big and active stock market and would have been good to include it in the study, but Kuwaiti firms are not listed in the IFC index.
19 In Egypt, for instance, the number of listed firms exceeds 1100, whereas only 10% of these firms are traded frequently as the rest are family or closed firms. In fact, closed or family firms seek listing in the stock market for tax purposes only.
15

As seen in Table (1), Panel A, the total number of listed firms in IFC
indices reaches 159 firms with market capitalization of US$ 48.6
billion, which represents around 53.5% of total market capitalization.
However, the original sample (159) contains 56 firms belonging to the
financial sector, so they had to be excluded.20 No complete accounting
data were available for 16 other firms; in addition, four other firms had
witnessed mergers. Hence, all those 20 firms were excluded from the
analysis. The final sample thus contains 83 firms, in which more than
50% are drawn from Egypt. Additionally, the sample firms dominate
more than 50% and 27% of total market value of listed firms in IFC
and local stock markets, respectively. Panel B shows that the size of
firms exhibits heterogeneity both across countries and for each
individual country, with the average market capitalization of Saudi
firms dominating all others. The number of sample firms used over
each of the three-years period is given in Panel C, and we can see that
Jordan, though adequately represented in the one-year period, is absent
from the two-and three-years period. Egyptian firms, of course, still
dominate the sample because of the availability of accounting data.
Firms’ classification by industry for all countries is given in Panel D,
and by ownership for Egypt only in Panel E.21 And it is clear that
manufacturing firms (as opposed to non-manufacturing firms, mainly
20 IFC indices for Jordan and Tunisia, in particular, are dominated by banks and
other financial service firms. 21 For the sake of simplifying our statistical analysis, we grouped firms under two
industry categories only: manufacturing and non-manufacturing. Nevertheless, sample firms could be grouped across six different categories. We do not present this distribution here, but they are available from the authors upon request. Also, since Egypt embarked on an active privatization program via the stock market, data allow us to classify firms according to ownership structure
16

construction) and majority-private firms are heavily represented in the
sample (see Appendix II for data sources).
Tables (2) and (3) present the basic descriptive statistics of the
accounting and market returns variables. Table (2) is confined to
Egypt for each of the 3-years period, and it is evident that cash flows
growth exhibits less variation over time; whereas investment growth
exhibits less variation over two years but more variation over three
years, and the opposite is true for equity financing growth. Only sales
and debt financing growth show more variation over time. Note also
that abnormal returns calculated from the market adjusted model,
whether based on cumulative or buy-and-hold long-run returns, are
always higher (less negative) than those calculated from CAPM. As a
result, this indicates in all likelihood a negative risk premium (the
difference between market returns and risk-free returns) and an
average beta of less than one.22 Table (3), Panels A and B, repeat the
same descriptive statistics for all countries, and its results mirror those
obtained in Table (2) because they are largely dominated by the sizable
number of Egyptian firms. Panels C and D, on the other hand, contain
the similar statistics for all countries excluding Egypt, and we can
notice here two differences from the results of Table (2). First,
investment varies more, and sales vary less, over the two-years period.
Second, abnormal returns turn positive but still those calculated from
the market adjusted model are higher than those calculated from
22 Egyptian stock market returns (at close to 6%) over 1996-2001 performed less
than returns on Treasury bills and saving deposits (at close to 9%); see Omran (2002).
17

CAPM, thus indicating mostly a positive risk premium and an average
beta greater than one. Given all this, what follows in the next section
is an analysis of how well these descriptive statistics mesh with our
estimated regression results.
IV- Results and Analysis
The regressions based on the unstructured equations (1) - (5) are
estimated at three levels: Egypt, over each of the three-years period;
all countries including Egypt, over one-and two-years period; and all
countries excluding Egypt, over one-year period. The all-country
regressions are estimated using an unbalanced (year-wise) panel data
and with fixed effects that control for country differences. Tables (4) –
(6) present the results pertaining to Egypt. We can see from model 1
in Table (4) that sales growth is the only fundamental having a
significant effect on investment (we will say more about cash flows in
the next section); and moving from model 1 to models 2-5 produces
insignificant coefficients for abnormal returns – however calculated –
and hardly any changes in R2. As a result, the faulty informant and
market pressure hypotheses do not seem to hold. However, moving
from model to 1 to model 6, we see that the coefficient for debt
financing only is now significant and R2 is higher by at least 5%. This
shows that debt financing is the channel through which the stock
18

market affects investment.23 And this result is reinforced by moving
from model 6 to models 7-10, because such a move includes abnormal
returns in the regressions but without arriving at any significant
coefficients for them and without obtaining incremental increases in
R2.
It seems then that for Arab Egyptian firms the passive informant
hypothesis better reflects their view of stock markets, and outsiders
seem to know little about these firms that insiders do not also know.
One viable reason that the market pressure and faulty informant
hypotheses do not seem to be valid is because the separation of
ownership from control in Arab firms does not necessarily apply –
owners are the managers – and managers “jealously” know more
about their companies than the “noisy and nosy” market. Also, having
sales and debt growth as significant determinants of investment means
that both output and the cost of capital influence investment, although
the effect of output (larger coefficient for sales) is more pronounced. It
also implies that issuing equity is not significantly used by Arab firms,
neither to finance real investments nor to invest in financial securities,
so as not to dilute control and spread thin the concentrated ownership.
As important, the higher leverage by firms associated with stock
market developments indicates that, at this level of the emerging
23 Morck, Vishny, and Shleifer (1990) obtained some validation of the faulty
informant and market pressure hypotheses in that abnormal returns had a significant coefficient of 0.3 and incremental R2 was close to 4%. Also, debt financing was the more important of the two forms of financing but only added an incremental R2 of 1.6%.
19

Egyptian stock market, a market-based and a bank-based financial
system could complement each other and go hand in hand.24
Models 11-14 of Table (4) extend the regressions to include the
dummy variables on size (1 for firm size larger than the sample
median, zero otherwise), industry (1 for manufacturing firms, 0
otherwise), and ownership (1 for mostly-private firms, 0 otherwise).
The results show that, of all the three characteristics, mostly private is
the feature that has significant effect on investment. This is of
particular interest to Egypt, because all but three of the mostly-private
firms are privatized state enterprises and they have been very
instrumental in activating the Egyptian stock market. It seems now
that they also have been utilizing stock market developments to
undertake more investments.25 The result concerning firms’ size is
surprising, since stock market developments tend to facilitate financing
for young and small firms, but it conforms with previous studies that
have shown that size does not matter much in making the stock market
a better predictor of investment.26
Tables (5) and (6) present the results for Egypt over two-and three-
years respectively. Qualitatively, the results reproduce the outcome
24 This result corroborates the findings of Demigruc-Kunt and Maksimovic (1996)
for emerging markets. However, those findings also indicate that further development of the stock market is expected to produce substitution of equity for debt.
25 This result is reinforced by Omran (2003).
26 See Morck, Shleifer, and Vishny (1990) and Demigruc-Kunt and Maksimovic (1996).
20

obtained in Table (4), but quantitatively there are two differences.
First, extending the time horizon allows for more explained variation
in investment since R2 is largest for the three-year period (by 15%–
20%), thus strengthening the notion that investment does not respond
contemporaneously but needs time to adjust. Second, the coefficient of
sales growth also gets larger – almost double – over the three-years
period, whereas that of debt stays the same. Hence, output growth
(demand conditions) seems to play an even bigger role than financial
cost in affecting investment over the medium term.
As to the country groups, Tables (7) and (8) show the corresponding
results for all the countries in the sample, including Egypt, for one-and
two-years respectively. Again, qualitatively the results are identical to
those of Egypt only, and the differences are quantitative. Of these, the
most salient are the incremental increases in R2 by about 8-10% in the
two-years period and by about 3-4% with the inclusion of debt
financing growth, in addition to the smaller coefficient (at 1.3) for
sales growth. When we exclude Egypt and its dominant presence from
the sample, as is shown in Table (9), we find that over the one-year
period the explained variation in investment is now larger: R2 increases
by more than 10%, and the inclusion of debt financing growth adds at
least 7%. However, both sales and debt financing growth now have a
smaller significant effect on investment.
All in all, for Egypt R2 increases with the time horizon because this
captures the delayed changes in investment, and for all the other
countries R2 increases when Egypt is excluded because this allows for
21

more investment variation among these countries; and in both cases,
sales and debt growth remain the only significant determinants with the
latter contributing at least 5% in additional R2. Lastly, to check for the
robustness of the results obtained from the use of dummy variables in
the regression models, we test for the equality of investment
expenditure for firms according to their size, industry, and (for Egypt
only) ownership structure. We employ the parametric t test and the
non-parametric Mann-Whitney test and report the results in Table
(10).27 The results confirm the previous findings from the regression
models. Panel A shows insignificant differences between Egyptian
firms according to size and industry classifications, over the three
periods. Panels B and C show also insignificant differences between
firms in all countries, including and excluding Egypt, over one-and
two-year periods. However, we find significant differences in capital
expenditure between mostly-private and mostly-public firms over the
three periods, as both tests pass the critical values of significance at
different levels.
27 Since the test for normality is rejected for some variables, this would violate
one of the important assumptions underlying the t test. Although we report parametric and the non-parametric results, we have to keep in mind that the non-parametric test statistics are uniformly more powerful than parametric tstatistics when data are not normally distributed. Consequently, results from the parametric test should be treated with caution.
22

V- Payout Ratios and Investment
One of the results that we left unexplored is the absence of any
significant relation between cash flows and investment. This ties to an
interesting issue in financial economics that started with the important
paper by Fazzari, Hubbard, and Petersen (1988). To recap, the
pecking-order theory of finance argues that firms prefer to finance
investment from internal funds or retentions rather than from debt and
then equity.28 As a result, one would expect a high sensitivity between
cash flows and investment.29 Among the explanations given for this
relation, is that higher tax rates on dividend payments relative to
capital gains leave firms with high retention or low payout ratios from
which they could fund investment.30 This view was elaborated further
by Fazzari, Hubbard, and Petersen (1988) who argued that financially
constrained firms with low payout ratios experience a higher
investment-cash flow sensitivity. And these firms tend to be immature
and less well-known and as a result must pay a premium for external
funds – which naturally makes of cash flows a supply of low-cost
28 See Myers (1984).
29 As in Morck, Shleifer, and Vishny (1990) and Samuel (1996).
30 See, for instance, Fazzari, Hubbard, and Petersen (1988).
23

investment finance.31
In light of the above, it is pertinent to ask why Arab firms have
unexpectedly witnessed an insignificant relation between investment
and cash flows. The answer largely lies, as we can see from Panel A in
Table (11), in that Arab firms have high payout ratios with an average
of more than 66%.32 And such low retention of cash flows means that
the latter would not be a critical determinant of investment. There are
three reasons that could explain this outcome. First, in our country
sample there are very little or no taxes on dividends, so no bias against
payouts exists and no critical mass of internal funds is consequently
generated. Second, in emerging Arab stock markets, investors prefer
to receive periodical income in given periods, just as they would with
bank deposits. As a result of this behaviour, one persuasive way to
keep investors actively involved in the stock market is by providing
them with high payouts. Third, these high payouts signal to the market
the credible position of these firms that would help them to reduce any
cost disadvantages they might face in their external finance. As
important, this also helps to explain the significant debt financing
31 As firms mature, the asymmetric information problem associated with the cost
disadvantage relating to external finance becomes less severe. Firms that are not financially constrained and with higher payout ratios, on the other hand, can rely more on external finance to smooth investment in the face of fluctuations in cash flows. In this context, dividend payments represent a signal to the market that enhances the credibility of the firm and lowers or erases the premium on external funds.
32 Compared to 40%, for example, in the Fazzari, Hubbard, and Petersen (1988) and Kaplan and Zingales (1997) samples of US firms.
24

observed earlier for Arab firms, in addition to the possible violation of
the pecking-order theory in the context of Arab finance.
Given the insignificant relation between investment and cash flows, it
is still worthwhile to ask which class of firms exhibits more or less
investment-cash flows sensitivity. To accomplish this, we split the
sample of firms into two classes: the class of less constrained firms
with payout ratios above the sample median and the class of more
constrained firms with payout ratios below the sample median. Table
(11), Panel B, shows that for the sample of all countries the coefficient
of cash flows is highest for the less constrained firms, followed in
order by the coefficients of the sample of all firms and the more
constrained firms.33 And these results prevail also for the case of
Egypt only. The fact that the more constrained firms with low payout
ratios have less investment-cash flows sensitivity contrasts with the
result obtained by Fazzari, Hubbard, and Petersen (1988), and it is
interesting to see why.34 One good reason could be that more
constrained firms are also financially stressed. If so, then this means
that their creditors would pressure them into using more of their cash
flow to repay debt rather than to use it for investment; similarly, if their
cash position is low, they would keep more of their cash flow as liquid
33 The coefficients are based on model 9. Results are the same from all other
models. 34 However, the result agrees with that of Kaplan and Zingalis (1997). The latter
do not provide a reason, but speculate it could be due to the shape of the cost function of raising external finance or mischarcterisation of the reasons why firms are reluctant to raise external finance.
25

assets. As a result, we expect these firms to have higher leverage and
lower liquidity ratios.
We tested the above propositions and report the results in Panels C and
D of Table (11). For each of the country samples we see that the low
payout firms have a higher debt to equity (leverage) ratio and a lower
cash to current liabilities (liquidity) ratio than all other firms. The
statistical tests (parametric t test and the non-parametric Mann-
Whitney test) also show that these differences are significant across all
country samples except Egypt for the leverage ratio and except all
countries excluding Egypt for the liquidity ratio.35 These results, then,
provide added support to the importance of debt in Arab finance and to
the fact that the pecking-order theory does not necessarily hold.
VI- Conclusion
Arab stock markets are a sideshow. This is what the paper has shown,
in that stock price movements that are inefficient or unwarranted by
fundamentals are not taken into consideration by Arab managers when
deciding on their investments; and, in so doing, no misallocation of
capital resources necessary happens. Stock market activity is also
shown to assist privatization and to facilitate the acquisition of more
debt financing. The latter helps to invalidate the pecking-order theory
in Arab finance and, especially for highly-leveraged firms, to render
35 Omran and Pointon (Forthcoming) arrive at similar results for a sample of 94
Egyptian firms, and Aivazian, Booth, and Clearly (2003) for a cross-section of firms from emerging markets.
26

cash flows an insignificant determinant of Arab investment. These
seem like good-enough implications to justify further developments of
Arab stock markets, but there are actually more. Two additional
reasons could recommend themselves towards that end, especially
when accompanied by the requisite legal and regulatory stock market
reforms, and they are as follows36. First, Arab firms are still largely
closed, family-owned with a narrow concentration of ownership, so
stock market developments can ultimately widen the investors’ base,
separate ownership from control, and in due time inject qualified
management to run the affairs of these firms besides tapping the stock
market as a source of funds. Second, growing and reforming Arab
economies that are keen at changing the output and technology mix of
their industries, will need stock markets to better allocate their
investments to new industries, because stock markets provide a better
way of checking that new firms are well run when there are
divergences of opinion on how they should be run. In this sense, stock
market development will effectively complement the financial services
provided by the bank-based Arab financial system.
36 For a critical view of stock market developments in emerging markets,
however, see Singh and Weisse (1998).
27

Appendix I
1. Cumulative Abnormal Returns Method
Monthly market-adjusted returns are defined as the monthly raw return
on a firm i minus the monthly raw return on a corresponding reference
portfolio (IFCG or IFCF) for the same trading period37:
,,,, tcrptiti RRMAR −= (A1)
where:
tiMAR , is the market-adjusted return for firm i for the month t,
tiR , refers to the raw return for firm i for the month t, and
tcrpR , is the raw return on corresponding reference portfolio for the
month t.
So, the CAR for each firm is:
}{∑=
==T
1tt,it,i 36,24,12TΜARCMAR (A2)
where:
37 We mean by corresponding reference portfolio the International Finance
Corporation Global (IFCG) index for each country except Tunisia , for which we use IFC Frontier (IFCF) index because it is not included in IFCG index.
28

t,iCMAR is the cumulative abnormal return or cumulative market-
adjusted return for firm i from t=1 until the anniversary month T (12,
24, and 36 months)
2. Buy-and-Hold Abnormal Returns Method
Similarly, BHARs are calculated as the raw return on a firm i minus
the raw return on a corresponding reference portfolio over identical
interval periods:
}{ ,3624,12T1)t,crpR1(T
1t1)t,iR1(
T
1tT,iBHMAR =
−+∏
=−−+∏
== (A3)
where:
TiBHMAR , is buy- and-hold market-adjusted return for security i, in
period T, where T is the trading month number 12, 24 and 36,
respectively, and
1=t indicates the first trading month.
3. CAPM Abnormal Return
To take the risk factor into consideration, we calculate the abnormal
return using the CAPM as follows:
29

],RR[RRCAPMAR t,ft,crpit,ft,it,i −−−= β (A4)
where:
t,iCAPMAR is the abnormal return using CAPM,
tiR , refers to the monthly return for security i in month t,
t,fR is the risk-free rate proxied as a short-term one-month rate for
bank deposits,
iβ is the risk of security i compared with the market index
(corresponding reference portfolio), and
t,crpR indicates the monthly return on the corresponding reference
portfolio in month t.
iβ is given from the CAPM regression, which is the slope obtained
from regressing on [ for the estimation period. ]RR[ t,ft,i − ],, tftcrp RR −
With the CAPMAR calculated, we apply the same two methods, CARs
and BHARs, mentioned previously.
30

Appendix II
Data on stock market returns were taken form International Financial
Corporation (IFC), Emerging Markets Database. Accounting data for
Egyptian firms were taken from Compass Egypt Financial Yearbook
(Cairo: Fiani and Co., 1998/99 and 2002/03); for Saudi Arabian firms
from Manual of Saudi Public Companies (Riyadh: Saudi Share
Registration Company, 2001); and for Jordanian, Moroccan, and
Tunisian firms from their local stock market databases. Investment
was calculated as capital expenditures for Jordan, Saudi Arabia, and
Tunisia, and as the change in fixed assets and projects under progress
for Egypt. Investment and accounting variables were deflated by the
GDP deflator from World Bank, World Development Indicators.
Ownership data for Egyptian firms were taken from Omran (2003)
based on records from Ministry of Public Enterprise, Egypt.
31

Tables:
Table (1) Descriptive Analysis
The table shows the number of firms listed in the International Finance Corporation (IFC) indices for each country, along with their market capitalization, in both dollar value and as a ratio of total market capitalization. We provide similar information regarding the final sample of firms we used in the analysis. We also provide selected descriptive statistics regarding the size of the firms in our sample, and a breakdown of the number of firms in our sample according to industry and ownership over one-, two- and three-year periods.
Egy
Jor
Mo
Panel B
Egy
Jor
Mo
Panel A : All Countries - Number and Size of Firms in IFC Index and in Sample (Market Cap, 1998)
: All Countries - Basic Descrptive Analysis of Firms in Sample (Market Cap, 1998, in $ millions)
6
43 15
Saudi Arabi
Tunisia 46
1,393 223
1,078 341 7,680 31
16.7
159 48,587 53.6 83 24,634 50.7 27.2
1,089 48.0 4 378
45.87 4,432
34.7
28.3
21 23,791 55.9 11 11,863 49.9 27.9
9,674 61.7
41 4,277
29.9
15 681 15.9 11.7
46 7,280 74.6
IFC Index Sample
66 9,756
Value ($ millions)
% of IFC Market Cap.
% of Total Market Cap.
Number of Firms Used
Market Cap. of Firms in Sample
Minimum
94 80 174
Mean Median Maximum
264 2
826pt 152 60
320 204
dan
rocco
73.3
pt
18
Number of Firms Listed
40.0
rocco
Value ($ millions)
% of Total Market Cap.
Market Cap. of Firms
dan
Saudi Arabi
Tunisia
Total
13
32

Table (1) Continued
Panel C : All Countries - Number of Firms in Sample
Panel D : All Countries - Classification of Firms in Sample According to Industry
Panel E : Egypt - Classification of Firms in Sample According to Ownership
Manufacturing Non- Manufacturing Manufacturing Non-
Manufacturing Manufacturing Non- Manufacturing
One - Year Period Two - Year Period Three - Year Period
35Egypt
One - Year Period Two - Year Period Three - Year Period
-
4
11
4 4
Jordan
Morocco
Saudi Arabia
Tunisia
Total
Jordan
Morocco
Saudi Arabia
Egypt
Tunisia
Total
46 42
15 -
7 5
11 11
8
-
36 10 34
15 - - - -
-
6 5 6 5 6 5
7 - 5
2
66 17 47 15 42 12
2 2 2
4
22
4-
83 62 54
530
One - Year Period Two - Year Period Three - Year Period
Majority Private
Majority Public
Majority Private
Majority Public
Majority Private
Majority Public
15 23 12 Egypt 29 17 27
33

Table ( 2 ) Egypt : Basic Descriptive Statistics
This table shows basic descriptive statistics of the variables of the study by providing measures of central tendency, variability and shape for the Egyptian firms. We present the mean, median, standard deviation, minimum and maximum values for each variable over one-, two-, and three-year periods. INV is the growth rate in investment expenditure, CF is the growth rate in cash flow plus depreciation, SAL is the growth rate in sales, EQ is the growth rate in equity, DBT is the growth rate in debt, M-CAR is the cumulative abnormal return calculated using the market-adjusted model, M-BHAR is the buy-and-hold abnormal return calculated using the market-adjusted model, C-CAR is the cumulative abnormal return calculated using CAPM, and C-BHAR is the buy-and-hold abnormal return calculated using the CAPM.
Pa I C
S EQ DBT
M M C C
nel A : One - Year Period ( 114 observations )
Mean Median Std. Dev. Minimum Maximum
NV 8.22 -20.78 113.55 -98.64 681.97
F -7.32 -0.63 54.21 -478.82 125.44
AL -2.28 -3.04 19.41 -54.87 62.36
7.22 0.00 26.39 0.00 200.00
-0.51 -5.42 53.74 -100.00 186.05
-CAR -7.70 -15.96 53.99 -145.29 236.24
-BHAR -0.75 -19.44 80.68 -125.25 669.82
-CAR -13.22 -20.36 53.46 -132.69 243.26
-BHAR -6.59 -24.17 82.79 -85.00 677.77
34

Table ( 2 ) Continued P
anel B : Two - Year Period ( 44 observations )
Mean Median Std. Dev. Minimum Maximum
INV -8.35 -37.69 92.90 -97.82 333.15
CF -9.18 -2.69 35.39 -142.04 53.01
SAL -8.21 -12.10 27.01 -75.39 97.32
EQ 19.23 0.00 58.89 0.00 350.00
DBT 18.25 -7.69 100.37 -100.00 286.28
M-CAR -5.03 -1.03 68.40 -151.72 208.95
M-BHAR 6.39 -9.60 101.60 -116.37 580.71
C-CAR -14.39 -1.56 78.12 -161.16 219.47
C-BHAR -2.52 -21.38 108.76 -111.90 592.97
35

Table ( 2 ) Continued Panel IN C S E D
M M C
C
C : Three - Year Period ( 29 observations )
Mean Median Std. Dev. Minimum Maximum
V 73.09 -24.25 304.28 -95.60 1,232.00
F -10.00 -10.05 35.95 -71.02 60.70
AL -13.46 -15.93 39.73 -88.89 133.86
Q 15.94 0.00 33.23 0.00 100.00
BT 63.70 -9.43 258.16 -100.00 960.00
-CAR -11.49 -15.57 86.00 -162.67 175.11
-BHAR -83.20 -27.95 176.94 -736.93 77.25
-CAR -29.91 -23.36 94.61 -200.70 173.63
-BHAR -106.80 -38.64 188.68 -796.10 61.64
36

Table ( 3 ) All Countries : Basic Descriptive Statistics
This table shows basic descriptive statistics of the variables of the study by providing measures of central tendency, variability and shape for all firms, including and excluding Egyptian firms. We present the mean, median, standard deviation, minimum and maximum values for each variable over one- and two-year periods. INV is the growth rate in investment expenditure, CF is the growth rate in cash flow plus depreciation, SAL is the growth rate in sales, EQ is the growth rate in equity, DBT is the growth rate in debt, M-CAR is the cumulative abnormal return calculated using the market-adjusted model, M-BHAR is the buy-and-hold abnormal return calculated using the market-adjusted model, C-CAR is the cumulative abnormal return calculated using the CAPM, and C-BHAR is the buy-and-hold abnormal return calculated using the CAPM. P
anel A : All Countries (Including Egypt)One - Year Period (170 observations)
Mean Median Std. Dev. Minimum Maximum
INV 5.46 -6.88 94.18 -98.64 681.97
CF -7.17 0.21 57.25 -478.82 158.75
SAL -0.09 -1.19 21.74 -59.59 111.49
EQ 5.88 0.00 22.54 -24.00 200.00
DBT 4.03 -3.97 69.19 -1.30 91.69
M-CAR -4.69 -7.73 49.05 -145.29 236.24
M-BHAR 0.80 -11.49 71.15 -125.25 669.82
C-CAR -9.31 -12.78 47.66 -132.69 243.26
C-BHAR -3.88 -16.86 72.00 -85.00 677.77
37

Table ( 3 ) Continued
Panel B : All Countries* (Including Egypt)Two - Year Period (60 observations)
Mean Median Std. Dev. Minimum Maximum
INV -4.37 -22.78 81.82 -97.82 333.15
CF -0.76 1.71 39.99 -142.04 91.63
SAL -1.73 -2.86 27.39 -75.39 97.32
EQ 18.07 0.00 51.56 0.00 350.00
DBT 22.40 -6.99 111.22 -100.00 498.93
M-CAR -2.50 -2.88 67.17 -151.72 208.95
M-BHAR 11.05 -12.31 106.76 -116.37 580.71
C-CAR -9.78 -7.65 74.40 -161.16 219.47
C-BHAR 4.06 -17.85 111.35 -111.90 592.97
* Excluding Jordan
38

Table ( 3 ) Continued
Panel C : All Countries (Excluding Egypt)One - Year Period (56 observations)
Mean Median Std. Dev. Minimum Maximum
INV -0.17 -1.37 26.78 -77.46 80.94
CF -6.84 1.83 63.52 -245.81 158.75
SAL 4.35 4.12 25.45 -59.59 111.49
EQ 3.15 0.00 10.89 -23.67 50.00
DBT 13.28 0.00 93.00 -100.00 470.00
M-CAR 1.45 -1.42 36.75 -73.50 131.95
M-BHAR 3.95 -3.09 46.57 -56.52 210.93
C-CAR -1.33 -7.37 31.77 -74.18 104.31
C-BHAR 1.63 -7.14 42.45 -57.33 210.93
39

Table ( 3 ) Continued
Panel D : All Countries* (Excluding Egypt)Two - Year Period (16 observations)
Mean Median Std. Dev. Minimum Maximum
INV 6.56 3.27 37.61 -63.84 84.91
CF 22.39 23.53 43.81 -58.35 91.63
SAL 16.06 15.11 19.98 -18.94 57.43
EQ 14.88 0.00 22.31 0.00 71.43
DBT 33.81 0.00 139.95 -100.00 498.93
M-CAR 4.46 -10.07 65.28 -78.85 154.59
M-BHAR 23.87 -12.31 122.50 -81.69 431.99
C-CAR 2.89 -9.69 63.59 -76.10 153.10
C-BHAR 22.16 -13.91 119.93 -69.41 417.27
∗ Excluding Jordan
40

41
Tab
le (
4 )
Egy
pt :
One
-Yea
r Pe
riod
Th
e ta
ble
show
s th
e re
sults
fro
m m
ultiv
aria
te c
ross
-sec
tiona
l reg
ress
ion
anal
yses
of
the
dete
rmin
ant o
f in
vest
men
t exp
endi
ture
for
Egy
ptia
n fir
ms
over
a o
ne-y
ear
perio
d.
INV
is th
e gr
owth
rate
in in
vest
men
t exp
endi
ture
, CF
is th
e gr
owth
rate
in c
ash
flow
plu
s de
prec
iatio
n, S
AL
is th
e gr
owth
rate
in s
ales
, EQ
is th
e gr
owth
rate
in e
quity
, DB
T is
the
grow
th ra
te in
deb
t, M
-CA
R is
the
cum
ulat
ive
abno
rmal
retu
rn c
alcu
late
d us
ing
the
mar
ket-a
djus
ted
mod
el, M
-BH
AR
is th
e bu
y-an
d-ho
ld a
bnor
mal
retu
rn c
alcu
late
d us
ing
the
mar
ket-a
djus
ted
mod
el, C
-CA
R is
the
cum
ulat
ive
abno
rmal
retu
rn c
alcu
late
d us
ing
the
CA
PM, a
nd C
-BH
AR
is th
e bu
y-an
d-ho
ld a
bnor
mal
retu
rn c
alcu
late
d us
ing
the
CA
PM, S
IZE
is a
dum
my
varia
ble
that
take
s the
val
ue o
ne if
the
firm
size
is a
bove
the
med
ian
size
of t
he sa
mpl
e fir
ms a
nd z
ero
othe
r wis
e, IN
D is
a d
umm
y va
riabl
e th
at
take
s th
e va
lue
one
if th
e fir
m b
elon
gs to
the
man
ufac
turin
g se
ctor
and
zer
o ot
herw
ise,
and
OW
N is
a d
umm
y va
riabl
e th
at ta
kes
the
valu
e on
e if
the
firm
is c
ontro
lled
by th
e pr
ivat
e se
ctor
and
zer
o ot
herw
ise.
* ∗
Sign
ifica
nt a
t the
1%
leve
l, **
Sig
nific
ant a
t the
5%
leve
l, an
d **
* Si
gnifi
cant
at t
he 1
0%le
vel.
Figu
res b
etw
een
pare
nthe
ses a
re t
stat
istic
s.
Dep
en
den
t V
aria
ble
: I
NV
Ind
ep
en
den
t V
aria
ble
s
13.3
0
13.4
3
13.3
4
12.5
6
13.3
4
13.1
5
13.1
6
13.1
8
12.1
3
13.1
8
-23.4
6
-25.5
1
-23.6
4
-24.1
6
(1.3
1)
(1.3
0)
(1.3
0)
(1.1
9)
(1.3
0)
(1.2
7)
(1.2
5)
(1.2
6)
(1.1
3)
(1.2
6)
(-0.7
5)
(-0.8
1)
(-0.7
6)
(-0.7
7)
0.0
8
0.0
8
0.0
8
0.0
8
0.0
8
0.0
8
0.0
9
0.0
8
0.0
8
0.0
8
0.1
5
0.1
4
-0.1
3
0.1
4
(0.4
1)
(0.4
1)
(0.4
0)
(0.4
1)
(0.4
1)
(0.4
5)
(0.4
5)
(0.4
4)
(0.4
5)
(0.4
5)
(0.7
7)
(0.7
6)
(-0.3
3)
(0.7
5)
1.9
7
1.9
7
1.9
8
1.9
8
1.9
7
1.8
3
1.8
3
1.8
4
1.8
4
1.8
3
1.7
2
1.7
3
1.7
4
1.7
3
(3.6
7)
*(3
.65)
*(3
.67)
*(3
.67)
*(3
.66)
*(3
.46)
*(3
.44)
*(3
.45)
*(3
.46)
* (
3.4
4)
*(3
.24)
*(3
.26)
*(3
.25)
*(3
.25)
*0.0
2
0.0
1
0.0
3
(0.1
0)
(0.0
1)
(0.1
7)
0.0
4
0.0
4
0.0
6
(0.3
5)
(0.3
3)
(0.4
9)
-0.0
6
-0.0
7
-0.0
4
(-0.3
0)
(-0.3
8)
(-0.1
8)
0.0
1
0.0
1
0.0
3
(0.0
5)
(0.0
5)
(0.2
4)
0.0
2
0.0
2
0.0
2
0.0
3
0.0
2
-0.1
4
-0.1
4
-0.1
3
-0.1
4
(0.0
4)
(0.0
4)
(0.0
4)
(0.0
8)
(0.0
4)
(-0.3
7)
(-0.3
6)
(-0.3
3)
(-0.3
7)
0.4
7
0.4
7
0.4
7
0.4
7
0.4
7
0.4
6
0.4
6
0.4
7
0.4
6
(2.5
1)
**
(2.5
0)
**
(2.5
0)
**
(2.5
1)
**
(2.5
0)
**
(2.4
6)
**
(2.4
6)
**
(2.4
7)
**
(2.4
6)
**
18.5
8
17.5
7
19.8
2
18.2
8
(0.8
7)
(0.8
2)
(0.9
2)
(0.8
5)
-4.6
2
-2.2
7
-5.4
7
-3.8
6
(-0.1
7)
(-0.0
8)
(-0.2
0)
(-0.1
4)
48.3
0
48.9
4
47.4
0
48.5
5
(2.1
3)
**
(2.1
6)
**
(2.0
8)
**
(2.1
4)
**
N1
14
1
14
1
14
1
14
1
14
1
14
1
14
1
14
1
14
1
14
1
14
1
14
1
14
1
14
A
dj.
R2
(
% )
10.5
5
9.7
4
9.8
3
9.8
1
9.7
4
13.8
9
13.1
0
13.1
8
13.2
1
13.1
0
14.3
7
14.5
4
14.3
7
14.3
9
F -
Rati
o7.6
6
*5.0
7
*5.1
1
*5.1
0
*5.0
6
*5.5
6
*4.4
1
*4.4
3
*4.4
4
*4.4
1
*3.3
7
*3.4
0
*3.3
7
*3.3
7
*
Mo
del
13
Mo
del
14
Mo
del
1
Mo
del
2
Mo
del
3
Mo
del
6
Mo
del
4
Mo
del
5
Mo
del
7
Mo
del
8
Mo
del
11
Mo
del
12
Mo
del
9
Mo
del
10
Con
stan
t
CF
SA
L
M-C
AR
IND
OW
N
M-B
HA
R
EQ
DB
T
SIZ
E
C-C
AR
C-B
HA
R

Tab
le (
5 )
Egy
pt :
Tw
o -Y
ear
Peri
od
The
tabl
e sh
ows
the
resu
lts f
rom
mul
tivar
iate
cro
ss-s
ectio
nal r
egre
ssio
n an
alys
es o
f th
e de
term
inan
t of
inve
stm
ent e
xpen
ditu
re f
or E
gypt
ian
firm
s ov
er a
two-
year
per
iod.
IN
V is
the
grow
th ra
te in
inve
stm
ent e
xpen
ditu
re, C
F is
the
grow
th ra
te in
cas
h flo
w p
lus
depr
ecia
tion,
SA
L is
the
grow
th ra
te in
sal
es, E
Q is
the
grow
th ra
te in
equ
ity, D
BT
is th
e gr
owth
rate
in d
ebt,
M-C
AR
is th
e cu
mul
ativ
e ab
norm
al re
turn
cal
cula
ted
usin
g th
e m
arke
t-adj
uste
d m
odel
, M-B
HA
R is
the
buy-
and-
hold
abn
orm
al re
turn
cal
cula
ted
usin
g th
e m
arke
t-adj
uste
d m
odel
, C-C
AR
is th
e cu
mul
ativ
e ab
norm
al re
turn
cal
cula
ted
usin
g th
e C
APM
, and
C-B
HA
R is
the
buy-
and-
hold
abn
orm
al re
turn
cal
cula
ted
usin
g th
e C
APM
, SIZ
E is
a d
umm
y va
riabl
e th
at ta
kes t
he v
alue
one
if th
e fir
m si
ze is
abo
ve th
e m
edia
n si
ze o
f the
sam
ple
firm
s and
zer
o ot
her w
ise,
IND
is a
dum
my
varia
ble
that
ta
kes
the
valu
e on
e if
the
firm
bel
ongs
to th
e m
anuf
actu
ring
sect
or a
nd z
ero
othe
rwis
e, a
nd O
WN
is a
dum
my
varia
ble
that
take
s th
e va
lue
one
if th
e fir
m is
con
trolle
d by
the
priv
ate
sect
or a
nd z
ero
othe
rwis
e.
D
ep
en
den
t V
aria
ble
: I
NV
Ind
ep
en
den
t V
aria
ble
s
7.8
8
7.8
7
6.5
1
7.6
9
7.4
0
0.8
8
0.4
5
-1.8
2
0.9
3
-0.7
0
-17.4
3
-31.2
8
-14.1
0
-26.5
5
(0.6
0)
(0.5
9)
(0.4
9)
(0.5
8)
(0.5
6)
(0.0
6)
(0.0
3)
(-0.1
3)
(0.0
7)
(0.0
5)
(-0.4
2)
(-0.7
4)
(-0.3
4)
(-0.6
3)
0.4
2
0.4
2
0.4
3
0.4
3
0.4
1
0.3
4
0.3
4
0.3
5
0.3
3
0.3
1
0.3
8
0.3
4
0.3
4
0.3
1
(1.1
4)
(1.1
3)
(1.1
7)
(1.1
4)
(2.8
6)
(0.9
2)
(0.9
2)
(0.9
5)
(0.8
8)
(0.8
5)
(1.0
1)
(0.9
2)
(0.9
0)
(0.8
2)
1.5
1
1.5
0
1.4
2
1.5
5
1.4
3
1.3
3
1.2
4
1.2
3
1.2
6
1.2
1
1.0
6
1.1
5
1.1
0
1.1
3
(3.1
0)
*(2
.85)
*(2
.88)
*(2
.95)
*(2
.88)
*(2
.67)
**
(2.2
7)
**
(2.4
5)
**
(2.2
6)
**
(2.3
7)
**
(1.9
1)
***
(2.2
6)
**
(1.9
2)
***
(2.1
8)
**
0.0
1
0.0
8
0.2
5
(1.1
3)
(0.4
2)
(1.1
0)
0.1
2
0.1
5
0.2
0
(0.9
6)
(1.2
1)
(1.4
7)
-0.0
4
0.0
5
0.1
7
(-0.2
5)
(0.2
7)
(0.8
5)
0.0
8
0.1
3
0.1
7
(0.7
1)
(1.0
8)
(1.3
0)
0.0
2
0.1
8
0.0
6
0.0
1
0.0
3
0.0
2
0.1
1
0.0
0
0.0
7
(0.0
9)
(0.4
2)
(0.2
6)
(0.0
5)
(0.1
4)
(0.1
1)
(0.4
7)
(0.0
0)
(0.2
9)
0.2
4
0.2
5
0.2
6
0.2
5
0.2
6
0.2
6
0.2
5
0.2
6
0.2
6
(1.8
9)
***
(1.9
2)
***
(2.0
2)
***
(1.8
7)
***
(2.0
5)
**
(2.0
2)
***
(1.9
7)
***
(2.0
0)
***
(2.0
4)
**
-28.0
4
-26.7
3
-23.5
8
-24.6
1
(-0.9
7)
(-0.9
9)
(-0.8
3)
(-0.9
2)
-6.0
0
10.4
2
-8.4
4
6.0
3
(-0.1
6)
(0.2
6)
(-0.2
3)
(0.1
5)
59.1
8
52.5
9
56.0
2
52.1
6
(2.1
3)
**
(2.0
2)
***
(2.0
2)
***
(2.0
0)
***
N4
4
44
4
4
44
4
4
44
4
4
44
4
4
44
4
4
44
4
4
44
A
dj.
R2
(
% )
22.4
3
20.5
0
22.2
8
20.6
2
21.4
7
25.3
2
23.7
1
26.1
9
23.5
0
25.6
3
26.7
2
28.5
9
25.7
2
27.6
9
F -
Rati
o7.2
2
*4.6
9
*5.1
1
*4.7
2
*4.9
2
*4.6
4
*3.6
7
*4.0
5
*3.6
4
*3.9
6
*2.9
6
*3.1
5
*2.8
6
*3.0
6
*
IND
OW
N
M-B
HA
R
EQ
DB
T
SIZ
E
C-C
AR
C-B
HA
R
Con
stan
t
CF
SA
L
M-C
AR
Mo
del
11
Mo
del
12
Mo
del
9
Mo
del
10
Mo
del
13
Mo
del
14
Mo
del
1
Mo
del
2
Mo
del
3
Mo
del
6
Mo
del
4
Mo
del
5
Mo
del
7
Mo
del
8
* Si
gnifi
cant
at t
he 1
% le
vel,
** S
igni
fican
t at t
he 5
% le
vel,
and
***
Sign
ifica
nt a
t the
10%
leve
l. Fi
gure
s bet
wee
n pa
rent
hese
s are
t st
atis
tics.
42

Tab
le (
6 )
Egy
pt :
Thr
ee -Y
ear
Peri
od
The
tabl
e sh
ows
the
resu
lts f
rom
mul
tivar
iate
cro
ss-s
ectio
nal r
egre
ssio
n an
alys
es o
f th
e de
term
inan
t of
inve
stm
ent e
xpen
ditu
re f
or E
gypt
ian
firm
s ov
er a
thre
e-ye
ar p
erio
d.
INV
is th
e gr
owth
rate
in in
vest
men
t exp
endi
ture
, CF
is th
e gr
owth
rate
in c
ash
flow
plu
s de
prec
iatio
n, S
AL
is th
e gr
owth
rate
in s
ales
, EQ
is th
e gr
owth
rate
in e
quity
, DB
T is
the
grow
th ra
te in
deb
t, M
-CA
R is
the
cum
ulat
ive
abno
rmal
retu
rn c
alcu
late
d us
ing
the
mar
ket-a
djus
ted
mod
el, M
-BH
AR
is th
e bu
y-an
d-ho
ld a
bnor
mal
retu
rn c
alcu
late
d us
ing
the
mar
ket-a
djus
ted
mod
el, C
-CA
R is
the
cum
ulat
ive
abno
rmal
retu
rn c
alcu
late
d us
ing
CA
PM, a
nd C
-BH
AR
is th
e bu
y-an
d-ho
ld a
bnor
mal
retu
rn c
alcu
late
d us
ing
the
CA
PM, S
IZE
is a
dum
my
varia
ble
that
take
s th
e va
lue
one
if th
e fir
m s
ize
is a
bove
the
med
ian
size
of t
he s
ampl
e fir
ms
and
zero
oth
er w
ise,
and
OW
N is
a d
umm
y va
riabl
e th
at ta
kes t
he v
alue
one
if th
e fir
m is
con
trolle
d by
the
priv
ate
sect
or a
nd z
ero
othe
rwis
e.
D
epen
den
t V
ari
ab
le :
IN
VIn
dep
end
ent
Vari
ab
les
13
7.2
6
13
9.8
2
15
1.0
3
14
2.1
3
15
0.8
9
95.
53
9
8.3
9
11
0.8
2
10
1.3
9
11
2.6
3
5.8
1
14.
18
8.1
2
16.
78
(2
.70)
**
(2.7
1)**
(2.7
1)**
(2.6
8)**
(2.6
2)**
(1.7
6)***
(1.7
8)***
(1.8
7)***
(1.8
0)***
(1.8
5)***
(0.0
6)(0
.13)
(0.0
8)(0
.16)
1.2
5
1.2
5
1.2
9
1.2
2
1.2
6
1.1
5
1.1
4
1.1
5
1.0
9
1.1
2
1.4
8
1.6
4
1.3
6
1.6
0
(0.8
3)(0
.81
8)(0
.85)
(0.7
9)(0
.82)
(0.7
7)(0
.76)
(0.7
7)(0
.72)
(0.7
4)(0
.85)
(0.9
5)(0
.78)
(0.9
3)3.8
4
3.7
0
3.7
2
3.7
2
3.7
2
3.0
1
2.9
2
2.8
9
2.8
8
2.8
6
2.7
3
2.7
1
2.5
8
2.6
6
(2.8
1)*
(2.6
5)**
(2.6
7)**
(2.6
2)**
(2.6
5)**
(2.2
5)**
(2.1
4)**
(2.1
2)(2
.08)
**
(2.0
9)**
(2.0
0)***
(1.9
7)***
(1.8
8)***
(1.9
3)***
0.3
8
0.3
0
0.5
8
(0.6
6)(0
.55)
(0.8
5)0.1
8
0.1
8
0.1
9
(0.6
4)(0
.68)
(0.6
6)0.2
3
0.2
4
0.6
1
(0.4
2)(0
.48)
(0.9
8)0.1
4
0.1
6
0.2
0
(0.5
3)(0
.65)
0.7
3
0.1
3
0.1
1
0.0
1
0.0
6
-0.0
1
-0.4
0
-0.4
7
-0.5
6
-0.5
3
(0.8
7)(0
.08)
(0.0
1)(0
.04)
(-0.0
1)(-
0.2
7)(-
0.3
1)(-
0.3
8)(-
0.3
5)0.4
3
0.4
2
0.4
3
0.4
3
0.4
4
0.3
3
0.3
6
0.3
4
0.3
6
(2.3
1)**
(2.2
4)**
(2.2
9)**
(2.2
8)**
(2.3
1)**
(1.7
3)***
(1.8
6)***
(1.8
0)***
(1.8
8)***
12.
51
3
7.4
6
12.
16
3
6.7
7
(0.1
0)(0
.32)
(0.1
0)(0
.32)
17
8.4
1
16
5.5
8
19
2.4
7
16
6.0
9
(1.7
6)***
(1.8
2)***
(1.8
5)***
(1.9
6)***
N2
9
29
2
9
29
2
9
29
2
9
29
2
9
29
2
9
29
2
9
29
A
dj.
R2 (
% )
28.
86
2
7.2
8
27.
20
2
6.5
4
26.
85
3
7.0
0
35.
11
3
5.5
6
34.
91
3
5..4
63
8.1
1
27.
26
3
8.7
5
39.
55
F
- R
atio
6.6
8
*4.5
0
**
4.4
9
**
4.3
7
**
4.4
3
*5.1
1
*4.0
3
*4.0
9
*4.0
0
*4.0
8
*3.4
6
**
3.3
8
*3.5
3
*3.6
1
*
OW
N
M-B
HA
R
EQ
DB
T
SIZ
E
C-C
AR
C-B
HA
R
Con
stan
t
CF
SA
L
M-C
AR
Mo
del
11
Mo
del
12
Mo
del
9
Mo
del
10
Mo
del
13
Mo
del
14
Mo
del
1
Mo
del
2
Mo
del
3
Mo
del
6
Mo
del
4
Mo
del
5
Mo
del
7
Mo
del
8
* Si
gnifi
cant
at t
he 1
% le
vel,
** S
igni
fican
t at t
he 5
% le
vel,
and
***
Sign
ifica
nt a
t the
10%
leve
l. Fi
gure
s bet
wee
n pa
rent
hese
s are
t st
atis
tics.
43

44
Tab
le (
7 )
All
Cou
ntri
es (I
nclu
ding
Egy
pt) :
One
-Yea
r Pe
riod
Th
e ta
ble
show
s th
e re
sults
from
mul
tivar
iate
pan
el-d
ata
regr
essi
on a
naly
ses o
f the
det
erm
inan
t of i
nves
tmen
t exp
endi
ture
for a
ll fir
ms (
incl
udin
g Eg
yptia
n fir
ms)
ove
r a o
ne-
year
per
iod.
INV
is th
e gr
owth
rate
in in
vest
men
t exp
endi
ture
, CF
is th
e gr
owth
rate
in c
ash
flow
plu
s de
prec
iatio
n, S
AL
is th
e gr
owth
rate
in s
ales
, EQ
is th
e gr
owth
rate
in
equi
ty, D
BT
is th
e gr
owth
rate
in d
ebt,
M-C
AR
is th
e cu
mul
ativ
e ab
norm
al re
turn
cal
cula
ted
usin
g th
e m
arke
t-adj
uste
d m
odel
, M-B
HA
R is
the
buy-
and-
hold
abn
orm
al re
turn
ca
lcul
ated
usi
ng th
e m
arke
t-adj
uste
d m
odel
, C-C
AR
is th
e cu
mul
ativ
e ab
norm
al re
turn
cal
cula
ted
usin
g C
APM
, and
C-B
HA
R is
the
buy-
and-
hold
abn
orm
al re
turn
cal
cula
ted
usin
g th
e C
APM
, SIZ
E is
a d
umm
y va
riabl
e th
at ta
kes
the
valu
e on
e if
the
firm
siz
e is
abo
ve th
e m
edia
n si
ze o
f the
sam
ple
firm
s an
d ze
ro o
ther
wis
e, a
nd IN
D is
a d
umm
y va
riabl
e th
at ta
kes t
he v
alue
one
if th
e fir
m b
elon
gs to
the
man
ufac
turin
g se
ctor
and
zer
o ot
herw
ise.
*
Sign
ifica
nt a
t the
1%
leve
l, **
Sig
nific
ant a
t the
5%
leve
l, an
d **
* Si
gnifi
cant
at t
he 1
0%le
vel.
Figu
res b
etw
een
pare
nthe
ses a
re t
stat
istic
s.
Dep
end
ent
Vari
ab
le :
IN
VIn
dep
end
ent
Vari
ab
les
0.0
1
0.0
1
0.0
1
0.0
1
0.0
1
-0.0
1
-0.0
1
-0.0
1
-0.0
1
-0.0
1
-0.0
1
-0.0
1
-0.0
1
-0.0
1
(0.1
0)(0
.10)
(0.1
0)(0
.10)
(0.1
0)(-
0.1
0)(-
0.1
0)(-
0.1
0)(-
0.1
0)(-
0.1
0)(-
0.0
9)(-
0.0
9)(-
0.0
9)(-
0.0
9)1.3
4
1.3
4
1.3
4
1.3
4
1.3
4
1.3
6
1.3
6
1.3
7
1.3
7
1.3
6
1.3
6
1.3
7
1.3
7
1.3
6
(3.7
3)*
(3.7
2)*
(3.7
3)*
(3.7
3)*
(3.7
2)*
(3.8
4)*
(3.8
2)*
(3.8
4)*
(3.8
3)*
(3.8
3)*
(3.8
0)*
(3.8
1)*
(3.8
1)*
(3.8
0)*
0.0
1
0.0
2
0.0
1
(0.1
0)(0
.11)
(0.1
5)0.0
3
0.0
4
0.0
3
(0.3
2)(0
.39)
(0.3
3)-0
.04
-0
.03
-0
.04
(-
0.2
5)(-
0.2
2)(-
0.2
8)0.0
1
0.0
1
0.0
1
(0.0
6)(0
.14)
(0.0
8)0.0
6
0.0
6
0.0
5
0.0
7
0.0
6
0.0
5
0.5
3
0.0
7
0.0
5
(0.1
9)(0
.18)
(0.1
8)(0
.21)
(0.1
8)(0
.17)
(0.1
7)(0
.20)
(0.1
7)0.2
6
0.2
6
0.2
6
0.2
5
0.2
6
0.2
6
0.2
6
0.2
6
0.2
6
(2.5
1)**
(2.5
0)**
(2.5
1)**
(2.4
9)**
(2.5
0)**
(2.5
0)**
(2.5
0)**
(2.4
9)**
(2.5
0)**
4.7
5
4.1
9
5.6
0
4.6
8
(0.3
3)(0
.29)
(0.3
9)(0
.32)
-2.4
8
-2.0
0
-2.2
6
-2.3
4
(-0.1
3)(-
0.1
1)(-
0.1
2)(-
0.1
3)
N1
70
1
70
1
70
1
70
1
70
1
70
1
70
1
70
1
70
1
70
1
70
1
70
1
70
1
70
A
dj.
R2
( %
)6.1
5
5.5
7
5.6
3
5.6
0
5.5
7
8.5
8
8.0
2
8.1
0
8.0
4
8.0
2
6.9
2
6.9
9
6.9
3
6.9
2
F -
Rat
io1
7.0
7
*8.4
9
*8.5
4
*8.5
2
*8.4
8
*7.9
6
*5.9
3
*5.9
7
*5.9
4
*5.9
4
*3.9
3
*3.9
5
*3.9
4
*3.9
3
*
Mo
del
14
Mo
del
1
Mo
del
2
Mo
del
3
Mo
del
6
Mo
del
4
Mo
del
5
Mo
del
7
Mo
del
8
Mo
del
12
Mo
del
9
Mo
del
10
Mo
del
13
CF
SA
L
M-C
AR
Mo
del
11
IND
M-B
HA
R
EQ
DB
T
SIZ
E
C-C
AR
C-B
HA
R

45
Tab
le (
8 )
All
Cou
ntri
es (I
nclu
ding
Egy
pt) :
Tw
o -Y
ear
Peri
od
The
tabl
e sh
ows t
he re
sults
from
mul
tivar
iate
pan
el-d
ata
regr
essi
on a
naly
ses o
f the
det
erm
inan
t of i
nves
tmen
t exp
endi
ture
for a
ll fir
ms (
incl
udin
g Eg
yptia
n fir
ms)
ove
r a tw
o-ye
ar p
erio
d. IN
V is
the
grow
th ra
te in
inve
stm
ent e
xpen
ditu
re, C
F is
the
grow
th ra
te in
cas
h flo
w p
lus
depr
ecia
tion,
SA
L is
the
grow
th ra
te in
sal
es, E
Q is
the
grow
th ra
te in
eq
uity
, DB
T is
the
grow
th ra
te in
deb
t, M
-CA
R is
the
cum
ulat
ive
abno
rmal
retu
rn c
alcu
late
d us
ing
the
mar
ket-a
djus
ted
mod
el, M
-BH
AR
is th
e bu
y-an
d-ho
ld a
bnor
mal
retu
rn
calc
ulat
ed u
sing
the
mar
ket-a
djus
ted
mod
el, C
-CA
R is
the
cum
ulat
ive
abno
rmal
retu
rn c
alcu
late
d us
ing
CA
PM, a
nd C
-BH
AR
is th
e bu
y-an
d-ho
ld a
bnor
mal
retu
rn c
alcu
late
d us
ing
the
CA
PM, S
IZE
is a
dum
my
varia
ble
that
take
s th
e va
lue
one
if th
e fir
m s
ize
is a
bove
the
med
ian
size
of
the
sam
ple
firm
s an
d ze
ro o
ther
wis
e, I
ND
is a
dum
my
varia
ble
that
take
s the
val
ue o
ne if
the
firm
bel
ongs
to th
e m
anuf
actu
ring
sect
or a
nd z
ero
othe
rwis
e.
* Si
gnifi
cant
at t
he 1
% le
vel,
** S
igni
fican
t at t
he 5
% le
vel,
and
***
Sign
ifica
nt a
t the
10%
leve
l. Fi
gure
s bet
wee
n pa
rent
hese
s are
t st
atis
tics.
Dep
end
ent
Vari
ab
le :
IN
VIn
dep
end
ent
Vari
ab
les
0.3
5
0.3
5
0.3
5
0.3
6
0.3
4
0.3
4
0.3
5
0.3
4
0.3
4
0.3
3
0.3
6
0.3
4
0.3
5
0.3
3
(1.2
9)(1
.28)
(1.2
8)(1
.30)
(0.2
2)(1
.29)
(1.2
9)(1
.27)
(1.2
7)(1
.22)
(1.2
6)(1
.22)
(1.2
3)(1
.16)
1.3
3
1.3
3
1.2
8
1.3
7
1.2
8
1.2
8
1.2
4
1.2
1
1.2
6
1.2
0
1.2
4
1.2
2
1.2
6
1.2
1
(3.2
3)*
(3.0
4)*
(0.0
6)*
(3.1
1)*
(3.0
4)*
(3.1
3)*
(2.8
3)*
(2.9
1)*
(2.8
3)*
(2.8
7)*
(2.7
0)*
(2.7
8)(2
.71)
(2.7
3)-0
.01
0.0
4
0.0
7
(-0.0
5)(0
.26)
(0.3
8)0.
06
0.0
9
0.1
1
(0.6
6)(0
.91)
(1.0
4)-0
.04
0.
16
0.0
3
(-0.
29)
(0.1
1)(0
.19)
0.0
5
0.0
7
0.0
9
(0.4
8)(0
.81)
(0.9
2)-0
.01
-0
.02
-0
.01
-0
.16
-0
.02
-0
.02
0.
00
-0
.02
-0
.01
(-
0.0
7)(0
.08)
(-0.0
3)(-
0.0
8)(-
0.0
9)(-
0.0
9)(-
0.0
1)(-
0.1
0)(-
0.0
7)0.
18
0.1
9
0.1
9
0.1
9
0.1
9
0.1
9
0.1
9
0.1
9
0.2
0
(2.1
2)**
(2.1
1)**
(2.2
0)**
(2.0
8)**
(2.2
0)**
(2.0
4)**
(2.1
4)**
(2.0
1)**
(2.1
4)**
-8.3
9
-12.
40
-6
.79
-1
1.0
7
(-0.4
0)(-
0.6
0)(-
0.3
3)(-
0.5
4)-1
.26
2.
12
-1
.42
1.9
2
(-0.0
4)(0
.07)
(-0.
05)
(0.0
7)
N6
0
60
6
0
60
6
0
60
6
0
60
6
0
60
6
0
60
6
0
60
A
dj.
R2
( %
)1
5.9
0
14.
41
1
5.0
9
14.
54
1
4.7
7
19.
73
1
8.2
7
19.
46
1
8.1
7
19.
19
1
5.2
1
16.
79
1
5.0
2
0.1
6
F -
Rat
io1
6.2
2
*7.9
6
*8.
24
*
8.0
2
*8.1
1
*7.
17
*
5.3
0
*5.5
6
*5.
28
*
5.5
0
*3.4
3
*3.
65
*
3.4
1
*3.6
0
*
CF
SA
L
M-C
AR
IND
M-B
HA
R
EQ
DB
T
SIZ
E
C-C
AR
C-B
HA
R
Mo
del
11
Mo
del
12
Mo
del
9
M
od
el 1
0
M
od
el 1
3
M
od
el 1
4
Mo
del
1
M
od
el 2
Mo
del
3
M
od
el 6
Mo
del
4
M
od
el 5
Mo
del
7
M
od
el 8
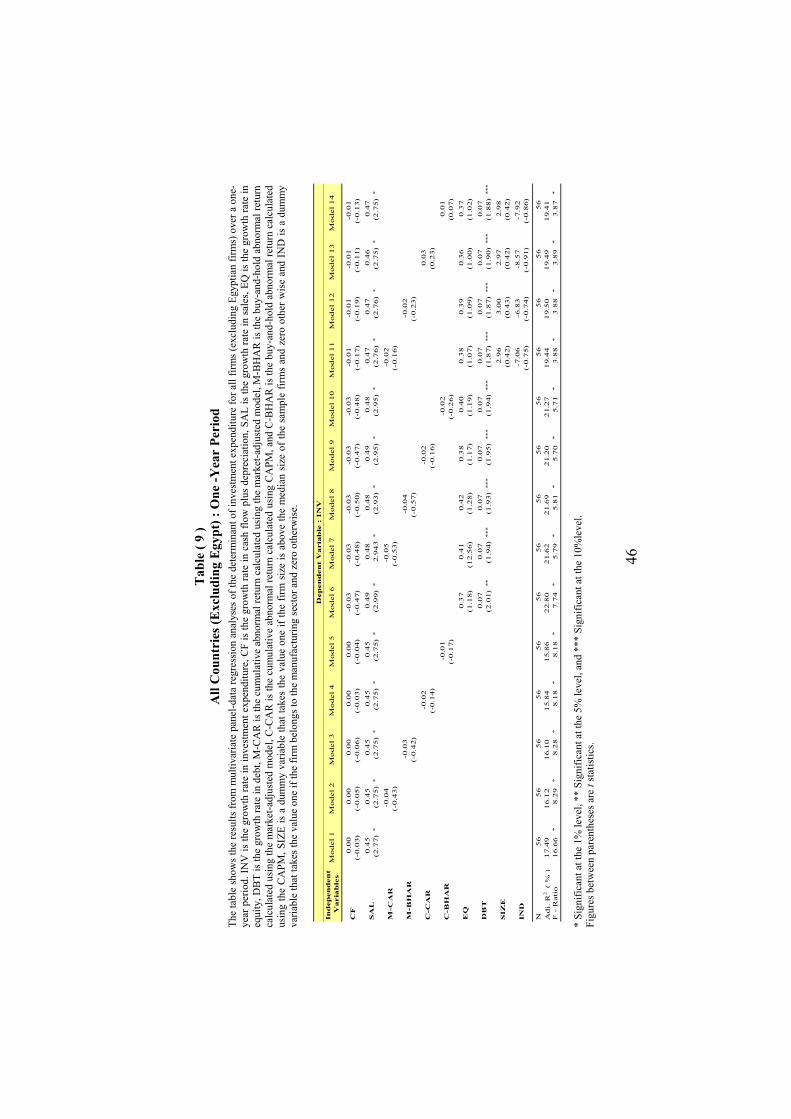
Tab
le (
9 )
All
Cou
ntri
es (E
xclu
ding
Egy
pt) :
One
-Yea
r Pe
riod
Th
e ta
ble
show
s the
resu
lts fr
om m
ultiv
aria
te p
anel
-dat
a re
gres
sion
ana
lyse
s of t
he d
eter
min
ant o
f inv
estm
ent e
xpen
ditu
re fo
r all
firm
s (ex
clud
ing
Egyp
tian
firm
s) o
ver a
one
-ye
ar p
erio
d. IN
V is
the
grow
th ra
te in
inve
stm
ent e
xpen
ditu
re, C
F is
the
grow
th ra
te in
cas
h flo
w p
lus
depr
ecia
tion,
SA
L is
the
grow
th ra
te in
sal
es, E
Q is
the
grow
th ra
te in
eq
uity
, DB
T is
the
grow
th ra
te in
deb
t, M
-CA
R is
the
cum
ulat
ive
abno
rmal
retu
rn c
alcu
late
d us
ing
the
mar
ket-a
djus
ted
mod
el, M
-BH
AR
is th
e bu
y-an
d-ho
ld a
bnor
mal
retu
rn
calc
ulat
ed u
sing
the
mar
ket-a
djus
ted
mod
el, C
-CA
R is
the
cum
ulat
ive
abno
rmal
retu
rn c
alcu
late
d us
ing
CA
PM, a
nd C
-BH
AR
is th
e bu
y-an
d-ho
ld a
bnor
mal
retu
rn c
alcu
late
d us
ing
the
CA
PM, S
IZE
is a
dum
my
varia
ble
that
take
s th
e va
lue
one
if th
e fir
m s
ize
is a
bove
the
med
ian
size
of t
he s
ampl
e fir
ms
and
zero
oth
er w
ise
and
IND
is a
dum
my
varia
ble
that
take
s the
val
ue o
ne if
the
firm
bel
ongs
to th
e m
anuf
actu
ring
sect
or a
nd z
ero
othe
rwis
e.
D
epen
den
t V
ari
ab
le :
IN
VIn
dep
end
ent
Vari
ab
les
0.0
0
0.0
0
0.0
0
0.0
0
0.0
0
-0.0
3
-0.0
3
-0.0
3
-0.0
3
-0.0
3
-0.0
1
-0.0
1
-0.0
1
-0.0
1
(-0.0
3)(-
0.0
5)(-
0.0
6)(-
0.0
3)(-
0.0
4)(-
0.4
7)(-
0.4
8)(-
0.5
0)(-
0.4
7)(-
0.4
8)(-
0.1
7)(-
0.1
9)(-
0.1
1)(-
0.1
3)0.4
5
0.4
5
0.4
5
0.4
5
0.4
5
0.4
9
0.4
8
0.4
8
0.4
9
0.4
8
0.4
7
0.4
7
0.4
6
0.4
7
(2.7
7)*
(2.7
5)*
(2.7
5)*
(2.7
5)*
(2.7
5)*
(2.9
9)*
2.9
43
*(2
.93)
*(2
.95)
*(2
.95)
*(2
.76)
*(2
.76)
*(2
.75)
*(2
.75)
*
-0.0
4
-0.0
5
-0.0
2
(-0.4
3)(-
0.5
3)(-
0.1
6)-0
.03
-0
.04
-0
.02
(-
0.4
2)(-
0.5
7)(-
0.2
3)-0
.02
-0
.02
0.0
3
(-0.1
4)(-
0.1
6)(0
.23)
-0.0
1
-0.0
2
0.0
1
(-0.1
7)(-
0.2
6)(0
.07)
0.3
7
0.4
1
0.4
2
0.3
8
0.4
0
0.3
8
0.3
9
0.3
6
0.3
7
(1.1
8)(1
2.5
6)(1
.28)
(1.1
7)(1
.19)
(1.0
7)(1
.09)
(1.0
0)(1
.02)
0.0
7
0.0
7
0.0
7
0.0
7
0.0
7
0.0
7
0.0
7
0.0
7
0.0
7
(2.0
1)**
(1.9
4)***
(1.9
3)**
*(1
.95)
***
(1.9
4)***
(1.8
7)***
(1.8
7)***
(1.9
0)***
(1.8
8)***
2.9
6
3.0
0
2.9
7
2.9
8
(0.4
2)(0
.43)
(0.4
2)(0
.42)
-7.0
6
-6.8
3
-8.5
7
-7.9
2
(-0.7
5)(-
0.7
4)(-
0.9
1)(-
0.8
6)
N5
6
56
5
6
56
5
6
56
5
6
56
5
6
56
5
6
56
5
6
56
A
dj.
R2
( %
)1
7.4
9
16.
12
1
6.1
0
15.
84
1
5.8
6
22.
80
2
1.6
2
21.
69
2
1.2
0
21.
27
1
9.4
4
19.
50
1
9.4
9
19.
41
F
- R
atio
16.
66
*
8.2
9
*8.2
8
*8.1
8
*8.1
8
*7.7
4
*5.7
9
*5.8
1
*5.7
0
*5.7
1
*3.8
8
*3.8
8
*3.8
9
*3.8
7
*
Mo
del
14
Mo
del
1
Mo
del
2
Mo
del
3
Mo
del
6
Mo
del
4
Mo
del
5
Mo
del
7
Mo
del
8
Mo
del
12
Mo
del
9
Mo
del
10
Mo
del
13
CF
SA
L
M-C
AR
Mo
del
11
IND
M-B
HA
R
EQ
DB
T
SIZ
E
C-C
AR
C-B
HA
R
* Si
gnifi
cant
at t
he 1
% le
vel,
** S
igni
fican
t at t
he 5
% le
vel,
and
***
Sign
ifica
nt a
t the
10%
leve
l. Fi
gure
s bet
wee
n pa
rent
hese
s are
t st
atis
tics.
46

Tab
le (
10 )
Com
pari
son
of D
iffer
ence
s in
Inve
stm
ent E
xpen
ditu
re
The
tabl
e sh
ows
the
resu
lts o
f sub
-sam
ple
com
paris
ons
of in
vest
men
t exp
endi
ture
usi
ng th
e pa
ram
etric
T-te
st a
nd th
e no
n-pa
ram
etric
Man
n-W
hitn
ey te
st. T
he E
gypt
ian
firm
s ar
e cl
assi
fied
acco
rdin
g to
siz
e, in
dust
ry a
nd o
wne
rshi
p, w
hile
the
entir
e sa
mpl
e (in
clud
ing
and
excl
udin
g Eg
yptia
n fir
ms)
is c
lass
ified
acc
ordi
ng to
siz
e an
d in
dust
ry o
nly.
Th
e T-
test
com
pare
s th
e m
eans
of
the
two
sam
ples
by
cons
truct
ing
conf
iden
ce in
terv
als
or b
ound
s fo
r ea
ch m
ean
and
for
the
diff
eren
ce b
etw
een
the
mea
ns. T
he M
ann-
Whi
tney
test
com
pare
s the
med
ians
of e
ach
pair
of sa
mpl
es b
y co
mbi
ning
them
, sor
ting
the
data
from
smal
lest
to th
e la
rges
t, an
d th
en c
ompa
ring
the
aver
age
rank
s of t
he tw
o sa
mpl
es in
the
com
bine
d da
ta. I
n pa
rticu
lar,
we
prov
ide
the
num
ber o
f rel
evan
t obs
erva
tions
in e
ach
sub-
sam
ple,
the
corr
espo
ndin
g m
ean
and
med
ian
valu
es o
f inv
estm
ent
expe
nditu
re, a
nd b
oth
the
T st
atis
tics
and
aver
age
rank
s al
ong
with
thei
r cor
resp
ondi
ng p
-val
ues.
The
null
hypo
thes
is fo
r the
par
amet
ric (n
on-p
aram
etric
) tes
t is t
hat t
he m
ean
(med
ian)
of s
ampl
e on
e eq
uals
the
mea
n (m
edia
n) o
f sam
ple
two,
ver
sus t
he a
ltern
ativ
e hy
poth
esis
that
the
mea
n (m
edia
n) o
f sam
ple
one
is n
ot e
qual
to th
e m
ean
(med
ian)
of
sam
ple
two.
Av-
Ran
k is
the
aver
age
rank
. Pa
nel A
: Egy
pt
Numb
er of
Obser
vatio
ns
of Sm
all Fi
rms
Mea
n of
Small
Firm
sM
ean o
f La
rge Fi
rms
Man
n-Whit
ney
Test
for
Diffe
rence
in
Med
ians
Numb
er of
Obser
vatio
ns of
M
anufa
cturin
g Firm
s
Mea
n of
Man
ufactu
ring
Firms
Mea
n of N
on-
Man
ufactu
ring
Firms
Man
n-Whit
ney
Test
for
Diffe
rence
in
Med
ians
Numb
er of
Obser
vatio
ns of
Pu
blic F
irms
Mea
n of
Publi
c Firm
sM
ean o
f Pr
ivate
Firms
Man
n-Whit
ney
Test
for
Diffe
rence
in
Med
ians
(Larg
e Firm
s)(M
edian
)(M
edian
)Av
- Ran
k(N
on- M
anufa
cturin
g firm
s)(M
edian
)(M
edian
)Av
- Ran
k(P
rivate
Firm
s)(M
edian
)(M
edian
)Av
- Ran
k
515.7
610
.2295
9.39
2.40
39-23
.1724
.55(63
)(-2
1.05)
(-20.5
1)(19
)(-2
1.33)
(-11.1
1)(75
)(-3
0.10)
(-9.01
)
22-10
.48-6.
2237
-1.77
-43.13
17-38
.7410
.78(22
)(-3
2.48)
(-45.4
0)(7)
(-26.8
8)(-5
7.49)
(27)
(-57.4
9)(-2
2.99)
1584
.0561
.3512
-31.67
147.0
4(14
)(-3
.10)
(-36.2
3)(17
)(-3
6.23)
(27.76
)-1.
9**
11.8
- 17.2
**
-2.16
**
51.3
- 60.7
***
-1.76
***
17.9
- 25.4
**
-0.21
56.6
- 58.2
-0.15
22.0
- 23.0
16.9
- 12.9
0.24
57.6
- 57.1
1.08
23.8
- 15.6
Three
Yea
rs
Owne
rship
Size
Indu
stry
One Y
ear
Two Y
ears
T st
atisti
c for
Di
fferen
ce in
M
eans
T st
atisti
c for
Di
fferen
ce in
M
eans
T st
atisti
c for
Di
fferen
ce in
M
eans
0.20
** S
igni
fican
t at t
he 5
% le
vel,
and
***
Sign
ifica
nt a
t the
10%
leve
l.
47

Ta
ble
( 10
) Con
tinue
d
Pane
l B : A
ll Cou
ntries
(Inc
luding
Egy
pt)
Numb
er of
Obser
vatio
nsM
ean o
fM
ean o
f T
statis
ticM
ann-W
hitne
y Test
Numb
er of
Obser
vatio
nsM
ean o
fM
ean o
f T
statis
ticM
ann-W
hitne
y Test
of Sm
all Fi
rms
Small
Firm
sLa
rge Fi
rms
for D
iffere
nce
for D
iffere
nce i
n Med
ians
of M
anufa
cturin
g Firm
sM
anufa
cturin
g Firm
sNo
n-Man
ufactu
ring F
irms
for D
iffere
nce
for D
iffere
nce i
n Med
ians
( Larg
e Firm
s)(M
edian
)(M
edian
)in
Mea
nsAv
-Ran
k( N
on-M
anufa
cturin
g Firm
s)(M
edian
)(M
edian
)in
Mea
nsAv
-Ran
k
772.7
27.7
313
56.0
03.3
8(93
)(-7
.30)
(-4.71
)(35
)(-7
.33)
(-2.18
)
30-6.
25-2.
5048
0.52
-23.95
(30)
(-24.7
0)(-1
3.87)
(12)
(-20.3
4)(-4
6.82)
Pane
l C : A
ll Cou
ntries
(Exc
luding
Egy
pt)
Numb
er of
Obser
vatio
nsM
ean o
fM
ean o
f T
statis
ticM
ann-W
hitne
y Test
Numb
er of
Obser
vatio
nsM
ean o
fM
ean o
f T
statis
ticM
ann-W
hitne
y Test
of Sm
all Fi
rms
Small
Firm
sLa
rge Fi
rms
for D
iffere
nce
for D
iffere
nce i
n Med
ians
of M
anufa
cturin
g Firm
sM
anufa
cturin
g Firm
sNo
n-Man
ufactu
ring F
irms
for D
iffere
nce
for D
iffere
nce i
n Med
ians
( Larg
e Firm
s)(M
edian
)(M
edian
)in
Mea
nsAv
-Ran
k( N
on-M
anufa
cturin
g Firm
s)(M
edian
)(M
edian
)in
Mea
nsAv
-Ran
k
26-3.
252.5
040
-2.06
4.54
(30)
(-1.37
)(-0
.90)
(16)
(-1.73
)(-0
.75)
84.5
- 89.2
0.93
31.8
- 25.5
-0.83
27.9
- 29.9
29.5
- 31.5
-0.8
27.4
- 29.5
0.15
Indu
stry
Size
Indu
stry
One Y
ear
One Y
ear
Two Y
ears
Size
-0.34
84.1
- 86.7
-0.18
48

Table ( 11 ) Payout-Related Statistics
The table shows several payout ratios along with their relationships to different specifications. We report the mean (median) payout ratios of our sample firms in Panel A. The cash-flow coefficients are provided in Panel B for all firms, high-dividend paying firms (sample 1), and low-dividend paying firms (sample 2). In Panels C and D, we provide the results obtained from the parametric t test and the non-parametric Mann-Whitney test along with the mean (median) values of debt to equity ratio and cash to current liabilities ratios, respectively. In particular, we provide the number of relevant observations in each sub-sample, and both t statistics and average ranks along with their significance levels. We report the results for the parametric (non-parametric) test under null hypothesis that the mean (median) values of debt equity ratio and cash to current liabilities ratio of sample one equals the mean (median) values of sample two, versus the alternative hypothesis that the mean (median) values of debt equity ratio and cash to current liabilities ratio of sample one is not equal to the mean (median) values of sample two.
All Firms 0.08
Panel A : Firms' Payout Ratios (Dividends as a % of Net Profits)
Egypt
Mean Median
64 68
Panel B : Cash Flow Coefficient
Egypt
-0.03
t - statistic
All Countries (Including Egypt)
Coefficient t - statistic
All Countries (Excluding Egypt)
Coefficient t - statistic
-0.48
All Countries (Including Egypt)
Mean Median
Coefficient
-0.22
0.26
66 69
All Countries (Excluding Egypt)
Mean Median
72 79
-0.01 -0.10
0.06
0.45
0.15High-Dividend Paying Firms
Low-Dividend Paying Firms
0.440.29 -0.040.07
0.40 0.06
0.05
0.97
49
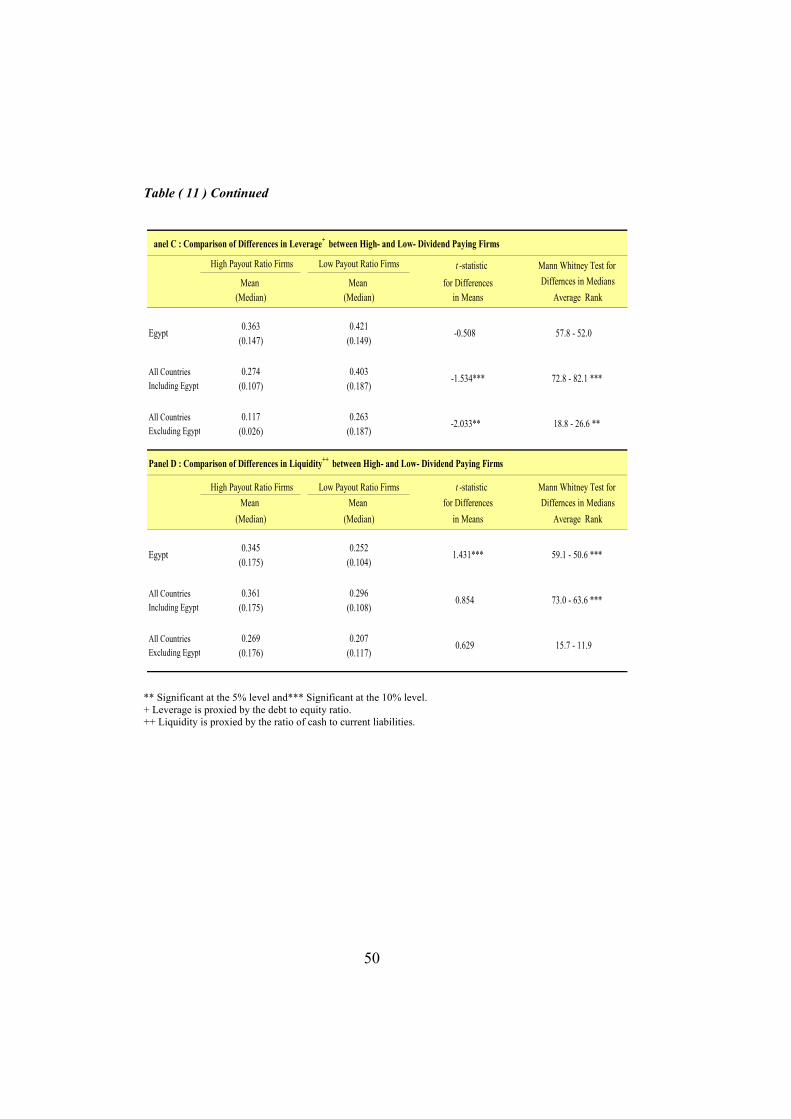
Table ( 11 ) Continued
P
E
In
A
0.207 0.629 Excluding Egypt (0.176) (0.117)All Countries 0.269 15.7 - 11.9
0.421(0.149)
0.403(0.187)
Excluding Egypt
0.363(0.147)
0.274
73.0 - 63.6 ***
0.263(0.187)
(0.107)
0.117(0.026)
All Countriescluding Egypt
ll Countries
All Countries 0.361 0.296 0.854 Including Egypt (0.175) (0.108)
Average Rank
Egypt 0.345 0.252 1.431***(0.175) (0.104)
59.1 - 50.6 ***
(Median) (Median) in Means
(Median) (Median)
Panel D : Comparison of Differences in Liquidity++ between High- and Low- Dividend Paying Firms
Mean Mean for Differences Differnces in MediansMann Whitney Test for High Payout Ratio Firms Low Payout Ratio Firms t -statistic
Differnces in Mediansin Means Average Rank
18.8 - 26.6 **
57.8 - 52.0
72.8 - 82.1 ***
-2.033**
-1.534***
High Payout Ratio Firms Low Payout Ratio Firms
anel C : Comparison of Differences in Leverage+ between High- and Low- Dividend Paying Firms
gypt
t -statistic Mann Whitney Test for
-0.508
Mean Mean for Differences
** Significant at the 5% level and*** Significant at the 10% level. + Leverage is proxied by the debt to equity ratio. ++ Liquidity is proxied by the ratio of cash to current liabilities.
50

References
1. Arab Monetary Fund (AMF). Various Issues. Arab Stock Markets
Database. Abu Dhabi: AMF.
2. Aivazian, V., Booth, L. and S. Cleary. 2003. “Do Emerging
Market Firms Follow Different Dividend Policies from U.S.
Firms?” Journal of Financial Research, Vol. 26, No. 3, pp. 371-
88.
3. Baker, M., Stein, J. and J. Wurgler. 2002. “When Does the Stock
Market Matter? Stock Prices and the Investment of Equity-
Dependent Firms”, Harvard University. mimeo.
4. Barro, R. 1990. “The Stock Market and Investment”, Review of
Financial Studies, Vol. 3, No. 1, pp. 115-31.
5. Blanchard, O., Rhee, C., and L. Summers. 1993. “The Stock
Market, Profit, and Investment”, Quarterly Journal of Economics,
Vol. 108, pp. 115-36.
6. Bolbol, A. and M. Lovewell. 2001. “Three Views on Stock Market
Valuations”, Journal of Post-Keynesian Economics, Vol. 23, No.
3, pp. 362-75.
51

7. Bolbol, A. 2001. “Arab Financial Structure and Economic
Growth: Evidence from the 1990’s”, Arab Monetary Fund. mimeo.
8. Brainard, W. and J. Tobin. 1968. “Pitfalls in Financial Model
Building”, American Economic Review, Vol. 58, pp. 99-122.
9. Demirguc-Kunt, A. and V. Maksimovic. 1996. “Stock Market
Development and Financing Choices of Firms”, World Bank
Economic Review, Vol. 10, No. 2, pp. 341-69.
10. Durham, J. 2000. “Econometrics of the Effects of Stock Market
Development on Growth and Private Investment in Lower Income
Countries”, QEH Working Paper No. 53.
11. El-Erian, M. and M. Kumar. 1995. “Emerging Equity Markets in
Middle Eastern Countries”, IMF Staff Paper, Vol 42, pp. 313-43.
12. Fazzari, S., Hubbard, R. and B. Petersen. 1988. “Financing
Constraints and Corporate Investment”, Brookings Papers on
Economic Activity, No. 1, pp. 141-95.
13. Fischer, S. and R. C. Merton. 1984. “Macroeconomics and
Finance: The Role of the Stock Market”, Carnegie Rochester
Conference Series on Public Policy, Vol. 21, pp. 57-108.
14. Green, C., Murinde, V. and R. Ngugi. 2000. “Key Microstructure
and Policy Issues for Emerging Stock Markets: What Have We
52

Learned?” Finance and Development Research Program Working
Paper No. 16, University of Manchester. mimeo.
15. Hayashi, F. 1982. “Tobin’s Marginal Q and Average Q: A
Neoclassical Interpretation”, Econometrica, Vol. 50, pp. 213-24.
16. Kaplan, S. and L. Zingales. 1997. “Do Financing Constraints
Explain Why Investment Is Correlated with Cash Flow?”,
Quarterly Journal of Economics, Vol. 112, No. 1, pp. 169-215.
17. Kothari, S. and J. Warner. 1997, “Measuring Long-Run Horizon
Security Price Performance”, Journal of Financial Economics,
Vol. 43, pp. 301-40.
18. Lyon, J., Barber, B. and C. Tsai. 1999, “Improved Methods for
Tests of Long-run Abnormal Stock Returns”, Journal of Finance,
Vol. 54, pp. 165-201.
19. Mauro, P. 2000. “Stock Returns and Output Growth in Emerging
and Advanced Economies”, IMF Working Paper WP/00/89.
Washington, D.C: IMF.
20. Morck, R., Shleifer, A., and R. Vishny. 1990. “The Stock Market
and Investment: Is the Market a Sideshow?” Brookings Papers on
Economic Activity, No. 2, pp. 157-216.
53

21. Myers, S. 1984. “The Capital Structure Puzzle”, Journal of
Finance, Vol. 39, pp. 575-59.
22. Omran, M. 2002. “Performance and Sources of Growth: A Case
Study of the Egyptian Economy,” AMF Economic Paper No. 5.
Abu Dhabi: AMF.
23. Omran, M. 2003.“Performance Consequences of Privatizing
Egyptian State-Owned Enterprises: The Effect of Post-
Privatization Ownership Structure on Firm Performance”, mimeo.
24. Omran, M. and S. Farrar. Forthcoming. “Tests of Weak Form
Efficiency in the Middle East Emerging Markets”, Studies in
Economics and Finance.
25. Omran, M. and J. Pointon. Forthcoming. “Dividend Policy, Firms’
Trading Characteristics, and Share Prices: Empirical Evidence
from Egypt”, International Journal of Theoretical and Applied
Finance.
26. Polk, C. and P. Sapienza. 2002. “The Real Effects of Investor
Sentiment”, Northwestern University. mimeo.
27. Rogoff, K. 1999. “International Institutions for Reducing Global
Financial Instability,” Journal of Economic Perspectives, Vol. 13,
No. 4, pp. 21-42.
54

28. Salinger, M. and L. Summers. 1983. “Tax Reform and Corporate
Investment: A Microeconomic Simulation Study”, in Behavioral
Simulation Methods in Tax Policy Analysis, Feldstein, M. (ed.).
Chicago: University of Chicago Press.
29. Samuel, C. 1996. “ Stock Market and Investment: The Signaling
Role of the Market”, World Bank Policy Research Paper No.
1612. Washington, D.C: World Bank.
30. Shachmurove, Y. 2003. “Introduction for the Special Issue on
Emerging Financial Markets of the Middle East”, International
Journal of Business, Vol. 8, No. 3, pp. 227-41.
31. Singh, A. and J. Hamid. 1993. “Corporate Financial Structures in
Developing Countries”, IFC Technical Paper No. 1. Washington,
D.C.: World Bank.
32. Singh, A. and B. Weisse. 1998. “Emerging Stock Markets
Portfolio Capital Flows and Long-term Economic Growth: Micro
and Macroeconomic Perspectives”, World Development, Vol. 26,
No. 4, pp. 607-22.
33. Snowden, P. 1997. “Enterprise Ownership Constraints and the
Role of Equity Markets in Financial Development”, Journal of
Development Studies, Vol. 34, No. 1, pp. 131-48.
55

34. Stein, J. 1996. “Rational Capital Budgeting in an Irrational
World”, Journal of Business, Vol. 69, pp. 429-55.
35. Stein, J. 2001. “Agency, Information and Corporate Investment”
in the Handbook of the Economics of Finance, G. Constatinides,
M. Harris, and R. Stultz (ed.).
56