INVESTMENT ADVISER’S LETTER TO … ADVISER’S LETTER TO SHAREHOLDERS SEMI-ANNUAL REPORT ......
48
TWEEDY, BROWNE FUND INC. This booklet consists of two separate documents: INVESTMENT ADVISER’S LETTER TO SHAREHOLDERS SEMI-ANNUAL REPORT Tweedy, Browne Global Value Fund Tweedy, Browne Global Value Fund II – Currency Unhedged Tweedy, Browne Value Fund Tweedy, Browne Worldwide High Dividend Yield Value Fund September 30, 2012
Transcript of INVESTMENT ADVISER’S LETTER TO … ADVISER’S LETTER TO SHAREHOLDERS SEMI-ANNUAL REPORT ......

TWEEDY, BROWNE FUND INC.
This booklet consists of two separate documents:
INVESTMENT ADVISER’S LETTERTO SHAREHOLDERS
SEMI-ANNUAL REPORT
Tweedy, Browne Global Value FundTweedy, Browne Global Value Fund II – Currency Unhedged
Tweedy, Browne Value FundTweedy, Browne Worldwide High Dividend Yield Value Fund
September 30, 2012

TWEEDY, BROWNE FUND INC.
Investment Adviser’s Letter to Shareholders . . . . . . . . . . . . . . . . . . . . . . . . . . . . . . . . . . . . . . . . . . . . . I-1
Semi-Annual Report . . . . . . . . . . . . . . . . . . . . . . . . . . . . . . . . . . . . . . . . . . . . . . . . . . . . . . . . . . . . . . . . . II-1
Tweedy, Browne Fund Inc.Expense Information . . . . . . . . . . . . . . . . . . . . . . . . . . . . . . . . . . . . . . . . . . . . . . . . . . . . . . . . . . . . . II-2
Tweedy, Browne Global Value FundPortfolio of Investments . . . . . . . . . . . . . . . . . . . . . . . . . . . . . . . . . . . . . . . . . . . . . . . . . . . . . . . . . . II-3Sector Diversification . . . . . . . . . . . . . . . . . . . . . . . . . . . . . . . . . . . . . . . . . . . . . . . . . . . . . . . . . . . . II-5Portfolio Composition . . . . . . . . . . . . . . . . . . . . . . . . . . . . . . . . . . . . . . . . . . . . . . . . . . . . . . . . . . . II-5Schedule of Forward Exchange Contracts . . . . . . . . . . . . . . . . . . . . . . . . . . . . . . . . . . . . . . . . . . . . II-5
Tweedy, Browne Global Value Fund II – Currency UnhedgedPortfolio of Investments . . . . . . . . . . . . . . . . . . . . . . . . . . . . . . . . . . . . . . . . . . . . . . . . . . . . . . . . . . II-7Sector Diversification . . . . . . . . . . . . . . . . . . . . . . . . . . . . . . . . . . . . . . . . . . . . . . . . . . . . . . . . . . . . II-9Portfolio Composition . . . . . . . . . . . . . . . . . . . . . . . . . . . . . . . . . . . . . . . . . . . . . . . . . . . . . . . . . . . II-9
Tweedy, Browne Value FundPortfolio of Investments . . . . . . . . . . . . . . . . . . . . . . . . . . . . . . . . . . . . . . . . . . . . . . . . . . . . . . . . . . II-10Sector Diversification . . . . . . . . . . . . . . . . . . . . . . . . . . . . . . . . . . . . . . . . . . . . . . . . . . . . . . . . . . . . II-11Portfolio Composition . . . . . . . . . . . . . . . . . . . . . . . . . . . . . . . . . . . . . . . . . . . . . . . . . . . . . . . . . . . II-11Schedule of Forward Exchange Contracts . . . . . . . . . . . . . . . . . . . . . . . . . . . . . . . . . . . . . . . . . . . . II-11
Tweedy, Browne Worldwide High Dividend Yield Value FundPortfolio of Investments . . . . . . . . . . . . . . . . . . . . . . . . . . . . . . . . . . . . . . . . . . . . . . . . . . . . . . . . . . II-12Sector Diversification . . . . . . . . . . . . . . . . . . . . . . . . . . . . . . . . . . . . . . . . . . . . . . . . . . . . . . . . . . . . II-13Portfolio Composition . . . . . . . . . . . . . . . . . . . . . . . . . . . . . . . . . . . . . . . . . . . . . . . . . . . . . . . . . . . II-13
Tweedy, Browne Fund Inc.Statements of Assets and Liabilities . . . . . . . . . . . . . . . . . . . . . . . . . . . . . . . . . . . . . . . . . . . . . . . . . II-14Statements of Operations . . . . . . . . . . . . . . . . . . . . . . . . . . . . . . . . . . . . . . . . . . . . . . . . . . . . . . . . . II-15Statements of Changes in Net Assets . . . . . . . . . . . . . . . . . . . . . . . . . . . . . . . . . . . . . . . . . . . . . . . . II-16Financial Highlights . . . . . . . . . . . . . . . . . . . . . . . . . . . . . . . . . . . . . . . . . . . . . . . . . . . . . . . . . . . . . II-18Notes to Financial Statements . . . . . . . . . . . . . . . . . . . . . . . . . . . . . . . . . . . . . . . . . . . . . . . . . . . . . II-20Investment in the Fund by the Investment Adviser and Related Parties . . . . . . . . . . . . . . . . . . . . II-23Other Information . . . . . . . . . . . . . . . . . . . . . . . . . . . . . . . . . . . . . . . . . . . . . . . . . . . . . . . . . . . . . . II-27

TWEEDY, BROWNE FUND INC.
Our Investment Team

This page left blank intentionally.

TWEEDY, BROWNE FUND INC.
Investment Adviser’s Letter to Shareholders (Unaudited)
… the riskiness of an investment is not measured by beta (aWall Street term encompassing volatility and often used inmeasuring risk) but rather by the probability – the reasonedprobability – of that investment causing its owner a loss ofpurchasing power over his contemplated holding period. Assetscan fluctuate greatly in price and not be risky as long as they arereasonably certain to deliver increased purchasing power overtheir holding period. And as we will see, a nonfluctating assetcan be laden with risk.
– Warren Buffett, Why Stocks Beat Gold and Bonds,Fortune Magazine, February 27, 2012
Since we last wrote to you in early May, the net change inmost developed market equity indices has been relativelyminor, but the ride between then and now measured by theswings in these indices has been anything but dull. Manymarket indices around the world declined as much as 15% to20% between late March and early June and then seeminglythrew off concerns about a worrisome world and ran back upto the levels seen in late Spring. If you had just returned froma six-month sabbatical to the South Pole, no doubt you wouldhave concluded that you had not missed much, and thereturns year-to-date are probably better than a cursoryassessment of the world’s financial health would havesuggested last December. In fact, aside from a modestlyencouraging flow of news in the past few months fromEuropean capitals, in our estimation not much has happenedthat will dramatically change the uncertain outlook in thecoming months. Wall Street “physicians” have diagnosed thepast several months as a “traditional” summer rally althoughwe don’t know how “traditional” those rallies are. Oddly, atthe same time, we have an environment that Grant’s InterestRate Observer described as one in which “safety” is in abubble. Shorter term interest rates (up to 2 years) in manycountries are negative, meaning you have to pay the borrowerfor the privilege of holding their paper. Our ten year treasurybond, which is a bellwether measure for the cost of money,currently yields about 1.8%. Surely not much of a return ifheld to maturity, and that leaves aside any discussion aboutthe purchasing power of those dollars in ten years if youdecide to hang on until maturity. Despite these yields, moneycontinues to flow into government securities, money marketfunds and many bond funds. Further evidence of this “safetybubble” is the increased issuance of corporate debt,presumably to “lock in” low interest rates. Finally, in anexample of unintended consequences, private equity firmshave been able to increase their issuance of debt to paythemselves and their investors large dividends driven in partby the low returns available elsewhere in the fixed incomemarkets. Our hunch again is the cost of money must be a keydriver of their decision since the case for a “robust” macroenvironment is weak. We are sure it comes as no surprise toyou that we believe there are better opportunities in theequity markets.
When it comes to the year ahead, those in the business ofpredicting market movements are seemingly looking atdifferent facts since there is not much agreement amongthem. We are reminded in some ways of the presidentialcandidates’ discussion over taxes and the budget. Can theypossibly be looking at the same data? Now we certainly arenot going to burden you with our politics and we are in noway trying to be smug in our comments about market“forecasting.” As we have said before, we believe the task oftrying to get the “market direction” right over a limited timeperiod is not the best way to evaluate the merits of anyparticular investment. Put simply, we operate with a differentinvestment horizon and a different perspective. As investors,we own businesses and we like the productive capital-building nature of their assets. Our job is to try and determinewhat that business will look like in three to five years and buyit at a discount from our estimate of business value. If we canget these variables about right, our expectation is we willmake out very well over time.
So what has changed from our perspective since our lastletter other than some halting steps in the right direction inEurope? The answer has to be “Not a lot.” Certainly, at themacroeconomic level, the U.S. economy continues to grow ata rate insufficient to make much of a dent in theunemployment rate and provide employment opportunitiesfor our college graduates and unemployed. The solutionobviously requires an end to political gridlock and a plan/compromise which puts us back on a sustainable fiscal path.There is little disagreement over the view that the currentpath is not sustainable. To get to a sustainable path willrequire more deal makers and fewer ideologues. A credibleplan could very likely have a significant impact on theeconomy since the critical missing ingredient is confidence.Interest rates and the cost of money is not standing in the wayof a pickup in economic activity. On a positive note, at themicroeconomic level corporations are generally faring quitewell. Balance sheets are strong, costs are under control and inthe case of businesses that operate on a global basis (many ofwhich we own), they are doing well in those markets whereyou would expect them to do well. What they are also doingis sitting on their liquidity for the most part rather thaninvesting, which is rational given the circumstances. An endto political brinkmanship would no doubt have a realbeneficial impact on markets. Very much the same can besaid about Europe as about the U.S. Europe faces the samedemographic/entitlement problems but has the addedproblem of much more rigid labor markets and a need tomove toward a more federal political structure, certainly withregard to banking regulation as a first step. Recent discussionsin Europe, at the policy level, have taken on a more hopefultone. A common currency will ultimately be difficult tomaintain without further fiscal and financial integration andpoliticians seem to be inching in the direction of furtherintegration. At the end of what is likely to be a bumpy ride,we think it would be wrong to bet that the “political class”will drive the rest of us off the economic cliff. In the
I-1

meantime, we want to own the most resilient and financiallysound businesses we can find when the market puts them upfor sale at a discount.
As we have mentioned many times in past reports, ourreturns over time in individual stocks are derived from theclosing of the discount between our original purchase priceand our estimate of intrinsic value, and from the futurecompounding of the businesses’ underlying value. Given therise in equity prices, it should come as no surprise that thediscount in many of our holdings has narrowed, with futurereturns in some of our holdings becoming more reliant on thecompounding of intrinsic value. Nonetheless, we still havenumerous stocks that are priced at a discount from ourestimates of intrinsic value. What does all this mean for ourinvestors? First, valuation informs our outlook and theadvance in global equity prices over the last six months hasmade our job of finding attractive entry points into new stockideas much more difficult, and new opportunities are certainlyturning up with less frequency. Secondly, we have beentrimming and, in a few instances selling, securities that havereached our estimates of intrinsic value. This includes manyof our steady consumer products companies such as Nestle,Heineken, Diageo, Philip Morris International and the likewhere we have enjoyed very satisfactory returns. We willcontinue to hold several of these companies as their prospectsfor future compounding of intrinsic value remain high, butsome will have to go. Some of the proceeds from these trimsand sales have found their way into industrial companies thatare a bit more economically sensitive where we have foundpricing opportunities as investors have begun to discount aslowing global economy. The rest has gone into cash reserves.If equity markets continue to march forward in the weeks andmonths ahead, cash reserves will likely build at the margin inour Funds.
Performance Results
We are pleased to report that the performance of all fourof our Funds has been quite good on both an absolute andrelative basis over the last six months. Three of our Fundshave achieved double-digit rates of return year-to-datethrough September 30, 2012. Worldwide High DividendYield Value Fund is up over 9% for the same period. Whilethis is really good news, as we mentioned, we have also had tosell and trim back a number of positions that traded up to ourestimates of intrinsic value resulting in a modest level ofrealized gains in our portfolios. This means that the tax manthis year will be sharing in small part in our good fortune.Over the longer term, in all of our Funds, the tax man’s takehas typically been de minimus. We are very proud of the factthat all four Funds, since their respective inceptions, have notonly outperformed their respective benchmarks net of feesand expenses, but they have also outperformed these samebenchmarks net of estimated taxes on distributions andassuming a sale at the end of the period. Since its inceptionover 19 years ago, our flagship Fund, the Tweedy, BrowneGlobal Value Fund, has outperformed the hedged andunhedged MSCI EAFE Index by over 365 basis points on anannualized basis net of fees, expenses and taxes, and this iswithout applying a fee against, or tax effecting, the Index.This is in large part related to the Fund’s longer term
investment horizon and associated low levels of annualportfolio turnover, which have averaged approximately 13%annually since the Fund’s inception (through fiscal year-endMarch 31, 2012).
Presented below are investment results of the fourTweedy, Browne Funds, through September 30, 2012, withcomparisons to the indices we consider relevant.*
Tweedy, Browne Global Value Fund
Period Ended9/30/12
Returnbefore
Taxes**
Returnafter
Taxes onDistributions**
Return afterTaxes on
Distributions &Sale of Fund
Shares**
MSCIEAFE
Index(1)(2)
(Hedgedto US$)
MSCIEAFE
Index(1)(2)
(in US$)
3 Months 5.12% 5.12% 3.33% 4.67% 6.92%
6 Months 3.57 3.57 2.32 -0.69 -0.70
1 Year 19.23 18.70 13.59 14.15 13.75
3 Years 9.92 9.82 8.76 1.50 2.12
5 Years 0.46 -0.23 0.47 -5.70 -5.24
10 Years 9.36 8.87 8.37 5.43 8.20
15 Years 7.69 6.65 6.40 2.47 3.37
Since Inception(6/15/93)(3) 9.77 8.75 8.41 4.62 4.73
Total Annual Fund Operating Expense Ratio as of 3/31/12: 1.40%†
Tweedy, Browne Global Value Fund II –Currency Unhedged
Period Ended9/30/12
Returnbefore
Taxes**
Returnafter
Taxes onDistributions**
Return afterTaxes on
Distributions &Sale of Fund
Shares**
MSCIEAFE
Index(1)(2)
(in US$)
MSCIEAFE
Index(1)(2)
(Hedgedto US$)
3 Months 6.48% 6.48% 4.21% 6.92% 4.67%
6 Months 2.57 2.57 1.67 -0.70 -0.69
1 Year 16.21 16.05 10.81 13.75 14.15
Since Inception(10/26/09)(3) 7.11 7.02 6.10 1.62 1.44
Gross Annual Fund Operating Expense Ratio as of 3/31/12: 1.44%†‡
Net Annual Fund Operating Expense Ratio as of 3/31/12: 1.41%†‡
Tweedy, Browne Value Fund
Period Ended9/30/12
Returnbefore
Taxes**
Returnafter
Taxes onDistributions**
Return afterTaxes on
Distributions &Sale of Fund
Shares**
S&P 500/MSCIWorldIndex
(Hedged toUS$)(1)(4)(5)(6)¶
MSCIWorldIndex
(Hedged toUS$)(1)(6)
S&P500(1)(5)
3 Months 4.98% 4.98% 3.24% 5.59% 5.59% 6.35%
6 Months 3.52 3.52 2.29 1.22 1.22 3.43
1 Year 21.79 21.11 14.92 21.40 21.40 30.20
3 Years 9.50 8.91 8.11 7.03 7.03 13.20
5 Years 2.06 1.01 1.57 -2.37 -2.37 1.05
10 Years 6.75 5.82 5.75 6.13 - 8.01
15 Years§ 4.92 3.98 4.01 3.48 - 4.70
Since Inception§(12/8/93)(3) 8.35 7.47 7.24 7.23 - 8.24
Total Annual Fund Operating Expense Ratio as of 3/31/12: 1.41%†
¶ S&P 500 (12/8/93-12/31/06)/MSCI World Index (Hedged to US$) (1/1/07-present).
I-2

Tweedy, Browne WorldwideHigh Dividend Yield Value Fund
Period Ended9/30/12
Returnbefore
Taxes**
Returnafter
Taxes onDistributions**
Return afterTaxes on
Distributions &Sale of Fund
Shares**
MSCIWorld
Index(1)(6)
(in US$)
3 Months 5.66% 5.66% 3.68% 6.71%
6 Months 2.88 2.38 1.85 1.30
1 Year 15.76 15.08 10.34 21.59
3 Years 9.64 9.25 8.22 7.48
5 Years 1.87 1.34 1.37 -2.15
Since Inception(9/5/07)(3) 2.08 1.56 1.55 -1.15
30-Day Standardized Yield (Subsidized) as of 9/30/12: 1.80%
30-Day Standardized Yield (Unsubsidized) as of 9/30/12: 1.81%
Gross Annual Fund Operating Expense Ratio as of 3/31/12: 1.39%†‡
Net Annual Fund Operating Expense Ratio as of 3/31/12: 1.39%†‡
* The preceding performance data represent past performance andis not a guarantee of future results. Total return and principalvalue of an investment will fluctuate so that an investor’s shares,when redeemed, may be worth more or less than their original cost.The returns shown do not reflect the deduction of taxes that ashareholder would pay on Fund distributions or the redemption ofFund shares. Current performance may be lower or higher than theperformance data shown. Please visit www.tweedy.com to obtainperformance data, which is current to the most recent month end.See page I-8 for footnotes 1 through 6, which describe the indicesand inception dates of the Funds. Results are annualized for allperiods greater than one year.
** After-tax returns are calculated using the historical highestindividual federal marginal income tax rates, and do not reflect theimpact of state and local taxes. Returns after taxes on distributionsare adjusted for federal income taxes associated with funddistributions, but do not reflect the federal income tax impact of gainsor losses recognized when fund shares are sold. Returns after taxeson distributions and sale of fund shares are adjusted for federalincome taxes associated with fund distributions and reflect the federalincome tax impact of gains or losses recognized when fund shares aresold. Actual after-tax returns depend on an investor’s tax situationand may differ from those shown. Additionally, the after-tax returnsshown are not relevant to investors who hold their Fund sharesthrough tax-deferred arrangements such as 401(k) plans orindividual retirement accounts.
† The Funds do not impose any front-end or deferred sales charge.However, the Tweedy, Browne Global Value Fund, Tweedy,Browne Global Value Fund II – Currency Unhedged and Tweedy,Browne Worldwide High Dividend Yield Value Fund impose a 2%redemption fee on redemption proceeds for redemptions or exchangesmade within 60 days of purchase. Performance data does not reflectthe deduction of the redemption fee, and if reflected, the redemptionfee would reduce the performance data quoted for periods of 60 daysor less. The expense ratios shown above reflect the inclusion ofacquired fund fees and expenses (i.e., the fees and expensesattributable to investing cash balances in money market funds) andmay differ from those shown in the Funds’ financial statements.
‡ Tweedy, Browne Company LLC (the “Adviser”) hascontractually agreed to waive its investment advisory fee and/or to reimburse expenses of the Worldwide High Dividend
Yield Value Fund and Global Value Fund II — CurrencyUnhedged to the extent necessary to maintain the totalannual fund operating expenses (excluding fees and expensesfrom investments in other investment companies, brokerage,interest, taxes and extraordinary expenses) at no more than1.37%. This arrangement will continue at least throughDecember 31, 2013. In this arrangement the Worldwide HighDividend Yield Value Fund and Global Value Fund II —Currency Unhedged have agreed, during the two-year periodfollowing any waiver or reimbursement by the Adviser, torepay such amount to the extent that after giving effect tosuch repayment such adjusted total annual fund operatingexpenses would not exceed 1.37% on an annualized basis.The performance data shown above would be lower had feesand expenses not been waived and/or reimbursed.
§ The Value Fund’s performance data shown above wouldhave been lower had certain fees and expenses not beenwaived from December 8, 1993 through March 31, 1999.
/ /
We have written in past letters that it is not only thereturns that an investment advisor earns that determines hisor her effectiveness. Of equal, if not more importance, is howthose returns were achieved. We have always felt that buyingat large discounts from estimated intrinsic value; diversifyingby issue, industry, country and market cap; taking aconservative approach to business appraisal; and avoidinghighly leveraged businesses helped to limit the risks we havetaken with our shareholders’ and our own money. We wouldagree wholeheartedly with the Oracle of Omaha, WarrenBuffett, that volatility, or the day-to-day movement of stockprices, is not real risk. That said, some of our clients andfinancial advisors do use statistical tools to try to measure therisks that investment advisors take while investing theirclients’ capital. While we do not pay much, if any, attentionto such statistical measures, we thought we would share withyou just how the Tweedy, Browne Global Value Fund stacksup when viewed through such a lens.
For example, one measure that consultants and financialadvisors use to evaluate an advisor’s performance is upside anddownside capture. This compares how much of the upside anadvisor generally captures in strong market environments tothe amount of the downside the advisor captures in downmarkets. Evaluating our Global Value Fund’s performancewith this measure, we found that over the last ten yearsthrough September 30, 2012, the Fund capturedapproximately 94% of the return of its benchmark (MSCIEAFE Index (Hedged to US $))in up markets while capturingonly 72% of the return of that benchmark in down markets.This compares to a downside capture of 111% and an upsidecapture of 119% for the average Foreign Large Value fund atMorningstar.7 By limiting our losses in down markets, andparticipating fairly aggressively in up markets, we have beenable to beat our benchmark by roughly 395 basis points on anannualized basis over the last ten years. Now this outcome hasnot been produced by a secret formula on our part. Nor is itan outcome for which we have a statistical explanation.Moreover, we have no idea what next year will bring. Whatwe do know is the process has worked well most of the timeover long periods of time and in many markets.
I-3

Another measure that financial consultants use toevaluate the risks that an advisor takes is the manager’s“volatility” of returns, or how a fund’s returns vary around itsaverage return over time compared to the same measure ofvariance applied to its benchmark. A lower standarddeviation of returns or variance for the fund relative to itsbenchmark is considered by those consultants to be anindication that the fund is achieving its returns at a lowerlevel of risk than the benchmark. With respect to thismeasure, the Tweedy, Browne Global Value Fund’s returnsover the last ten years were earned with a level of volatilitythat was 87% that of its benchmark’s. Again, our commentson this matter are the same as our comments on the conceptof upside/downside capture.
Another measure some financial consultants use is“alpha.” A high and positive “alpha” in excess of aninvestment manager’s benchmark suggests the investmentmanager is producing attractive returns on a risk adjustedbasis. Here again, the Tweedy, Browne Global Value Fundhas achieved an “alpha,” which is 190% greater than that ofthe average Foreign Large Value fund at Morningstar for theten years ending September 30, 2012. Again, we wouldreiterate that measures of volatility and alpha assume that riskis “variance” and this is not something with which we wouldagree. Whether one’s perception of risk is grounded instatistics, or as is the case with us, in Benjamin Graham’sfundamental price-to-value relationship, the Tweedy, BrowneGlobal Value Fund has produced returns over the longer termthat are more than commensurate with the risks taken.
Our Fund Portfolios
Please note that individual companies discussed herein representholdings in our Funds, but are not necessarily held in all four of ourFunds. Refer to footnote 8 at the end of the letter for the individualweightings of these companies in the respective Funds.
A cursory review of our Funds’ portfolios’ top twenty-fivepositions might lead one to conclude that our portfolios aredominated by the stocks of branded consumer productscompanies. To be sure, our Fund portfolios have had asignificant exposure to food, beverage and tobacco companiesfor quite some time relative to benchmark indices, and thesecompanies have served us very well in an environment whereinvestors have often preferred steadier, underleveragedbusinesses that pay an attractive dividend. However, a closerexamination of our Funds’ portfolios would reveal a morediversified structure with significant exposure to oil & gascompanies, healthcare companies, financials and industrialcompanies in addition to our consumer stocks. This is simplya result of where we have uncovered undervalued securitiesover time.
Over the last couple of years, securities’ markets havebeen in a rather frenetic “risk on, risk off” state of mind asthey react almost daily to the ebb and flow of various“headline” macro risks, not the least of which has been theSouthern European crisis. We would suspect this marketcondition and the frequent trading it implies is welcomed bythe IRS, as most gains are likely to be short term, giving thegovernment a bigger bite of the profits. When the risk trade ison and investors are feeling more confident, the more
economically sensitive stocks, i.e., financials, industrials, mediaand oil & gas holdings, have tended to perform well. Incontrast, when the risk trade is off and investors are worried,the steadier, consumer products companies provided muchneeded ballast for our Funds. For the most part, in 2011 the risktrade was off, and our consumer stocks held up better than moststocks, and helped to propel our Funds to a strong relativeoutperformance of their respective benchmarks. On the otherhand, thus far, 2012 has been a good year for global equities.With the exception of April and May of this year when theSouthern European issue heated up, the markets have been“risk on.” While our consumer stocks for the most partcontinued to perform well, many of our more economicallysensitive issues, became leaders in our portfolios during theyear. This would include certain of our bank and insurancestocks as well as some of our media and industrial holdings.
In general, most stocks in our Funds’ portfolios are upnicely this year, and as we mentioned, caused us to trim, andin some instances sell stocks whose market prices are nowtrading at or near our estimate of their underlying intrinsicvalues. This list includes companies such as Diageo, Nestle,Philip Morris International, Kone, Henkel, Wal-Mart, ArcaContinental, and Fraser & Neave, among others. Some of theresulting cash from this pruning has found its way intocompanies outside the consumer sector, including industrial,energy and financial companies, but a growing portionremains unspent waiting for pricing opportunities. We wouldlike to highlight and share with you in more detail than weusually go into in these reports three companies in which wehave started to build a position. This should give you an ideaas to where value is showing up for us in today’s equitymarkets and remind you of the types of characteristics we liketo see in the companies in which we invest.
Safran
The first is a French aerospace company called Safran thatderives the majority of its earnings and value from its civil jetengine business. At our initial purchase price, we believed wewere paying approximately 9 x 2012 Earnings Before Interestand Taxes and Amortization (EBITA), and a much lowermultiple of prospective 2013 and 2014 EBITA.
The civil jet engine industry is an oligopolistic industrywith large barriers to entry, stable market shares, and longproduct cycles. The engine that comprises the majority ofSafran’s engine business is called the CFM56, which isproduced through a 50/50 joint venture with General Electriccalled CFMI. The CFM56 is the dominant engine on narrowbody aircraft where it has a 100% share on the Boeing 737and a 50% share on the A320 where it competes against aconsortium controlled by Pratt & Whitney called IAE. Boththe Airbus A320 and 737 have substantial backlogs anddeliveries should grow nicely over the next several years.Moreover, CFMI (Safran) has secured its status as the solesupplier on the new version of the 737 (737 Max) and as adual supplier on the new version of the A320 (A320 Neo),which ensures that CFMI will retain its dominant share onnarrow body planes well into the 2020s.
The jet engine business model is a “razor/razor blade”business. Jet engines are sold around cost, but the real money
I-4
is made on high margin (60%) spare parts, which areeffectively captive to the original equipment manaufacturer(OEM), giving Safran substantial pricing power. Generic(PMA) parts represent approximately 3% of the market andhave struggled to gain share for a variety of reasons, including:an expensive and time consuming certification process;leasing companies’ preference for OEM parts which betterpreserve residual aircraft values; airline concerns related tothe reputational risks associated with the failure of an engineequipped with PMA parts; and the increasing penetration of“power by the hour” contracts, whereby the OEM alsoperforms the overhaul work. As such, once an engine is sold,it is very likely guaranteed to generate a long-term stream ofspare parts revenue for the OEM. Each engine will have tovisit the shop for an overhaul 3 to 5 times over its life andwhile there is uncertainty regarding the exact timing of thevisit there is strong visibility and stability over multi-yearperiods.
Our research suggests that spare parts revenue for theCFM56 will experience significant growth over the next 3 to5 years driven by an increase in shop visits, price increases,mix shift benefits, and a catch-up from deferred maintenance.
Shop visits – On average the current generation ofengines stay on the wing for approximately eight to nine yearsbefore coming into the shop for an overhaul. This means thatcurrent shop visits are being driven in large part by deliveriesin 2004 and 1996, which were both trough years for CFM56deliveries. However, from 1996 to 2000 and 2004 to 2008engine deliveries grew by more than 100% and 70%,respectively, which should drive an increase in shop visitsover the next 3 to 5 years. It is also worth mentioning that asof December 2011, approximately 9,500 of the roughly 18,000engines in the active fleet had never been to the shop.
Price and Mix – Our research indicates that OEMs areable to raise prices on most spare parts by approximately5% per annum. Moreover, there is an ongoing mix shift fromfirst generation engine shop visits to second generationengine shop visits, which generate significantly higherrevenue per shop visit. We estimate that by 2015, secondgeneration engines will account for approximately 66% of allshop visits as compared to 52% in 2011.
Deferred maintenance – During industry downturnsairlines defer maintenance and reduce the scope of shop visitsto preserve cash. Historically this has resulted in very steeprecoveries in spare parts revenue when the cycle turns.Discussions with industry participants suggest that the airlinesare pushing up against the limits of these deferral strategiesand at some point these strategies will result in a substantialcatch-up.
We don’t believe the positive aspects of the civil jetengine business are reflected in Safran’s current valuation.Given the quality of the business, the stability of the industry,as well as strong growth prospects for the aftermarket, wethink Safran is conservatively worth 12 to 13 x forwardEBITA. It is also encouraging that comparable transactionshave occurred at significantly higher multiples. In October of2011, Pratt & Whitney purchased Rolls Royce’s 32.5% shareof IAE (the only competitor to CFMI in the narrow body
space) at an estimated high teens multiple of operatingincome bringing Pratt’s total ownership of IAE to 65%. Whilewe have never used a high teens comparable to value aprospective investment, always preferring to use moreconservative multiples, we were delighted to see that a veryhigh price had been paid by a knowledgeable acquirer for abusiness directly comparable to Safran.
As we have mentioned in past letters, value investors suchas ourselves often have a difficult time investing in hightechnology companies largely due to their frequent highvaluations, rapid rates of change in technology, and thepotential for obsolescence. The last thing in the world wewant to do is pay a high price for a rapidly growing businessthat gets leapfrogged by technological change shortly after webuy it. With this in mind, you might be surprised to knowthat we began building a position in Google back in Februaryof this year when the stock dipped down to around $565 pershare. At this price, we felt we were getting a bargain, payingroughly 12.5 x 2012 estimated earnings net of the cash on itsbalance sheet. And this was for a business that grows its topline at greater than 20% per year.
Google principally provides paid search, which is aneffective, measurable, and high return on investment form ofadvertising. Google provides paid search on desktopcomputers, tablets, and mobile phones and has market sharesthat range from 65% to 85% throughout much of the world.Additionally, Google has one of the largest Displayadvertising networks in the industry, which is growingextremely fast and is quickly becoming a more meaningfulpart of the business.
Paid search is more mature today than it was in 2005 andwe think that future growth will slow. Nevertheless, Googlegrew revenue roughly 24% in the first half of 2012 on acurrency exchange rate neutral basis and our research suggeststhat paid search is still relatively underpenetrated.Advertising dollars have not yet caught up with the ongoingshift to ecommerce and digital media consumption, whichwill continue to drive dollars to paid search as well asGoogle’s fast growing global display network. Display has thepotential to be a large business as it is driven in large part bybrand based ad spending which accounts for the vast majorityof global ad spending.
With market shares in the search business that range from65% to 85% in most countries throughout the world, it isreasonable to conclude that Google has a strong competitiveposition. Google’s revenue is roughly 15 times higher than itsnearest competitor, which has enabled them to putsignificantly more money into R&D, distribution, and thedevelopment of products and eco-systems that furtherpromote and protect the use of Google’s search. Moreover, asMicrosoft’s investment in search can attest, the searchbusiness is expensive to enter. However, like everyinvestment we make, Google is not without risks. Verticalsearch, uncertainty regarding future growth rates, and risksrelated to Apple’s strong share in smartphones and tablets allneed to be monitored closely. Nevertheless, we feel thatGoogle is well positioned to protect its interests and, perhaps
I-5

most importantly, we paid a price that we felt more thandiscounted these potential risks.
We bought Google at roughly 12.5 x 2012 estimatedearnings net of the cash on the balance sheet. We think thisis a very low valuation as companies with market leadingpositions secured by strong competitive advantages in seculargrowth markets typically do not trade at market multiples.Unlike most companies growing revenue over 20% perannum, Google is also able to generate significant free cashflow due to the phenomenal economics of paid search. Forthese reasons we believe Google is undervalued and deserves asignificantly above average multiple.
Vallourec
Vallourec is a vertically integrated producer of brandedpremium seamless steel pipes and connections that have avariety of industrial purposes, the most important of which isfor use in drilling for oil & gas, an application where the useof a strong, reliable pipe is critical. Although the company isheadquartered and listed in France, it is truly a globalenterprise with more than 70% of revenue generated outsideof Europe. Revenue from oil and gas operations accounted for61% of its total revenue in the last quarter. Vallourec’s oil &gas segment sells seamless steel pipes and connectionsprimarily for use in unconventional oil & gas plays in the U.S.,as well as in deepwater projects throughout the world. Thesetypes of wells use considerably more seamless pipes andconnections than traditional wells. More importantly, as newsources of oil and gas are in more difficult to drill locations,like deepwater offshore and unconventional shale, there isgrowth in demand for Vallourec’s capabilities. For example, in1990, deepwater offshore drilling was zero percent of global oilproduction. Today deepwater drilling produces roughly 5.5million barrels of oil per day, and is projected to produceroughly 9 million barrels per day by 2020. Also,unconventional gas (shale) has grown rapidly in recent years,and today represents 23% of annual U.S. gas production.
Vallourec has been in business for 100 years, and has alimited number of competitors in this niche business of highquality seamless pipes and connections. These products aredesigned to withstand the extreme temperature, pressure, andother factors related to more complex oil & gas drillingconditions and are protected by a multitude of patents andtechnical know-how. Vallourec’s customers are keenly awareof the environmental risks and safety requirements fordrilling, particularly offshore, and thus have a preference forhigh quality pipes and connections. The cost of these pipesand connections relative to the overall price to drill a well isvery low. The price of the pipes provided by Vallourec is 5%to 10% of the total cost of an oil\gas well, so there is little tobe gained by switching to a cheaper pipe, but a lot to lose.Given the potential for catastrophic environmental disasters(and significant fines), it would not be rational for a drillingcustomer to scrimp on price for this most important, yetrelatively inexpensive component of his or her well.
Facing higher costs in Europe, and with the potential tolower its production costs abroad, Vallourec recentlyembarked on a major expansion of its production facilities,adding new capacity in the U.S. and in Brazil. These facilities
will allow Vallourec to produce its products locally, instead ofproducing and exporting from Europe. In May 2012,Vallourec’s management made a number of announcements,including delays in qualification for the Brazilian plant andhigher than expected capital expenditures to bring the U.S.plant on line. The stock sold off significantly and reachedwhat we thought were quite attractive levels over the nextmonth, eventually bottoming near two-thirds of book value.This caught our interest. We began building a position in ourFunds in Vallourec at around 28 to 29 Euros per share in lateJune. At this price, we felt we were paying roughly 69% of thecompany’s stated book value, 82% of tangible book value, andtwo-thirds of a conservative estimate of the company’sintrinsic value. Given the rather concentrated nature of theseamless pipe industry, there were not a lot of comparableM&A deals to examine. However, in 2007, Tenaris, one ofVallourec’s major competitors, acquired Hydril, a leadingNorth American manufacturer of premium connections andpressure control products for 15 x EBIT. Consistent with ourconservative appraisal policies, we used a lower multiple of10 x 2013 EBIT to value Vallourec, and purchased shares atapproximately two-thirds of that value.
Despite the delays in qualification and the higher thanexpected capital expenditures, we believe that both projectswill ultimately be successful, particularly given the favorableoutlook for unconventional shale plays and deepwater. Ourevaluation of the business, specifically the connectionsbusiness, leads us to believe that Vallourec’s intrinsic value isgreater than its stated book value. Although in the short termthe company’s legacy exposure to European manufacturingcould weigh on the stock, we believe the long term prospectsfor Vallourec’s oil & gas business are quite strong. It has asolid balance sheet with very little debt, which should allow itto weather near term disappointments that may arise. Forinvestors such as ourselves, who are willing to look further outon the investment horizon for our returns, we felt we werebeing presented with an unusual pricing opportunity.
Tweedy, Browne Worldwide High Dividend YieldValue Fund
Just a quick word about the approaching fiscal cliff andwhat, if anything, it might portend for high dividend stocks.As we have said in past letters, higher tax rates should not inour opinion materially alter the attractive fundamental casefor dividend paying equities. First, many political observersbelieve that a grand bargain will be struck after the electionthat for the most part preserves the tax advantaged status ofdividends. Secondly, even if a bargain is not achieved and taxrates on dividends rise, it is our understanding that a largepercentage of the investors who own dividend paying equitiesare tax exempt institutions and tax exempt accounts such asIRAs and 401(k)s. Thirdly, it is quite possible, if not likely,that of the remaining taxable investors who own dividendpaying equities, only the top earners (those making over$250,000) will pay higher rates on dividends. Finally,according to a recent research report from Fidelity, whendividend tax rates were brought down from high ordinaryrates to the low rates under the Bush tax cuts, there was verylittle reaction in equity markets in terms of new flows intohigher yielding equities.9 It is quite possible that we will have
I-6

the same kind of muted reaction if rates do indeed rise ondividends. In our view, this does not suggest a potentialstampede out of dividend paying equities, particularly thosethat are attractively priced, have conservative payout ratios,and pay a reasonable and growing dividend yield.
As with our other Funds, in the Worldwide HighDividend Yield Value Fund we have trimmed or sold of latenumerous consumer based companies that have served uswell, such as Kimberly-Clark and Philip Morris among othersas they approached fair value, and reinvested in moreindustrial based companies, such as Siemans, ABB and Tescoamong others. All three of these companies at originalpurchase traded at siginficant discounts from conservativeappraisals, and paid stable and growing dividends between3.8% and 4.6%.
While a good deal of money has flowed into dividendstocks over the last year or so, and for good reason given theirvaluations, the uncertain macro picture, and low yields onbonds, we believe that our holdings remain reasonably toattractively priced with a weighted average price earningsratio of 12.1 x 2012 estimated earnings, and a weightedaverage dividend yield of 4.2%. (Please note that the weightedaverage dividend yield shown above is not representative of theWorldwide High Dividend Yield Value Fund’s yield, nor does itrepresent the Fund’s performance. The figure solely represents theaverage dividend yield of the common stocks held in the Fund’sportfolio. Please refer to the 30-Day Standardized Yield in theperformance chart on page I-3 for the Fund’s yield.) That said,with the advance in global equity markets over the lastseveral months, mis-priced dividend stocks are becomingmore difficult to uncover.
Looking Forward
To say that markets have been driven lately by the actionsand comments of central bankers around the world is anunderstatement. Thanks in large part to their ratherexpansive monetary policies, global equity markets havesteamed ahead this year. Year-to-date, the MSCI WorldIndex, a proxy for developed equity markets around the globe,is up approximately 13% in U.S. dollars, and has compoundedat 22.5% per year since the bottom of the financial crisis overthree years ago (March 9, 2009 through September 30, 2012).Not bad for the so called “new normal,” which post-crisismarket prognosticators suggested called for more mutedreturns. However, in our humble opinion, fundamentally notmuch has changed, particularly on the macroeconomic frontwhere uncertainty still looms large. The global economicrecovery remains anemic; the eurozone continues to be miredin uncertainty; China appears to be slowing; tensions areescalating in the Middle East; and the U.S. has madelittle-to-no progress with respect to its own budget crisis. Evencorporate performance, which has been surprisingly good,now appears to be weakening somewhat. Despite bonds beingat historically low yields, investment capital, supported bymonetary ease, has only just begun to flow back into stocksever so modestly.
As always, our forward view is largely informed byvaluation. To that end, as of October 31, 2012, the weighted
average P/E multiple on our Funds was approximately13.2 x 2012 estimated earnings, which translates into anearnings yield of approximately 7.6%.* This compares veryfavorably to the yield on ten-year treasuries, which is less than2%, and the recent level of the Consumer Price Index, whichhas been running around 2.2%†. While some caution iscertainly warranted given higher stock prices and continuedmacroeconomic uncertainty, we think that value-orientedequities are still for the most part fairly priced today, and webelieve offer investors a better chance of preservingpurchasing power over time.
One final note. We will be moving our offices in lateFebruary of next year to Stamford Connecticut, a suburbancommunity about 40 miles up the road from New York City.In looking out over the next ten to twenty years in ourbusiness, we felt that there were meaningful cost savings to behad moving out of New York into Connecticut. As many ofyou may know, the Stamford/Greenwich Connecticut areahas become a financial center over the last 10 yearsparticularly for investment advisory firms and hedge funds.Our new offices will be in the Thomson Reuters building, apremier Stamford building located adjacent to the Stamfordtrain station, which is easily accessible to our employees andclients from New York City via trains out of Grand CentralStation. The transition should be seamless. Please come visitus if you find yourself in the New York area.
Thank you for investing with us, and for your continuedconfidence.
Sincerely,
TWEEDY, BROWNE COMPANY LLC
William H. BrowneThomas H. ShragerJohn D. SpearsRobert Q. Wyckoff, Jr.Managing Directors
October 2012
* P/E ratios based on estimated 2012 earnings.Source: Bloomberg.
† Stocks and bonds are subject to different risks. In general, stocksare subject to greater price fluctuations and volatility than bondsand can decline significantly in value in response to adverse issuer,political, regulatory, market, or economic developments. Unlikestocks, bonds, if held to maturity, generally offer to pay both a fixedrate of return and a fixed principal value. Bonds are subject tointerest rate risk (as interest rates rise bond prices generally fall),the risk of issuer default, issuer credit risk, and inflation risk,although U.S. Treasuries are backed by the full faith and credit ofthe U.S. government.
I-7

Footnotes:(1) Indexes are unmanaged, and the figures for the indexes
shown include reinvestment of dividends and capital gainsdistributions and do not reflect any fees or expenses.Investors cannot invest directly in an index. We stronglyrecommend that these factors be considered before aninvestment decision is made.
(2) MSCI EAFE Index US$ is an unmanaged capitalizationweighted index of companies representing the stock marketsof Europe, Australasia and the Far East. MSCI EAFEIndex Hedged consists of the results of the MSCI EAFEIndex hedged 100% back into US dollars and accounts forinterest rate differentials in forward currency exchangerates. Results for both indexes are inclusive of dividends andnet of foreign withholding taxes.
(3) Inception dates for the Global Value Fund, Global ValueFund II – Currency Unhedged, Value Fund andWorldwide High Dividend Yield Value Fund are June 15,1993, October 26, 2009, December 8, 1993, andSeptember 5, 2007, respectively. Prior to 2004,information with respect to MSCI EAFE indexes used wasavailable at month end only; therefore the closest month endto the Global Value Fund’s inception date, May 31, 1993,was used.
(4) S&P 500/MSCI World Index (Hedged to US$) is acombination of the S&P 500 Index and the MSCI WorldIndex (Hedged to US$), linked together by Tweedy,Browne Company, and represents the performance of theS&P 500 Index for the periods 12/8/93 – 12/31/06, andcontinuing with the performance of the MSCI World Index(Hedged to US$), beginning 1/01/07 and thereafter. Forthe period from the Fund’s inception through 2006, theInvestment Adviser chose the S&P 500 as the relevantmarket benchmark. Starting in mid-December 2006, theFund’s investment mandate changed from investing at least80% of its assets in US securities to investing no less thanapproximately 50% in U.S securities, and so the InvestmentAdviser chose the MSCI World Index (Hedged to US$) asthe most relevant benchmark for the Fund for periodsstarting January 1, 2007.
(5) S&P 500 Index is an unmanaged capitalization weightedindex composed of 500 widely held common stocks thatassumes the reinvestment of dividends. The index isgenerally considered representative of U.S. largecapitalization stocks.
(6) The MSCI World Index is a free float-adjusted unmanagedmarket capitalization weighted index that is designed tomeasure the equity market performance of developedmarkets. The MSCI World Index (US$) reflects the returnof this index for a US dollar investor. MSCI World Index(Hedged to US$) consists of the results of the MSCI WorldIndex with its foreign currency exposure hedged 100% backinto US dollars. The index accounts for interest ratedifferentials in forward currency exchange rates. Results forthis index are inclusive of dividends and net of foreignwithholding taxes.
(7) Morningstar’s Foreign Large Value category: Foreign large-value funds invest mainly in big international stocks that areless expensive than the market as a whole. Most of thesefunds divide their assets among a dozen or more developedmarkets, including Japan, United Kingdom, France, andGermany. They tend to invest the rest in emerging marketssuch as Hong Kong, Brazil, Mexico and Thailand. Thesefunds typically will have less than 20% of assets invested inU.S. stocks.
(8) As of September 30, 2012, Tweedy, Browne Global ValueFund, Tweedy, Browne Global Value Fund II- CurrencyUnhedged, Tweedy, Browne Value Fund and Tweedy,Browne Worldwide High Dividend Yield Value Fund hadinvested the following percentages of its net assets,respectively, in the following portfolio holdings: Diageo(3.5%, 3.3%, 3.4%, 2.3%); Nestle (3.5%, 2.9%, 3.6%,2.2%); Heineken (3.7%, 2.8%, 3.2%, 0.0%); PhilipMorris International (1.7%, 1.2%, 1.6%, 1.6%); Kone(1.0%, 0.4%, 0.0%, 0.0%); Henkel (2.5%, 1.7%,2.4%, 0.0%); Wal-Mart (0.0%, 0.0%, 2.3%, 0.0%);Arca Continental (1.6%, 0.5%, 0.6%, 0.5%); Fraser &Neave (0.0%, 0.0%, 0.0%, 0.0%); Safran (1.6%, 2.0%,0.0%, 0.0%); Google (1.1%, 0.0%, 1.7%, 0.0%);Vallourec (0.8%, 1.0%, 0.0%, 0.0%); Kimberly-Clark(0.0%, 0.0%, 0.0%, 0.7%); Siemans (0.0%, 1.6%,0.0%, 2.6%); ABB (0.0%, 0.9%, 0.0%, 2.0%); andTesco (0.0%, 0.9%, 0.0%, 1.4%).
(9) “Dividends and taxes: Why market forces may continue tosupport dividend-paying stocks”, James Morrow (PortfolioManager, Fidelity Equity-Income Fund), FidelityViewpoints, Fidelity.com, September 19, 2012.
Current and future portfolio holdings are subject to risk.Investing in foreign securities involves additional risks beyondthe risks of investing in US securities markets. These risksinclude currency fluctuations; political uncertainty; differentaccounting and financial standards; different regulatoryenvironments; and different market and economic factors invarious non-US countries. In addition, the securities of small,less well known companies may be more volatile than those oflarger companies. Value investing involves the risk that themarket will not recognize a security’s intrinsic value for a longtime, or that a security thought to be undervalued mayactually be appropriately priced when purchased. Please referto the Funds’ prospectus for a description of risk factorsassociated with investments in securities which may be heldby the Funds.
Although the practice of hedging against currency exchangerate changes utilized by the Tweedy, Browne Global ValueFund and Tweedy, Browne Value Fund reduces the risk of lossfrom exchange rate movements, it also reduces the ability ofthe Funds to gain from favorable exchange rate movementswhen the US dollar declines against the currencies in whichthe Funds’ investments are denominated and in some interestrate environments may impose out-of-pocket costs on theFunds.
I-8

This letter contains opinions and statements on investmenttechniques, economics, market conditions and other matters.Of course there is no guarantee that these opinions andstatements will prove to be correct, and some of them areinherently speculative. None of them should be relied upon asstatements of fact.©2012 Morningstar, Inc. All Rights Reserved. Theinformation contained herein: (1) is proprietary toMorningstar and/or its content providers; (2) may not becopied or distributed; and (3) is not warranted to be accurate,complete or timely. Neither Morningstar nor its content
providers are responsible for any damages or losses arisingfrom any use of this information. Past performance is noguarantee of future results.
Tweedy, Browne Global Value Fund, Tweedy, Browne GlobalValue Fund II – Currency Unhedged, Tweedy, Browne ValueFund, and Tweedy, Browne Worldwide High Dividend YieldValue Fund are distributed by Tweedy, Browne CompanyLLC.
This material must be preceded or accompanied by aprospectus for Tweedy, Browne Fund Inc.
I-9

This page left blank intentionally.

TWEEDY, BROWNE FUND INC.
Tweedy, Browne Global Value FundTweedy, Browne Global Value Fund II – Currency UnhedgedTweedy, Browne Value FundTweedy, Browne Worldwide High Dividend Yield Value Fund
SEMI-ANNUAL REPORT
September 30, 2012
II-1

TWEEDY, BROWNE FUND INC.
Expense Information (Unaudited)
A shareholder of the Global Value Fund, Global ValueFund II – Currency Unhedged, Value Fund or WorldwideHigh Dividend Yield Value Fund (collectively, the “Funds”)incurs two types of costs: (1) transaction costs and(2) ongoing costs, including management fees and otherFund expenses. The Example below is intended to help ashareholder understand their ongoing costs (in U.S. dollars)of investing in the Funds and to compare these costs withthe ongoing costs of investing in other mutual funds.
The Example is based on an investment of $1,000invested at the beginning of the period and held for theentire period of April 1, 2012 to September 30, 2012.
Actual Expenses The first part of the table presentedbelow, under the heading “Actual Expenses”, providesinformation about actual account values and actualexpenses. The information in this line may be used with theamount a shareholder invested to estimate the expensesthat were paid by the shareholder over the period. Simplydivide the shareholder’s account value by $1,000 (forexample, an $8,600 account value divided by $1,000 = 8.6),then multiply the result by the number in the first lineunder the heading entitled “Expenses Paid during Period” toestimate the expenses paid during this period.
Hypothetical Example for Comparison Purposes Thesecond part of the table presented below, under the heading“Hypothetical Expenses”, provides information abouthypothetical account values and hypothetical expenses
based on each Fund’s actual expense ratio and an assumedrate of return of 5% per year before expenses, which is noteach Fund’s actual return. The hypothetical account valuesand expenses may not be used to estimate the actual endingaccount balance or expenses paid by the shareholder of theFunds for the period. This information may be used tocompare the ongoing costs of investing in the Funds toother funds. To do so, compare this 5% hypotheticalexample with the 5% hypothetical examples that appear inthe shareholder reports of the other funds.
Please note that the expenses shown in the table beloware meant to highlight a shareholder’s ongoing costs onlyand do not reflect redemption fees. Redemptions from theGlobal Value Fund, the Global Value Fund II – CurrencyUnhedged and the Worldwide High Dividend Yield ValueFund, including exchange redemptions, within 60 days ofpurchase are subject to a redemption fee equal to 2% of theredemption proceeds, which will be retained by the Funds.There are no other transactional expenses associated withthe purchase and sale of shares charged by any of the Funds,such as commissions, sales loads and/or redemption fees onshares held longer than 60 days. Other mutual funds mayhave such transactional charges. Therefore, the second partof the table is useful in comparing ongoing costs only, andwill not help a shareholder determine the relative total costsof owning different funds. In addition, if redemption feeswere included a shareholder’s costs would have been higher.
Actual ExpensesHypothetical Expenses
(5% Return before Expenses)
BeginningAccountValue4/1/12
EndingAccountValue
9/30/12
ExpensesPaid during
Period*4/1/12 –9/30/12
BeginningAccountValue4/1/12
EndingAccountValue
9/30/12
ExpensesPaid during
Period*4/1/12 –9/30/12
AnnualizedExpense
Ratio
Global Value Fund $1,000.00 $1,035.70 $7.04 $1,000.00 $1,018.15 $6.98 1.38%
Global Value Fund II –Currency Unhedged $1,000.00 $1,025.70 $6.96 $1,000.00 $1,018.20 $6.93 1.37%
Value Fund $1,000.00 $1,035.20 $7.09 $1,000.00 $1,018.10 $7.03 1.39%
Worldwide High DividendYield Value Fund $1,000.00 $1,028.80 $6.97 $1,000.00 $1,018.20 $6.93 1.37%
* Expenses are equal to each Fund’s annualized expense ratio, multiplied by the average account value over the period,multiplied by the number of days in the period, divided by 365 (to reflect the one-half year period).
II-2

Tweedy, Browne Global Value Fund
Portfolio of InvestmentsSeptember 30, 2012 (Unaudited)
SharesValue
(Note 2)
COMMON STOCKS—85.0%
Canada—1.1%750,000 National Bank of Canada . . . . . . . . . . . . . . . . . . . $56,710,199
Czech Republic—0.0%(a)
2,800 Philip Morris CR a.s. . . . . . . . . . . . . . . . . . . . . . . 1,620,626
Finland—1.0%756,800 Kone Oyj, Class B . . . . . . . . . . . . . . . . . . . . . . . . . 52,429,795
France—9.1%7,719,256 CNP Assurances . . . . . . . . . . . . . . . . . . . . . . . . . . 100,947,1732,181,535 Safran SA . . . . . . . . . . . . . . . . . . . . . . . . . . . . . . . 78,541,434
651,820 SCOR SE . . . . . . . . . . . . . . . . . . . . . . . . . . . . . . . 16,825,895712,949 Teleperformance SA . . . . . . . . . . . . . . . . . . . . . . 20,444,659
3,984,810 Total SA . . . . . . . . . . . . . . . . . . . . . . . . . . . . . . . 197,881,984988,950 Vallourec SA . . . . . . . . . . . . . . . . . . . . . . . . . . . . 41,921,912
456,563,057
Germany—9.3%3,726,000 Axel Springer AG . . . . . . . . . . . . . . . . . . . . . . . . 161,637,3601,936,000 Henkel AG & Company, KGaA . . . . . . . . . . . . . 126,451,460
896,077 Krones AG . . . . . . . . . . . . . . . . . . . . . . . . . . . . . . 48,008,65442,354 KSB AG . . . . . . . . . . . . . . . . . . . . . . . . . . . . . . . . 22,097,858
699,000 Muenchener Rueckversicherungs AG . . . . . . . . . 109,260,903467,456,235
Hong Kong—0.4%271,000 Guoco Group Ltd. . . . . . . . . . . . . . . . . . . . . . . . . 2,439,725434,500 Jardine Strategic Holdings Ltd. . . . . . . . . . . . . . . . 14,738,240
2,104,000 Sinolink Worldwide Holdings Ltd.(b) . . . . . . . . . . 165,53617,343,501
Italy—0.7%3,645,000 Arnoldo Mondadori Editore SpA(b) . . . . . . . . . . . 4,661,173
144,268 Buzzi Unicem SpA . . . . . . . . . . . . . . . . . . . . . . . . 1,598,9564,795,392 SOL SpA(c) . . . . . . . . . . . . . . . . . . . . . . . . . . . . . . 27,144,892
33,405,021
Japan—5.2%191,000 Aica Kogyo Company Ltd. . . . . . . . . . . . . . . . . . . 3,277,442
1,594,700 Canon, Inc. . . . . . . . . . . . . . . . . . . . . . . . . . . . . . 51,141,086200,000 Daiwa Industries Ltd. . . . . . . . . . . . . . . . . . . . . . . 930,591
2,064,000 Fujitec Company Ltd. . . . . . . . . . . . . . . . . . . . . . . 12,177,069446,600 Fukuda Denshi Company Ltd. . . . . . . . . . . . . . . . 14,350,900
1,069,200 Hi-Lex Corporation . . . . . . . . . . . . . . . . . . . . . . . 15,598,2261,577,500 Honda Motor Company Ltd. . . . . . . . . . . . . . . . . 48,602,410
75,400 Kaga Electronics Company Ltd. . . . . . . . . . . . . . . 735,586125,000 Katsuragawa Electric Company Ltd.(b) . . . . . . . . . . 144,602133,000 Kawasumi Laboratories, Inc. . . . . . . . . . . . . . . . . . 776,118
1,329,500 Kuroda Electric Company Ltd. . . . . . . . . . . . . . . . 16,251,34373,800 Lintec Corporation . . . . . . . . . . . . . . . . . . . . . . . . 1,348,89069,100 Mandom Corporation . . . . . . . . . . . . . . . . . . . . . . 1,817,206
216,700 Medikit Company Ltd. . . . . . . . . . . . . . . . . . . . . . 7,241,902165,400 Mirai Industry Company Ltd. . . . . . . . . . . . . . . . . 1,913,36861,600 Mitsubishi Tanabe Pharma Corporation . . . . . . . . 939,835
2,116,000 NGK Spark Plug Company Ltd. . . . . . . . . . . . . . . 22,329,512162,780 Nippon Kanzai Company Ltd. . . . . . . . . . . . . . . . 3,220,03172,700 Ryoyo Electro Corporation . . . . . . . . . . . . . . . . . . 766,247
SharesValue
(Note 2)
Japan (continued)168,500 Sangetsu Company Ltd. . . . . . . . . . . . . . . . . . . . $4,656,491100,400 SEC Carbon Ltd. . . . . . . . . . . . . . . . . . . . . . . . . 320,041400,000 Shinko Shoji Company Ltd. . . . . . . . . . . . . . . . 3,609,254151,400 SK Kaken Company Ltd. . . . . . . . . . . . . . . . . . . 6,402,391375,300 T. Hasegawa Company Ltd. . . . . . . . . . . . . . . . . 4,852,851
1,787,400 Takata Corporation . . . . . . . . . . . . . . . . . . . . . . 32,255,907200,000 Tomen Electronics Corporation . . . . . . . . . . . . . 2,478,149
258,137,448
Mexico—3.0%11,580,000 Arca Continental SAB de CV . . . . . . . . . . . . . . 82,095,083
532,995 Coca-Cola Femsa SA de CV,Sponsored ADR(d) . . . . . . . . . . . . . . . . . . . . . 68,756,355
150,851,438
Netherlands—10.0%2,093,000 Akzo Nobel NV . . . . . . . . . . . . . . . . . . . . . . . . . 118,449,8523,835,000 Heineken Holding NV . . . . . . . . . . . . . . . . . . . 186,470,8933,950,188 Royal Dutch Shell PLC, Class A . . . . . . . . . . . . 136,704,049
967,460 Telegraaf Media Groep NV, CVA . . . . . . . . . . . 9,389,5771,368,000 Unilever NV, CVA . . . . . . . . . . . . . . . . . . . . . . 48,451,100
499,465,471
Norway—1.6%2,084,693 Schibsted ASA . . . . . . . . . . . . . . . . . . . . . . . . . 79,749,121
Singapore—1.4%4,428,800 United Overseas Bank Ltd. . . . . . . . . . . . . . . . . 70,943,116
South Korea—0.4%150,900 Daegu Department Store Company Ltd. . . . . . . 1,846,49490,974 Hanil Cement Company Ltd. . . . . . . . . . . . . . . 3,315,066
141,713 Samchully Company Ltd. . . . . . . . . . . . . . . . . . 12,623,06214,792 Samyang Genex Company Ltd. . . . . . . . . . . . . . 762,608
18,547,230
Spain—1.0%9,086,000 Mediaset España Comunicacion SA . . . . . . . . . 49,328,342
Sweden—0.0%(a)
63,360 Cloetta AB, B Shares(b) . . . . . . . . . . . . . . . . . . . 146,886
Switzerland—17.6%388,000 CIE Financiere Richemont AG . . . . . . . . . . . . . 23,284,954218,165 Coltene Holding AG(c) . . . . . . . . . . . . . . . . . . . 6,674,020343,783 Daetwyler Holding AG, Bearer . . . . . . . . . . . . . 28,660,77710,000 Loeb Holding AG . . . . . . . . . . . . . . . . . . . . . . . 2,041,924
2,781,120 Nestle SA, Registered . . . . . . . . . . . . . . . . . . . . 175,484,58880 Neue Zuercher Zeitung(b) . . . . . . . . . . . . . . . . . . 515,003
3,002,000 Novartis AG, Registered . . . . . . . . . . . . . . . . . . 183,831,77343,688 Phoenix Mecano AG . . . . . . . . . . . . . . . . . . . . . 21,035,135
185,918 PubliGroupe SA, Registered(c) . . . . . . . . . . . . . . 26,152,756984,000 Roche Holding AG . . . . . . . . . . . . . . . . . . . . . . 183,963,397248,117 Siegfried Holding AG(c) . . . . . . . . . . . . . . . . . . . 30,361,199
4,297 Sika AG, Bearer . . . . . . . . . . . . . . . . . . . . . . . . 8,769,574432,618 Tamedia AG . . . . . . . . . . . . . . . . . . . . . . . . . . . 46,032,986584,275 Zurich Insurance Group AG . . . . . . . . . . . . . . . 145,602,474
882,410,560
SEE NOTES TO FINANCIAL STATEMENTSII-3

Tweedy, Browne Global Value Fund
Portfolio of InvestmentsSeptember 30, 2012 (Unaudited)
SharesValue
(Note 2)
Thailand—1.1%9,089,500 Bangkok Bank Public Company Ltd., NVDR . . $57,289,246
United Kingdom—14.5%1,521,000 AGA Rangemaster Group PLC . . . . . . . . . . . . . 1,495,1621,782,000 BBA Aviation PLC . . . . . . . . . . . . . . . . . . . . . . 5,683,2261,882,980 British American Tobacco PLC . . . . . . . . . . . . . 96,677,3245,464,262 Daily Mail & General Trust PLC, Class A . . . . . 42,486,2006,289,000 Diageo PLC, Sponsored ADR . . . . . . . . . . . . . . 176,655,073
13,550,100 G4S PLC . . . . . . . . . . . . . . . . . . . . . . . . . . . . . . 58,137,2042,845,500 Hays PLC . . . . . . . . . . . . . . . . . . . . . . . . . . . . . 3,542,6891,397,625 Headlam Group PLC . . . . . . . . . . . . . . . . . . . . . 6,931,4796,648,155 HSBC Holdings PLC . . . . . . . . . . . . . . . . . . . . . 61,546,4721,026,408 Imperial Tobacco Group PLC . . . . . . . . . . . . . . 37,988,7263,346,355 Provident Financial PLC . . . . . . . . . . . . . . . . . . 74,192,9494,891,800 TT Electronics PLC . . . . . . . . . . . . . . . . . . . . . . 11,355,2482,700,000 Unilever PLC . . . . . . . . . . . . . . . . . . . . . . . . . . 98,186,603
17,721,661 Vodafone Group PLC . . . . . . . . . . . . . . . . . . . . 50,294,425725,172,780
United States—7.6%75,700 American National Insurance Company . . . . . . 5,437,531
1,094,821 Baxter International, Inc. . . . . . . . . . . . . . . . . . . 65,973,913436 Berkshire Hathaway Inc., Class A(b) . . . . . . . . . . 57,857,200301 Berkshire Hathaway Inc., Class B(b) . . . . . . . . . . 26,548
587,000 ConocoPhillips . . . . . . . . . . . . . . . . . . . . . . . . . 33,564,66049,250 Devon Energy Corporation . . . . . . . . . . . . . . . . 2,979,62576,000 Google Inc., Class A(b) . . . . . . . . . . . . . . . . . . . . 57,342,000
865,835 Johnson & Johnson . . . . . . . . . . . . . . . . . . . . . . 59,664,690918,700 Philip Morris International, Inc. . . . . . . . . . . . . 82,627,878293,500 Phillips 66 . . . . . . . . . . . . . . . . . . . . . . . . . . . . . 13,609,595
379,083,640
Miscellaneous—0.0%(a)
Undisclosed Securities(f) . . . . . . . . . . . . . . . . . . . 417,823
TOTAL COMMON STOCKS(Cost $2,768,311,281) . . . . . . . . . . . . . . . . . . . . 4,257,071,535
SharesValue
(Note 2)
PREFERRED STOCKS—0.2%
Croatia—0.1%166,388 Adris Grupa d.d. . . . . . . . . . . . . . . . . . . . $6,440,919
Germany—0.1%314,700 Villeroy & Boch AG . . . . . . . . . . . . . . . . 3,027,161
TOTAL PREFERRED STOCKS(Cost $12,253,786) . . . . . . . . . . . . . . . . . 9,468,080
REGISTERED INVESTMENT COMPANY—11.4%571,224,628 Dreyfus Government Prime Cash
Management (Cost $571,224,628) . . . . 571,224,628
Face Value
U.S. TREASURY BILL—2.5%$125,000,000 0.136%(e) due 11/01/12(d)
(Cost $124,985,523) . . . . . . . . . . . . . . 124,991,916
TOTAL INVESTMENTS(Cost $3,476,775,218) . . . . . . . . . . . . . . . . . . 99.1% 4,962,756,159
UNREALIZED APPRECIATIONON FORWARD CONTRACTS (Net) . . . . . 0.5 27,325,362
OTHER ASSETSAND LIABILITIES (Net) . . . . . . . . . . . . . . . 0.4 19,791,950
NET ASSETS . . . . . . . . . . . . . . . . . . . . . . . . . . . 100.0% $5,009,873,471
(a) Amount represents less than 0.1% of net assets.(b) Non-income producing security.(c) “Affiliated company” as defined by the Investment Company Act of 1940. See
Note 4.(d) All or a portion of this security has been segregated to cover certain open forward
contracts. At September 30, 2012, liquid assets totaling $168,749,888 have beensegregated to cover such open forward contracts.
(e) Rate represents annualized yield at date of purchase.(f) “Undisclosed Securities” represent issuers, generally smaller capitalization issuers,
where disclosure may be disadvantageous to the Fund’s accumulation or dispositionprogram.
Abbreviations:ADR — American Depositary ReceiptCVA — Certificaaten van aandelen (Share Certificates)
NVDR — Non Voting Depository Receipt
SEE NOTES TO FINANCIAL STATEMENTSII-4
Tweedy, Browne Global Value Fund
Sector DiversificationSeptember 30, 2012 (Unaudited)
Sector DiversificationPercentage ofNet Assets
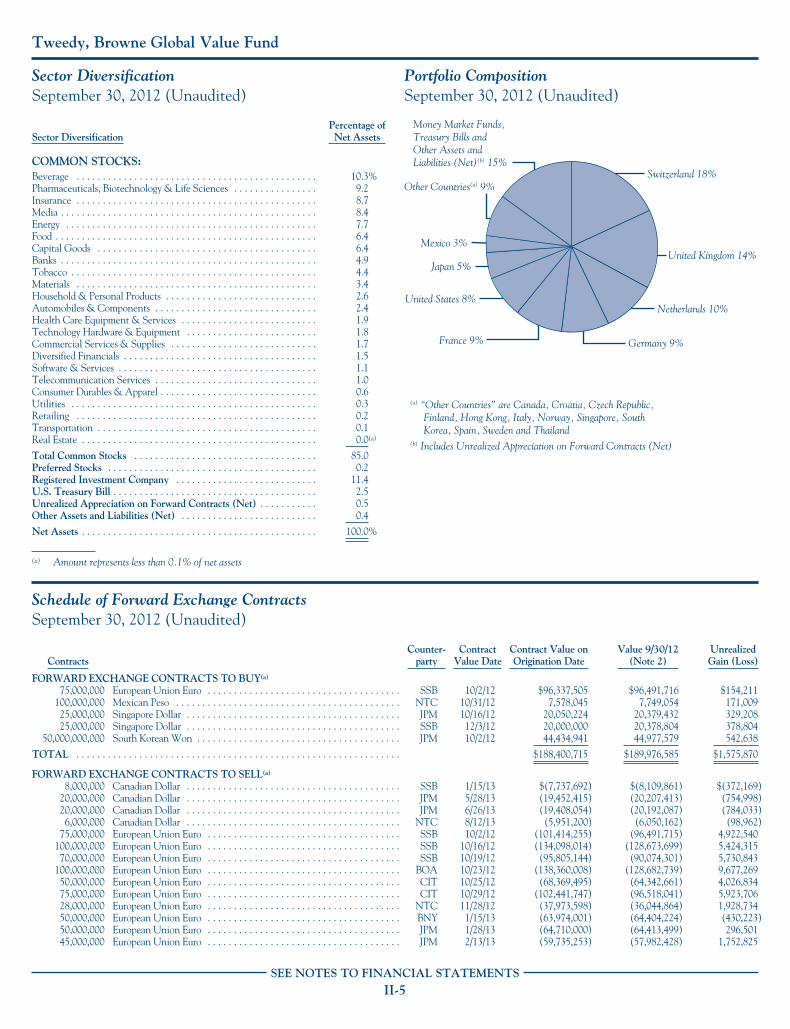
COMMON STOCKS:Beverage . . . . . . . . . . . . . . . . . . . . . . . . . . . . . . . . . . . . . . . . . . . . . . 10.3%Pharmaceuticals, Biotechnology & Life Sciences . . . . . . . . . . . . . . . . 9.2Insurance . . . . . . . . . . . . . . . . . . . . . . . . . . . . . . . . . . . . . . . . . . . . . . 8.7Media . . . . . . . . . . . . . . . . . . . . . . . . . . . . . . . . . . . . . . . . . . . . . . . . . 8.4Energy . . . . . . . . . . . . . . . . . . . . . . . . . . . . . . . . . . . . . . . . . . . . . . . . 7.7Food . . . . . . . . . . . . . . . . . . . . . . . . . . . . . . . . . . . . . . . . . . . . . . . . . . 6.4Capital Goods . . . . . . . . . . . . . . . . . . . . . . . . . . . . . . . . . . . . . . . . . . 6.4Banks . . . . . . . . . . . . . . . . . . . . . . . . . . . . . . . . . . . . . . . . . . . . . . . . . 4.9Tobacco . . . . . . . . . . . . . . . . . . . . . . . . . . . . . . . . . . . . . . . . . . . . . . . 4.4Materials . . . . . . . . . . . . . . . . . . . . . . . . . . . . . . . . . . . . . . . . . . . . . . 3.4Household & Personal Products . . . . . . . . . . . . . . . . . . . . . . . . . . . . . 2.6Automobiles & Components . . . . . . . . . . . . . . . . . . . . . . . . . . . . . . . 2.4Health Care Equipment & Services . . . . . . . . . . . . . . . . . . . . . . . . . . 1.9Technology Hardware & Equipment . . . . . . . . . . . . . . . . . . . . . . . . . 1.8Commercial Services & Supplies . . . . . . . . . . . . . . . . . . . . . . . . . . . . 1.7Diversified Financials . . . . . . . . . . . . . . . . . . . . . . . . . . . . . . . . . . . . . 1.5Software & Services . . . . . . . . . . . . . . . . . . . . . . . . . . . . . . . . . . . . . . 1.1Telecommunication Services . . . . . . . . . . . . . . . . . . . . . . . . . . . . . . . 1.0Consumer Durables & Apparel . . . . . . . . . . . . . . . . . . . . . . . . . . . . . . 0.6Utilities . . . . . . . . . . . . . . . . . . . . . . . . . . . . . . . . . . . . . . . . . . . . . . . 0.3Retailing . . . . . . . . . . . . . . . . . . . . . . . . . . . . . . . . . . . . . . . . . . . . . . 0.2Transportation . . . . . . . . . . . . . . . . . . . . . . . . . . . . . . . . . . . . . . . . . . 0.1Real Estate . . . . . . . . . . . . . . . . . . . . . . . . . . . . . . . . . . . . . . . . . . . . . 0.0(a)
Total Common Stocks . . . . . . . . . . . . . . . . . . . . . . . . . . . . . . . . . . . 85.0Preferred Stocks . . . . . . . . . . . . . . . . . . . . . . . . . . . . . . . . . . . . . . . . 0.2Registered Investment Company . . . . . . . . . . . . . . . . . . . . . . . . . . . 11.4U.S. Treasury Bill . . . . . . . . . . . . . . . . . . . . . . . . . . . . . . . . . . . . . . . 2.5Unrealized Appreciation on Forward Contracts (Net) . . . . . . . . . . . 0.5Other Assets and Liabilities (Net) . . . . . . . . . . . . . . . . . . . . . . . . . . 0.4
Net Assets . . . . . . . . . . . . . . . . . . . . . . . . . . . . . . . . . . . . . . . . . . . . . 100.0%
(a) Amount represents less than 0.1% of net assets
Portfolio CompositionSeptember 30, 2012 (Unaudited)
(a) “Other Countries” are Canada, Croatia, Czech Republic, Finland, Hong Kong, Italy, Norway, Singapore, South Korea, Spain, Sweden and Thailand(b) Includes Unrealized Appreciation on Forward Contracts (Net)
Money Market Funds, Treasury Bills and Other Assets and Liabilities (Net)(b) 15%
Switzerland 18%
United Kingdom 14%
Netherlands 10%
Germany 9%France 9%
Mexico 3%
Japan 5%
United States 8%
Other Countries(a) 9%
Schedule of Forward Exchange ContractsSeptember 30, 2012 (Unaudited)
ContractsCounter-
partyContract
Value DateContract Value onOrigination Date
Value 9/30/12(Note 2)
UnrealizedGain (Loss)
FORWARD EXCHANGE CONTRACTS TO BUY(a)
75,000,000 European Union Euro . . . . . . . . . . . . . . . . . . . . . . . . . . . . . . . . . . . . . SSB 10/2/12 $96,337,505 $96,491,716 $154,211100,000,000 Mexican Peso . . . . . . . . . . . . . . . . . . . . . . . . . . . . . . . . . . . . . . . . . . . NTC 10/31/12 7,578,045 7,749,054 171,00925,000,000 Singapore Dollar . . . . . . . . . . . . . . . . . . . . . . . . . . . . . . . . . . . . . . . . . JPM 10/16/12 20,050,224 20,379,432 329,20825,000,000 Singapore Dollar . . . . . . . . . . . . . . . . . . . . . . . . . . . . . . . . . . . . . . . . . SSB 12/3/12 20,000,000 20,378,804 378,804
50,000,000,000 South Korean Won . . . . . . . . . . . . . . . . . . . . . . . . . . . . . . . . . . . . . . . JPM 10/2/12 44,434,941 44,977,579 542,638
TOTAL . . . . . . . . . . . . . . . . . . . . . . . . . . . . . . . . . . . . . . . . . . . . . . . . . . . . . . . . . . . . . . $188,400,715 $189,976,585 $1,575,870
FORWARD EXCHANGE CONTRACTS TO SELL(a)
8,000,000 Canadian Dollar . . . . . . . . . . . . . . . . . . . . . . . . . . . . . . . . . . . . . . . . . SSB 1/15/13 $(7,737,692) $(8,109,861) $(372,169)20,000,000 Canadian Dollar . . . . . . . . . . . . . . . . . . . . . . . . . . . . . . . . . . . . . . . . . JPM 5/28/13 (19,452,415) (20,207,413) (754,998)20,000,000 Canadian Dollar . . . . . . . . . . . . . . . . . . . . . . . . . . . . . . . . . . . . . . . . . JPM 6/26/13 (19,408,054) (20,192,087) (784,033)6,000,000 Canadian Dollar . . . . . . . . . . . . . . . . . . . . . . . . . . . . . . . . . . . . . . . . . NTC 8/12/13 (5,951,200) (6,050,162) (98,962)
75,000,000 European Union Euro . . . . . . . . . . . . . . . . . . . . . . . . . . . . . . . . . . . . . SSB 10/2/12 (101,414,255) (96,491,715) 4,922,540100,000,000 European Union Euro . . . . . . . . . . . . . . . . . . . . . . . . . . . . . . . . . . . . . SSB 10/16/12 (134,098,014) (128,673,699) 5,424,31570,000,000 European Union Euro . . . . . . . . . . . . . . . . . . . . . . . . . . . . . . . . . . . . . SSB 10/19/12 (95,805,144) (90,074,301) 5,730,843
100,000,000 European Union Euro . . . . . . . . . . . . . . . . . . . . . . . . . . . . . . . . . . . . . BOA 10/23/12 (138,360,008) (128,682,739) 9,677,26950,000,000 European Union Euro . . . . . . . . . . . . . . . . . . . . . . . . . . . . . . . . . . . . . CIT 10/25/12 (68,369,495) (64,342,661) 4,026,83475,000,000 European Union Euro . . . . . . . . . . . . . . . . . . . . . . . . . . . . . . . . . . . . . CIT 10/29/12 (102,441,747) (96,518,041) 5,923,70628,000,000 European Union Euro . . . . . . . . . . . . . . . . . . . . . . . . . . . . . . . . . . . . . NTC 11/28/12 (37,973,598) (36,044,864) 1,928,73450,000,000 European Union Euro . . . . . . . . . . . . . . . . . . . . . . . . . . . . . . . . . . . . . BNY 1/15/13 (63,974,001) (64,404,224) (430,223)50,000,000 European Union Euro . . . . . . . . . . . . . . . . . . . . . . . . . . . . . . . . . . . . . JPM 1/28/13 (64,710,000) (64,413,499) 296,50145,000,000 European Union Euro . . . . . . . . . . . . . . . . . . . . . . . . . . . . . . . . . . . . . JPM 2/13/13 (59,735,253) (57,982,428) 1,752,825
SEE NOTES TO FINANCIAL STATEMENTSII-5

Tweedy, Browne Global Value Fund
Schedule of Forward Exchange ContractsSeptember 30, 2012 (Unaudited)
ContractsCounter-
partyContract
Value DateContract Value onOrigination Date
Value 9/30/12(Note 2)
UnrealizedGain (Loss)
FORWARD EXCHANGE CONTRACTS TO SELL(a) (continued)35,000,000 European Union Euro . . . . . . . . . . . . . . . . . . . . . . . . . . . . . . . . . . . . NTC 2/19/13 $(46,347,352) $(45,100,443) $1,246,90970,000,000 European Union Euro . . . . . . . . . . . . . . . . . . . . . . . . . . . . . . . . . . . . BNY 4/3/13 (93,528,396) (90,244,667) 3,283,72920,000,000 European Union Euro . . . . . . . . . . . . . . . . . . . . . . . . . . . . . . . . . . . . NTC 4/10/13 (26,644,399) (25,786,215) 858,18440,000,000 European Union Euro . . . . . . . . . . . . . . . . . . . . . . . . . . . . . . . . . . . . BNY 8/7/13 (49,471,998) (51,641,936) (2,169,938)50,000,000 European Union Euro . . . . . . . . . . . . . . . . . . . . . . . . . . . . . . . . . . . . SSB 10/1/13 (65,236,500) (64,593,107) 643,39375,000,000 European Union Euro . . . . . . . . . . . . . . . . . . . . . . . . . . . . . . . . . . . . SSB 10/8/13 (96,728,625) (96,897,723) (169,098)30,000,000 Great Britain Pound Sterling . . . . . . . . . . . . . . . . . . . . . . . . . . . . . . . CIT 10/16/12 (46,041,600) (48,441,327) (2,399,727)30,000,000 Great Britain Pound Sterling . . . . . . . . . . . . . . . . . . . . . . . . . . . . . . . CIT 10/23/12 (47,228,100) (48,440,235) (1,212,135)10,000,000 Great Britain Pound Sterling . . . . . . . . . . . . . . . . . . . . . . . . . . . . . . . CIT 11/28/12 (15,595,800) (16,144,886) (549,086)12,000,000 Great Britain Pound Sterling . . . . . . . . . . . . . . . . . . . . . . . . . . . . . . . CIT 12/3/12 (18,586,920) (19,373,683) (786,763)13,000,000 Great Britain Pound Sterling . . . . . . . . . . . . . . . . . . . . . . . . . . . . . . . NTC 2/13/13 (20,576,725) (20,984,335) (407,610)20,000,000 Great Britain Pound Sterling . . . . . . . . . . . . . . . . . . . . . . . . . . . . . . . JPM 2/19/13 (31,556,300) (32,283,040) (726,740)25,000,000 Great Britain Pound Sterling . . . . . . . . . . . . . . . . . . . . . . . . . . . . . . . SSB 3/5/13 (39,470,625) (40,352,170) (881,545)35,000,000 Great Britain Pound Sterling . . . . . . . . . . . . . . . . . . . . . . . . . . . . . . . NTC 4/3/13 (55,689,543) (56,488,149) (798,606)45,000,000 Great Britain Pound Sterling . . . . . . . . . . . . . . . . . . . . . . . . . . . . . . . NTC 4/10/13 (71,869,496) (72,625,982) (756,486)20,000,000 Great Britain Pound Sterling . . . . . . . . . . . . . . . . . . . . . . . . . . . . . . . BNY 4/30/13 (32,142,000) (32,276,134) (134,134)25,000,000 Great Britain Pound Sterling . . . . . . . . . . . . . . . . . . . . . . . . . . . . . . . BNY 5/2/13 (40,200,753) (40,344,908) (144,155)20,000,000 Great Britain Pound Sterling . . . . . . . . . . . . . . . . . . . . . . . . . . . . . . . SSB 8/7/13 (31,348,496) (32,265,838) (917,342)
5,300,000,000 Japanese Yen . . . . . . . . . . . . . . . . . . . . . . . . . . . . . . . . . . . . . . . . . . . NTC 10/22/12 (64,851,637) (68,137,266) (3,285,629)3,550,000,000 Japanese Yen . . . . . . . . . . . . . . . . . . . . . . . . . . . . . . . . . . . . . . . . . . . BNY 11/19/12 (44,023,909) (45,649,656) (1,625,747)4,000,000,000 Japanese Yen . . . . . . . . . . . . . . . . . . . . . . . . . . . . . . . . . . . . . . . . . . . JPM 12/28/12 (50,208,680) (51,465,484) (1,256,804)5,175,000,000 Japanese Yen . . . . . . . . . . . . . . . . . . . . . . . . . . . . . . . . . . . . . . . . . . . JPM 8/30/13 (64,930,991) (66,814,079) (1,883,088)2,000,000,000 Japanese Yen . . . . . . . . . . . . . . . . . . . . . . . . . . . . . . . . . . . . . . . . . . . BNY 9/13/13 (24,542,889) (25,827,611) (1,284,722)
700,000,000 Mexican Peso . . . . . . . . . . . . . . . . . . . . . . . . . . . . . . . . . . . . . . . . . . NTC 10/31/12 (50,530,936) (54,243,383) (3,712,447)500,000,000 Mexican Peso . . . . . . . . . . . . . . . . . . . . . . . . . . . . . . . . . . . . . . . . . . SSB 1/28/13 (36,548,372) (38,413,667) (1,865,295)460,000,000 Mexican Peso . . . . . . . . . . . . . . . . . . . . . . . . . . . . . . . . . . . . . . . . . . BNY 2/19/13 (34,959,721) (35,262,533) (302,812)250,000,000 Mexican Peso . . . . . . . . . . . . . . . . . . . . . . . . . . . . . . . . . . . . . . . . . . NTC 6/10/13 (16,964,680) (18,953,426) (1,988,746)80,000,000 Norwegian Krone . . . . . . . . . . . . . . . . . . . . . . . . . . . . . . . . . . . . . . . BNY 10/29/12 (13,929,274) (13,957,901) (28,627)
150,000,000 Norwegian Krone . . . . . . . . . . . . . . . . . . . . . . . . . . . . . . . . . . . . . . . SSB 1/15/13 (24,654,832) (26,094,404) (1,439,572)125,000,000 Norwegian Krone . . . . . . . . . . . . . . . . . . . . . . . . . . . . . . . . . . . . . . . SSB 2/19/13 (21,405,942) (21,716,882) (310,940)85,000,000 Norwegian Krone . . . . . . . . . . . . . . . . . . . . . . . . . . . . . . . . . . . . . . . BNY 5/21/13 (14,297,248) (14,717,543) (420,295)25,000,000 Singapore Dollar . . . . . . . . . . . . . . . . . . . . . . . . . . . . . . . . . . . . . . . . JPM 10/16/12 (19,297,569) (20,379,433) (1,081,864)50,000,000 Singapore Dollar . . . . . . . . . . . . . . . . . . . . . . . . . . . . . . . . . . . . . . . . SSB 12/3/12 (38,607,057) (40,757,609) (2,150,552)35,000,000 Singapore Dollar . . . . . . . . . . . . . . . . . . . . . . . . . . . . . . . . . . . . . . . . JPM 2/13/13 (28,193,975) (28,534,602) (340,627)12,000,000 Singapore Dollar . . . . . . . . . . . . . . . . . . . . . . . . . . . . . . . . . . . . . . . . JPM 5/21/13 (9,625,411) (9,786,400) (160,989)12,000,000 Singapore Dollar . . . . . . . . . . . . . . . . . . . . . . . . . . . . . . . . . . . . . . . . BNY 6/26/13 (9,471,117) (9,787,750) (316,633)
50,000,000,000 South Korean Won . . . . . . . . . . . . . . . . . . . . . . . . . . . . . . . . . . . . . . JPM 10/2/12 (41,999,160) (44,977,579) (2,978,419)17,000,000,000 South Korean Won . . . . . . . . . . . . . . . . . . . . . . . . . . . . . . . . . . . . . . JPM 10/8/13 (15,017,668) (15,067,897) (50,229)
120,000,000 Swiss Franc . . . . . . . . . . . . . . . . . . . . . . . . . . . . . . . . . . . . . . . . . . . . BOA 10/16/12 (131,485,235) (127,727,501) 3,757,73435,000,000 Swiss Franc . . . . . . . . . . . . . . . . . . . . . . . . . . . . . . . . . . . . . . . . . . . . JPM 10/19/12 (39,198,997) (37,255,841) 1,943,15695,000,000 Swiss Franc . . . . . . . . . . . . . . . . . . . . . . . . . . . . . . . . . . . . . . . . . . . . BNY 10/23/12 (107,399,243) (101,130,188) 6,269,05550,000,000 Swiss Franc . . . . . . . . . . . . . . . . . . . . . . . . . . . . . . . . . . . . . . . . . . . . CIT 10/25/12 (55,940,927) (53,228,308) 2,712,61960,000,000 Swiss Franc . . . . . . . . . . . . . . . . . . . . . . . . . . . . . . . . . . . . . . . . . . . . JPM 10/29/12 (67,461,210) (63,878,546) 3,582,66430,000,000 Swiss Franc . . . . . . . . . . . . . . . . . . . . . . . . . . . . . . . . . . . . . . . . . . . . BNY 11/28/12 (33,145,509) (31,957,169) 1,188,34025,000,000 Swiss Franc . . . . . . . . . . . . . . . . . . . . . . . . . . . . . . . . . . . . . . . . . . . . CIT 12/3/12 (27,445,384) (26,633,598) 811,78640,000,000 Swiss Franc . . . . . . . . . . . . . . . . . . . . . . . . . . . . . . . . . . . . . . . . . . . . NTC 1/15/13 (42,346,863) (42,648,520) (301,657)20,000,000 Swiss Franc . . . . . . . . . . . . . . . . . . . . . . . . . . . . . . . . . . . . . . . . . . . . BNY 2/13/13 (22,062,879) (21,335,409) 727,47050,000,000 Swiss Franc . . . . . . . . . . . . . . . . . . . . . . . . . . . . . . . . . . . . . . . . . . . . NTC 2/19/13 (55,253,503) (53,344,292) 1,909,21115,000,000 Swiss Franc . . . . . . . . . . . . . . . . . . . . . . . . . . . . . . . . . . . . . . . . . . . . NTC 8/7/13 (15,540,499) (16,058,515) (518,016)
800,000,000 Thailand Baht . . . . . . . . . . . . . . . . . . . . . . . . . . . . . . . . . . . . . . . . . . BNY 5/15/13 (25,196,850) (25,618,024) (421,174)375,000,000 Thailand Baht . . . . . . . . . . . . . . . . . . . . . . . . . . . . . . . . . . . . . . . . . . JPM 5/28/13 (11,744,441) (11,999,222) (254,781)500,000,000 Thailand Baht . . . . . . . . . . . . . . . . . . . . . . . . . . . . . . . . . . . . . . . . . . BNY 8/13/13 (15,531,568) (15,926,478) (394,910)
TOTAL . . . . . . . . . . . . . . . . . . . . . . . . . . . . . . . . . . . . . . . . . . . . . . . . . . . . . . . . . . . . . . $(3,021,508,680) $(2,995,759,188) $25,749,492
Unrealized Appreciation on Forward Contracts (Net) . . . . . . . . . . . . . . . . . . . . . . . . . . $27,325,362
(a) Primary risk exposure being hedged against is currency risk.
Counterparty Abbreviations:BOA — Bank of America, NABNY — The Bank of New York MellonCIT — Citibank NAJPM — JPMorgan Chase Bank NA
NTC — Northern Trust CompanySSB — State Street Bank and Trust Company
SEE NOTES TO FINANCIAL STATEMENTSII-6
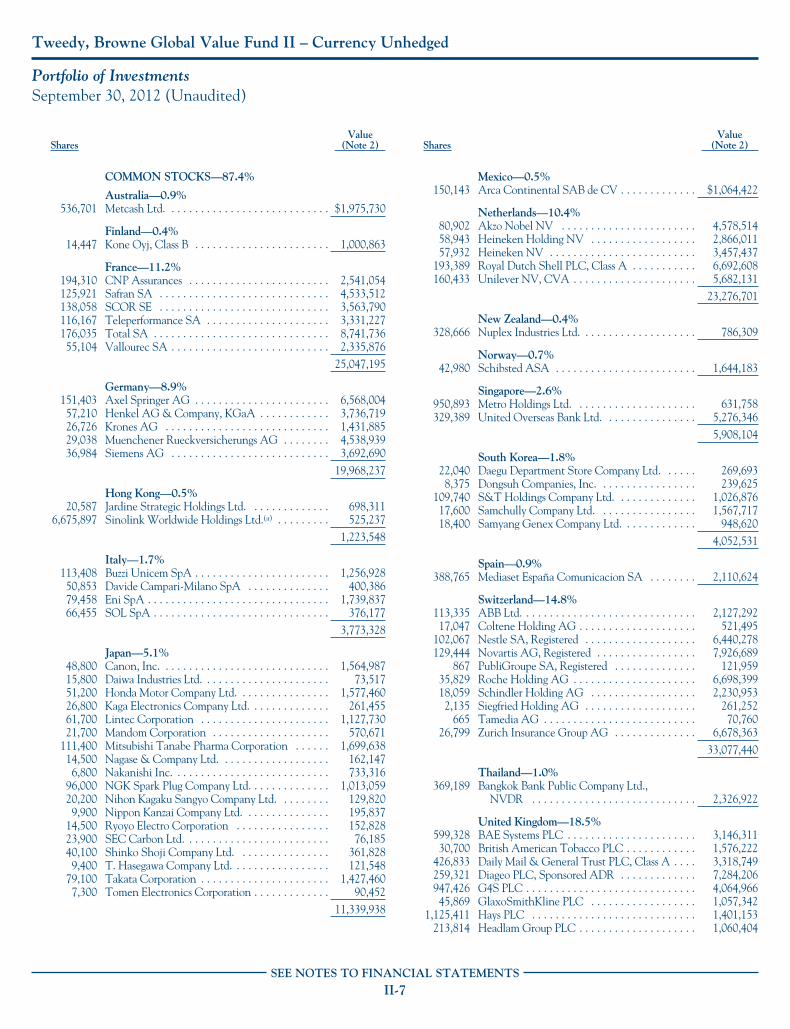
Tweedy, Browne Global Value Fund II – Currency Unhedged
Portfolio of InvestmentsSeptember 30, 2012 (Unaudited)
SharesValue
(Note 2)
COMMON STOCKS—87.4%
Australia—0.9%536,701 Metcash Ltd. . . . . . . . . . . . . . . . . . . . . . . . . . . . $1,975,730
Finland—0.4%14,447 Kone Oyj, Class B . . . . . . . . . . . . . . . . . . . . . . . 1,000,863
France—11.2%194,310 CNP Assurances . . . . . . . . . . . . . . . . . . . . . . . . 2,541,054125,921 Safran SA . . . . . . . . . . . . . . . . . . . . . . . . . . . . . 4,533,512138,058 SCOR SE . . . . . . . . . . . . . . . . . . . . . . . . . . . . . 3,563,790116,167 Teleperformance SA . . . . . . . . . . . . . . . . . . . . . 3,331,227176,035 Total SA . . . . . . . . . . . . . . . . . . . . . . . . . . . . . . 8,741,73655,104 Vallourec SA . . . . . . . . . . . . . . . . . . . . . . . . . . . 2,335,876
25,047,195
Germany—8.9%151,403 Axel Springer AG . . . . . . . . . . . . . . . . . . . . . . . 6,568,00457,210 Henkel AG & Company, KGaA . . . . . . . . . . . . 3,736,71926,726 Krones AG . . . . . . . . . . . . . . . . . . . . . . . . . . . . 1,431,88529,038 Muenchener Rueckversicherungs AG . . . . . . . . 4,538,93936,984 Siemens AG . . . . . . . . . . . . . . . . . . . . . . . . . . . 3,692,690
19,968,237
Hong Kong—0.5%20,587 Jardine Strategic Holdings Ltd. . . . . . . . . . . . . . 698,311
6,675,897 Sinolink Worldwide Holdings Ltd.(a) . . . . . . . . . 525,2371,223,548
Italy—1.7%113,408 Buzzi Unicem SpA . . . . . . . . . . . . . . . . . . . . . . . 1,256,92850,853 Davide Campari-Milano SpA . . . . . . . . . . . . . . 400,38679,458 Eni SpA . . . . . . . . . . . . . . . . . . . . . . . . . . . . . . . 1,739,83766,455 SOL SpA . . . . . . . . . . . . . . . . . . . . . . . . . . . . . . 376,177
3,773,328
Japan—5.1%48,800 Canon, Inc. . . . . . . . . . . . . . . . . . . . . . . . . . . . . 1,564,98715,800 Daiwa Industries Ltd. . . . . . . . . . . . . . . . . . . . . . 73,51751,200 Honda Motor Company Ltd. . . . . . . . . . . . . . . . 1,577,46026,800 Kaga Electronics Company Ltd. . . . . . . . . . . . . . 261,45561,700 Lintec Corporation . . . . . . . . . . . . . . . . . . . . . . 1,127,73021,700 Mandom Corporation . . . . . . . . . . . . . . . . . . . . 570,671
111,400 Mitsubishi Tanabe Pharma Corporation . . . . . . 1,699,63814,500 Nagase & Company Ltd. . . . . . . . . . . . . . . . . . . 162,1476,800 Nakanishi Inc. . . . . . . . . . . . . . . . . . . . . . . . . . . 733,316
96,000 NGK Spark Plug Company Ltd. . . . . . . . . . . . . . 1,013,05920,200 Nihon Kagaku Sangyo Company Ltd. . . . . . . . . 129,8209,900 Nippon Kanzai Company Ltd. . . . . . . . . . . . . . . 195,837
14,500 Ryoyo Electro Corporation . . . . . . . . . . . . . . . . 152,82823,900 SEC Carbon Ltd. . . . . . . . . . . . . . . . . . . . . . . . . 76,18540,100 Shinko Shoji Company Ltd. . . . . . . . . . . . . . . . 361,8289,400 T. Hasegawa Company Ltd. . . . . . . . . . . . . . . . . 121,548
79,100 Takata Corporation . . . . . . . . . . . . . . . . . . . . . . 1,427,4607,300 Tomen Electronics Corporation . . . . . . . . . . . . . 90,452
11,339,938
SharesValue
(Note 2)
Mexico—0.5%150,143 Arca Continental SAB de CV . . . . . . . . . . . . . $1,064,422
Netherlands—10.4%80,902 Akzo Nobel NV . . . . . . . . . . . . . . . . . . . . . . . 4,578,51458,943 Heineken Holding NV . . . . . . . . . . . . . . . . . . 2,866,01157,932 Heineken NV . . . . . . . . . . . . . . . . . . . . . . . . . 3,457,437
193,389 Royal Dutch Shell PLC, Class A . . . . . . . . . . . 6,692,608160,433 Unilever NV, CVA . . . . . . . . . . . . . . . . . . . . . 5,682,131
23,276,701
New Zealand—0.4%328,666 Nuplex Industries Ltd. . . . . . . . . . . . . . . . . . . . 786,309
Norway—0.7%42,980 Schibsted ASA . . . . . . . . . . . . . . . . . . . . . . . . 1,644,183
Singapore—2.6%950,893 Metro Holdings Ltd. . . . . . . . . . . . . . . . . . . . . 631,758329,389 United Overseas Bank Ltd. . . . . . . . . . . . . . . . 5,276,346
5,908,104
South Korea—1.8%22,040 Daegu Department Store Company Ltd. . . . . . 269,6938,375 Dongsuh Companies, Inc. . . . . . . . . . . . . . . . . 239,625
109,740 S&T Holdings Company Ltd. . . . . . . . . . . . . . 1,026,87617,600 Samchully Company Ltd. . . . . . . . . . . . . . . . . 1,567,71718,400 Samyang Genex Company Ltd. . . . . . . . . . . . . 948,620
4,052,531
Spain—0.9%388,765 Mediaset España Comunicacion SA . . . . . . . . 2,110,624
Switzerland—14.8%113,335 ABB Ltd. . . . . . . . . . . . . . . . . . . . . . . . . . . . . . 2,127,29217,047 Coltene Holding AG . . . . . . . . . . . . . . . . . . . . 521,495
102,067 Nestle SA, Registered . . . . . . . . . . . . . . . . . . . 6,440,278129,444 Novartis AG, Registered . . . . . . . . . . . . . . . . . 7,926,689
867 PubliGroupe SA, Registered . . . . . . . . . . . . . . 121,95935,829 Roche Holding AG . . . . . . . . . . . . . . . . . . . . . 6,698,39918,059 Schindler Holding AG . . . . . . . . . . . . . . . . . . 2,230,9532,135 Siegfried Holding AG . . . . . . . . . . . . . . . . . . . 261,252
665 Tamedia AG . . . . . . . . . . . . . . . . . . . . . . . . . . 70,76026,799 Zurich Insurance Group AG . . . . . . . . . . . . . . 6,678,363
33,077,440
Thailand—1.0%369,189 Bangkok Bank Public Company Ltd.,
NVDR . . . . . . . . . . . . . . . . . . . . . . . . . . . . 2,326,922
United Kingdom—18.5%599,328 BAE Systems PLC . . . . . . . . . . . . . . . . . . . . . . 3,146,31130,700 British American Tobacco PLC . . . . . . . . . . . . 1,576,222
426,833 Daily Mail & General Trust PLC, Class A . . . . 3,318,749259,321 Diageo PLC, Sponsored ADR . . . . . . . . . . . . . 7,284,206947,426 G4S PLC . . . . . . . . . . . . . . . . . . . . . . . . . . . . . 4,064,96645,869 GlaxoSmithKline PLC . . . . . . . . . . . . . . . . . . 1,057,342
1,125,411 Hays PLC . . . . . . . . . . . . . . . . . . . . . . . . . . . . 1,401,153213,814 Headlam Group PLC . . . . . . . . . . . . . . . . . . . . 1,060,404
SEE NOTES TO FINANCIAL STATEMENTSII-7

Tweedy, Browne Global Value Fund II – Currency Unhedged
Portfolio of InvestmentsSeptember 30, 2012 (Unaudited)
SharesValue
(Note 2)
United Kingdom (continued)164,569 Home Retail Group PLC . . . . . . . . . . . . . . . . $236,780694,515 HSBC Holdings PLC . . . . . . . . . . . . . . . . . . . 6,429,596107,728 Imperial Tobacco Group PLC . . . . . . . . . . . . 3,987,15771,595 Provident Financial PLC . . . . . . . . . . . . . . . . 1,587,352
361,172 Tesco PLC . . . . . . . . . . . . . . . . . . . . . . . . . . . 1,936,298144,469 TT Electronics PLC . . . . . . . . . . . . . . . . . . . . 335,353
1,405,536 Vodafone Group PLC . . . . . . . . . . . . . . . . . . 3,988,93941,410,828
United States—7.0%11,431 Baxter International, Inc. . . . . . . . . . . . . . . . . 688,83229,399 ConocoPhillips . . . . . . . . . . . . . . . . . . . . . . . 1,681,035
106,257 Johnson & Johnson . . . . . . . . . . . . . . . . . . . . 7,322,1705,598 Mastercard, Inc., Class A . . . . . . . . . . . . . . . . 2,527,385
31,061 Philip Morris International, Inc. . . . . . . . . . . 2,793,62614,700 Phillips 66 . . . . . . . . . . . . . . . . . . . . . . . . . . . 681,639
15,694,687
Miscellaneous—0.1%Undisclosed Security(b) . . . . . . . . . . . . . . . . . 131,134
TOTAL COMMON STOCKS(Cost $188,425,065) . . . . . . . . . . . . . . . . . . . 195,812,724
SharesValue
(Note 2)
PREFERRED STOCKS—0.1%
Germany—0.1%648 KSB AG (Cost $341,191) . . . . . . . . . . . . . . . $311,787
REGISTERED INVESTMENT COMPANY—12.4%27,839,912 Dreyfus Government Prime Cash
Management (Cost $27,839,912) . . . . . . . 27,839,912
TOTAL INVESTMENTS(Cost $216,606,168) . . . . . . . . . . . . . . . . . . . . . 99.9% 223,964,423
OTHER ASSETSAND LIABILITIES (Net) . . . . . . . . . . . . . . . . 0.1 129,142
NET ASSETS . . . . . . . . . . . . . . . . . . . . . . . . . . . . 100.0% $224,093,565
(a) Non-income producing security.(b) “Undisclosed Security” represents an issuer, a generally smaller capitalization
issuer, where disclosure may be disadvantageous to the Fund’s accumulation ordisposition program.
Abbreviations:ADR — American Depositary ReceiptCVA — Certificaaten van aandelen (Share Certificates)
NVDR — Non Voting Depository Receipt
SEE NOTES TO FINANCIAL STATEMENTSII-8

Tweedy, Browne Global Value Fund II – Currency Unhedged
Sector DiversificationSeptember 30, 2012 (Unaudited)
Sector DiversificationPercentage ofNet Assets
COMMON STOCKS:Pharmaceuticals, Biotechnology & Life Sciences . . . . . . . . . . . . . . . . 11.2%Capital Goods . . . . . . . . . . . . . . . . . . . . . . . . . . . . . . . . . . . . . . . . . . 10.1Energy . . . . . . . . . . . . . . . . . . . . . . . . . . . . . . . . . . . . . . . . . . . . . . . . 8.7Insurance . . . . . . . . . . . . . . . . . . . . . . . . . . . . . . . . . . . . . . . . . . . . . . 7.7Beverage . . . . . . . . . . . . . . . . . . . . . . . . . . . . . . . . . . . . . . . . . . . . . . 6.7Banks . . . . . . . . . . . . . . . . . . . . . . . . . . . . . . . . . . . . . . . . . . . . . . . . . 6.3Media . . . . . . . . . . . . . . . . . . . . . . . . . . . . . . . . . . . . . . . . . . . . . . . . . 6.2Food . . . . . . . . . . . . . . . . . . . . . . . . . . . . . . . . . . . . . . . . . . . . . . . . . . 5.8Commercial Services & Supplies . . . . . . . . . . . . . . . . . . . . . . . . . . . . 4.0Materials . . . . . . . . . . . . . . . . . . . . . . . . . . . . . . . . . . . . . . . . . . . . . . 3.8Tobacco . . . . . . . . . . . . . . . . . . . . . . . . . . . . . . . . . . . . . . . . . . . . . . . 3.7Household & Personal Products . . . . . . . . . . . . . . . . . . . . . . . . . . . . . 1.9Automobiles & Components . . . . . . . . . . . . . . . . . . . . . . . . . . . . . . . 1.8Telecommunication Services . . . . . . . . . . . . . . . . . . . . . . . . . . . . . . . 1.8Food & Staples Retailing . . . . . . . . . . . . . . . . . . . . . . . . . . . . . . . . . . 1.8Technology Hardware & Equipment . . . . . . . . . . . . . . . . . . . . . . . . . 1.2Software & Services . . . . . . . . . . . . . . . . . . . . . . . . . . . . . . . . . . . . . . 1.1Retailing . . . . . . . . . . . . . . . . . . . . . . . . . . . . . . . . . . . . . . . . . . . . . . 1.1Health Care Equipment & Services . . . . . . . . . . . . . . . . . . . . . . . . . . 0.9Diversified Financials . . . . . . . . . . . . . . . . . . . . . . . . . . . . . . . . . . . . . 0.7Utilities . . . . . . . . . . . . . . . . . . . . . . . . . . . . . . . . . . . . . . . . . . . . . . . 0.7Real Estate . . . . . . . . . . . . . . . . . . . . . . . . . . . . . . . . . . . . . . . . . . . . . 0.2
Total Common Stocks . . . . . . . . . . . . . . . . . . . . . . . . . . . . . . . . . . . 87.4Preferred Stocks . . . . . . . . . . . . . . . . . . . . . . . . . . . . . . . . . . . . . . . . 0.1Registered Investment Company . . . . . . . . . . . . . . . . . . . . . . . . . . . 12.4Other Assets and Liabilities (Net) . . . . . . . . . . . . . . . . . . . . . . . . . . 0.1
Net Assets . . . . . . . . . . . . . . . . . . . . . . . . . . . . . . . . . . . . . . . . . . . . . 100.0%
Portfolio CompositionSeptember 30, 2012 (Unaudited)
(a) “Other Countries” are Australia, Finland, Hong Kong, Italy, Mexico, New Zealand, Norway, South Korea, Spain and Thailand
Money Market Fundsand Other Assets and Liabilities (Net) 13%
Switzerland 15%
United Kingdom 18%
France 11%
Netherlands 10%Germany 9%
Singapore 3%
Japan 5%
United States 7%
Other Countries(a) 9%
SEE NOTES TO FINANCIAL STATEMENTSII-9
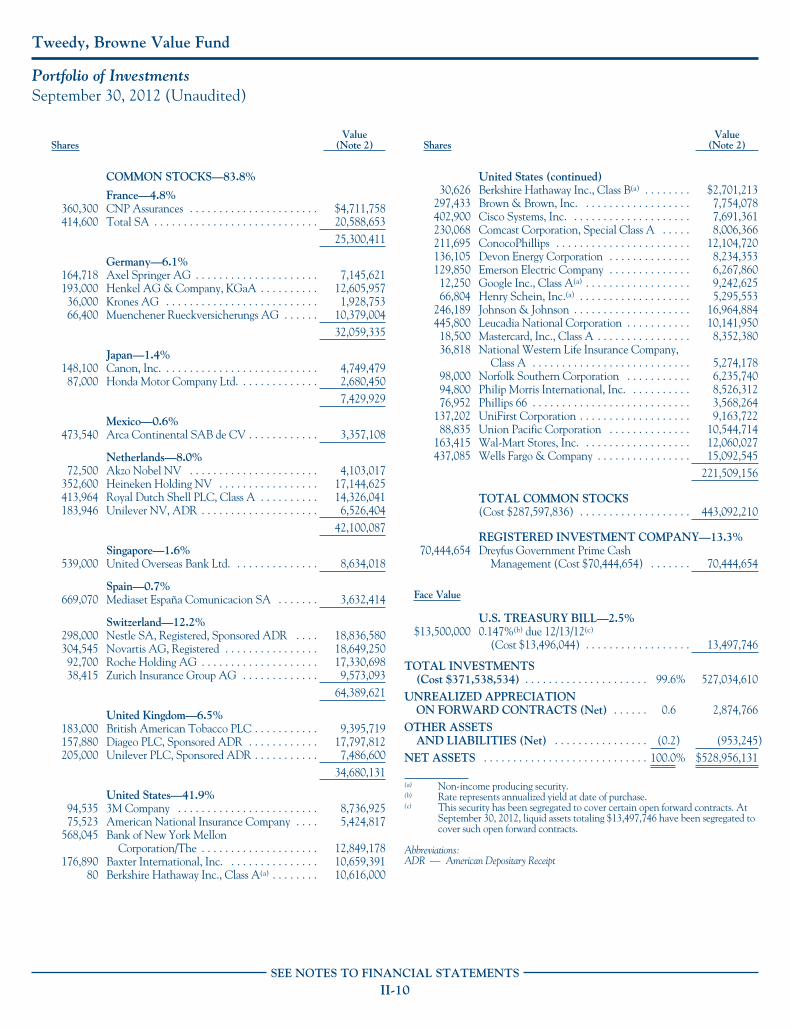
Tweedy, Browne Value Fund
Portfolio of InvestmentsSeptember 30, 2012 (Unaudited)
SharesValue
(Note 2)
COMMON STOCKS—83.8%
France—4.8%360,300 CNP Assurances . . . . . . . . . . . . . . . . . . . . . . $4,711,758414,600 Total SA . . . . . . . . . . . . . . . . . . . . . . . . . . . . 20,588,653
25,300,411
Germany—6.1%164,718 Axel Springer AG . . . . . . . . . . . . . . . . . . . . . 7,145,621193,000 Henkel AG & Company, KGaA . . . . . . . . . . 12,605,95736,000 Krones AG . . . . . . . . . . . . . . . . . . . . . . . . . . 1,928,75366,400 Muenchener Rueckversicherungs AG . . . . . . 10,379,004
32,059,335
Japan—1.4%148,100 Canon, Inc. . . . . . . . . . . . . . . . . . . . . . . . . . . 4,749,47987,000 Honda Motor Company Ltd. . . . . . . . . . . . . . 2,680,450
7,429,929
Mexico—0.6%473,540 Arca Continental SAB de CV . . . . . . . . . . . . 3,357,108
Netherlands—8.0%72,500 Akzo Nobel NV . . . . . . . . . . . . . . . . . . . . . . 4,103,017
352,600 Heineken Holding NV . . . . . . . . . . . . . . . . . 17,144,625413,964 Royal Dutch Shell PLC, Class A . . . . . . . . . . 14,326,041183,946 Unilever NV, ADR . . . . . . . . . . . . . . . . . . . . 6,526,404
42,100,087
Singapore—1.6%539,000 United Overseas Bank Ltd. . . . . . . . . . . . . . . 8,634,018
Spain—0.7%669,070 Mediaset España Comunicacion SA . . . . . . . 3,632,414
Switzerland—12.2%298,000 Nestle SA, Registered, Sponsored ADR . . . . 18,836,580304,545 Novartis AG, Registered . . . . . . . . . . . . . . . . 18,649,25092,700 Roche Holding AG . . . . . . . . . . . . . . . . . . . . 17,330,69838,415 Zurich Insurance Group AG . . . . . . . . . . . . . 9,573,093
64,389,621
United Kingdom—6.5%183,000 British American Tobacco PLC . . . . . . . . . . . 9,395,719157,880 Diageo PLC, Sponsored ADR . . . . . . . . . . . . 17,797,812205,000 Unilever PLC, Sponsored ADR . . . . . . . . . . . 7,486,600
34,680,131
United States—41.9%94,535 3M Company . . . . . . . . . . . . . . . . . . . . . . . . 8,736,92575,523 American National Insurance Company . . . . 5,424,817
568,045 Bank of New York MellonCorporation/The . . . . . . . . . . . . . . . . . . . . 12,849,178
176,890 Baxter International, Inc. . . . . . . . . . . . . . . . 10,659,39180 Berkshire Hathaway Inc., Class A(a) . . . . . . . . 10,616,000
SharesValue
(Note 2)
United States (continued)30,626 Berkshire Hathaway Inc., Class B(a) . . . . . . . . $2,701,213
297,433 Brown & Brown, Inc. . . . . . . . . . . . . . . . . . . 7,754,078402,900 Cisco Systems, Inc. . . . . . . . . . . . . . . . . . . . . 7,691,361230,068 Comcast Corporation, Special Class A . . . . . 8,006,366211,695 ConocoPhillips . . . . . . . . . . . . . . . . . . . . . . . 12,104,720136,105 Devon Energy Corporation . . . . . . . . . . . . . . 8,234,353129,850 Emerson Electric Company . . . . . . . . . . . . . . 6,267,86012,250 Google Inc., Class A(a) . . . . . . . . . . . . . . . . . . 9,242,62566,804 Henry Schein, Inc.(a) . . . . . . . . . . . . . . . . . . . 5,295,553
246,189 Johnson & Johnson . . . . . . . . . . . . . . . . . . . . 16,964,884445,800 Leucadia National Corporation . . . . . . . . . . . 10,141,95018,500 Mastercard, Inc., Class A . . . . . . . . . . . . . . . . 8,352,38036,818 National Western Life Insurance Company,
Class A . . . . . . . . . . . . . . . . . . . . . . . . . . . 5,274,17898,000 Norfolk Southern Corporation . . . . . . . . . . . 6,235,74094,800 Philip Morris International, Inc. . . . . . . . . . . 8,526,31276,952 Phillips 66 . . . . . . . . . . . . . . . . . . . . . . . . . . . 3,568,264
137,202 UniFirst Corporation . . . . . . . . . . . . . . . . . . . 9,163,72288,835 Union Pacific Corporation . . . . . . . . . . . . . . 10,544,714
163,415 Wal-Mart Stores, Inc. . . . . . . . . . . . . . . . . . . 12,060,027437,085 Wells Fargo & Company . . . . . . . . . . . . . . . . 15,092,545
221,509,156
TOTAL COMMON STOCKS(Cost $287,597,836) . . . . . . . . . . . . . . . . . . . 443,092,210
REGISTERED INVESTMENT COMPANY—13.3%70,444,654 Dreyfus Government Prime Cash
Management (Cost $70,444,654) . . . . . . . 70,444,654
Face Value
U.S. TREASURY BILL—2.5%$13,500,000 0.147%(b) due 12/13/12(c)
(Cost $13,496,044) . . . . . . . . . . . . . . . . . . 13,497,746
TOTAL INVESTMENTS(Cost $371,538,534) . . . . . . . . . . . . . . . . . . . . . 99.6% 527,034,610
UNREALIZED APPRECIATIONON FORWARD CONTRACTS (Net) . . . . . . 0.6 2,874,766
OTHER ASSETSAND LIABILITIES (Net) . . . . . . . . . . . . . . . . (0.2) (953,245)
NET ASSETS . . . . . . . . . . . . . . . . . . . . . . . . . . . . 100.0% $528,956,131
(a) Non-income producing security.(b) Rate represents annualized yield at date of purchase.(c) This security has been segregated to cover certain open forward contracts. At
September 30, 2012, liquid assets totaling $13,497,746 have been segregated tocover such open forward contracts.
Abbreviations:ADR — American Depositary Receipt
SEE NOTES TO FINANCIAL STATEMENTSII-10
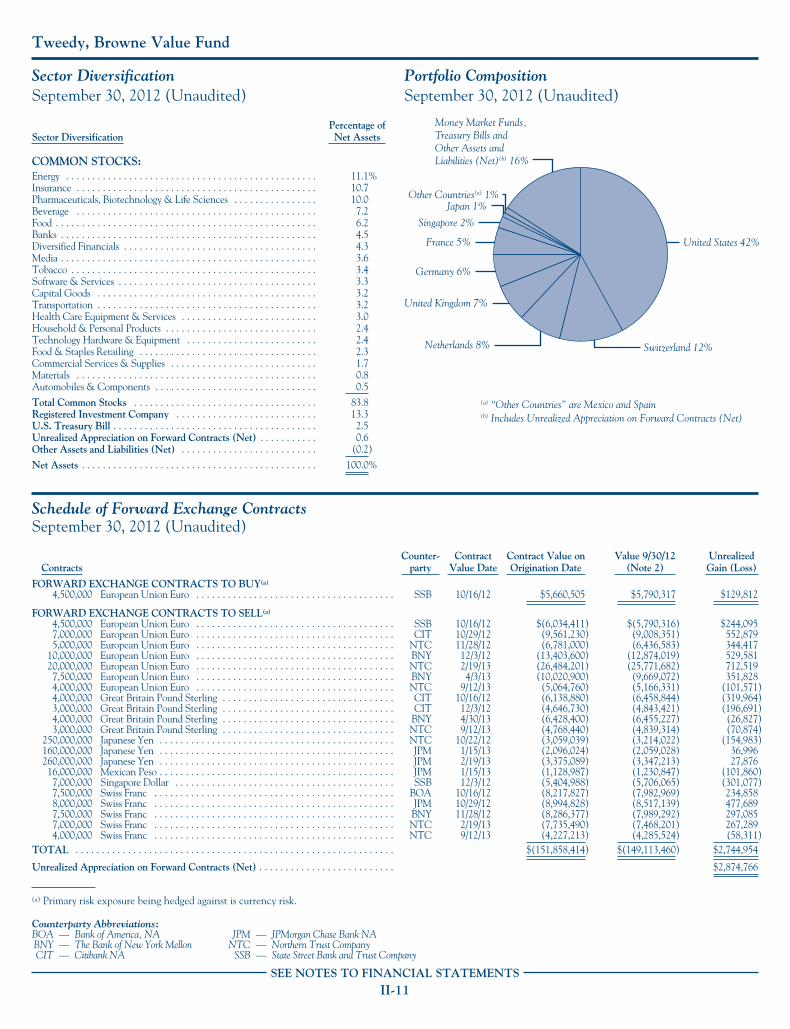
Tweedy, Browne Value Fund
Sector DiversificationSeptember 30, 2012 (Unaudited)
Sector DiversificationPercentage ofNet Assets
COMMON STOCKS:Energy . . . . . . . . . . . . . . . . . . . . . . . . . . . . . . . . . . . . . . . . . . . . . . . . 11.1%Insurance . . . . . . . . . . . . . . . . . . . . . . . . . . . . . . . . . . . . . . . . . . . . . . 10.7Pharmaceuticals, Biotechnology & Life Sciences . . . . . . . . . . . . . . . . 10.0Beverage . . . . . . . . . . . . . . . . . . . . . . . . . . . . . . . . . . . . . . . . . . . . . . 7.2Food . . . . . . . . . . . . . . . . . . . . . . . . . . . . . . . . . . . . . . . . . . . . . . . . . . 6.2Banks . . . . . . . . . . . . . . . . . . . . . . . . . . . . . . . . . . . . . . . . . . . . . . . . . 4.5Diversified Financials . . . . . . . . . . . . . . . . . . . . . . . . . . . . . . . . . . . . . 4.3Media . . . . . . . . . . . . . . . . . . . . . . . . . . . . . . . . . . . . . . . . . . . . . . . . . 3.6Tobacco . . . . . . . . . . . . . . . . . . . . . . . . . . . . . . . . . . . . . . . . . . . . . . . 3.4Software & Services . . . . . . . . . . . . . . . . . . . . . . . . . . . . . . . . . . . . . . 3.3Capital Goods . . . . . . . . . . . . . . . . . . . . . . . . . . . . . . . . . . . . . . . . . . 3.2Transportation . . . . . . . . . . . . . . . . . . . . . . . . . . . . . . . . . . . . . . . . . . 3.2Health Care Equipment & Services . . . . . . . . . . . . . . . . . . . . . . . . . . 3.0Household & Personal Products . . . . . . . . . . . . . . . . . . . . . . . . . . . . . 2.4Technology Hardware & Equipment . . . . . . . . . . . . . . . . . . . . . . . . . 2.4Food & Staples Retailing . . . . . . . . . . . . . . . . . . . . . . . . . . . . . . . . . . 2.3Commercial Services & Supplies . . . . . . . . . . . . . . . . . . . . . . . . . . . . 1.7Materials . . . . . . . . . . . . . . . . . . . . . . . . . . . . . . . . . . . . . . . . . . . . . . 0.8Automobiles & Components . . . . . . . . . . . . . . . . . . . . . . . . . . . . . . . 0.5
Total Common Stocks . . . . . . . . . . . . . . . . . . . . . . . . . . . . . . . . . . . 83.8Registered Investment Company . . . . . . . . . . . . . . . . . . . . . . . . . . . 13.3U.S. Treasury Bill . . . . . . . . . . . . . . . . . . . . . . . . . . . . . . . . . . . . . . . 2.5Unrealized Appreciation on Forward Contracts (Net) . . . . . . . . . . . 0.6Other Assets and Liabilities (Net) . . . . . . . . . . . . . . . . . . . . . . . . . . (0.2)
Net Assets . . . . . . . . . . . . . . . . . . . . . . . . . . . . . . . . . . . . . . . . . . . . . 100.0%
Portfolio CompositionSeptember 30, 2012 (Unaudited)
Money Market Funds,Treasury Bills and Other Assets and Liabilities (Net)(b) 16%
United States 42%
(a) “Other Countries” are Mexico and Spain(b) Includes Unrealized Appreciation on Forward Contracts (Net)
United Kingdom 7%
Switzerland 12%
Other Countries(a) 1%
Singapore 2%
Netherlands 8%
Japan 1%
Germany 6%
France 5%
Schedule of Forward Exchange ContractsSeptember 30, 2012 (Unaudited)
ContractsCounter-
partyContract
Value DateContract Value onOrigination Date
Value 9/30/12(Note 2)
UnrealizedGain (Loss)
FORWARD EXCHANGE CONTRACTS TO BUY(a)
4,500,000 European Union Euro . . . . . . . . . . . . . . . . . . . . . . . . . . . . . . . . . . . . . . SSB 10/16/12 $5,660,505 $5,790,317 $129,812
FORWARD EXCHANGE CONTRACTS TO SELL(a)
4,500,000 European Union Euro . . . . . . . . . . . . . . . . . . . . . . . . . . . . . . . . . . . . . . SSB 10/16/12 $(6,034,411) $(5,790,316) $244,0957,000,000 European Union Euro . . . . . . . . . . . . . . . . . . . . . . . . . . . . . . . . . . . . . . CIT 10/29/12 (9,561,230) (9,008,351) 552,8795,000,000 European Union Euro . . . . . . . . . . . . . . . . . . . . . . . . . . . . . . . . . . . . . . NTC 11/28/12 (6,781,000) (6,436,583) 344,417
10,000,000 European Union Euro . . . . . . . . . . . . . . . . . . . . . . . . . . . . . . . . . . . . . . BNY 12/3/12 (13,403,600) (12,874,019) 529,58120,000,000 European Union Euro . . . . . . . . . . . . . . . . . . . . . . . . . . . . . . . . . . . . . . NTC 2/19/13 (26,484,201) (25,771,682) 712,5197,500,000 European Union Euro . . . . . . . . . . . . . . . . . . . . . . . . . . . . . . . . . . . . . . BNY 4/3/13 (10,020,900) (9,669,072) 351,8284,000,000 European Union Euro . . . . . . . . . . . . . . . . . . . . . . . . . . . . . . . . . . . . . . NTC 9/12/13 (5,064,760) (5,166,331) (101,571)4,000,000 Great Britain Pound Sterling . . . . . . . . . . . . . . . . . . . . . . . . . . . . . . . . . CIT 10/16/12 (6,138,880) (6,458,844) (319,964)3,000,000 Great Britain Pound Sterling . . . . . . . . . . . . . . . . . . . . . . . . . . . . . . . . . CIT 12/3/12 (4,646,730) (4,843,421) (196,691)4,000,000 Great Britain Pound Sterling . . . . . . . . . . . . . . . . . . . . . . . . . . . . . . . . . BNY 4/30/13 (6,428,400) (6,455,227) (26,827)3,000,000 Great Britain Pound Sterling . . . . . . . . . . . . . . . . . . . . . . . . . . . . . . . . . NTC 9/12/13 (4,768,440) (4,839,314) (70,874)
250,000,000 Japanese Yen . . . . . . . . . . . . . . . . . . . . . . . . . . . . . . . . . . . . . . . . . . . . . NTC 10/22/12 (3,059,039) (3,214,022) (154,983)160,000,000 Japanese Yen . . . . . . . . . . . . . . . . . . . . . . . . . . . . . . . . . . . . . . . . . . . . . JPM 1/15/13 (2,096,024) (2,059,028) 36,996260,000,000 Japanese Yen . . . . . . . . . . . . . . . . . . . . . . . . . . . . . . . . . . . . . . . . . . . . . JPM 2/19/13 (3,375,089) (3,347,213) 27,87616,000,000 Mexican Peso . . . . . . . . . . . . . . . . . . . . . . . . . . . . . . . . . . . . . . . . . . . . . JPM 1/15/13 (1,128,987) (1,230,847) (101,860)7,000,000 Singapore Dollar . . . . . . . . . . . . . . . . . . . . . . . . . . . . . . . . . . . . . . . . . . SSB 12/3/12 (5,404,988) (5,706,065) (301,077)7,500,000 Swiss Franc . . . . . . . . . . . . . . . . . . . . . . . . . . . . . . . . . . . . . . . . . . . . . . BOA 10/16/12 (8,217,827) (7,982,969) 234,8588,000,000 Swiss Franc . . . . . . . . . . . . . . . . . . . . . . . . . . . . . . . . . . . . . . . . . . . . . . JPM 10/29/12 (8,994,828) (8,517,139) 477,6897,500,000 Swiss Franc . . . . . . . . . . . . . . . . . . . . . . . . . . . . . . . . . . . . . . . . . . . . . . BNY 11/28/12 (8,286,377) (7,989,292) 297,0857,000,000 Swiss Franc . . . . . . . . . . . . . . . . . . . . . . . . . . . . . . . . . . . . . . . . . . . . . . NTC 2/19/13 (7,735,490) (7,468,201) 267,2894,000,000 Swiss Franc . . . . . . . . . . . . . . . . . . . . . . . . . . . . . . . . . . . . . . . . . . . . . . NTC 9/12/13 (4,227,213) (4,285,524) (58,311)
TOTAL . . . . . . . . . . . . . . . . . . . . . . . . . . . . . . . . . . . . . . . . . . . . . . . . . . . . . . . . . . . . . $(151,858,414) $(149,113,460) $2,744,954
Unrealized Appreciation on Forward Contracts (Net) . . . . . . . . . . . . . . . . . . . . . . . . . . $2,874,766
(a) Primary risk exposure being hedged against is currency risk.
Counterparty Abbreviations:BOA — Bank of America, NA JPM — JPMorgan Chase Bank NABNY — The Bank of New York Mellon NTC — Northern Trust CompanyCIT — Citibank NA SSB — State Street Bank and Trust Company
SEE NOTES TO FINANCIAL STATEMENTSII-11

Tweedy, Browne Worldwide High Dividend Yield Value Fund
Portfolio of InvestmentsSeptember 30, 2012 (Unaudited)
SharesValue
(Note 2)
COMMON STOCKS—81.5%
Australia—1.4%2,310,000 Metcash Ltd. . . . . . . . . . . . . . . . . . . . . . . . . . $8,503,686
Canada—1.3%215,000 IGM Financial, Inc. . . . . . . . . . . . . . . . . . . . . 8,388,485
France—7.1%458,685 CNP Assurances . . . . . . . . . . . . . . . . . . . . . . 5,998,370508,900 SCOR SE . . . . . . . . . . . . . . . . . . . . . . . . . . . 13,136,599506,800 Total SA . . . . . . . . . . . . . . . . . . . . . . . . . . . . 25,167,220
44,302,189
Germany—7.8%375,400 Axel Springer AG . . . . . . . . . . . . . . . . . . . . . 16,285,203107,000 Muenchener Rueckversicherungs AG . . . . . . 16,725,203160,500 Siemens AG . . . . . . . . . . . . . . . . . . . . . . . . . 16,025,222
49,035,628
Italy—1.6%457,200 Eni SpA . . . . . . . . . . . . . . . . . . . . . . . . . . . . . 10,010,992
Mexico—0.5%476,115 Arca Continental SAB de CV . . . . . . . . . . . . 3,375,363
Netherlands—8.2%222,000 Akzo Nobel NV . . . . . . . . . . . . . . . . . . . . . . . 12,563,721638,000 Royal Dutch Shell PLC, Class A . . . . . . . . . . 22,079,249479,000 Unilever NV, CVA . . . . . . . . . . . . . . . . . . . . 16,964,968
51,607,938
Singapore—2.7%1,037,000 United Overseas Bank Ltd. . . . . . . . . . . . . . . 16,611,274
Switzerland—13.1%685,200 ABB Ltd. . . . . . . . . . . . . . . . . . . . . . . . . . . . . 12,861,170221,000 Nestle SA, Registered . . . . . . . . . . . . . . . . . . 13,944,775389,200 Novartis AG, Registered . . . . . . . . . . . . . . . . 23,833,22093,000 Roche Holding AG . . . . . . . . . . . . . . . . . . . . 17,386,78456,450 Zurich Insurance Group AG . . . . . . . . . . . . . 14,067,450
82,093,399
Thailand—0.4%386,200 Bangkok Bank Public Company Ltd.,
NVDR . . . . . . . . . . . . . . . . . . . . . . . . . . . . 2,434,139
United Kingdom—22.1%2,235,700 BAE Systems PLC . . . . . . . . . . . . . . . . . . . . . 11,736,824
215,300 British American Tobacco PLC . . . . . . . . . . . 11,054,089856,700 Daily Mail & General Trust PLC, Class A . . . 6,661,088510,700 Diageo PLC, Sponsored ADR . . . . . . . . . . . . 14,345,324
3,798,000 G4S PLC . . . . . . . . . . . . . . . . . . . . . . . . . . . . 16,295,459139,505 GlaxoSmithKline PLC . . . . . . . . . . . . . . . . . 3,215,777
SharesValue
(Note 2)
United Kingdom (continued)2,253,000 HSBC Holdings PLC . . . . . . . . . . . . . . . . . . . $20,857,546
367,212 Imperial Tobacco Group PLC . . . . . . . . . . . . 13,591,005371,400 Pearson PLC . . . . . . . . . . . . . . . . . . . . . . . . . 7,256,837264,615 Provident Financial PLC . . . . . . . . . . . . . . . . 5,866,851
1,697,000 Tesco PLC . . . . . . . . . . . . . . . . . . . . . . . . . . . 9,097,8766,647,000 Vodafone Group PLC . . . . . . . . . . . . . . . . . . 18,864,318
138,842,994
United States—15.3%61,000 Arthur J. Gallagher & Company . . . . . . . . . . 2,185,020
100,700 Automatic Data Processing, Inc. . . . . . . . . . . 5,907,062221,100 ConocoPhillips . . . . . . . . . . . . . . . . . . . . . . . 12,642,498247,700 Emerson Electric Company . . . . . . . . . . . . . . 11,956,479307,000 Exelon Corporation . . . . . . . . . . . . . . . . . . . . 10,923,060313,625 Johnson & Johnson . . . . . . . . . . . . . . . . . . . . 21,611,89949,600 Kimberly-Clark Corporation . . . . . . . . . . . . . 4,254,68850,970 Lockheed Martin Corporation . . . . . . . . . . . . 4,759,579
111,405 Philip Morris International, Inc. . . . . . . . . . . 10,019,76674,000 Phillips 66 . . . . . . . . . . . . . . . . . . . . . . . . . . . 3,431,380
270,500 Sysco Corporation . . . . . . . . . . . . . . . . . . . . . 8,458,53596,149,966
TOTAL COMMON STOCKS(Cost $451,859,379) . . . . . . . . . . . . . . . . . . . 511,356,053
REGISTERED INVESTMENT COMPANY—16.5%103,348,189 Dreyfus Government Prime Cash
Management (Cost $103,348,189) . . . . . . . 103,348,189
Face Value
U.S. TREASURY BILLS—2.8%$6,000,000 0.147%(a) due 12/13/12 . . . . . . . . . . . . . . . . . 5,998,99812,000,000 0.910%(a) due 11/15/12 . . . . . . . . . . . . . . . . . 11,998,801
TOTAL U.S. TREASURY BILLS(Cost $17,996,900) . . . . . . . . . . . . . . . . . . . . 17,997,799
TOTAL INVESTMENTS(Cost 573,204,468) . . . . . . . . . . . . . . . . . . . . . . 100.8% 632,702,041
OTHER ASSETSAND LIABILITIES (Net) . . . . . . . . . . . . . . . . (0.8) (5,244,298)
NET ASSETS . . . . . . . . . . . . . . . . . . . . . . . . . . . . 100.0% $627,457,743
(a) Rate represents annualized yield at date of purchase.
Abbreviations:ADR — American Depositary ReceiptCVA — Certificaaten van aandelen (Share Certificates)
NVDR — Non Voting Depository Receipt
SEE NOTES TO FINANCIAL STATEMENTSII-12
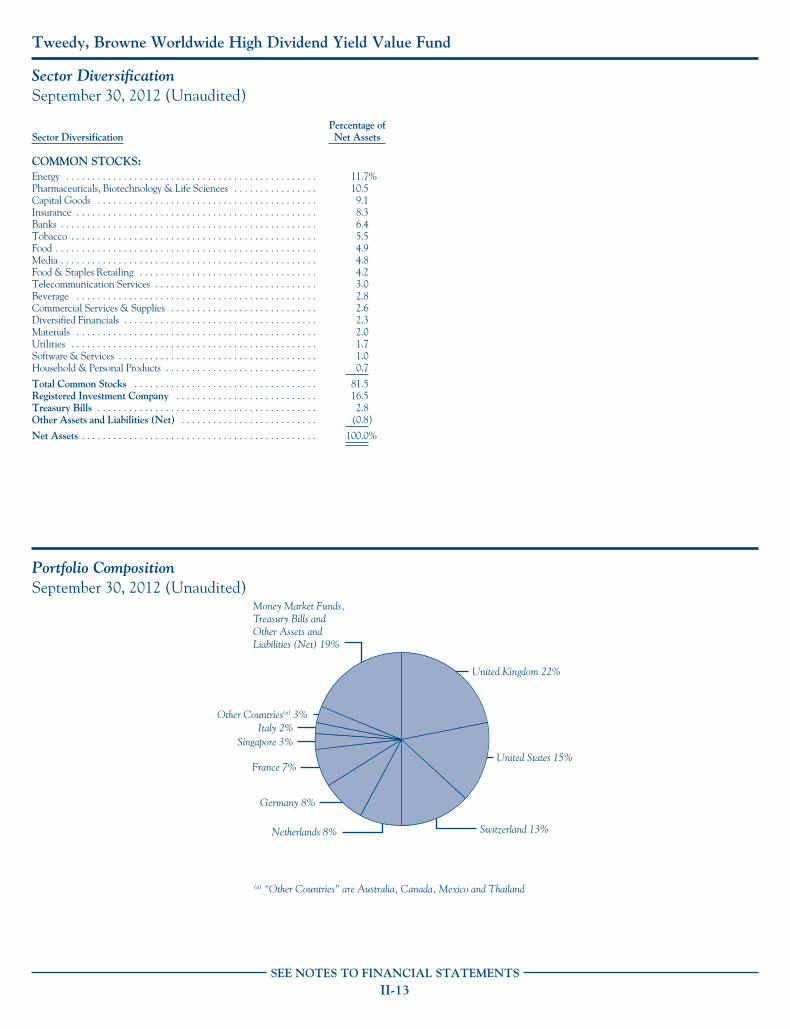
Tweedy, Browne Worldwide High Dividend Yield Value Fund
Sector DiversificationSeptember 30, 2012 (Unaudited)
Sector DiversificationPercentage ofNet Assets
COMMON STOCKS:Energy . . . . . . . . . . . . . . . . . . . . . . . . . . . . . . . . . . . . . . . . . . . . . . . . 11.7%Pharmaceuticals, Biotechnology & Life Sciences . . . . . . . . . . . . . . . . 10.5Capital Goods . . . . . . . . . . . . . . . . . . . . . . . . . . . . . . . . . . . . . . . . . . 9.1Insurance . . . . . . . . . . . . . . . . . . . . . . . . . . . . . . . . . . . . . . . . . . . . . . 8.3Banks . . . . . . . . . . . . . . . . . . . . . . . . . . . . . . . . . . . . . . . . . . . . . . . . . 6.4Tobacco . . . . . . . . . . . . . . . . . . . . . . . . . . . . . . . . . . . . . . . . . . . . . . . 5.5Food . . . . . . . . . . . . . . . . . . . . . . . . . . . . . . . . . . . . . . . . . . . . . . . . . . 4.9Media . . . . . . . . . . . . . . . . . . . . . . . . . . . . . . . . . . . . . . . . . . . . . . . . . 4.8Food & Staples Retailing . . . . . . . . . . . . . . . . . . . . . . . . . . . . . . . . . . 4.2Telecommunication Services . . . . . . . . . . . . . . . . . . . . . . . . . . . . . . . 3.0Beverage . . . . . . . . . . . . . . . . . . . . . . . . . . . . . . . . . . . . . . . . . . . . . . 2.8Commercial Services & Supplies . . . . . . . . . . . . . . . . . . . . . . . . . . . . 2.6Diversified Financials . . . . . . . . . . . . . . . . . . . . . . . . . . . . . . . . . . . . . 2.3Materials . . . . . . . . . . . . . . . . . . . . . . . . . . . . . . . . . . . . . . . . . . . . . . 2.0Utilities . . . . . . . . . . . . . . . . . . . . . . . . . . . . . . . . . . . . . . . . . . . . . . . 1.7Software & Services . . . . . . . . . . . . . . . . . . . . . . . . . . . . . . . . . . . . . . 1.0Household & Personal Products . . . . . . . . . . . . . . . . . . . . . . . . . . . . . 0.7
Total Common Stocks . . . . . . . . . . . . . . . . . . . . . . . . . . . . . . . . . . . 81.5Registered Investment Company . . . . . . . . . . . . . . . . . . . . . . . . . . . 16.5Treasury Bills . . . . . . . . . . . . . . . . . . . . . . . . . . . . . . . . . . . . . . . . . . 2.8Other Assets and Liabilities (Net) . . . . . . . . . . . . . . . . . . . . . . . . . . (0.8)
Net Assets . . . . . . . . . . . . . . . . . . . . . . . . . . . . . . . . . . . . . . . . . . . . . 100.0%
Portfolio CompositionSeptember 30, 2012 (Unaudited)
Money Market Funds,Treasury Bills andOther Assets andLiabilities (Net) 19%
(a) “Other Countries” are Australia, Canada, Mexico and Thailand
United Kingdom 22%
United States 15%
Switzerland 13%Netherlands 8%
Germany 8%
France 7%
Singapore 3%Italy 2%
Other Countries(a) 3%
SEE NOTES TO FINANCIAL STATEMENTSII-13

TWEEDY, BROWNE FUND INC.
Statements of Assets and LiabilitiesSeptember 30, 2012 (Unaudited)
Global ValueFund
Global ValueFund II –CurrencyUnhedged
ValueFund
Worldwide HighDividend Yield
Value Fund
ASSETSInvestments, at cost . . . . . . . . . . . . . . . . . . . . . . . . . . . . . . . . . $3,476,775,218 $216,606,168 $371,538,534 $573,204,468
Investments, at value (Note 2) . . . . . . . . . . . . . . . . . . . . . . . . . $4,962,756,159 $223,964,423 $527,034,610 $632,702,041Foreign currency(a) . . . . . . . . . . . . . . . . . . . . . . . . . . . . . . . . . . 760 14 4 30Dividends and interest receivable . . . . . . . . . . . . . . . . . . . . . . . 7,994,245 442,691 508,105 970,354Receivable for investment securities sold . . . . . . . . . . . . . . . . . . 469,159 — — —Recoverable foreign withholding taxes . . . . . . . . . . . . . . . . . . . 16,041,390 422,357 933,357 750,240Receivable for Fund shares sold . . . . . . . . . . . . . . . . . . . . . . . . . 5,715,852 174,913 304,712 1,492,801Unrealized appreciation of forward exchange contracts
(Note 2) . . . . . . . . . . . . . . . . . . . . . . . . . . . . . . . . . . . . . . . . 70,193,687 — 4,206,924 —Prepaid expense . . . . . . . . . . . . . . . . . . . . . . . . . . . . . . . . . . . . 170,191 10,262 16,928 18,980
Total Assets . . . . . . . . . . . . . . . . . . . . . . . . . . . . . . . . . . . . . . . . $5,063,341,443 $225,014,660 $533,004,640 $635,934,446
LIABILITIESUnrealized depreciation of forward exchange contracts
(Note 2) . . . . . . . . . . . . . . . . . . . . . . . . . . . . . . . . . . . . . . . . $42,868,325 $ — $1,332,158 $ —Payable for investment securities purchased . . . . . . . . . . . . . . . — — — 5,998,332Payable for Fund shares redeemed . . . . . . . . . . . . . . . . . . . . . . . 2,676,349 603,060 2,210,870 1,903,986Investment advisory fee payable (Note 3) . . . . . . . . . . . . . . . . . 3,268,726 139,072 342,747 403,804Custodian fees payable (Note 3) . . . . . . . . . . . . . . . . . . . . . . . . 393,634 19,699 12,771 28,981Transfer agent fees payable (Note 3) . . . . . . . . . . . . . . . . . . . . . 261,499 4,300 61,447 15,490Shareholder servicing and administration fees payable
(Note 3) . . . . . . . . . . . . . . . . . . . . . . . . . . . . . . . . . . . . . . . . 235,289 12,445 23,792 24,662Fund administration and accounting fees payable (Note 3) . . . . 100,575 4,528 10,600 12,345Accrued foreign capital gains taxes . . . . . . . . . . . . . . . . . . . . . . 3,263,050 107,474 — 66,620Accrued expenses and other payables . . . . . . . . . . . . . . . . . . . . 400,525 30,517 54,124 22,483
Total Liabilities . . . . . . . . . . . . . . . . . . . . . . . . . . . . . . . . . . . . . 53,467,972 921,095 4,048,509 8,476,703NET ASSETS . . . . . . . . . . . . . . . . . . . . . . . . . . . . . . . . . . . . . . . $5,009,873,471 $224,093,565 $528,956,131 $627,457,743
NET ASSETS consist ofUndistributed net investment income . . . . . . . . . . . . . . . . . . . . $74,073,754 $3,980,944 $4,978,710 $1,919,240Accumulated net realized gain on securities, forward exchange
contracts and foreign currencies . . . . . . . . . . . . . . . . . . . . . . 460,432,089 6,550,513 16,517,920 (7,330,811)Net unrealized appreciation of securities, forward exchange
contracts, foreign currencies and net other assets . . . . . . . . . 1,512,618,193 7,343,596 158,326,460 59,478,129Paid-in capital . . . . . . . . . . . . . . . . . . . . . . . . . . . . . . . . . . . . . 2,962,749,435 206,218,512 349,133,041 573,391,185
Total Net Assets . . . . . . . . . . . . . . . . . . . . . . . . . . . . . . . . . . . . $5,009,873,471 $224,093,565 $528,956,131 $627,457,743
CAPITAL STOCK (common stock outstanding) . . . . . . . . . . . . 203,337,100 18,690,910 26,413,898 63,449,185
NET ASSET VALUE offering and redemption price pershare . . . . . . . . . . . . . . . . . . . . . . . . . . . . . . . . . . . . . . . . . . . . . $24.64 $11.99 $20.03 $9.89
(a) Foreign currency held at cost for the Global Value Fund, Global Value Fund II – Currency Unhedged, Value Fund and Worldwide High Dividend Yield Value Fundwas $760, $14, $4 and $29 respectively.
SEE NOTES TO FINANCIAL STATEMENTSII-14

TWEEDY, BROWNE FUND INC.
Statements of OperationsFor the Six Months Ended September 30, 2012 (Unaudited)
Global ValueFund
Global ValueFund II –CurrencyUnhedged
ValueFund
Worldwide HighDividend Yield
Value Fund
INVESTMENT INCOMEDividends . . . . . . . . . . . . . . . . . . . . . . . . . . . . . . . . . . . . $104,598,269 $5,776,349 $7,693,302 $12,540,906Less foreign withholding taxes . . . . . . . . . . . . . . . . . . . . . (9,151,293) (435,170) (573,479) (760,341)Interest . . . . . . . . . . . . . . . . . . . . . . . . . . . . . . . . . . . . . . 74,389 3 6,949 7,330
Total Investment Income 95,521,365 5,341,182 7,126,772 11,787,895
EXPENSESInvestment advisory fee (Note 3) . . . . . . . . . . . . . . . . . . . 30,196,227 1,692,672 3,070,798 3,484,568Transfer agent fees (Note 3) . . . . . . . . . . . . . . . . . . . . . . 887,659 30,079 144,764 65,235Custodian fees (Note 3) . . . . . . . . . . . . . . . . . . . . . . . . . . 784,446 47,187 35,431 76,349Fund administration and accounting fees (Note 3) . . . . . . 594,126 34,640 61,643 69,742Shareholder servicing and administration fees
(Note 3) . . . . . . . . . . . . . . . . . . . . . . . . . . . . . . . . . . . 179,653 10,597 18,308 21,450Legal and audit fees . . . . . . . . . . . . . . . . . . . . . . . . . . . . . 161,244 12,274 22,892 22,096Directors’ fees and expenses (Note 3) . . . . . . . . . . . . . . . . 168,326 9,788 16,915 17,740Other . . . . . . . . . . . . . . . . . . . . . . . . . . . . . . . . . . . . . . . . 406,808 46,495 55,883 60,759
Total expenses before waivers . . . . . . . . . . . . . . . . . 33,378,489 1,883,732 3,426,634 3,817,939Investment advisory fees recouped and/or waived
(Note 3) . . . . . . . . . . . . . . . . . . . . . . . . . . . . . . . . . . . — (28,947) — 146Net Expenses 33,378,489 1,854,785 3,426,634 3,818,085
NET INVESTMENT INCOME . . . . . . . . . . . . . . . . . . . 62,142,876 3,486,397 3,700,138 7,969,810
REALIZED AND UNREALIZED GAIN (LOSS) ONINVESTMENTSNet realized gain (loss) on:
Securities . . . . . . . . . . . . . . . . . . . . . . . . . . . . . . . . . . . 250,141,393 7,713,158 9,167,886 2,374,765Forward exchange contracts(a) . . . . . . . . . . . . . . . . . . . 23,629,476 — 521,588 —Foreign currencies and net other assets . . . . . . . . . . . . . (968,979) (53,522) (30,975) (977,536)
Net realized gain on investments . . . . . . . . . . . . . . . . . . . 272,801,890 7,659,636 9,658,499 1,397,229Net unrealized appreciation (depreciation) of:
Securities(b) . . . . . . . . . . . . . . . . . . . . . . . . . . . . . . . . . (167,550,930) (4,048,712) 2,583,315 9,392,870Forward exchange contracts(a) . . . . . . . . . . . . . . . . . . . 13,627,040 — 2,547,204 —Foreign currencies and net other assets . . . . . . . . . . . . . (557,564) (14,293) (37,667) (18,442)
Net unrealized appreciation (depreciation) ofinvestments . . . . . . . . . . . . . . . . . . . . . . . . . . . . . . . . . (154,481,454) (4,063,005) 5,092,852 9,374,428
NET REALIZED AND UNREALIZED GAINON INVESTMENTS . . . . . . . . . . . . . . . . . . . . . . . . . . 118,320,436 3,596,631 14,751,351 10,771,657
NET INCREASE IN NET ASSETSRESULTING FROM OPERATIONS . . . . . . . . . . . . . $180,463,312 $7,083,028 $18,451,489 $18,741,467
(a) Primary risk exposure being hedged is currency risk.(b) Net accrued foreign capital gains taxes of $3,263,050, $107,474, $0, and $86,709, respectively.
SEE NOTES TO FINANCIAL STATEMENTSII-15

TWEEDY, BROWNE FUND INC.
Statements of Changes in Net Assets
Global Value FundSix Months
Ended9/30/2012
(Unaudited)Year Ended3/31/2012
INVESTMENT ACTIVITIES:Net investment income $62,142,876 $81,360,086
Net realized gain (loss) on securities, forward exchange contracts and currency transactions 272,801,890 129,586,158
Net unrealized appreciation (depreciation) of securities, forward exchange contracts, foreign currencies andnet other assets (154,481,454) (80,627,308)
Net increase in net assets resulting from operations 180,463,312 130,318,936
DISTRIBUTIONS:Dividends to shareholders from net investment income — (80,821,151)
Distributions to shareholders from net realized gain on investments — (108,527,128)
Net increase (decrease) in net assets from Fund share transactions 70,067,263 68,759,348
Redemption fees 70,256 211,170
Net increase (decrease) in net assets 250,600,831 9,941,175
NET ASSETSBeginning of period/year 4,759,272,640 4,749,331,465
End of period/year $5,009,873,471 $4,759,272,640
Undistributed net investment income at end of period/year $74,073,754 $11,930,878
SEE NOTES TO FINANCIAL STATEMENTSII-16
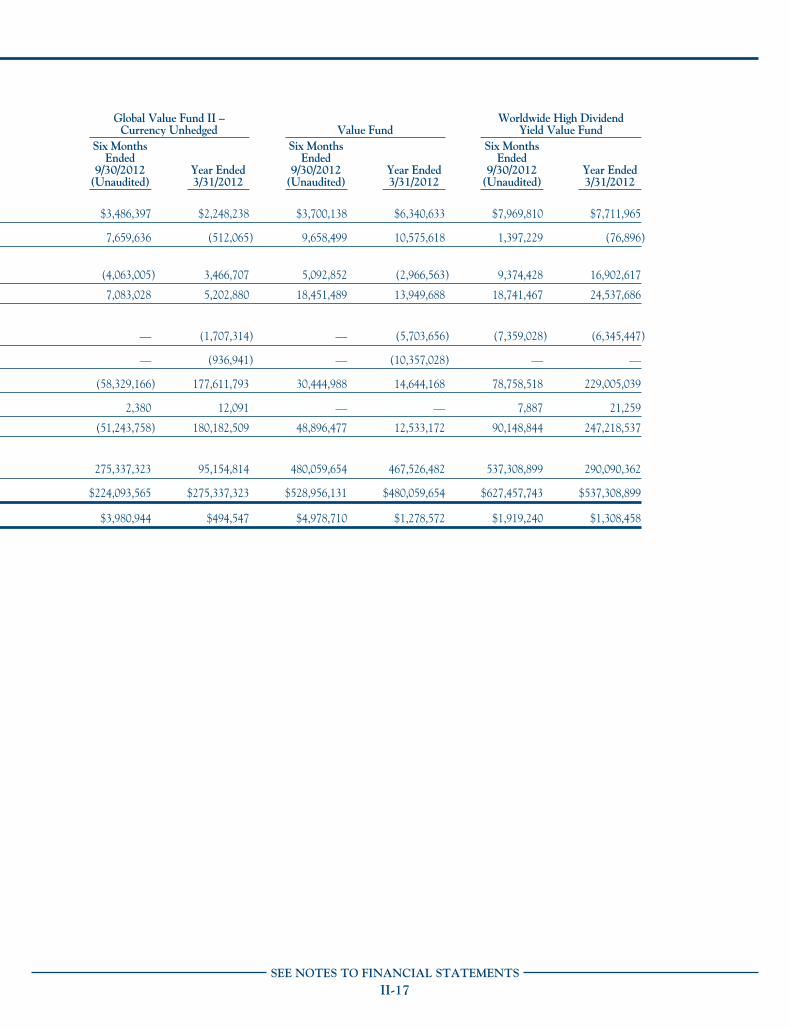
Global Value Fund II –Currency Unhedged Value Fund
Worldwide High DividendYield Value Fund
Six MonthsEnded
9/30/2012(Unaudited)
Year Ended3/31/2012
Six MonthsEnded
9/30/2012(Unaudited)
Year Ended3/31/2012
Six MonthsEnded
9/30/2012(Unaudited)
Year Ended3/31/2012
$3,486,397 $2,248,238 $3,700,138 $6,340,633 $7,969,810 $7,711,965
7,659,636 (512,065) 9,658,499 10,575,618 1,397,229 (76,896)
(4,063,005) 3,466,707 5,092,852 (2,966,563) 9,374,428 16,902,617
7,083,028 5,202,880 18,451,489 13,949,688 18,741,467 24,537,686
— (1,707,314) — (5,703,656) (7,359,028) (6,345,447)
— (936,941) — (10,357,028) — —
(58,329,166) 177,611,793 30,444,988 14,644,168 78,758,518 229,005,039
2,380 12,091 — — 7,887 21,259
(51,243,758) 180,182,509 48,896,477 12,533,172 90,148,844 247,218,537
275,337,323 95,154,814 480,059,654 467,526,482 537,308,899 290,090,362
$224,093,565 $275,337,323 $528,956,131 $480,059,654 $627,457,743 $537,308,899
$3,980,944 $494,547 $4,978,710 $1,278,572 $1,919,240 $1,308,458
SEE NOTES TO FINANCIAL STATEMENTSII-17

TWEEDY, BROWNE FUND INC.
Financial HighlightsTweedy, Browne Global Value FundFor a Fund share outstanding throughout each period/year.
Six MonthsEnded
9/30/12(Unaudited)
YearEnded
3/31/12
YearEnded
3/31/11
YearEnded
3/31/10
YearEnded
3/31/09
YearEnded
3/31/08Net asset value, beginning of period/year . . . . . . . . . . . . . . . $23.79 $24.16 $22.13 $14.15 $27.21 $32.31
Income from investment operations:Net investment income . . . . . . . . . . . . . . . . . . . . . . . . . . . . 0.30 0.42 0.26 0.33 0.66(a)(b) 0.50Net realized and unrealized gain (loss) on investments . . . . . 0.55 0.19 2.08 7.98 (10.90) (2.24)
Total from investment operations . . . . . . . . . . . . . . . 0.85 0.61 2.34 8.31 (10.24) (1.74)
Distributions:Dividends from net investment income . . . . . . . . . . . . . . . . — (0.42) (0.25) (0.33) (0.75) (0.48)Distributions from net realized gains . . . . . . . . . . . . . . . . . . . — (0.56) (0.06) — (2.07) (2.88)
Total distributions . . . . . . . . . . . . . . . . . . . . . . . . . . — (0.98) (0.31) (0.33) (2.82) (3.36)Redemption fees(c) . . . . . . . . . . . . . . . . . . . . . . . . . . . . . . . . 0.00 0.00 0.00 0.00 0.00 0.00Net asset value, end of period/year . . . . . . . . . . . . . . . . . . . . $24.64 $23.79 $24.16 $22.13 $14.15 $27.21
Total return(d) . . . . . . . . . . . . . . . . . . . . . . . . . . . . . . . . . . . . 3.57% 2.92% 10.59% 58.85% (38.57)% (6.35)%
Ratios/Supplemental Data:Net assets, end of period/year (in 000s) . . . . . . . . . . . . . . . . . $5,009,873 $4,759,273 $4,749,331 $4,305,821 $3,094,360 $6,663,870Ratio of operating expenses to average net assets . . . . . . . . . . 1.38%(e) 1.38% 1.39% 1.40% 1.40% 1.37%Ratio of net investment income to average net assets . . . . . . 2.57%(e) 1.80% 1.16% 1.62% 3.05%(b) 1.45%Portfolio turnover rate . . . . . . . . . . . . . . . . . . . . . . . . . . . . . 8% 9% 12% 7% 16% 9%
(a) Net investment income per share was calculated using the average shares method.(b) For year ended 3/31/09, investment income per share reflects a special dividend which amounted to $0.14 per share. Excluding the special dividend, the ratio of net
investment income to average net assets would have been 2.42% per share.(c) Amount represents less than $0.01 per share.(d) Total return represents aggregate total return for the periods indicated.(e) Annualized.
Tweedy, Browne Global Value Fund II – Currency UnhedgedFor a Fund share outstanding throughout each period/year.
Six MonthsEnded
9/30/12(Unaudited)
YearEnded
3/31/12
YearEnded
3/31/11
PeriodEnded
3/31/10(a)
Net asset value, beginning of period/year . . . . . . . . . . . . . . . $11.69 $11.52 $10.27 $10.00
Income from investment operations:Net investment income . . . . . . . . . . . . . . . . . . . . . . . . . . . . 0.19 0.10 0.08 0.00(b)
Net realized and unrealized gain (loss) on investments . . . . . 0.11 0.20 1.25 0.27
Total from investment operations . . . . . . . . . . . . . . . 0.30 0.30 1.33 0.27
Distributions:Dividends from net investment income . . . . . . . . . . . . . . . . — (0.08) (0.07) 0.00(b)
Distributions from net realized gains . . . . . . . . . . . . . . . . . . . — (0.05) (0.01) —
Total distributions . . . . . . . . . . . . . . . . . . . . . . . . . . — (0.13) (0.08) 0.00(b)
Redemption fees(b) . . . . . . . . . . . . . . . . . . . . . . . . . . . . . . . . 0.00 0.00 0.00 0.00Net asset value, end of period/year . . . . . . . . . . . . . . . . . . . . $11.99 $11.69 $11.52 $10.27
Total return(c) . . . . . . . . . . . . . . . . . . . . . . . . . . . . . . . . . . . . 2.57% 2.68% 13.00% 2.74%
Ratios/Supplemental Data:Net assets, end of period/year (in 000s) . . . . . . . . . . . . . . . . . $224,094 $275,337 $95,155 $34,575Ratio of operating expenses to average net assets . . . . . . . . . . 1.37%(d) 1.37% 1.37% 1.37%(d)
Ratio of operating expenses to average net assets excludingrecoupments and/or waivers of expenses . . . . . . . . . . . . . . 1.39%(d) 1.40% 1.58% 2.56%(d)
Ratio of net investment income to average net assets . . . . . . 2.57%(d) 1.07% 0.97% 0.04%(d)
Portfolio turnover rate . . . . . . . . . . . . . . . . . . . . . . . . . . . . . 17% 5% 2% 0%
(a) Commenced operations on October 26, 2009.(b) Amount represents less than $0.01 per share.(c) Total return represents aggregate total return for the periods indicated.(d) Annualized.
SEE NOTES TO FINANCIAL STATEMENTSII-18

TWEEDY, BROWNE FUND INC.
Financial HighlightsTweedy, Browne Value FundFor a Fund share outstanding throughout each period/year.
Six MonthsEnded
9/30/12(Unaudited)
YearEnded
3/31/12
YearEnded
3/31/11
YearEnded
3/31/10
YearEnded
3/31/09
YearEnded
3/31/08Net asset value, beginning of period/year . . . . . . . . . . . . . . . $19.35 $19.46 $19.03 $12.73 $20.90 $24.65
Income from investment operations:Net investment income . . . . . . . . . . . . . . . . . . . . . . . . . . . . 0.14 0.27 0.19 0.24 0.18 0.22Net realized and unrealized gain(loss) on investments . . . . . . 0.54 0.31 1.45 6.27 (6.22) (1.43)
Total from investment operations . . . . . . . . . . . . . . . 0.68 0.58 1.64 6.51 (6.04) (1.21)
Distributions:Dividends from net investment income . . . . . . . . . . . . . . . . — (0.25) (0.20) (0.21) (0.20) (0.19)Distributions from net realized gains . . . . . . . . . . . . . . . . . . . — (0.44) (1.01) — (1.93) (2.35)
Total distributions . . . . . . . . . . . . . . . . . . . . . . . . . . — (0.69) (1.21) (0.21) (2.13) (2.54)Net asset value, end of period/year . . . . . . . . . . . . . . . . . . . . $20.03 $19.35 $19.46 $19.03 $12.73 $20.90
Total return(a) . . . . . . . . . . . . . . . . . . . . . . . . . . . . . . . . . . . . 3.52% 3.26% 8.77% 51.18% (30.01)% (5.41)%
Ratios/Supplemental Data:Net assets, end of period/year (in 000s) . . . . . . . . . . . . . . . . . $528,956 $480,060 $467,526 $403,043 $304,787 $411,237Ratio of operating expenses to average net assets . . . . . . . . . . 1.39%(b) 1.40% 1.39% 1.42% 1.41% 1.37%Ratio of net investment income to average net assets . . . . . . 1.51%(b) 1.42% 1.02% 1.40% 1.02% 0.83%Portfolio turnover rate . . . . . . . . . . . . . . . . . . . . . . . . . . . . . 5% 10% 11% 11% 37% 11%
(a) Total return represents aggregate total return for the periods indicated.(b) Annualized.
Tweedy, Browne Worldwide High Dividend Yield Value FundFor a Fund share outstanding throughout each period/year.
Six MonthsEnded
9/30/12(Unaudited)
YearEnded
3/31/12
YearEnded
3/31/11
YearEnded
3/31/10
YearEnded
3/31/09
PeriodEnded
3/31/08(a)
Net asset value, beginning of period/year . . . . . . . . . . . . . . . $9.75 $9.52 $8.62 $6.09 $9.70 $10.00
Income from investment operations:Net investment income . . . . . . . . . . . . . . . . . . . . . . . . . . . . 0.14 0.20 0.18 0.20 0.22 0.10Net realized and unrealized gain (loss) on investments . . . . . 0.13 0.21 0.91 2.53 (3.57) (0.37)
Total from investment operations . . . . . . . . . . . . . . . 0.27 0.41 1.09 2.73 (3.35) (0.27)
Distributions:Dividends from net investment income . . . . . . . . . . . . . . . . (0.13) (0.18) (0.19) (0.20) (0.26) (0.03)Distributions from net realized gains . . . . . . . . . . . . . . . . . . . — — — — — —
Total distributions . . . . . . . . . . . . . . . . . . . . . . . . . . (0.13) (0.18) (0.19) (0.20) (0.26) (0.03)Redemption fees(b) . . . . . . . . . . . . . . . . . . . . . . . . . . . . . . . . 0.00 0.00 0.00 0.00 0.00 0.00Net asset value, end of period/year . . . . . . . . . . . . . . . . . . . . $9.89 $9.75 $9.52 $8.62 $6.09 $9.70
Total return(c) . . . . . . . . . . . . . . . . . . . . . . . . . . . . . . . . . . . . 2.88% 4.35% 13.03% 45.19% (35.25)% (2.69)%
Ratios/Supplemental Data:Net assets, end of period/year (in 000s) . . . . . . . . . . . . . . . . . $627,458 $537,309 $290,090 $145,094 $79,913 $70,386Ratio of operating expenses to average net assets . . . . . . . . . . 1.37%(d) 1.37% 1.37% 1.37% 1.37% 1.37%(d)
Ratio of operating expenses to average net assets excludingrecoupments and/or waivers of expenses . . . . . . . . . . . . . . 1.37%(d) 1.37% 1.39% 1.46% 1.54% 1.86%(d)
Ratio of net investment income to average net assets . . . . . . 2.86%(d) 2.11% 2.00% 2.36% 2.99% 2.38%(d)
Portfolio turnover rate . . . . . . . . . . . . . . . . . . . . . . . . . . . . . 6% 6% 16% 18% 38% 2%
(a) Commenced operations on September 5, 2007.(b) Amount represents less than $0.01 per share.(c) Total return represents aggregate total return for the periods indicated.(d) Annualized.
SEE NOTES TO FINANCIAL STATEMENTSII-19

TWEEDY, BROWNE FUND INC.
Notes to Financial Statements (Unaudited)
1. OrganizationTweedy, Browne Fund Inc. (the “Company”) is an open-
end management investment company registered with theUnited States (“U.S.”) Securities and Exchange Commission(“SEC”) under the Investment Company Act of 1940, asamended (the “1940 Act”). The Company was organized as aMaryland corporation on January 28, 1993. Tweedy, BrowneGlobal Value Fund (“Global Value Fund”), Tweedy, BrowneGlobal Value Fund II – Currency Unhedged (“Global ValueFund II – Currency Unhedged”), Tweedy, Browne ValueFund (“Value Fund”), and Tweedy, Browne Worldwide HighDividend Yield Value Fund (“Worldwide High DividendYield Value Fund”), (each a “Fund” and together, the“Funds”), are each a diversified series of the Company.
The Funds commenced operations as follows:
FundCommencement of
Operations
Global Value Fund 06/15/93
Global Value Fund II – Currency Unhedged 10/26/09
Value Fund 12/08/93
Worldwide High Dividend Yield Value Fund 09/05/07
Global Value Fund and Global Value Fund II – CurrencyUnhedged seek long-term capital growth by investingprimarily in foreign equity securities that Tweedy, BrowneCompany LLC (the “Investment Adviser”) believes areundervalued. Value Fund seeks long-term capital growth byinvesting primarily in U.S. and foreign equity securities thatthe Investment Adviser believes are undervalued. WorldwideHigh Dividend Yield Value Fund seeks long-term capitalgrowth by investing primarily in U.S. and foreign equitysecurities that the Investment Adviser believes to have above-average dividend yields and valuations that are reasonable.
2. Significant Accounting PoliciesThe preparation of financial statements in accordance
with accounting principles generally accepted in the U.S.(“U.S. GAAP”) requires management to make estimates andassumptions that affect the reported amounts and disclosuresin the financial statements. Actual results could differ fromthose estimates. The following is a summary of significantaccounting policies consistently followed by the Funds in thepreparation of their financial statements.
Portfolio Valuation Portfolio securities and other assets,listed on a U.S. national securities exchange, comparableforeign securities exchange or through any system providingfor contemporaneous publication of actual prices (andnot subject to restrictions against sale by the Fund on suchexchange or system) are valued at the last quoted sale price ator prior to the close of regular trading on the New York StockExchange or, if applicable, the NASDAQ Official ClosingPrice (“NOCP”). Portfolio securities and other assets, which
are readily marketable but for which there are no reportedsales on the valuation date, whether because they are nottraded in a system providing for same day publication of salesor because there were no sales reported on such date, aregenerally valued at the mean between the last asked price andthe last bid price prior to the close of regular trading. Forwardexchange contracts are valued at the forward rate. Securitiesand other assets for which current market quotations are notreadily available, and those securities which are generally notreadily marketable due to significant legal or contractualrestrictions, will be valued at fair value as determined in goodfaith by the Investment Adviser under the direction of theFunds’ Board of Directors. Securities and other assets forwhich the most recent market quotations may not be reliable(including because the last sales price does not reflect currentmarket value at the time of valuing the Funds’ asset due todevelopments since such last price) may be valued at fairvalue if the Investment Adviser concludes that fair valuationwill likely result in a more accurate net asset valuation. TheFunds’ use of fair value pricing may cause the net asset valueof the Fund shares to differ from the net asset value thatwould be calculated using market quotations. Fair valuepricing involves subjective judgments and it is possible thatthe fair value determined for a security may be materiallydifferent than the value that could be realized upon the sale ofthat security. Debt securities purchased with a remainingmaturity of more than 60 days are valued through pricingobtained by pricing services approved by the Funds’ Board ofDirectors. Debt securities purchased with a remainingmaturity of 60 days or less are valued at amortized cost, whichapproximates market value, or by reference to other factors(i.e., pricing services or dealer quotations) by the InvestmentAdviser.
Fair Value Measurements The inputs and valuationtechniques used to determine fair value of the Funds’investments are summarized into three levels as described inthe hierarchy below:
• Level 1 – quoted prices in active markets for identicalsecurities
• Level 2 – other significant observable inputs (includingquoted prices for similar securities, interest rates, creditrisk, etc.)
• Level 3 – significant unobservable inputs (including theFunds’ own assumptions in determining the fair valueof investments)
The inputs or methodology used for valuing securities arenot necessarily an indication of the risk associated withinvesting in those securities. Transfers in and out of the levelsare recognized at the value at the end of the period. Thefollowing is a summary of the inputs used to value the Funds’assets carried at fair value as of September 30, 2012. See eachrespective Portfolio of Investments for details on portfolioholdings.
II-20

TWEEDY, BROWNE FUND INC.
Notes to Financial Statements (Unaudited)
Global Value Fund
TotalValue at
September 30, 2012
Level 1QuotedPrice
Level 2Other
SignificantObservable
Inputs
Level 3Significant
UnobservableInputs
Investments in Securities:Equity Securities
Common StocksJapan . . . . . . . . . . . . . . . . . . . . . . . . . . . . . . . . . . . . . . . . . . . $ 258,137,448 $ 257,992,846 $ 144,602 $ —All Other Countries . . . . . . . . . . . . . . . . . . . . . . . . . . . . . . . . 3,998,934,087 3,998,934,087 — —
Preferred Stocks . . . . . . . . . . . . . . . . . . . . . . . . . . . . . . . . . . . . . . . 9,468,080 9,468,080 — —Registered Investment Company . . . . . . . . . . . . . . . . . . . . . . . . . . 571,224,628 571,224,628 — —U.S. Treasury Bill . . . . . . . . . . . . . . . . . . . . . . . . . . . . . . . . . . . . . . 124,991,916 — 124,991,916 —Total Investments in Securities . . . . . . . . . . . . . . . . . . . . . . . . . . . 4,962,756,159 4,837,619,641 125,136,518 —
Other Financial Instruments:Asset
Unrealized appreciation of forward exchange contracts . . . . . 70,193,687 — 70,193,687 —Liability
Unrealized depreciation of forward exchange contracts . . . . . (42,868,325) — (42,868,325) —Total $4,990,081,521 $4,837,619,641 $152,461,880 $ —
Global Value Fund II – Currency Unhedged
TotalValue at
September 30, 2012
Level 1QuotedPrice
Level 2Other
SignificantObservable
Inputs
Level 3Significant
UnobservableInputs
Investments in Securities . . . . . . . . . . . . . . . . . . . . . . . . . . . . . . . . . . $ 223,964,423 $ 223,964,423 $ — $ —
Value Fund
TotalValue at
September 30, 2012
Level 1QuotedPrice
Level 2Other
SignificantObservable
Inputs
Level 3Significant
UnobservableInputs
Investments in Securities:Equity Securities
Common Stocks . . . . . . . . . . . . . . . . . . . . . . . . . . . . . . . . . . . . . . $ 443,092,210 $ 443,092,210 $ — $ —Registered Investment Company . . . . . . . . . . . . . . . . . . . . . . . . . . 70,444,654 70,444,654 — —U.S. Treasury Bill . . . . . . . . . . . . . . . . . . . . . . . . . . . . . . . . . . . . . . 13,497,746 — 13,497,746 —Total Investments in Securities . . . . . . . . . . . . . . . . . . . . . . . . . . . 527,034,610 513,536,864 13,497,746 —
Other Financial Instruments:Asset
Unrealized appreciation of forward exchange contracts . . . . . 4,206,924 — 4,206,924 —Liability
Unrealized depreciation of forward exchange contracts . . . . . (1,332,158) — (1,332,158) —Total $ 529,909,376 $ 513,536,864 $ 16,372,512 $ —
II-21
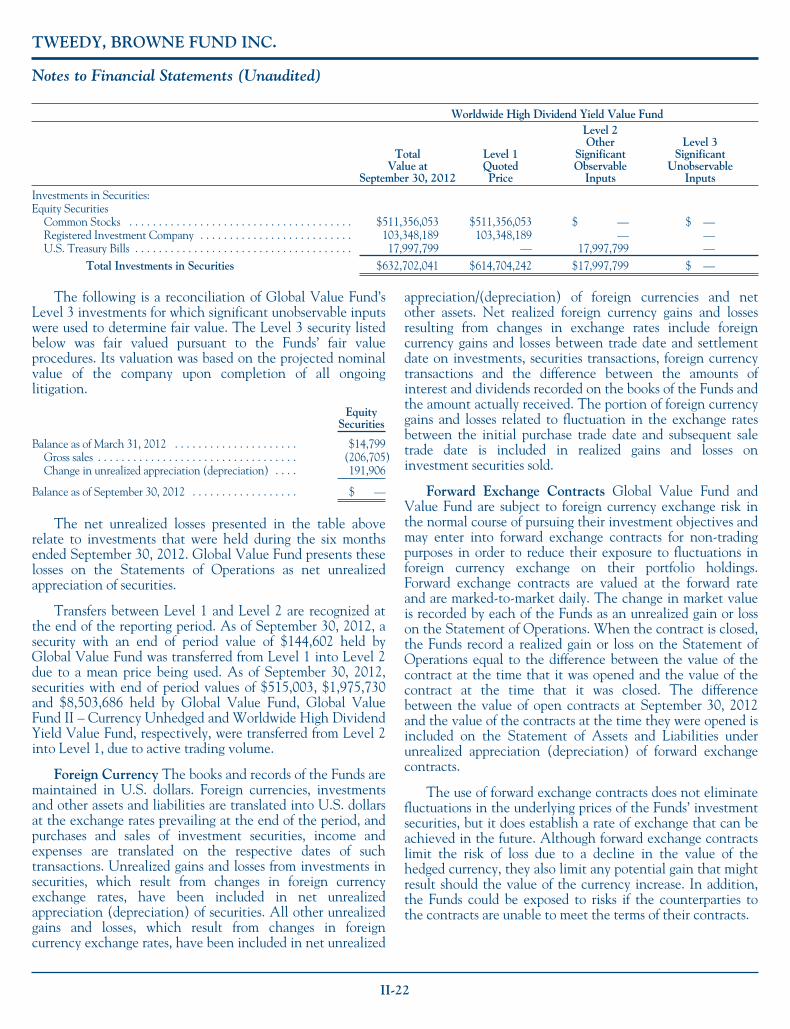
TWEEDY, BROWNE FUND INC.
Notes to Financial Statements (Unaudited)
Worldwide High Dividend Yield Value Fund
TotalValue at
September 30, 2012
Level 1QuotedPrice
Level 2Other
SignificantObservable
Inputs
Level 3Significant
UnobservableInputs
Investments in Securities:Equity Securities
Common Stocks . . . . . . . . . . . . . . . . . . . . . . . . . . . . . . . . . . . . . . $511,356,053 $511,356,053 $ — $ —Registered Investment Company . . . . . . . . . . . . . . . . . . . . . . . . . . 103,348,189 103,348,189 — —U.S. Treasury Bills . . . . . . . . . . . . . . . . . . . . . . . . . . . . . . . . . . . . . 17,997,799 — 17,997,799 —
Total Investments in Securities $632,702,041 $614,704,242 $17,997,799 $ —
The following is a reconciliation of Global Value Fund’sLevel 3 investments for which significant unobservable inputswere used to determine fair value. The Level 3 security listedbelow was fair valued pursuant to the Funds’ fair valueprocedures. Its valuation was based on the projected nominalvalue of the company upon completion of all ongoinglitigation.
EquitySecurities
Balance as of March 31, 2012 . . . . . . . . . . . . . . . . . . . . . $14,799Gross sales . . . . . . . . . . . . . . . . . . . . . . . . . . . . . . . . . . (206,705)Change in unrealized appreciation (depreciation) . . . . 191,906
Balance as of September 30, 2012 . . . . . . . . . . . . . . . . . . $ —
The net unrealized losses presented in the table aboverelate to investments that were held during the six monthsended September 30, 2012. Global Value Fund presents theselosses on the Statements of Operations as net unrealizedappreciation of securities.
Transfers between Level 1 and Level 2 are recognized atthe end of the reporting period. As of September 30, 2012, asecurity with an end of period value of $144,602 held byGlobal Value Fund was transferred from Level 1 into Level 2due to a mean price being used. As of September 30, 2012,securities with end of period values of $515,003, $1,975,730and $8,503,686 held by Global Value Fund, Global ValueFund II – Currency Unhedged and Worldwide High DividendYield Value Fund, respectively, were transferred from Level 2into Level 1, due to active trading volume.
Foreign Currency The books and records of the Funds aremaintained in U.S. dollars. Foreign currencies, investmentsand other assets and liabilities are translated into U.S. dollarsat the exchange rates prevailing at the end of the period, andpurchases and sales of investment securities, income andexpenses are translated on the respective dates of suchtransactions. Unrealized gains and losses from investments insecurities, which result from changes in foreign currencyexchange rates, have been included in net unrealizedappreciation (depreciation) of securities. All other unrealizedgains and losses, which result from changes in foreigncurrency exchange rates, have been included in net unrealized
appreciation/(depreciation) of foreign currencies and netother assets. Net realized foreign currency gains and lossesresulting from changes in exchange rates include foreigncurrency gains and losses between trade date and settlementdate on investments, securities transactions, foreign currencytransactions and the difference between the amounts ofinterest and dividends recorded on the books of the Funds andthe amount actually received. The portion of foreign currencygains and losses related to fluctuation in the exchange ratesbetween the initial purchase trade date and subsequent saletrade date is included in realized gains and losses oninvestment securities sold.
Forward Exchange Contracts Global Value Fund andValue Fund are subject to foreign currency exchange risk inthe normal course of pursuing their investment objectives andmay enter into forward exchange contracts for non-tradingpurposes in order to reduce their exposure to fluctuations inforeign currency exchange on their portfolio holdings.Forward exchange contracts are valued at the forward rateand are marked-to-market daily. The change in market valueis recorded by each of the Funds as an unrealized gain or losson the Statement of Operations. When the contract is closed,the Funds record a realized gain or loss on the Statement ofOperations equal to the difference between the value of thecontract at the time that it was opened and the value of thecontract at the time that it was closed. The differencebetween the value of open contracts at September 30, 2012and the value of the contracts at the time they were opened isincluded on the Statement of Assets and Liabilities underunrealized appreciation (depreciation) of forward exchangecontracts.
The use of forward exchange contracts does not eliminatefluctuations in the underlying prices of the Funds’ investmentsecurities, but it does establish a rate of exchange that can beachieved in the future. Although forward exchange contractslimit the risk of loss due to a decline in the value of thehedged currency, they also limit any potential gain that mightresult should the value of the currency increase. In addition,the Funds could be exposed to risks if the counterparties tothe contracts are unable to meet the terms of their contracts.
II-22

TWEEDY, BROWNE FUND INC.
Notes to Financial Statements (Unaudited)
Securities Transactions and Investment Income Securitiestransactions are recorded as of the trade date. Realized gains andlosses from securities transactions are recorded on the identifiedcost basis. Dividend income and distributions to shareholders arerecorded on the ex-dividend date. In the case of certain foreignsecurities, dividend income is recorded as soon after the ex-dateas the Funds become aware of such dividend.
Foreign Taxes The Funds may be subject to foreign taxeson dividend and interest income, gains on investments orcurrency purchase/repatriation, a portion of which may berecoverable. The Funds’ custodian applies for refunds onbehalf of each Fund where available. The Funds will accruesuch taxes and recoveries as applicable, based on their currentinterpretation of tax rules and regulations that exist in themarkets in which they invest.
Dividends and Distributions to Shareholders Dividendsfrom net investment income, if any, will be declared and paidannually for Global Value Fund, Global Value Fund II –Currency Unhedged, and Value Fund and semi-annually forWorldwide High Dividend Yield Value Fund. Distributionsfrom realized capital gains after utilization of capital losscarryforwards, if any, will be declared and paid annually foreach of the Funds. Additional distributions of net investmentincome and capital gains from the Funds may be made at thediscretion of the Board of Directors in order to avoid theapplication of a 4% non-deductible federal excise tax oncertain undistributed amounts of ordinary income and capitalgains. Income dividends and capital gain distributions aredetermined in accordance with income tax regulations whichmay differ from U.S. GAAP. These differences are primarilydue to differing treatments of income and gains on variousinvestment securities held by the Funds, timing differencesand differing characterization of distributions made by theFunds.
Federal Income Taxes Each Fund has qualified andintends to continue to qualify as a regulated investmentcompany by complying with the requirements of the U.S.Internal Revenue Code of 1986, as amended (the “Code”),applicable to regulated investment companies and bydistributing substantially all of its taxable income to itsshareholders. Therefore, no federal income tax provision isrequired.
The Funds are not aware of any events that are reasonablypossible to occur in the next twelve months that would resultin the amounts of any unrecognized tax benefits significantlyincreasing or decreasing for the Funds. However, the Funds’conclusions may be subject to future review based on changesin, or the interpretation of, the accounting standards or taxlaws and regulations. In addition, utilization of any capital losscarryforwards could be subject to limitations imposed by theCode related to share ownership changes. Each of the Funds’tax positions for the tax years for which the applicable statutesof limitations have not expired are subject to examination by
the Internal Revenue Service, state departments of revenueand by foreign tax authorities.
Expenses Expenses directly attributable to each Fund as adiversified series of the Company are charged to such Fund.Other expenses of the Company are allocated to each seriesbased on the average net assets of each series or otherequitable allocation method.
3. Investment Advisory Fee, Other Related PartyTransactions and Administration Fee
The Company, on behalf of each Fund, has entered intoseparate investment advisory agreements with the InvestmentAdviser (each, an “Advisory Agreement”). Under eachAdvisory Agreement, the Company pays the InvestmentAdviser a fee at the annual rate of 1.25% of the value of eachFund’s average daily net assets. The fee is payable monthly,provided each Fund will make such interim payments as maybe requested by the Investment Adviser not to exceed 75% ofthe amount of the fee then accrued on the books of the Fundand unpaid. For the six months ended September 30, 2012,the Investment Adviser received $30,196,227, $1,692,672,$3,070,798 and $3,484,568 for Global Value Fund, GlobalValue Fund II – Currency Unhedged, Value Fund andWorldwide High Dividend Yield Value Fund, respectively.
The Investment Adviser has contractually agreed towaive its investment advisory fee and/or to reimburseexpenses of Global Value Fund II – Currency Unhedged andWorldwide High Dividend Yield Value Fund to the extentnecessary to maintain the total annual fund operatingexpenses for each Fund (excluding fees and expenses frominvestments in other investment companies, brokerage,interest, taxes and extraordinary expenses) at no more than1.37% of each Fund’s average daily net assets. Thisarrangement will continue at least through December 31,2013. During the six months ended September 30, 2012, theInvestment Adviser waived $28,947 for Global Value FundII – Currency Unhedged. In this arrangement, Global ValueFund II – Currency Unhedged and Worldwide High DividendYield Value Fund have agreed, during the two-year periodfollowing any waiver or reimbursement by the InvestmentAdviser, to repay such amount to the extent that after givingeffect to such repayment such adjusted total annual fundoperating expenses would not exceed 1.37% of each Fund’saverage daily net assets on an annualized basis. During the sixmonths ended September 30, 2012, the Investment Adviserrecouped $146 for Worldwide High Dividend Yield ValueFund. At September 30, 2012, the amount of potentialrecovery expiring March 31, 2013, March 31, 2014 andMarch 31, 2015 on Global Value Fund II – CurrencyUnhedged was $125,363, $53,134 and $28,947, respectively.At September 30, 2012, the amount of potential recoveryexpiring March 31, 2013 on Worldwide High Dividend YieldValue Fund was $30,175.
II-23

TWEEDY, BROWNE FUND INC.
Notes to Financial Statements (Unaudited)
The Investment Adviser is reimbursed by the Funds forthe cost of settling transactions in U.S. securities for theFunds through its clearing broker. For the six months endedSeptember 30, 2012, Global Value Fund, Global ValueFund II – Currency Unhedged, Value Fund and WorldwideHigh Dividend Yield Value Fund reimbursed the InvestmentAdviser $495, $45, $300 and $360, respectively, for suchtransaction charges.
As of September 30, 2012, the current and retiredmanaging directors and their families, as well as employees ofthe Investment Adviser, have approximately $101.0 million,$3.5 million, $59.3 million and $5.7 million of their ownmoney invested in Global Value Fund, Global ValueFund II – Currency Unhedged, Value Fund and WorldwideHigh Dividend Yield Value Fund, respectively.
The Company, on behalf of the Funds, has entered intoan administration agreement (the “AdministrationAgreement”) with BNY Mellon Investment Servicing (US)Inc. (“BNY Mellon”), an indirect, wholly-owned subsidiary ofThe Bank of New York Mellon Corporation. Under theAdministration Agreement, the Company pays BNY Mellonan administration fee and a fund accounting fee computeddaily and payable monthly at the following annual rates of theaggregate average daily net assets of the Funds, allocatedaccording to each Fund’s net assets:
Up to$1 Billion
Between$1 Billion
and$5 Billion
Between$5 Billion
and$10 Billion
Exceeding$10 Billion
Administration Fees 0.0300% 0.0180% 0.0100% 0.0090%
Accounting Fees 0.0075% 0.0060% 0.0050% 0.0040%
For the period April 17, 2012 through September 30,2012, the Company paid the Investment Adviser for certain
shareholder servicing and administration services provided tothe Funds at an annual amount of $475,000, which isallocated pro-rata based on the relative average net assets ofthe Funds. Prior to April 16, 2012, the Company paid theInvestment Advisor an annual amount of $200,000 for theseservices.
No officer, director or employee of the InvestmentAdviser, BNY Mellon or any parent or subsidiary of thosecorporations receives any compensation from the Companyfor serving as a director or officer of the Company. TheCompany pays each Independent Director $100,000 annually,to be paid quarterly in $25,000 increments plus out-of-pocketexpenses for their services as directors. The Lead IndependentDirector receives an additional annual fee of $10,000. Theannual fee of $100,000 paid to each Independent Director,and the annual fee of $10,000 paid to the Lead IndependentDirector, is divided proportionately between the Funds.
Bank of New York Mellon Asset Servicing, an indirect,wholly-owned subsidiary of The Bank of New York MellonCorporation, serves as the Funds’ custodian pursuant to acustody agreement (the “Custody Agreement”). BNY Mellonalso serves as the Funds’ transfer agent. The InvestmentAdviser also serves as the distributor to the Funds and pays alldistribution fees. No distribution fees are paid by the Funds.
At September 30, 2012, three shareholders owned 11.3%,5.8% and 5.6%, respectively, of Global ValueFund II – Currency Unhedged’s outstanding shares; oneshareholder owned 7.8% of Value Fund’s outstanding shares;and three shareholders owned 9.4%, 6.1% and 5.6%,respectively of Worldwide High Dividend Yield Value Fund’soutstanding shares. Investment activities of these shareholderscould have an impact on each respective Fund.
4. Securities TransactionsThe 1940 Act defines “affiliated companies” to include securities in which a fund owns 5% or more of the outstanding
voting shares of an issuer. The following chart lists the issuers, which may be deemed “affiliated companies”, owned by GlobalValue Fund, as well as transactions that occurred in the securities of such issuers during the six months ended September 30,2012:
Amount Heldat 3/31/12 Name of Issuer
Value at3/31/12
PurchaseCost
SalesProceeds
Value at9/30/12
Shares or ParAmount Held
at 9/30/12
DividendIncome 4/1/12
to 9/30/12
Net Realized Gain(Loss) 4/1/12 to
9/30/12
248,117 Siegfried Holding AG $25,474,645 $6,020,633 $ — $30,361,199 248,117 $ 272,611 $ —
185,918 PubliGroupe SA, Registered 27,542,646 — — 26,152,756 185,918 1,075,465 —
4,795,392 Sol SPA 26,961,787 — — 27,144,892 4,795,392 612,274 —
1,111,317 Unidare 14,799 — 206,705 — — — 259,745
$79,993,877 $6,020,633 $206,705 $83,658,847 $1,960,350 $259,745
II-24

TWEEDY, BROWNE FUND INC.
Notes to Financial Statements (Unaudited)
Cost of purchases and proceeds from sales of investmentsecurities, excluding short-term investments, for the sixmonths ended September 30, 2012, are as follows:
GlobalValue Fund
GlobalValue
Fund II –CurrencyUnhedged Value Fund
WorldwideHigh
DividendYield
Value Fund
Purchases $346,573,692 $38,443,476 $25,293,623 $78,023,686
Sales $405,066,173 $74,844,398 $23,099,098 $27,509,170
5. Capital StockThe Company is authorized to issue 2.0 billion shares of
$0.0001 par value capital stock, of which 600,000,000,600,000,000, 400,000,000 and 400,000,000 of the unissuedshares have been designated as shares of Global Value Fund,Global Value Fund II – Currency Unhedged, Value Fund andWorldwide High Dividend Yield Value Fund, respectively.Redemptions from the Global Value Fund, Global ValueFund II – Currency Unhedged and Worldwide High DividendYield Value Fund, including exchange redemptions, within 60days of purchase are subject to a redemption fee equal to 2%of the redemption proceeds, which will be retained by eachFund.
Changes in shares outstanding for the six months endedSeptember 30, 2012 were as follows:
Global Value Fund
Shares Amount
Sold 18,381,380 $432,009,264Reinvested — —Redeemed (15,082,603) (361,942,001)
Net Increase 3,298,777 $70,067,263
Global Value Fund II – Currency Unhedged
Shares Amount
Sold 4,219,715 $47,947,392Reinvested — —Redeemed (9,079,986) (106,276,558)
Net Decrease (4,860,271) $(58,329,166)
Value Fund
Shares Amount
Sold 2,641,934 $50,458,380Reinvested — —Redeemed (1,035,619) (20,013,392)
Net Increase 1,606,315 $30,444,988
Worldwide High Dividend Yield Value Fund
Shares Amount
Sold 12,172,673 $115,407,642Reinvested 779,433 7,112,424Redeemed (4,598,277) (43,761,548)
Net Increase 8,353,829 $78,758,518
Changes in shares outstanding for the year endedMarch 31, 2012 were as follows:
Global Value Fund
Shares Amount
Sold 25,554,118 $587,560,795Reinvested 7,991,107 174,041,888Redeemed (30,103,966) (692,843,335)
Net Increase 3,441,259 $68,759,348
Global Value Fund II – Currency Unhedged
Shares Amount
Sold 17,861,667 $206,199,250Reinvested 235,365 2,511,341Redeemed (2,807,210) (31,098,798)
Net Increase 15,289,822 $177,611,793
Value Fund
Shares Amount
Sold 2,897,481 $53,787,654Reinvested 851,875 15,262,927Redeemed (2,962,920) (54,406,413)
Net Increase 786,436 $14,644,168
Worldwide High Dividend Yield Value Fund
Shares Amount
Sold 29,232,669 $272,213,216Reinvested 650,987 6,131,527Redeemed (5,263,156) (49,339,704)
Net Increase 24,620,500 $229,005,039
6. Income Tax InformationAs of March 31, 2012, Worldwide High Dividend Yield
Value Fund had a capital loss carryforward of $8,157,948expiring in 2018, which may be available to reduce future netrealized gains on investments, if any, to the extent permittedby the Code. Utilization of the capital loss carryforwardscould be subject to limitations imposed by the Code related toshare ownership changes.
Net capital and foreign currency losses incurred afterOctober 31 may be deferred and treated as occurring on thefirst day of the following fiscal year. Late year capital losses areavailable to offset future realized capital gains and therebyreduce future capital gains distributions. Late year ordinarylosses will offset future net investment income and therebyreduce future ordinary income distributions. For the yearended March 31, 2012, the Funds deferred to April 1, 2012late year capital and ordinary losses of:
FundLate Year
Capital LossesLate Year
Ordinary Losses
Global Value Fund $ — $ —
Global Value Fund II –Currency Unhedged 1,307,863 —
Value Fund — —
Worldwide High DividendYield Value Fund 570,092 —
II-25

TWEEDY, BROWNE FUND INC.
Notes to Financial Statements (Unaudited)
As of September 30, 2012, the aggregate cost for federaltax purposes was as follows:
Global Value Fund $3,476,775,218
Global Value Fund II – Currency Unhedged $216,606,168
Value Fund $371,538,534
Worldwide High Dividend Yield Value Fund $573,204,468
The aggregate gross unrealized appreciation/(depreciation) and net unrealized appreciation as computedon a federal income tax basis at September 30, 2012 for eachFund is as follows:
GrossAppreciation
GrossDepreciation
NetAppreciation
Global Value Fund $1,594,481,291 $(108,500,350) $1,485,980,941
Global Value Fund II –Currency Unhedged $16,970,102 $(9,611,847) $7,358,255
Value Fund $160,682,648 $(5,186,572) $155,496,076
Worldwide High DividendYield Value Fund $67,644,277 $(8,146,704) $59,497,573
7. Foreign SecuritiesInvesting in securities of foreign companies and foreign
governments involves economic and political risks andconsiderations not typically associated with investing in U.S.companies and the U.S. Government. These considerationsinclude changes in exchange rates and exchange rate controls(which may include suspension of the ability to transfercurrency from a given country), costs incurred in conversionsbetween currencies, non-negotiable brokerage commissions,less publicly available information, not generally being subjectto uniform standards, practices and requirements with respectto accounting, auditing and financial reporting, lower tradingvolume, delayed settlements and greater market volatility, thedifficulty of enforcing obligations in other countries, lesssecurities regulation, different tax provisions (includingwithholding on dividends paid to a Fund), war, seizure,political and social instability and diplomatic developments.
8. Derivative InstrumentsThe Global Value Fund and Value Fund had derivative
exposure to forward foreign currency exchange contracts. TheGlobal Value II – Currency Unhedged and Worldwide HighDividend Yield Value Fund had no exposure to derivatives.
The following tables present the value of derivatives held atSeptember 30, 2012 and the effect of derivatives held byprimary exposure during the six months ended September 30,2012. For open contracts at September 30, 2012, see thePortfolio of Investments, which is also indicative of theaverage activity for the six months ended September 30,2012.
Statement of Assets and Liabilities
Derivative Assets Location Global Value Fund Value Fund
Forwardexchange contracts
Unrealizedappreciation offorward exchangecontracts $70,193,687 $4,206,924
Derivative Liabilities Location Global Value Fund Value Fund
Forwardexchange contracts
Unrealizeddepreciation offorward exchangecontracts $42,868,325 $1,332,158
Statement of Operations
Derivative Global Value Fund Value Fund
Forwardexchange contracts
Net realizedgain (loss) on $23,629,476 $521,588
Derivative Global Value Fund Value Fund
Forwardexchange contracts
Net unrealizedappreciation(depreciation) of $13,627,040 $2,547,204
9. LitigationCertain holders of notes issued by Tribune Company
initiated litigation against Value Fund and thousands of otherpublic shareholders, seeking to recover payments made toTribune Company shareholders in connection with the 2007leverage buyout of Tribune Company. Value Fund tendered itsshares in a tender offer from Tribune Company and receivedproceeds of approximately $3.4 million. The plaintiffs allegethat the shareholder payments were made in violation ofvarious laws prohibiting constructive fraudulent transfers. Thecomplaints allege no misconduct by Value Fund or any memberof the putative defendant class. The outcome of theproceedings cannot be predicted at this time and nocontingency has been recorded on the books of Value Fund.
II-26

TWEEDY, BROWNE FUND INC.
Other Information (Unaudited)
1. Portfolio InformationThe Company files the Funds’ complete schedule of
portfolio holdings with the SEC for the first and third quartersof each fiscal year on Form N-Q. The Company’s Form N-Qis available (1) on the SEC’s website at http://www.sec.gov;(2) for review and copying at the SEC’s Public ReferenceRoom (“PRR”) in Washington, DC; or (3) by calling theFund at 800-432-4789. Information regarding the operation ofthe PRR may be obtained by calling 202-551-8090.
2. Proxy Voting InformationThe policies and procedures that the Company uses to
determine how to vote proxies relating to portfolio securitiesheld by the Funds are included in the Company’s Statementof Additional Information, which is available without chargeand upon request by calling the Fund at 800-432-4789 or byvisiting the Funds’ website at www.tweedy.com. Informationregarding how the Funds voted proxies relating to portfoliosecurities during the most recent twelve-month period endedJune 30 is available, without charge, at http://www.sec.gov.
3. Advisory AgreementApproval of the Renewal of the Investment Advisory
Agreements for Tweedy, Browne Global Value Fund,Tweedy, Browne Value Fund, Tweedy, Browne WorldwideHigh Dividend Yield Value Fund and Tweedy, BrowneGlobal Value Fund II – Currency Unhedged
On May 23, 2012, the Tweedy, Browne Fund Inc.’s (the“Company”) Board of Directors (the “Board”), including amajority of the Independent Directors, approved the renewalof the Investment Advisory Agreements (the “AdvisoryAgreements”) between Tweedy, Browne Company LLC(“Tweedy, Browne”) and the Company on behalf of theTweedy, Browne Global Value Fund (the “Global ValueFund”), the Tweedy, Browne Value Fund (the “Value Fund”),the Tweedy, Browne Worldwide High Dividend Yield ValueFund (the “Worldwide High Dividend Yield Value Fund”)and the Tweedy, Browne Global Value Fund II – CurrencyUnhedged (the “Global Value Fund II”) (each a “Fund” andcollectively, the “Funds”) for an additional one-year term. Inconsidering whether to approve the continuance of theAdvisory Agreements, the Board reviewed materials providedfor its evaluation, and the Independent Directors were advisedby independent legal counsel with respect to these and otherrelevant matters. The information, material factors andconclusions that formed the basis for the Board’s approval aredescribed below.
A. Information ReceivedDuring the course of each year, the Board receives a wide
variety of materials relating to the services provided byTweedy, Browne. In considering whether to approve therenewal of the Advisory Agreements, the Board reviewedreports on each Fund’s investment results, portfoliocomposition, and portfolio trading practices, as well as other
information relating to the nature, extent and quality ofservices provided by Tweedy, Browne to the Funds. Inaddition, the Board reviewed supplementary information,including comparative industry data with regard to advisoryfees and expenses; financial and profitability informationregarding Tweedy, Browne; the Form ADV of Tweedy,Browne; sample reports demonstrating Tweedy, Browne’sextensive research process; fact sheets and performancehistories for each of the Funds since inception; informationfor several of Tweedy, Browne’s managed accountperformance composites; fee schedules; information regardingfees paid to intermediaries; information about the keypersonnel of Tweedy, Browne; and information concerningTweedy, Browne’s brokerage services and best executionpolicy.
In addition to reviewing and evaluating the list ofmaterials described above, the Independent Directors alsoreceived assistance and advice regarding legal and industrystandards from independent counsel to the IndependentDirectors. In deciding to recommend the renewal of theAdvisory Agreements, the Board did not identify any singlefactor or particular information that, in isolation, wascontrolling. This summary describes the most important, butnot all, of the factors considered by the Board.
B. Nature, Extent and Quality of ServicesThe Board reviewed materials concerning the depth and
quality of Tweedy, Browne’s investment management process.The Board considered a variety of services provided byTweedy, Browne to the Funds over the past year, including:providing “behind the scenes” services, such as those providedby Tweedy, Browne’s order desk, which seeks best prices andexecution for Fund portfolio transactions; monitoring theFunds’ service providers and performing shadowing functions;monitoring information with respect to corporatereorganizations involving the Funds’ portfolio companies;preparing the Funds’ semi-annual and annual reports toshareholders; monitoring certain aspects of transfer agencyservices on a daily basis; assisting brokers, consultants,financial advisors, intermediaries and third partyadministrators with questions or problems of an operationalnature; developing and enforcing procedures to monitortrading activity in the Funds; monitoring the collection ofredemption fees for the Global Value Fund, Worldwide HighDividend Yield Value Fund and Global Value Fund II;arranging for proxy voting of portfolio securities; activelymonitoring and assessing valuation issues for the Funds; andpreparing various regulatory filings for the Funds. The Boardnoted actions that have been or will be taken in the future byTweedy, Browne to comply with various new regulatoryrequirements, including, but not limited to, requirements withrespect to the Regulated Investment Company ModernizationAct of 2010, new “pay to play” rules for investment advisers,and shareholder cost basis reporting. The Board alsoconsidered that Tweedy, Browne had recently added
II-27

TWEEDY, BROWNE FUND INC.
Other Information (Unaudited)
additional staff in direct response to the increased accountingoversight responsibility resulting from the many regulatorychanges implemented over the last five years.
In addition, the Board noted that Tweedy, Browneprovides a wide variety of administrative services nototherwise provided by third party service providers, including:preparing Board reports; overseeing the preparation andsubmission of regulatory filings; assisting with the preparationand filing of the Funds’ tax returns; monitoring theregistration of shares of the Funds under applicable federaland state securities laws; assisting in the resolution ofaccounting and legal issues; establishing and monitoring theFunds’ operating budgets; processing the payment of theFunds’ bills; assisting the Funds in, and otherwise arrangingfor, the payment of distributions and dividends;communicating with the Funds’ shareholders through marketcommentary; participating in ongoing training and weeklymonitoring of BNY Mellon Investment Servicing (U.S.),Inc.’s shareholder services representatives; and generallyassisting the Funds in the conduct of their business.
The Board then noted that Tweedy, Browne also serves asthe Funds’ distributor and that it acts as the Funds’introducing broker for substantially all transactions in U.S.equity securities, for which it is reimbursed by the Funds onlyfor settlement costs. The Board noted that Tweedy, Brownedoes not charge the Funds any separate brokeragecommissions for such services, and the Board concluded thatthis arrangement benefits the Funds and their shareholders byprotecting the confidentiality of the Funds’ trading positions.The Board also considered Tweedy, Browne’s commitment tostaff development and long-term and contingency planningwith regard to its advisory business. The Board noted thatnotwithstanding the current market environment, Tweedy,Browne has not cut back on personnel or resources.
In considering Tweedy, Browne’s services, both inmanaging the Funds’ portfolios and in overseeing all areas ofthe Funds’ business, the Board concluded that Tweedy,Browne was providing essential services to the Funds, andthat it is likely that Tweedy, Browne will continue to be in aposition to do so for the long-term. Ultimately, the Boardconcluded that the nature, extent and quality of the servicesprovided by Tweedy, Browne have benefited and likely willcontinue to benefit the Funds and their shareholders.
C. Investment PerformanceThe Board examined the short-term and long-term
investment performance of each Fund, both in absolute termsand relative to the performance of perceived directcompetitors pursuing comparable investment objectives, aswell as to the various benchmarks against which the Fundswere compared. In considering the Global Value Fund’sperformance, the Board observed that the Fund had exhibitedexcellent absolute and relative performance, noting that theFund’s annualized rate of return of 9.83% from inception
through March 31, 2012 exceeded the returns of the MorganStanley Capital International Europe, Australasia and FarEast Index (“MSCI EAFE Index”) in both U.S. dollars andhedged currency for the same period. The Board consideredthat, over the long-term, the Global Value Fund’sperformance had enjoyed favorable performance whencompared to other funds in its peer group. The Board notedthat the aggregate total return for the Global Value Fund forthe 10-year period ended March 31, 2012 exceeded theMorningstar average of all funds in the Foreign Stock Fundscategory by 36 basis points per year. It was also noted that forthe past 3-year, 5-year and 10-year periods the Global ValueFund has been categorized as “low risk” by Morningstar’s RiskRatings, which means it is in the top 10% of funds within itscategory with respect to lowest measured risk. The Boarddiscussed the fact that the Funds’ management team wasnominated and considered for the Morningstar “Manager ofthe Year” award in 2008 and was named Morningstar’sInternational Manager of the Year in 2011 and The Street’s“Best Funds 2012” award winner in the category ofInternational Core Stock for its management of the GlobalValue Fund.
The Board then considered the Value Fund’sperformance, noting that the Fund had enjoyed good relativeperformance in most measurement periods in comparison toits relevant benchmark indices. In particular, the Board notedthat as of March 31, 2012, the Value Fund’s total returnsoutperformed the S&P 500 Index over the past 3-year, 5-year,10-year, 15-year and since inception periods. The Boardnoted that while comparisons to a very elite group of directcompetitors have mixed results, the Value Fund has held upwell in down market environments. The Board further notedthat the Value Fund outperformed its respected group of peersfor the past 5-year period, performed in line with its group ofpeers for the past 3-year period, and underperformed its groupof peers for the past 1-year and 10-year periods endingMarch 31, 2012. The Board also noted that the Value Fundhas also been characterized as “low risk” for the last 3-year,5-year and 10-year periods by Morningstar’s Risk Ratings. TheBoard considered that the Value Fund was a finalist in theGlobal Equity category for Standard & Poor’s Mutual FundExcellence Awards in 2010, which recognizes funds that haveachieved the highest overall ranking on the most consistentbasis during the previous year.
The Board examined the performance of the WorldwideHigh Dividend Yield Value Fund, noting that the Fundcommenced operations on September 5, 2007. The Boardnoted that since the Worldwide High Dividend Yield ValueFund’s inception date, the Fund has gained 7.9% compared toa gain of 6.9% for the MSCI World Index (in U.S. $). TheBoard examined data indicating that for the calendar year2008, the Worldwide High Dividend Yield Value Fundranked in the top 12% of all World Stock Funds in theMorningstar Principia Pro database and ranked first inLipper’s Global Large Cap Value Category. It was noted
II-28

TWEEDY, BROWNE FUND INC.
Other Information (Unaudited)
during 2009, the Worldwide High Dividend Yield Value Fundwas up 28.18% compared to a gain of 29.99% for the MSCIWorld Index (in U.S. $). The Board then considered thelong-term performance history of Tweedy, Browne’s GlobalHigh Dividend Strategy, which has been implemented byTweedy, Browne since 1979 and on which the WorldwideHigh Dividend Yield Value Fund’s investment strategy isbased. Since 1979, the Global High Dividend Strategy hasproduced compounded returns at an annualized rate of returnof 13.7% (net of actual and hypothetical fees) which hasoutpaced the S&P 500 Index and the MSCI World Index (inU.S. $), on an annualized basis over the same period, by2.20% and 4.10%, respectively.
The Board then examined the performance of the GlobalValue Fund II, noting that the Fund commenced operationson October 26, 2009. The Board noted that the Global ValueFund II has performed well since its inception, gaining19.22% compared to 5.56% for the MSCI EAFE Index (inU.S. $) for the period. The Board considered the performanceof the Global Value Fund, which is managed using the samephilosophy and approach as the Global Value Fund II, andTweedy, Browne’s unhedged international separate accounts,which provide substantive information about the ability andquality of Tweedy, Browne’s management team andjustification for the management of another internationalfund without a currency hedge. The Board considered thatTweedy, Browne’s International Equity Composite (in U.S.$), which has returns that are similar to those of the GlobalValue Fund, has outperformed the MSCI EAFE Index (inU.S. $) for the last 1-year, 3-year, 10-year, 15-year and sinceinception periods ending March 31, 2012. The Boardconsidered that a composite of Tweedy, Browne’s unhedgedinternational separate accounts has exhibited both goodabsolute and relative performance since inception in July1995. The composite’s annualized rate of return of 10.3%(after assumed fees and expenses) through March 31, 2012significantly exceeded relevant indices in both U.S. dollarsand hedged currency.
After reviewing each Fund’s performance relative to itsdirect competitors, comparable investment strategy (in thecase of the Worldwide High Dividend Yield Value Fund andGlobal Value Fund II), and to its benchmark indices overvarious periods of time, the Board concluded that it wassatisfied with each Fund’s performance, and further concludedthat Tweedy, Browne’s performance record in managing theFunds warranted the continuation of the AdvisoryAgreements.
D. Advisory Fees and Total ExpensesThe Board reviewed the advisory fees and total expenses
of the Funds, noting that each Fund pays an advisory fee of1.25% of assets under management. The Board comparedsuch amounts with the average fee and expense levels of fundspursuing comparable investment objectives. After reviewing
the Fund-specific fee and expense data, the Board consideredthe “hidden costs” of mutual funds associated with frequenttrading and related tax consequences.
In considering comparative fee data, the Board reviewedthe expense ratios for each Fund alongside those of its directcompetitors and of its relevant Morningstar category averages.The Board noted that the expense ratios of the Global ValueFund and Worldwide High Dividend Yield Value Fund,respectively, were lower than that of each Fund’s respectiveMorningstar category. The Board considered that the totalexpense ratios of the Global Value Fund and Value Fund,respectively, had declined since each Fund’s inception. TheBoard noted that with respect to the Worldwide HighDividend Yield Value Fund and Global Value Fund II, certainexpenses of each Fund had been partially reimbursed byTweedy, Browne since the Fund’s respective inception inorder to assist the Fund in attracting assets. This has resultedin keeping each Fund’s net expenses in line with the expenseratio of the Global Value Fund. The Board compared theadvisory fees paid by the Funds against Tweedy, Browne’sstandard fee rate for separate account portfolios. The Boardcompared the Funds’ expense ratios to funds that do notcharge Rule 12b-1 fees in excess of 0.25% of assets undermanagement.
After reviewing this fee and expense data, together withthe Board’s observation that Tweedy, Browne provided a highlevel of integrity and service to the Funds’ shareholders, theBoard determined that the fees charged under the AdvisoryAgreements are fair and reasonable.
E. Adviser Costs, Level of Profits and Economies ofScale
The Board reviewed information regarding Tweedy,Browne’s costs of providing services to the Funds, as well asthe resulting level of profits to Tweedy, Browne. In so doing,the Board reviewed materials relating to Tweedy, Browne’sfinancial condition and reviewed the wide variety of servicesand intensive research performed for the Funds. The Boardnoted that Tweedy, Browne has four full time employeesdevoted to the Funds and one employee who splits her timebetween the Funds and the Adviser. The Board alsoconsidered that, pursuant to a Service Agreement approvedannually by the Board, the Funds reimburse Tweedy, Browneon an at cost basis for certain legal compliance, shareholderservicing and fund accounting services performed by three ofthese full time employees. The Board reviewed profitabilitydata provided by Tweedy, Browne with respect to Tweedy,Browne’s relationship with the Company as a whole, and witheach Fund separately.
The Board considered Tweedy, Browne’s research processand, in particular, Tweedy, Browne’s research with respect tonon-U.S. securities. The Board also noted that a consequenceof Tweedy, Browne’s investment discipline for the GlobalValue Fund, Value Fund and Global Value Fund II, which
II-29

TWEEDY, BROWNE FUND INC.
Other Information (Unaudited)
focus on smaller and medium market capitalization issues, isthat its cost of research per dollar is likely to be higher thanwould be the case for an investment adviser that invests inconcentrated positions and/or only in larger marketcapitalization companies. The Board noted that this researchprocess is likely not conducive to economies of scale thatwould be potentially realizable in the management of largepools of capital invested in large market capitalization stocks.With respect to the Worldwide High Dividend Yield ValueFund, the Board noted that although the Fund has a higherproportion of large market capitalization holdings, Tweedy,Browne must still perform extensive research regardingcompanies that pay above-average dividends and that satisfy adifferent level of undervaluation than Tweedy, Brownerequires for the other Funds. The Board determined that suchresearch strategy would therefore not be less intensive or lessexpensive than that employed by Tweedy, Browne on behalfof the other three Funds. The Board concluded that Tweedy,Browne’s profitability from its client relationships, includingits relationship with the Funds, is reasonable.
F. Ancillary BenefitsThe Board considered a variety of other benefits received
by Tweedy, Browne as a result of its relationship with theFunds, including benefits derived by Tweedy, Browne from“soft dollar” arrangements with broker-dealers. The Boardconsidered materials concerning Tweedy, Browne’s brokerageallocation policies. The Board also reviewed Tweedy,Browne’s policies and procedures prohibiting the use ofbrokerage commissions to finance the distribution of fundshares.
G. ConclusionBased on its review, including consideration of each of the
factors noted above, the Board concluded that the nature,extent and quality of the services rendered to the Fundsfavored renewal of the Advisory Agreements. The Boardconcluded that the Advisory Agreements continued to be fairand reasonable to the Funds and their shareholders, that theFunds’ shareholders received reasonable value in return forthe advisory fees and other amounts paid to Tweedy, Browneby the Funds, and that the renewal of the AdvisoryAgreements at the present contractual rates was in the bestinterests of the Funds and their shareholders.
II-30

This page left blank intentionally.

This page left blank intentionally.


TWEEDY, BROWNE FUND INC.350 Park Avenue, New York, NY 10022
800-432-4789www.tweedy.com


![· Interim Report and Unaudited Accounts [1] Contents General Information 2 Chairman’s Letter to Shareholders 5 Investment Adviser’s Report 7 Statement of Net Assets 12 Three](https://static.fdocuments.net/doc/165x107/604b7f370098861141399dec/interim-report-and-unaudited-accounts-1-contents-general-information-2-chairmanas.jpg)