Investing in Oilfield Services and Equipment Discussion · · 2017-05-18Investing in Oilfield...
17
Investing in Oilfield Services and Equipment Discussion May 17, 2017
-
Upload
hoangxuyen -
Category
Documents
-
view
216 -
download
2
Transcript of Investing in Oilfield Services and Equipment Discussion · · 2017-05-18Investing in Oilfield...

Investing in Oilfield Services and Equipment Discussion May 17, 2017

SIMMONS & COMPANY INTERNATIONAL | ENERGY SPECIALISTS OF PIPER JAFFRAY 2
U.S. Commodity Outlook Shows Continued Recovery
¹ Source: Baker Hughes. As of May 12, 2017. ² Source: Spears and Associates. As of April 2017. ³ Source: Bloomberg. As of May 15, 2017.
Historical U.S. Land Rig Count¹
Projected U.S. Land Rig Count² Historical WTI Price³
Historical and Projected WTI Price and U.S. Land Rig Count (Rigs) ($/bbl)
Consensus WTI Projection³
1,724 1,796
1,842 1,856
1,354
876 833
728
515
397 465
567 734
843 864 877 933 1,005 1,043
1,069
$0.00
$20.00
$40.00
$60.00
$80.00
$100.00
$120.00
0
200
400
600
800
1,000
1,200
1,400
1,600
1,800
2,000
Q1'14
Q2'14
Q3'14
Q4'14
Q1'15
Q2'15
Q3'15
Q4'15
Q1'16
Q2'16
Q3'16
Q4'16
Q1'17
Q2'17
Q3'17
Q4'17
Q1'18
Q2'18
Q3'18
Q4'18

3 SIMMONS & COMPANY INTERNATIONAL | ENERGY SPECIALISTS OF PIPER JAFFRAY
OFS IPO Versus M&A Market
U.S. OFS IPO and M&A Activity (Number of U.S. OFS C-Corp IPOs)
¹ Source: Simmons, Capital IQ, Bloomberg and Dealogic. As of May 15, 2017. ² Includes deals where target is a U.S. company.
1
3
0
2
15
0
100
200
300
0
10
20
30
2013 2014 2015 2016 YTD 2017Annualized
Number of U.S. OFS C-Corp IPOs¹
Number of U.S. OFS M&A Transactions²
(Number of U.S. OFS M&A Transactions)

4 SIMMONS & COMPANY INTERNATIONAL | ENERGY SPECIALISTS OF PIPER JAFFRAY
OFS M&A Activity Has Been More Volatile Than Overall U.S. Since 2009
¹ Source: Simmons internal database. Includes deals where target is a U.S. company. ² Source: Institute for Merger, Acquisitions and Alliance (IMAA). Figures represent announced transactions.
U.S. OFS and Overall M&A Activity Since 2009
0
20
40
60
80
100
120
140
2009 2010 2011 2012 2013 2014 2015 2016
OFS M&A Activity¹
U.S. M&A Activity²
(Indexed to 100 as of 2009)

5 SIMMONS & COMPANY INTERNATIONAL | ENERGY SPECIALISTS OF PIPER JAFFRAY
$550 $545$505
$580$640
$705
$820
$0
$200
$400
$600
$800
$1,000
2010 2011 2012 2013 2014 2015 2016
NAM Dry Powder
Abundance of Dry Powder Remains To Invest In OFS Space
NAM Dry Powder¹ (Dollars in billions)
¹ Source: Preqin.
Energy Private Capital Raises and Dry Powder¹ (Dollars in billions)
$28$20
$34
$51$64 $67
$54
$20
$79$68 $72
$80
$100$115
$125
$145
$0
$40
$80
$120
$160
$200U.S.-Focused Energy Private Capital Raises
Energy-Focused Dry Powder

6 SIMMONS & COMPANY INTERNATIONAL | ENERGY SPECIALISTS OF PIPER JAFFRAY
Pre-IPO Net Debt:
$81.4 million
Eight OFS IPOs Have Priced Since Downturn¹
Pre-IPO Net Debt²:
$94.2 million
Pre-IPO Net Debt:
$235.3 million
Pre-IPO Net Debt:
$45.8 million
Pre-IPO Net Debt:
$11.0 million
Pre-IPO Net Debt:
$70.9 million
2016A EBITDA:
$41.2 million
2016A EBITDA:
$28.3 million
2016A EBITDA:
$0.4 million
2016A EBITDA:
$7.5 million
2016A EBITDA:
$16.6 million
2016A EBITDA:
$8.9 million
Share Price Performance
Since IPO:
28%
Share Price Performance
Since IPO:
21%
Share Price Performance
Since IPO:
(24)%
Share Price Performance
Since IPO:
(7)%
Share Price Performance
Since IPO:
9%
Share Price Performance
Since IPO:
24%
¹ Source: Capital IQ. As of May 15, 2017. EBITDA excludes share-based compensation. ² Includes redeemable Series A Preferred Stock.
Pre-IPO Net Debt:
$(0.4) million
Pre-IPO Net Debt:
$2,556.0 million
2016A EBITDA:
$6.8 million
2016A EBITDA:
$337.2 million
Share Price Performance
Since IPO:
(2)%
Share Price Performance
Since IPO:
10%

SIMMONS & COMPANY INTERNATIONAL | ENERGY SPECIALISTS OF PIPER JAFFRAY 7
Review of Recent M&A Activity
has announced the accquisition of
has announced the accquisition of
has announced a Joint Venture with
has agreed to acquire
has acquired
has announced the accquisition of
Three Jackup Drilling Rigs from
has announced the accquisition of
has agreed to acquire
Pending Pending Pending Pending May 2017 May 2017 April 2017 April 2017
has acquired
(Arsenal Capotal Partners)
has acquired
Private Regional Sand Produced and Affilied Proppanted Logistics
Companies
have raised minority interest equity capital
has acquired
has acquired
Permian Basin Sand
has been acquired by
has acquired
GRR Entities
has acquired the Pipeline and Chemicals division
of
April 2017 April 2017 March 2017 March 2017 March 2017 March 2017 March 2017 February 2017
has acquired majority interest in
has made an equity investment in
has acquired Directional Drilling & LWD Technology
from
has acquired the Equipment and Response
business of
has acquired
has acquired
has been acquired by
has been acquired by
SPL Holdings
February 2017 January 2017 January 2017 January 2017 January 2017 October 2016 October 2016 September 2016

SIMMONS & COMPANY INTERNATIONAL | ENERGY SPECIALISTS OF PIPER JAFFRAY 8
OFS High Yield Activity Is Making A Comeback
$0
$2,000
$4,000
$6,000
$8,000
$10,000 Loan Volume ($ millions) HY Volume ($ millions)
Source: LCD and Bloomberg.
Oil & Gas High Yield vs. Loan Volume Since January 2016
SIMMONS & COMPANY INTERNATIONAL | ENERGY SPECIALISTS OF PIPER JAFFRAY 9
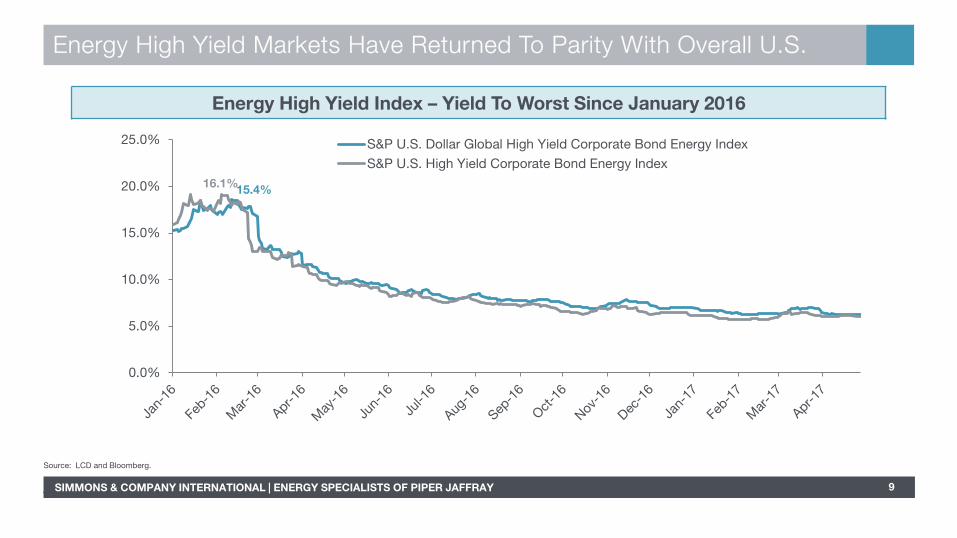
Energy High Yield Markets Have Returned To Parity With Overall U.S.
15.4% 16.1%
0.0%
5.0%
10.0%
15.0%
20.0%
25.0% S&P U.S. Dollar Global High Yield Corporate Bond Energy Index
S&P U.S. High Yield Corporate Bond Energy Index
Source: LCD and Bloomberg.
Energy High Yield Index – Yield To Worst Since January 2016

SIMMONS & COMPANY INTERNATIONAL | ENERGY SPECIALISTS OF PIPER JAFFRAY 10
Pace Of Oilfield Services Bankruptcies Has Slowed In Recent Months
1 4 6 7 9 15 16 19
26 31 34
39 41 44 53
61 70
79 85
93 99
108 109 111 117 119
124 127
0
20
40
60
80
100
120
140
2015-2017 Cumulative North American Oilfield Services Bankruptcy Filings¹
¹ Source: Haynes and Boone. As of May 2017.

SIMMONS & COMPANY INTERNATIONAL | ENERGY SPECIALISTS OF PIPER JAFFRAY 11
Total OFS Bankruptcy Debt Exceeds $27 Billion
$252 $350 $424
$3,348$4,944
$7,471
$9,413$11,110
$16,423$17,323
$169 $193$1,567
$1,964$2,787
$4,638 $5,093
$7,687
$9,425 $10,040
$421 $543
$1,991
$5,312
$7,732
$12,109
$14,506
$18,797
$25,848$27,363
$0
$5,000
$10,000
$15,000
$20,000
$25,000
$30,000
Q1 '15 Q2 '15 Q3 '15 Q4 '15 Q1 '16 Q2 '16 Q3 '16 Q4 '16 Q1 '17 Q2 '17
Secured Debt
Unsecured Debt
Total Debt
2015-2017 Cumulative North American Oilfield Services Bankruptcy Debt¹ (Dollars in millions)
¹ Source: Haynes and Boone. As of May 2017.

SIMMONS & COMPANY INTERNATIONAL | ENERGY SPECIALISTS OF PIPER JAFFRAY 12
Previously Bankrupt OFS Companies Are Relisting
12/15 – Emerged from bankruptcy
Approximately $694 million of debt was eliminated through Chapter 11
$250 million of debt remains on the balance sheet
12/16 – Resumed trading on the NYSE
1/6 – Emerged from bankruptcy
Eliminated $1.4B in debt through Chapter 11
Raised $200 million through rights offering to retire debtor-in-possession financing
3/6 – Resumed trading on the NYSE
12/23 – Emerged from bankruptcy
Raised $125 million of new capital and debt level reduced by $775 million
12/27 - Resumed trading on the NYSE
3/11 – Entered into restructuring support agreement with senior notes holders
5/1 – Filed Chapter 11 petition for reorganization
Post Chapter 11 Post Chapter 11 Post Chapter 11 Chapter 11 Chapter 11
1/22 – Commenced voluntary reorganization under Chapter 11
Anticipate exchanging $280 million of debt for equity
3/29 – Court approval of Chapter 11 plan
4/13 – Chapter 11 effective date

13 SIMMONS & COMPANY INTERNATIONAL | ENERGY SPECIALISTS OF PIPER JAFFRAY
E&P Capital Spending Budgets Are Expanding
¹ Source: Spears and Associates.
$77.2
$90.1$99.6
$112.0
$77.5
$43.3
$85.6
$108.6
$130.9
$144.4 $148.8
$0.0
$20.0
$40.0
$60.0
$80.0
$100.0
$120.0
$140.0
$160.0 Historical Drilling and Completion Spend
Projected Drilling and Completion Spend
Historical and Projected U.S. Drilling and Completion Spending¹

14 SIMMONS & COMPANY INTERNATIONAL | ENERGY SPECIALISTS OF PIPER JAFFRAY
$0
$10
$20
$30
$40
$50
$60
$70
$80
$90
$100Breakeven (Assumes 30% IRR)
Current WTI Price ($48.85)²
WTI Breakeven By Oil Play¹ (Dollar amounts in millions)
Permian Basin Plays
¹ Source: Simmons Research. ² Source: Bloomberg. As of May 15, 2017.

15 SIMMONS & COMPANY INTERNATIONAL | ENERGY SPECIALISTS OF PIPER JAFFRAY
0
50
100
150
Jun-14 Sep-14 Dec-14 Mar-15 Jun-15 Sep-15 Dec-15 Mar-16 Jun-16 Sep-16 Dec-16 Mar-17
Permian E&P Index² E&P Index (Ex. Permian)³
(8)%
(76)%
Permian E&P Has Outperformed Non-Permian E&P During Downturn
68% Outperformance
(Indexed to 100 Since June 1, 2014)
Indexed Performance Since June 1, 2014¹
¹ Source: Capital IQ. As of May 15, 2017. ² Includes: Approach Resources, Concho Resources, Callon Petroleum, Diamondback, Energer, Laredo Petroleum, Parsley Energy, Pioneer Natural Resources, RSP Permian and Cimarex. ³ Includes U.S. E&P operators excluding those included in Permian E&P index.

16 SIMMONS & COMPANY INTERNATIONAL | ENERGY SPECIALISTS OF PIPER JAFFRAY
0%
10%
20%
30%
40%
50%
60%
70%
80%
90%
100%
$0
$1,000
$2,000
$3,000
$4,000
$5,000
$6,000
$7,000 PermianAll Other²% Permian
Permian Basin Has Dominated E&P Capital Raising
Public Equity Capital Raised By Area¹ (Dollar amounts in millions)
¹ Source: Capital IQ. As of May 15, 2017. ² Includes DJ Basin, Appalachia, Eagle Ford, Bakken, Diversified, Mid-Con, MLP.

Piper Jaffray Companies (NYSE: PJC) is a leading investment bank and asset management firm. Securities brokerage and investment banking services are offered in the U.S. through Piper Jaffray & Co., member SIPC and FINRA; in Europe through Piper Jaffray Ltd. and Simmons & Company International Limited, authorized and regulated by the U.K. Financial Conduct Authority; and in Hong Kong through Piper Jaffray Hong Kong Limited, authorized and regulated by the Securities and Futures Commission. Asset management products and services are offered through five separate investment advisory affiliates―U.S. Securities and Exchange Commission (SEC) registered Advisory Research, Inc.; Piper Jaffray Investment Management LLC, PJC Capital Partners LLC and Piper Jaffray & Co.; and Guernsey-based Parallel General Partners Limited, authorized and regulated by the Guernsey Financial Services Commission.
For information on other Piper Jaffray locations,
visit piperjaffray.com Locations: Houston | Aberdeen | London