
Investing in liquid alternative...
37
For professional investors or advisers only. Andrew Dreaneen Head of Schroder GAIA Product & Business Development Investing in liquid alternative strategies Trends & Morningstar Investment Summit 9 March 2016
Transcript of Investing in liquid alternative...

For professional investors or advisers only.
Andrew Dreaneen Head of Schroder GAIA Product & Business Development
Investing in liquid alternative strategies
Trends & Morningstar Investment Summit 9 March 2016

Agenda
Trends in Alternatives
Introducing Schroders capabilities in liquid alternatives
Leading blue-chip hedge fund managers
Main reservations and dispelling the myths
The power of diversifying returns streams
Conclusions
1

Trends in Alternatives

Why liquid alternatives now?
3
Source: MSCI December 2015
Global stress points/ downside risks for investors 2016
US Election Rate
Increases
Oil Glut
Commodities EM Hangover
Brexit
QE Effectivenes
s
EU Integration
Middle East Tensions
Russia Expansion
China Growth
Yuan Devaluation
South China Sea tension

Oil Has Really Collapsed
4
Source: Bloomberg January 2016
Wow, US oil is really cheap

China’s slowing growth has crushed shipping rates
5
Source: Bloomberg, Baltic Exchange, Supercarexperiences.com January 2016
It is now cheaper to rent a 1,100 foot dry bulk tanker than a Ferrari
($5,597)
($1,563)

KKR
Why liquid alternatives now? Liquid alternatives have mitigated losses in recent sell-offs
6
Source: Bloomberg as at 31 January 2016. Performance shown from 31 December 2014 to 31 January 2016. All GAIA performance is shown for the C Acc share class in base currency. Performance is calculated on an NAV to NAV basis.
Egerton Sirios
BSP
85
90
95
100
105
Jun-15 Aug-15 Oct-15 Dec-15
Schroder GAIA BSP Credit Merrill Lynch HY Index
3.63%
85
90
95
100
105
110
115
Dec-14 Feb-15 Apr-15 Jun-15 Aug-15 Oct-15 Dec-15
Schroder GAIA Egerton Equity MSCI World
-8.63% 90
95
100
105
110
Dec-14 Feb-15 Apr-15 Jun-15 Aug-15 Oct-15 Dec-15
Schroder GAIA Sirios US Equity
S&P 500 Net Total Return
-1.01%
-4.29%
85
90
95
100
105
110
Dec-14 Feb-15 Apr-15 Jun-15 Aug-15 Oct-15 Dec-15
Schroder GAIA KKR Credit Credit Suisse HY Index
-2.51%
-6.51%
-1.25%
-8.79%
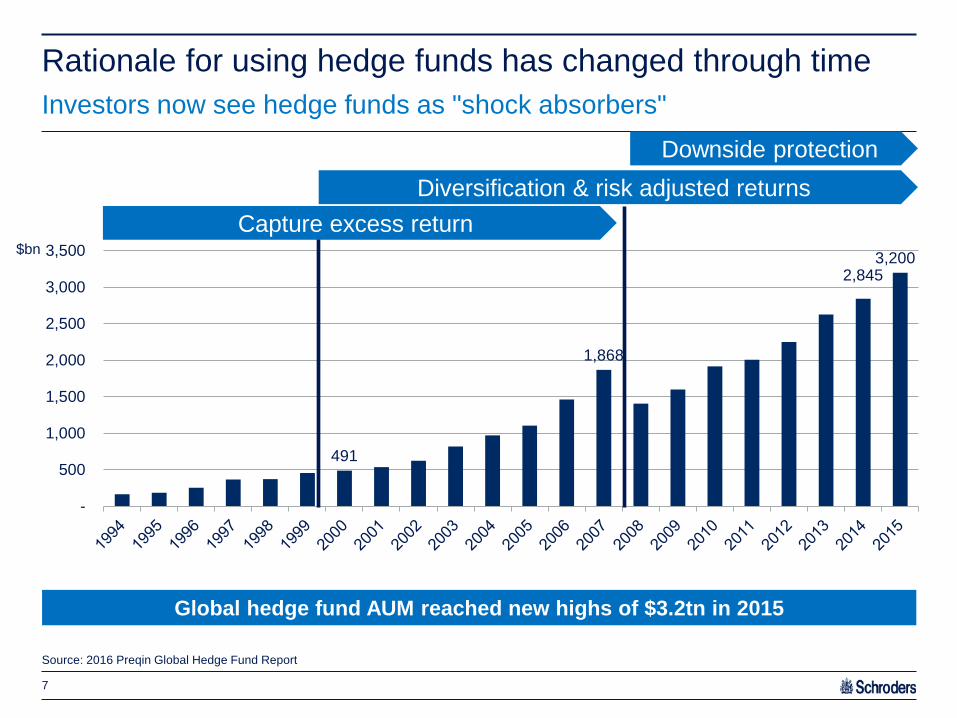
Rationale for using hedge funds has changed through time Investors now see hedge funds as "shock absorbers"
Source: 2016 Preqin Global Hedge Fund Report
Global hedge fund AUM reached new highs of $3.2tn in 2015
$bn
491
1,868
2,845 3,200
-
500
1,000
1,500
2,000
2,500
3,000
3,500
7
Capture excess return Diversification & risk adjusted returns
Downside protection

European Investors have > $800bn invested in hedge funds Investor sentiment now strongly in favour of UCITS and non UCITS AIFs
8
UCITS Liquid Alternatives
Liquid, regulated European onshore fund structure that can be used for alternatives
Harmonised format that can be ‘passported’ across Europe for distribution purposes
Suitable for sale to retail as well as professional investors
3.
2.
Non-UCITS Onshore Fund
New onshore structures post-AIFMD implementation; less stringent regulation than UCITS funds
Structures include QIAIF, RIAIF, PIF (Ireland); Part II, SIF, SICAR (Lux); some formats (e.g. RIAIF) may be suitable for sale to retail investors
Still largely unproven as a concept for HF managers
$204bn
$60bn (est.)
$2.9tn
Hedge Fund Vehicles Total AUM AUM from European Investors
1.
Offshore Hedge Fund
Offshore, unregulated HF vehicle
Most popular pre-2008/9, but comparatively low demand in Europe in recent years
AIFMD regulations have made the marketing of offshore HFs more challenging
$164bn
Source: HFR, HFI, Central Bank of Ireland, McKinsey “The Mainstreaming of Alternative Investments” (2011), Barclays Strategic Consulting estimates and analysis
$60bn (est.)
$600bn

Who are the buyers of liquid alternatives today? The main buyers are private banks/ wealth managers with demand broad-based
9
Source: Estimates based on data from Lipper, ICI, Mercer, Towers Watson, Insurance Europe, The Consulting Partnership AG, BCG, PWC, Strategic Consulting Proprietary Market Sizing Model. Individual numbers may not match sums due to rounding. AUM on a ‘look-through’ basis – i.e. disregarding FOFs, consultants and advisers. As at September 2015.
6 3 3
1 1
3
3
1
1
1 1
1
1 8
2
5 1
1
22
6 11
25
5
1
8
3
5
5
6
1
2
2
8
7
3 3 1
1
0%
10%
20%
30%
40%
50%
60%
70%
80%
90%
100%
UK France Germany / Austria Switzerland Italy / Spain Nordics Benelux
Mass Affluent E&F Family Office Private Banks Pension Insurance
41 18 27 40 17 7 14 $bn

Future expected investor behaviour Where is the growth expected to come from?
Source: Barclays, October 2015. Barclays Strategic Consulting estimates and analysis. 1. For offshore buyers includes amount of continued allocation to offshore funds as well as UCITS funds. Estimated long-term potential based on analysis of total investable assets and likely appetite for HFs/UCITS going forwards
There are three main constituencies of buyers for HF strategies in Europe; we estimate that those that only invest in UCITS could become the majority of AUM over time
10
‘Crossover’ Current
Offshore HF Buyers
Investors
$200bn
$600bn1
$750bn
‘Migration’ Former
Offshore HF Buyers
‘Entrant’ New
Alternatives Buyers
Comments Key Channels Est. Potential Asset Pool1
Investors with no prior HF investments getting exposure to alternatives through UCITS
Includes retail investors as well as some institutions
Potentially the largest asset pool but growth still uncertain
Investors with prior offshore HF exposure now using UCITS structures
Driven by mixture of preference for the format and regulatory pressures
Significant regional skew towards certain countries, particularly Southern Europe
Market for offshore HFs in Europe is stagnant, with limited growth potential
However, many of the buyers of offshore HFs in Europe also invest in UCITS funds
UCITS vehicle may be chosen if it is the only available option or offers superior terms to offshore vehicle
Local/retail banks Financial advisors/IFAs Distribution platforms Small institutional investors Wealth managers
Private banks Wealth managers/multi-family offices Certain institutions (e.g. insurance) FOFs
Family offices Institutions Private banks FOFs

Exam
ples
93.2 60.1 50.6
58 207 185
45.7% 29.5% 24.8%
Who are the main providers of liquid alternatives today?
Hedge Fund Managers Long Only Asset Managers Convergence Asset Managers
# Pr
oduc
ts
Source: HFR, HFI, Strategic Consulting analysis
AUM
(USD
bn)
11
Using distribution capabilities to build alternatives businesses Marketing HF expertise to UCITS investor base
AUM dominated by Asset Managers 75%: but Hedge Fund Managers now 25%
% A
UM

Introducing Schroders capabilities in liquid alternatives

Schroders AUM breakdown Broad liquid alternatives capability within the firm
13
Source: Schroders, as at 30 June 2015
GAIA
Liquid Alternatives
UCITS Funds
Firm AUM
$6bn
$18bn
$156bn
$487bn

Internally managed • Schroder ISF European Equity
Absolute Return • Schroder ISF European Alpha
Absolute Return* • Schroder ISF European Total Return • Schroder ISF Asian Total Return* Externally managed • Schroder GAIA Egerton Equity* • Schroder GAIA Sirios US Equity • Schroder GAIA Paulson Merger
Arbitrage
Schroders’ liquid alternatives capabilities Total AUM of Schroders liquid alternatives is $18.2bn
14
Source: Schroders as at 30 June 2015. * Fund is hard closed. Schroder ISF: Schroder International Selection Fund. Schroder IF: Schroder Investment Fund
Internally managed • Schroder ISF Strategic Bond • Schroder ISF Asian Bond Absolute
Return • Schroder ISF Emerging Marlets Debt
Absolute Return Externally managed • Schroder GAIA BSP Credit • Schroder GAIA KKR Credit
Internally managed • Schroder ISF Global Property
Securities • Schroder ISF Asia Pacific Property
Securities • Schroder IF Flexible Cat Bond

UCITS hedge fund platforms
15
Source: Kepler Partners LLP as at December 2015
Investment Bank Platforms Asset Manager Platforms Independent/Boutique Platforms
Deutsche Bank Banor Alceda UCITS Platform
Goldman Sachs E.I. Sturdza Strategic Management Ltd Alpha UCITS
Merrill Lynch Investment Solutions Guggenheim Altex UCITS
Morgan Stanley FundLogic Hedge Invest Bryan Garnier
SEB Prime Solutions UCITS HDF Rothschild Dexion
Lyxor Asset Management Independent UCITS
Schroder GAIA Gateway
Tages Milltrust EMMA Platform
Montlake UCITS Platform
SIG Global
Trium
Universal Investments

Source: Schroders as at 30 September 2015. *Hard closed.
Schroder GAIA Overview of sub-funds
Launch date
Manager Fund Strategy Geographic focus AUM (USD)
25 Nov 2009 Schroder GAIA Egerton Equity* Equity long short Global 1,399m
27 Feb 2013 Schroder GAIA Sirios US Equity Equity long short Predominantly US 2,003m
6 Nov 2013 Schroder GAIA KKR Credit Credit long short Predominantly Europe 293m
25 Jun 2014 Schroder GAIA Paulson Merger Arbitrage Merger Arbitrage US, Canada and
Western Europe 950m
17 Jun 2015 Schroder GAIA BSP Credit Credit long short Predominantly US 34m
9 Dec 2015 Schroder GAIA BlueTrend Trend Following Global 96m
16
Total AUM 5,533m
Source: Schroders as at 31 January 2016 *Hard closed.

Alternative UCITS platforms GAIA compares favourably against its competitors
Number of
external funds on platform
AUM (USD m)
Average AUM per
fund (USD m)
Schroders 6 4,775 795
BAML 16 6,276 392
HDF Rothschild 3 1,286 429
Deutsche Bank 11 3,686 335
Lyxor 8 1,533 192
Morgan Stanley 18 2,419 134
Goldman Sachs 4 524 131
Guggenheim 1 175 175
Alpha UCITS 5 384 77
Montlake 9 546 61
17
Source: Kepler. As at 31 January 2016. Data refers to external managers for each platform. This is collected on a best efforts basis and there could be omissions
“When trying to identify the quality of each platform we believe that AuM per fund is one of the most telling statistics. Schroder GAIA once again takes the leading spot by a significant margin with $795m invested in the average fund on its platform, reflecting the quality of the hosted funds and their impressive distribution capabilities.” Kepler
Schroders
$-
$1,000
$2,000
$3,000
$4,000
$5,000
$6,000
$7,000
0 5 10 15 20
Number of Funds
AUM (USD)

Leading blue-chip hedge fund managers

0%
500%
1000%
1500%
2000%
1994
1995
1996
1997
1998
1999
2000
2001
2002
2003
2003
2004
2005
2006
2007
2008
2009
2010
2011
2012
2013
2014
2014
2015
Schroder GAIA Egerton Equity Strategy MSCI World
Independent money management firm based in London, founded in 1994 by John Armitage
Experienced investment team of 16 professionals Employee investments account for c. 7% of total firm assets Key to success is research-intensive stock picking. ‘Bottom-up’
approach to stock selection creates a portfolio that is dynamic, eclectic, and uncorrelated
The strategy aims to deliver equity type returns with less volatility than the market over the medium to long term
Egerton Capital Limited: AUM $13.7bn Performance objective
Schroder GAIA Egerton Equity Equity long short fund with significant outperformance over time
19
Source: Schroders and Egerton as at 31 January 2016. *Performance shown for chain-linked track record of Egerton long short Equity B1 USD since its inception on 31 December 1994. Egerton’s offshore fund has been used from December 1994 to November 2009. From December 2009 onwards Schroder GAIA Egerton Equity C Acc USD Hedged has been used. The MSCI Europe Index has been used from December 1994-January 2012, from February 2012-onwards the MSCI World Index is used. . Performance is shown net of fees, NAV to NAV.
Performance analysis (Egerton’s equity long short strategy*)
Fundamental long short equity fund, typically long-biased Straightforward, liquid strategy investing predominantly in large cap
equities Opportunistically invest in corporate bonds Uses little or no leverage Reduces volatility through the use of alpha shorts, hedges (e.g. index
put options) and cash Avoids large drawdowns
Fund key features
Strategy* Index
Annualised return 13.7% 7.4%
Annualised volatility 9.6% 15.4%
Sharpe ratio 1.1 0.3
Maximum drawdown -28.3% -50.9%
Portfolio Manager John Armitage, Egerton
Inception date 25 November 2009
Base currency EUR
Institutional share class fee 1.25%/20%
Liquidity Weekly (on Wed) and month end

-100%
0%
100%
200%
300%
400%
1999 2001 2003 2005 2007 2009 2011 2013 2015
Schroder GAIA Sirios US Equity Strategy S&P 500
Boston based US focused firm co-founded by John Brennan in 1999 Experienced team of 15 investment professionals Employee investments account for a significant percentage of total
firm assets Ability to analyse and invest across the capital structure for best risk-
adjusted returns
The strategy aims to deliver equity type returns with less volatility than the market over the medium to long term
Sirios Capital Management: AUM $3.5bn Performance objective
Schroder GAIA Sirios US Equity US equity long short fund with demonstrated downside protection
20
Source: Schroders and Sirios as at 31 January 2016. *Performance shown for Sirios Overseas Fund Limited in USD. Sirios’ offshore fund has been used from July 1999 to February 2013 . From March 2013 onwards Schroder GAIA Sirios US Equity C Acc USD has been used. . Performance is shown net of fees, NAV to NAV.
Performance analysis (Sirios equity long short strategy*)
Fundamental long short equity fund, typically long-biased Invests primarily in US mid/large-cap companies with material
exposure in Asia and Europe Opportunistic exposure to fixed income for equity-like returns with
lower risk Identifies attractively valued, growth-oriented companies for longs;
shorts in companies with deteriorating fundamentals and poor balance sheets
Moderate use of leverage Low correlation to equity markets Low downside participation
Fund key features
Strategy* Index
Annualised return 8.6% 3.9%
Annualised volatility 9.0% 15.1%
Sharpe ratio 0.71 0.11
Maximum drawdown -19.3% -50.9%
Portfolio Manager John Brennan, Sirios
Inception date 27 February 2013
Base currency USD
Institutional share class fee 1.50%/20%
Liquidity Daily
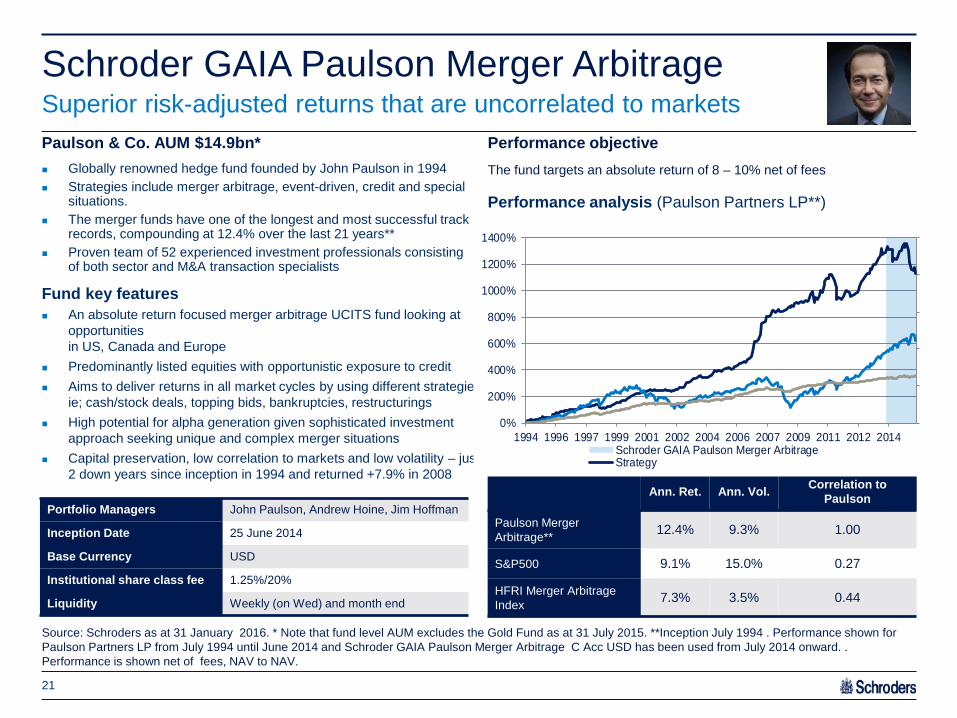
Globally renowned hedge fund founded by John Paulson in 1994 Strategies include merger arbitrage, event-driven, credit and special
situations. The merger funds have one of the longest and most successful track
records, compounding at 12.4% over the last 21 years** Proven team of 52 experienced investment professionals consisting
of both sector and M&A transaction specialists
The fund targets an absolute return of 8 – 10% net of fees
Paulson & Co. AUM $14.9bn* Performance objective
Schroder GAIA Paulson Merger Arbitrage Superior risk-adjusted returns that are uncorrelated to markets
21
Source: Schroders as at 31 January 2016. * Note that fund level AUM excludes the Gold Fund as at 31 July 2015. **Inception July 1994 . Performance shown for Paulson Partners LP from July 1994 until June 2014 and Schroder GAIA Paulson Merger Arbitrage C Acc USD has been used from July 2014 onward. . Performance is shown net of fees, NAV to NAV.
Performance analysis (Paulson Partners LP**)
An absolute return focused merger arbitrage UCITS fund looking at opportunities in US, Canada and Europe
Predominantly listed equities with opportunistic exposure to credit Aims to deliver returns in all market cycles by using different strategies.
ie; cash/stock deals, topping bids, bankruptcies, restructurings High potential for alpha generation given sophisticated investment
approach seeking unique and complex merger situations Capital preservation, low correlation to markets and low volatility – just
2 down years since inception in 1994 and returned +7.9% in 2008
Portfolio Managers John Paulson, Andrew Hoine, Jim Hoffman
Inception Date 25 June 2014
Base Currency USD
Institutional share class fee 1.25%/20%
Liquidity Weekly (on Wed) and month end
Ann. Ret. Ann. Vol. Correlation to Paulson
Paulson Merger Arbitrage** 12.4% 9.3% 1.00
S&P500 9.1% 15.0% 0.27
HFRI Merger Arbitrage Index 7.3% 3.5% 0.44
Fund key features
0%
200%
400%
600%
800%
1000%
1200%
1400%
1994 1996 1997 1999 2001 2002 2004 2006 2007 2009 2011 2012 2014Schroder GAIA Paulson Merger ArbitrageStrategy

Portfolio Manager Simon Thorp and James Sclater, KKR
Inception date 06 November 2013
Base currency EUR
Institutional share class fee 1.25%/15%
Liquidity Weekly (on Wed) and month end
The KKR Credit Alpha strategy is a directional long/short liquid European credit strategy.
It invests primarily in liquid high yield and low investment grade fixed income securities and derivatives (bonds, CDS, credit indices and credit options).
KKR Credit Long Short team is one of the most established in Europe Dedicated team of 6 experienced investment professionals
The fund targets an absolute return of 7-10% net of fees KKR Credit Advisors (UK) AUM: c.$26.4bn* Performance objective
Schroder GAIA KKR Credit Low net credit long short fund investing predominately in Europe
22
Source: Schroders as at 31 January 2016. KKR & Co. L.P. acquired Avoca Capital on 19 February 2014. * AUM as at 31 December 2015 **Performance shown for KKR’s credit long short strategy: From 11 November 2000 until 31 October 2013 the KKR Credit Alpha Fund has been used. From 1 November 2013 to 6 November 2013 a net estimate of the KKR Credit Alpha fund has been used. From 7 November 2013 onwards performance is for Schroder GAIA KKR Credit C Acc EUR. . Performance is shown net of fees, NAV to NAV.
Performance analysis (KKR credit long short strategy**)
An absolute return focused credit long short UCITS fund Investment grade and high yield exposure predominately in Europe Aims to identify companies with improving or deteriorating capacity to
service their debt, where that change is not reflected in their current pricing
Deep dive credit research and value investing approach Best-in-class technology at the centre of the credit process “All weather” positive returns through the cycle, the strategy has had
no down years in last decade
Fund key features
Ann. Ret. Ann. Vol. Sharpe ratio
Strategy** 7.1% 6.9% 0.8
IBOXX Liquid HY 5.0% 10.3% 0.3
Barclays Gbl. Agg. 5.0% 2.7% 1.1
MSCI World 2.7% 14.5% 0.1
-50%
0%
50%
100%
150%
200%
250%
2000200120022003200420052006200720082009201020112012201320142015
Schroder GAIA KKR Credit

Benefit Street Partners (BSP) was established in 2008 and manages over $10 billion in assets
Multi-strategy credit specialist including high yield, levered loans, private/opportunistic debt, liquid credit, structured credit and commercial real estate debt
Team of 59 investment professionals BSP is the debt investment arm of Providence Equity with AUM of
$45bn
The fund targets an absolute return of 5 – 7% net of fees
Investment Manager: AUM $11.0bn* Performance objective
Schroder GAIA BSP Credit Low net credit long short fund investing predominately in US
23
The BSP Credit Long Short Strategy includes BSP Credit Alpha Fund and a separately managed account (SMA) following a similar strategy. Performance is shown net of fees. From 7 February 2011 to 1 March 2012, the performance is for SMA, from 1 March 2012 until June 2015 for the BSP Credit Alpha Fund, and from July 2015 onwards for Schroder GAIA BSP Credit C Acc USD. *As at 31 September 2015. Source: Schroders, BSP, Bloomberg, Merrill Lynch as at 31 October 2015. . Performance is shown net of fees, NAV to NAV.
Performance analysis (Cayman hedge fund)
Based on an existing Cayman hedge fund with $1.4 billion AUM, which includes ~$110 million from employees
Targets 5-7% net return with low volatility, low correlation Aims to provide capital growth through investment worldwide, with at
least 51% of the Fund invested in US companies Absolute return approach combining fundamental credit analysis Sophisticated trade structuring and active trading to maximize
expected return while limiting downside risk across market cycles Strategies employed include fundamental longs/shorts, relative
value pair trades and capital structure arbitrage
Portfolio Manager Thomas Gahan
Inception date 17 June 2015
Base currency USD
Institutional share class fee 1.50%/20% over Libor capped at 2% 1.00%/15% over Libor capped at 2% (early bird up to $80m)
Liquidity Weekly (on Wed) and month end
Fund key features
Annualised return 4.7%
Annualised volatility 3.4%
Max drawdown -5.3%
0%
5%
10%
15%
20%
25%
30%
35%
Feb-
11M
ay-1
1A
ug-1
1N
ov-1
1Fe
b-12
May
-12
Aug
-12
Nov
-12
Feb-
13M
ay-1
3A
ug-1
3N
ov-1
3Fe
b-14
May
-14
Aug
-14
Nov
-14
Feb-
15M
ay-1
5A
ug-1
5N
ov-1
5

-50%
0%
50%
100%
150%
200%
250%
300%
Jan-
04A
ug-0
4M
ar-0
5O
ct-0
5M
ay-0
6D
ec-0
6Ju
l-07
Feb-
08S
ep-0
8A
pr-0
9N
ov-0
9Ju
n-10
Jan-
11A
ug-1
1M
ar-1
2O
ct-1
2M
ay-1
3D
ec-1
3Ju
l-14
Feb-
15S
ep-1
5
BlueTrend Barclays Global Aggregate Bond Index
HFRI Fund Weighted Composite Index MSCI World
Systematica founded in January 2015 after a decade of experience within BlueCrest Capital Management
Systematica manage total assets of $9.0bn, with $7.2bn in their trend-following strategy
Investment team headed by Leda Braga, former President and Head of Systematic Trading at BlueCrest Capital Management
The fund aims to provide capital growth by adopting a pure systematic trend following strategy, across global markets, based on quantitative signals with multiple time horizons. It targets returns of 10-15%.
Investment Manager: AUM $9.0bn Performance objective
Schroder GAIA BlueTrend Diversified Systematic Macro Trend Following Strategy
24
Source: Systematica Investments and Schroders, as at 31 January 2016. Managed by BlueCrest Capital Management Group from inception to 1 January 2015 when Systematica Investments Limited (acting in its capacity as general partner of Systematica Investments LP) became the investment manager. *BlueTrend strategy refers to an SMA from January 2004 to March 2004 and BlueTrend Fund Limited (Class A USD) from 1 April 2004 to 31 December 2015. From 1 January 2016 onwards performance is provided for Schroder GAIA BlueTrend C Acc USD. Performance for Barclays Global Aggregate Bond Index and HFRI Fund Weighted Composite Index as at 31 December 2015. Performance is shown net of fees, NAV to NAV.
Performance analysis (BlueTrend strategy*)
Diversified systematic trend following fund, launched in April 2004 Extremely competitive track record with average annualised return
of 11%, with 14% annualised volatility Positive in 9 out of the past 10 years Uncorrelated returns over time/delivered positive returns in both up
and down markets Performed well in periods of prolonged market downturns like 2008 Trades the most liquid assets among equity, currency, commodity
and fixed income
Strategy
Annualised return 11.2%
Annualised volatility 14.1%
Maximum drawdown -22.1%
Investment team Head Leda Braga
Inception date 9 December 2015
Base currency USD
Institutional share class fee 1.50%/20%
Liquidity Weekly (on Wed) and month end
Fund key features

Main reservations and dispelling the myths

0
5
10
15
20
25
Institutional Retail
Main reservations and typical alternative allocations Fees, liquidity, education
26
Source: Goldman Sachs, Morningstar/Barron’s, McKinsey, Simfund, November 2013
Can retail allocations to alternatives increase with the introduction of Liquid Alternatives?
0
0.1
0.2
0.3
0.4
0.5
0.6
Fees Lack ofliquidity
Lack oftransparency
Benefitsuncertain
Unclear howstrategy works
in portfolioframework
Institutional Retail
‘Knowledge
% of advisors Alternatives allocation
Top reasons to hesitate on alternatives
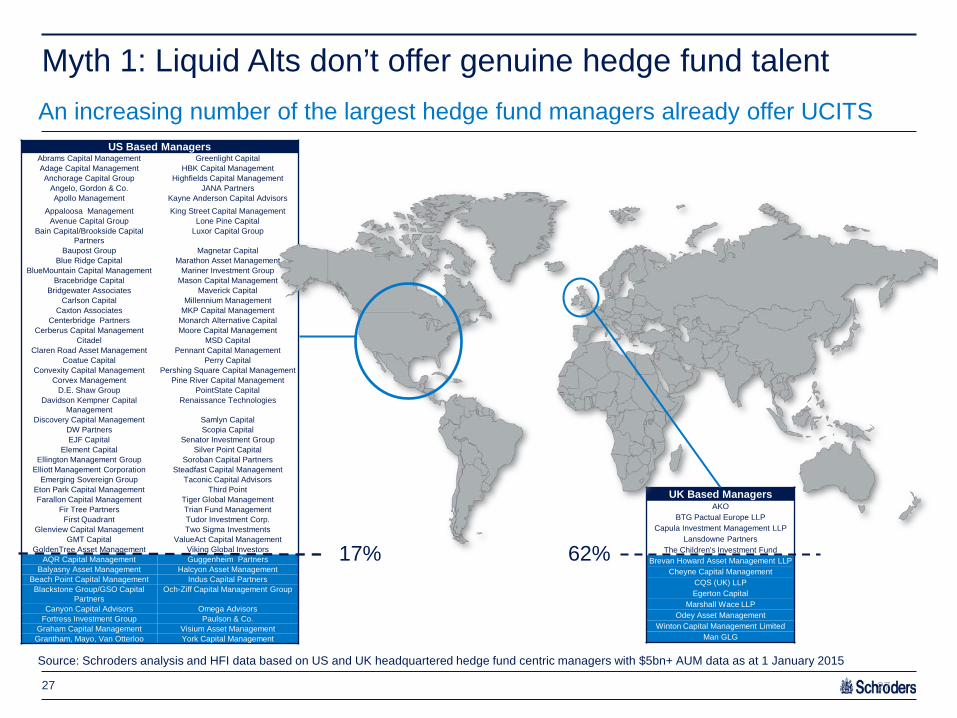
UK Based Managers AKO
BTG Pactual Europe LLP Capula Investment Management LLP
Lansdowne Partners The Children's Investment Fund
Brevan Howard Asset Management LLP Cheyne Capital Management
CQS (UK) LLP Egerton Capital
Marshall Wace LLP Odey Asset Management
Winton Capital Management Limited Man GLG
US Based Managers Abrams Capital Management Greenlight Capital Adage Capital Management HBK Capital Management Anchorage Capital Group Highfields Capital Management
Angelo, Gordon & Co. JANA Partners Apollo Management Kayne Anderson Capital Advisors
Appaloosa Management King Street Capital Management Avenue Capital Group Lone Pine Capital
Bain Capital/Brookside Capital Partners
Luxor Capital Group
Baupost Group Magnetar Capital Blue Ridge Capital Marathon Asset Management
BlueMountain Capital Management Mariner Investment Group Bracebridge Capital Mason Capital Management
Bridgewater Associates Maverick Capital Carlson Capital Millennium Management
Caxton Associates MKP Capital Management Centerbridge Partners Monarch Alternative Capital
Cerberus Capital Management Moore Capital Management Citadel MSD Capital
Claren Road Asset Management Pennant Capital Management Coatue Capital Perry Capital
Convexity Capital Management Pershing Square Capital Management Corvex Management Pine River Capital Management
D.E. Shaw Group PointState Capital Davidson Kempner Capital
Management Renaissance Technologies
Discovery Capital Management Samlyn Capital DW Partners Scopia Capital EJF Capital Senator Investment Group
Element Capital Silver Point Capital Ellington Management Group Soroban Capital Partners
Elliott Management Corporation Steadfast Capital Management Emerging Sovereign Group Taconic Capital Advisors
Eton Park Capital Management Third Point Farallon Capital Management Tiger Global Management
Fir Tree Partners Trian Fund Management First Quadrant Tudor Investment Corp.
Glenview Capital Management Two Sigma Investments GMT Capital ValueAct Capital Management
GoldenTree Asset Management Viking Global Investors AQR Capital Management Guggenheim Partners
Balyasny Asset Management Halcyon Asset Management Beach Point Capital Management Indus Capital Partners Blackstone Group/GSO Capital
Partners Och-Ziff Capital Management Group
Canyon Capital Advisors Omega Advisors Fortress Investment Group Paulson & Co.
Graham Capital Management Visium Asset Management Grantham, Mayo, Van Otterloo York Capital Management
Myth 1: Liquid Alts don’t offer genuine hedge fund talent
Source: Schroders analysis and HFI data based on US and UK headquartered hedge fund centric managers with $5bn+ AUM data as at 1 January 2015
27
An increasing number of the largest hedge fund managers already offer UCITS
62% 17%
27

80
85
90
95
100
105
Jun-14 Dec-14 Jun-15 Dec-15Schroder GAIA Paulson Merger Arbitrage C Acc USDPauslon Partners LP
90
100
110
120
130
140
Feb-13 Aug-13 Feb-14 Aug-14 Feb-15 Aug-15Schroder GAIA Sirios US Equity - C Acc USD SiriosReference fund
90
110
130
150
170
190
Nov-09 Nov-10 Nov-11 Nov-12 Nov-13 Nov-14 Nov-15Schroder GAIA Egerton Equity C Acc EUREgerton European Equity Fund Ltd - Class B20
KKR
Egerton Sirios
Myth 2: All liquid alternatives are hedge fund lite Schroder GAIA strategies represent core capabilities with low tracking error
28
Source: Schroders, Egerton, Sirios and KKR. As at 31 January 2016. *Paulson as at 31 December 2015 Performance data is net of all fees and charges. The GAIA C share class has been used for all GAIA funds. For Egerton European Equity from November 2009 to 31 December 2011 the B16 share class has been used. Please note, Egerton’s offshore hedge fund included a provision for potential tax liabilities at the end of March 2010 resulting in a 5.1% decrease in the NAV. These tax liabilities did not impact Schroder GAIA Egerton Equity. For illustrative purposes the data here ignores this provision and therefore shows the two strategies on a more like for like basis. No indicative weekly NAVs were produced for Egerton’s B16 share class during April 2010, therefore the B1 share class has been used as a proxy over this period. From 1 January 2012 to 31 December 2012 the B29 share class was used. From 1 January 2013 onwards the B20 share class is used
Paulson*
90
95
100
105
Oct-13 Apr-14 Oct-14 Apr-15 Oct-15Schroder GAIA KKR Credit - Class C Acc EURKKR Credit Alpha

Performance comparison UCITS vs. offshore hedge funds
Myth 3: Liquid alternatives are inferior to hedge funds Despite limitations, liquid alts can provide similar benefits to hedge funds
29
Source: HFR as of 31 January 2016
Industry performance
HFRI HFRU
Number of funds 2,200 500
Regulatory regime Flexible UCITS
Opportunity set
-30%
-20%
-10%
0%
10%
20%
30%
2008 2009 2010 2011 2012 2013 2014 2015
HFRI Fund Weighted Composite Index HFRU Hedge Fund Composite Index
Index YTD 2016 F/Y2015 F/Y 2014 Annualised Return
Annualised Volatility Drawdown Months to Recover
Correlation to S&P 500
(5 years)
Traditional Hedge Fund HFRI Offshore Hedge Fund Weighted Composite Index
-1.7% -1.1% 3.0% 2.1% 6.6% -20.1% 14 0.84
Liquid Alternatives HFRU UCITS Hedge Fund Composite Index
-3.0% 1.7% 4.5% 1.7% 3.5% -6.7% 10 0.63

Typical Fee Structures Cumulative performance
Myth 4: All liquid alts are expensive What is most important price or performance?
30
Source: Morningstar, Schroders, as at 31 December 2015. Common inception date taken of September 1994. Egerton performance shows Egerton offshore fund from December 1994 until November 2009. From December 2009 onwards Schroder GAIA Egerton Equity C Acc EUR is used. Performance shown is net of any fees and calculated on an NAV to NAV basis.
Typical Fees Variable Fees
Cumulative return since
1994
MSCI World ETF 10bps None 158%
Global Equity long only
0.50-1.00% None 197%
HFRI 1.25-1.75% 15-20% 431%
Schroder GAIA Egerton Equity
1.25% 20% 1,523%
0%
200%
400%
600%
800%
1000%
1200%
1400%
1600%
1800%
1994
1995
1996
1997
1999
2000
2001
2002
2003
2004
2005
2006
2007
2008
2009
2010
2012
2013
2014
2015
Global Equity Large Caps BlendEgertonMSCI WorldHFRI

The power of diversifying return streams

-100%
-50%
0%
50%
100%
150%
200%
250%
300%
350%
400%
2000 2001 2002 2003 2004 2005 2006 2007 2008 2009 2010 2011 2012 2013 2014 2015
Egerton KKR Paulson Sirios BSP MSCI World BlueTrend
Paulson
Egerton
KKRSirios
MSCI WorldBSP
BlueTrend
Schroder External Hedge Fund Manager Partnerships Cumulative performance
32
Source: Schroders. Analysis shown from November 2000 (common inception date) to 31 January 2016. The data shown for ‘Schroders External Hedge Fund Manager Partnerships’ is shown for the relevant flagship hedge fund strategy from November 2000 until inception of the Schroder GAIA fund. From each inception, performance is shown for Schroder GAIA Egerton Equity, Schroder GAIA Sirios US Equity, Schroder GAIA KKR Credit and Schroder GAIA Paulson Merger Arbitrage. From 7 February 2011 to 1 March 2012, BSP performance is shown for SMA, and from 1 March 2012 onwards for the BSP Credit Alpha Fund. . Performance is shown net of fees, NAV to NAV.

Schroder External Hedge Fund Manager Partnerships All strategies have outperformed equity markets on a risk adjusted basis
33
Return Std dev Sharpe ratio Schroder GAIA BlueTrend** 11.2% 14.1% 0.7 Schroder GAIA Egerton Equity 8.4% 8.5% 0.8 Schroder GAIA Paulson Merger Arbitrage 9.2% 8.3% 0.9 Schroder GAIA KKR Credit 7.1% 6.9% 0.8 Schroder GAIA Sirios US Equity 6.7% 8.5% 0.6 Schroder GAIA BSP Credit* 4.7% 3.4% 1.3 MSCI World 2.7% 14.5% 0.1
0%
2%
4%
6%
8%
10%
12%
0.0% 2.0% 4.0% 6.0% 8.0% 10.0% 12.0% 14.0% 16.0%
Schroder GAIA Paulson Merger Arbitrage Schroder GAIA KKR Credit Schroder GAIA Egerton Equity Schroder GAIA Sirios US EquitySchroder GAIA BSP Credit BlueTrend MSCI World
Return
Volatility
Source: Schroders. Analysis shown from November 2000 (common inception date) to 31 January 2016. *Please note that BSP and BlueTrend have an inception date since November 2000 and performance is included from inception of the strategy. For BSP, from 7 February 2011 to 1 March 2012, the performance is for SMA, from 1 March 2012 until June 2015 for the BSP Credit Alpha Fund, and from July 2015 onwards for Schroder GAIA BSP Credit. The data shown for ‘Schroders External Hedge Fund Manager Partnerships’ is shown for the relevant flagship hedge fund strategy from November 2000 until inception of the Schroder GAIA fund. From each inception, performance is shown for Schroder GAIA Egerton Equity, Schroder GAIA Sirios US Equity, Schroder GAIA KKR Credit, Schroder GAIA Paulson Merger Arbitrage and Schroder GAIA BSP Credit. Schroder GAIA BlueTrend strategy performance from January 2004. From January 2004 until March 2004 a SMA is used and BlueTrend Fund Limited (Class A USD) from 1 April 2004 onwards.

-100%
-50%
0%
50%
100%
150%
200%
250%
300%
2000 2002 2004 2006 2008 2010 2012 2014
Schroders External Hedge Fund Manager Partnerships
MSCI World NR LCL
Schroder External Hedge Fund Manager Partnerships Performance simulation with equal allocation to each external manager
34
Source: Schroders. Analysis shown from November 2000 (common inception date) to 31 January 2016. *Please note that BSP and BlueTrend have an inception date since November 2000 and performance is included from inception of the strategy. For BSP, from 7 February 2011 to 1 March 2012, the performance is for SMA, from 1 March 2012 until June 2015 for the BSP Credit Alpha Fund, and from July 2015 onwards for Schroder GAIA BSP Credit. The data shown for ‘Schroders External Hedge Fund Manager Partnerships’ is shown for the relevant flagship hedge fund strategy from November 2000 until inception of the Schroder GAIA fund. From each inception, performance is shown for Schroder GAIA Egerton Equity, Schroder GAIA Sirios US Equity, Schroder GAIA KKR Credit, Schroder GAIA Paulson Merger Arbitrage and Schroder GAIA BSP Credit. Schroder GAIA BlueTrend strategy performance from January 2004. From January 2004 until March 2004 a SMA is used and BlueTrend Fund Limited (Class A USD) from 1 April 2004 onwards.
Return Std Dev Sharpe ratio Schroders External Hedge Fund Manager Partnerships* 8.9% 5.4% 1.3
MSCI World NR LCL 3.1% 14.5% 0.1
Combining alternative funds provides superior risk adjusted returns
0.0% 5.0% 10.0% 15.0%
0.0%
1.0%
2.0%
3.0%
4.0%
5.0%
6.0%
7.0%
8.0%
9.0%
10.0%
0%1%2%3%4%5%6%7%8%9%
10%
0% 2% 4% 6% 8% 10% 12% 14% 16%
Schroders External Hedge Fund Manager Partnerships* MSCI World

Hedge fund AUM continues to grow with strong demand for liquid alternatives as portfolio diversifiers given expected heightened volatility
Growth has been fuelled by sophisticated private banks and wealth managers, looking forward we expect this client base to expand to include broader UCITS investors with growing demand
The UCITS hedge fund industry is now >$200bn of AUM with 25% managed by hedge fund managers** and a number of high profile launches expected in 2016
Total UCITS hedge fund platform assets grew in 2015 from $24.1bn* to $32.4bn* and represents c10% of total market share
Fees are an important consideration for liquid alternatives and each strategy should be assessed based on numerous criteria such as manager skill, unique alpha generation, consistent risk adjusted returns, proven downside protection and volatility management
Schroders offers a broad range of liquid alternative funds including a leading platform of external managers
Conclusions
35
Source: Schroders January 2016 *Kepler as at 30 September 2015. **Barclays strategic consulting analysis as at 30 September 2015
Important Information: This presentation does not constitute an offer to anyone, or a solicitation by anyone, to subscribe for shares of Schroder GAIA (the “Company”). Nothing in this presentation should be construed as advice and is therefore not a recommendation to buy or sell shares.
Subscriptions for shares of the Company can only be made on the basis of its latest Key Investor Information Document and prospectus, together with the latest audited annual report (and subsequent unaudited semi-annual report, if published), copies of which can be obtained, free of charge, from Schroder Investment Management (Luxembourg) S.A.
An investment in the Company entails risks, which are fully described in the prospectus.
Past performance is not a reliable indicator of future results, prices of shares and the income from them may fall as well as rise and investors may not get the amount originally invested. Schroders have expressed their own views and opinions in this presentation and these may change. This presentation is issued by Schroder Investment Management Limited, 31, Gresham Street, EC2V 7QA, who is authorised and regulated by the Financial Conduct Authority. Registration No 1893220, England.
For your security, communications may be taped or monitored.
Third party data is owned or licensed by the data provider and may not be reproduced or extracted and used for any other purpose without the data provider's consent. Third party data is provided without any warranties of any kind. The data provider and issuer of the document shall have no liability in connection with the third party data. The Prospectus and/or www.schroders.com contains additional disclaimers which apply to the third party data.
Important Information
36


![Malonamide, phosphine oxide and calix[4]arene ... · the future use of volatile organic compounds in nowadays liquid–liquid extraction systems. One possible alternative to these](https://static.fdocuments.net/doc/165x107/5f368d51b7a9a60b987899ee/malonamide-phosphine-oxide-and-calix4arene-the-future-use-of-volatile-organic.jpg)


