Investing for success - COELcoel.uk.com/.../11/Grant-Thornton-Cambridgeshire-Ltd-2016-report.pdf ·...
24
TOP 100 COMPANIES Cambridgeshire Ltd 2016 Investing for success
Transcript of Investing for success - COELcoel.uk.com/.../11/Grant-Thornton-Cambridgeshire-Ltd-2016-report.pdf ·...

TOP 100 COMPANIES
Cambridgeshire Ltd 2016Investing for success

Cambridgeshire Limited 2016 Investing for success | Top 100 companies
Cambridgeshire Ltd 2016
Astrazeneca PLC Marshall of Cambridge (Holdings) Limited Hilton Food Group PLC Arm Holdings PLC BHL (UK) Holdings
Limited G'S Group Holdings Limited Vindis Group Limited Napp Pharmaceutical Holdings Limited PRO CAM Europe Limited H.L.
Hutchinson Limited Aveva Group PLC George Thurlow And Sons (Holdings) Limited Russell Burgess Limited Produce
Investments PLC Ideal Shopping Limited Sepura PLC Ridgeon Group Limited Abcam PLC Mundipharma Research Limited JDR
Enterprises Limited Camelot Topco Limited Xaar PLC Driftwell Investments Limited Mick George Limited Vital Recruitment
Limited Welding Institute (The) Lawrence David Limited Gardman Group Limited J.B Shropshire & Sons Limited Anglia
Components Limited Lifecrown Investments Limited Avingtrans PLC Chivgate Limited Roe Bros. & CO Limited J.E. & V.M. Dalton
Limited AK Retail Holdings Limited F.P.Smith (Holdings) Limited Avro Holdings Limited Brookgate Limited Baker Perkins Limited
Jagex Limited Premier Holidays Limited Elektron Technology PLC Kershaw Group Limited Amino Technologies PLC Friar's Pride
Limited G S Shropshire Holdings Limited Murkett Brothers (Holdings) Limited Bidwells LLP G.& J.Peck Limited Macxchange
Limited Alan Bartlett & Sons (Chatteris) Limited Munro Building Services Holdings Limited John Henry And Sons (Developments)
Limited Adcock Refrigeration And Air Conditioning Limited Magdalene Holdings Limited Princebuild Holdings Limited Science
Group PLC Tayvin 40 Limited Linaro Limited Frederic Smart & Son Limited RGE Engineering Limited GW Pharmaceuticals PLC
Red Gate Software Limited Quixant PLC Cambridge Commodities Limited Secure Home Purchase (2015) Limited Brady PLC
The Excell Group PLC TOY Brokers Holdings Limited Almaren Limited Hales Group Limited Marblelane Limited Cambridge &
Counties Bank Limited Secure Group Limited Parametric Investments Limited Car World (Cambs) Ltd Knowles (Transport)
Limited Clarksteel Holdings Limited Cambridge Broadband Networks Limited Frontier Developments PLC Business Control
Solutions Group Limited Moorhouse & Mohan Limited Askew & Barrett (Pulses) Limited Ubisense Group PLC Creightons PLC
Scotsdale Nursery And Garden Centre Limited Horizon Discovery Group PLC Quartix Holdings PLC Anglia Home Furnishings
Holdings Ltd P.C. Howard Limited Rapidrop Global Limited Cambridge Office Environments Ltd M.J.S. Construction (March)
Limited P.J. Thory Limited Ip.Access Limited Alpha CRC Limited Chiltern Cold Storage Group Holdings Limited Eagle Foods
Limted Durman Stearn Holdings Limited Wilcox Commercial Vehicles Limited
2

Cambridgeshire Limited 2016 Investing for success | Top 100 companies
How Cambridgeshire Ltdis compiled
Cambridgeshire Ltd 2016 has been compiled using the most recent publicly available accounts (as at September 2016) of the county’s 100 largest companies (based on turnover) which have their principal place of business and management in Cambridgeshire. The results are derived from the latest available accounts and compared to the previous year’s Top 100.
The survey excludes companies that are owned by overseas companies or where management and strategic decision makers are based outside the county. This approach provides a more accurate picture of the wealth creation and importantly, the retention and re-investment of profits in Cambridgeshire. This is fundamental to the continued success of the local economy. We have excluded 'Not for Profit' organisations, due to the purpose of these entities.
Inevitably there is a time delay between the financial data used and the presentation of this report. The findings relate to a period before the recent uncertainty following the UK referendum result to leave the EU. In contrast most economic indicators were stable and having seen very strong profit growth in 2015 business confidence at this time was generally positive.
The report casts a spotlight on how Cambridgeshire Ltd has built upon this and continues to demonstrate what a dynamic, vibrant economy exists for businesses and people in the county. There has been much investment in the county, perhaps none more high profile than the relocation of AstraZeneca to the Cambridge Biomedical Campus.
AstraZeneca is a global organisation with a turnover of over £16bn and net assets of £14bn. As such it represents a major addition to Cambridgeshire Ltd and with no 2015 comparative we have decided to exclude it from this years analysis.
The 'Ones to Watch' uses the same selection criteria as the Top 100, and looks at the average two year cumulative turnover growth rate, with a minimum turnover of £10m.
The Growth Index has been compiled from the Top 100 companies by calculating the rate of improvement in EBITDA compared to the prior year.
3

Cambridgeshire Limited 2016 Investing for success | Top 100 companies
Shaping a Vibrant Economy in Cambridgeshire
We believe that Cambridgeshire is the very definition of a vibrant economy. Our report reflects on a year's performance by the county's leading businesses across a range of sectors. Business leaders have shown confidence, taking measured businesses risks to invest in new businesses, new assets and people. This has introduced a higher degree of change than Cambridgeshire Ltd has seen for some time.
These themes illustrate the fact that the way we live and do business is changing faster than ever before. The world is full of opportunities, but every opportunity brings a challenge. If Cambridgeshire and the UK is to achieve its potential our economy needs to do more than just grow. It needs to embrace change.
Cambridgeshire has at its heart a culture of embracing change, thriving on challenge and sparking innovation. Local and central Government recognise this and the local devolution plans are an attempt to capitalise on this, and to also address the challenges the county faces.
We have worked with the Centre for Economic and Business Research (CEBR) to analyse some of the latent potential across the UK: what if places, people and organisations achieved their full potential? The six areas where there is an opportunity to unleash potential are summarised on the next page. Cambridgeshire has the potential to be at the leading edge of unleashing such potential and our report captures some of the story so far.
Our purpose at Grant Thornton is to shape a vibrant economy by building trust and integrity in markets, unlocking sustainable growth in dynamic organisations and creating environments where businesses and people flourish. This report and the discussion it stimulates is part of how we fulfil this purpose.
Darren BearGrant Thornton UK LLP, Cambridge
4

Cambridgeshire Limited 2016 Investing for success | Top 100 companies
Join the conversation – #VibrantEconomy #VibrantCambridge
SKILLS
Skills shortages represent another source of loss output, particularly in industries such as manufacturing and construction.
If apprenticeships and immigration could fill those positions, the UK could make gains of between £8.5 billion and £9.3 billion by 2025.
HOUSING
If UK house prices were to grow at a slower rate, part of the money that is now spent on rents and mortgage would be spent on various goods and services.
Overcoming the housing crisis would boost consumer spending in Great Britain by £1.2 billion in 2016 up to £6.5 billion in 2020 and £18 billionin 2025.
HEALTH
Sickness costs the UK economy £26.9 billion per year in lost output.
If all other regions managed to improve health and achieved the lowest sickness rate (that of London), £6.2 billion or 24% of the total could be saved.
PRODUCTIVITY
In 2015 GDP per hour worked in the UK was about 18 percentage points lower than the rest of the G7.
If this productivity shortfall was eradicated, GDP by 2025would be £382 billion higher (in 2012 prices).
TRADE
Exports stood at 28% of GDP in the UK in 2015 (the latest year for which we have data).
By aiming to increase exports to 45% by 2026, the UK economy could see substantial gains.
VIBRANT CITIES AND PLACES
If GVA per worker in every region of the UK (except in London where it is higher) was the same as the rest of the G7 there would be significanteconomic gains.
GVA would stand 25%, or £479 billion higher in 2025 (in 2012 prices). In 2020, GVAwould be 8% or £131 billion.
5

Cambridgeshire Limited 2016 Investing for success | Top 100 companies
T
Top 100 overview
70
4
Turnover range:
<£25m(SME)
£25m – £500m(MSB)
26
TOP 3 employers by sector
Business
Support
Services Technology Food and Beverage
>£500m(large corps)
Gearing down 1%
49%
Fastest growth
in EBITDA:
Property &
Construction
+34%
33%
Fastest growth in turnover
Property & Construction
£10.3bnTurnover
82 of
Top 100
companiesare profitable
sectors by turnover
Food and Beverage
1
2
3
TOP 3Technology
Automotive
73 of
Top 100
companiesincreasedrevenue
63 of theTop 100
companiesincreased EBITDA
6

Cambridgeshire Limited 2016 Investing for success | Top 100 companies
Cambridge
(43)
11x
21%
Location of Top 100 St Ives
(5)
Huntingdon (6)
Ely (10)
Wisbech (11)
Peterborough (25)
2014
EBITDA
£886
2016
EBITDA
£1,075
Average Salary
2015
EBITDA
£1,162
Intangible fixed
assets
Interest
cover
EFFECTIVE
TAX RATE
Tangible fixed
assets
16%9%
£31,700
Employment increase
Investment
TOP 3sectors by profit
3
2
1 Technology
Business Support Services
Food & Beverage
Debt
8 %
7
4%
Decrease
in EBITDA
8%
Cambridgeshire Limited 2016 Investing for success | Top 100 companies
Cambridgeshire LtdInvesting for the future
Income statement
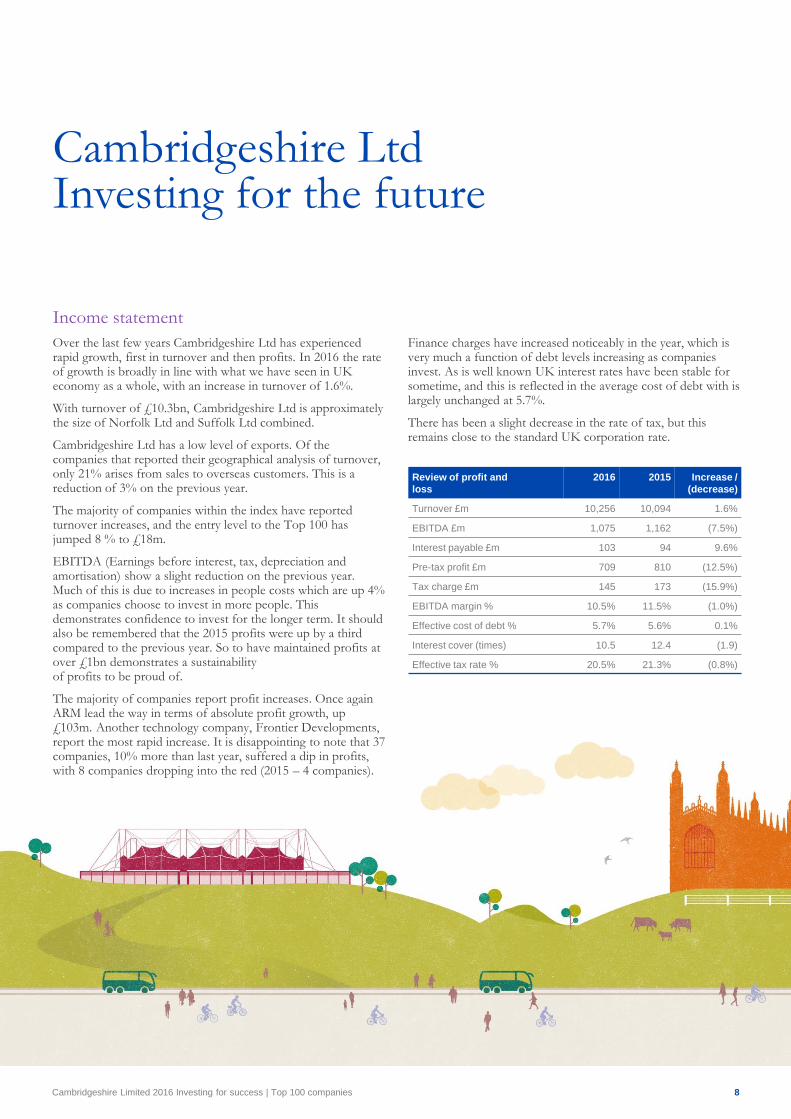
Over the last few years Cambridgeshire Ltd has experienced rapid growth, first in turnover and then profits. In 2016 the rate of growth is broadly in line with what we have seen in UK economy as a whole, with an increase in turnover of 1.6%.
With turnover of £10.3bn, Cambridgeshire Ltd is approximately the size of Norfolk Ltd and Suffolk Ltd combined.
Cambridgeshire Ltd has a low level of exports. Of the companies that reported their geographical analysis of turnover, only 21% arises from sales to overseas customers. This is a reduction of 3% on the previous year.
The majority of companies within the index have reported turnover increases, and the entry level to the Top 100 has jumped 8 % to £18m.
EBITDA (Earnings before interest, tax, depreciation and amortisation) show a slight reduction on the previous year. Much of this is due to increases in people costs which are up 4% as companies choose to invest in more people. This demonstrates confidence to invest for the longer term. It should also be remembered that the 2015 profits were up by a third compared to the previous year. So to have maintained profits at over £1bn demonstrates a sustainabilityof profits to be proud of.
The majority of companies report profit increases. Once again ARM lead the way in terms of absolute profit growth, up £103m. Another technology company, Frontier Developments, report the most rapid increase. It is disappointing to note that 37 companies, 10% more than last year, suffered a dip in profits, with 8 companies dropping into the red (2015 – 4 companies).
Review of profit and
loss
2016 2015 Increase /
(decrease)
Turnover £m 10,256 10,094 1.6%
EBITDA £m 1,075 1,162 (7.5%)
Interest payable £m 103 94 9.6%
Pre-tax profit £m 709 810 (12.5%)
Tax charge £m 145 173 (15.9%)
EBITDA margin % 10.5% 11.5% (1.0%)
Effective cost of debt % 5.7% 5.6% 0.1%
Interest cover (times) 10.5 12.4 (1.9)
Effective tax rate % 20.5% 21.3% (0.8%)
Finance charges have increased noticeably in the year, which is very much a function of debt levels increasing as companies invest. As is well known UK interest rates have been stable for sometime, and this is reflected in the average cost of debt with is largely unchanged at 5.7%.
There has been a slight decrease in the rate of tax, but this remains close to the standard UK corporation rate.
8

Cambridgeshire Limited 2016 Investing for success | Top 100 companies
Employment
Cambridgeshire has long been a county that attracts people because of the wealth of its economic and social opportunities. The county has high levels of employment and this continues to present challenges to businesses looking to grow. However, the number of people employed has again risen, up 4% demonstrating consistent growth and investment in people.
At a national level average salaries have generally shown only limited increases and Cambridgeshire Ltd reflects this national picture, increasing by only 0.2% (£100pa).
Cambridgeshire Ltd employs 52,874 people, an increase in the number of people employed of just over 1,800. The majority of companies have contributed to this with 60% of the Top 100 reporting an increase in their people.
The largest employers are mainly in the Business Support Services, Food and Beverage and Technology sectors. The largest of these being Vital Recruitment, a temporary staff agency providing people to other businesses across the region.
A year of change
The vibrant nature of Cambridgeshire Ltd is perhaps best illustrated by the degree to which its constitution changes over time. This year has seen a high number of changes, with the majority of companies leaving the index due to changes in ownership. This looks set to continue in the year ahead, Cambridgeshire consistently develops dynamic, successful companies and has a culture of reinvestment among its entrepreneurs.
The Top 100 has seen 14 new entrants this year, all of whom have joined the index having experienced strong growth in turnover in the year. This is particularly exciting as the entry level to the Top 100 is significantly higher than last year. Of these new entrants 4 were identified last year as “Ones to Watch” having already displayed consistent, rapid growth in the previous two years.
Employment 2016 2015 Increase
Salary costs £m 1,676 1,612 4%
People employed (no) 52,874 51,069 4%
Average salary £ pa 31,700 31,600 <1%
Avingtrans PLC
Cambridge & Counties Bank Limited
Cambridge Office Environments Ltd
Chiltern Cold Storage Group Holdings Limited
Durman Stearn Holdings Limited
Frontier Developments PLC
G S Shropshire Holdings Limited
Horizon Discovery Group PLC
M.J.S. Construction (March) Limited
Marblelane Limited
P.J. Thory Limited
Quartix Holdings PLC
Secure Home Purchase (2015) Limited
Wilcox Commercial Vehicles Limited
9

Cambridgeshire Limited 2016 Investing for success | Top 100 companies
Balance sheet
There has been a lot of activity within the balance sheet of Cambridgeshire Ltd during 2016. This is most evident from the £437m increase in fixed assets, a net increase of 14%. Much of this is attributable to increases in intangible fixed assets which have grown as a consequence of business acquisitions and the recognition of acquired intangibles and goodwill.
Cambridgeshire Ltd has continued to convert profits into cash, generating positive net cashflow and a net increase in cash deposits of 10%, even after the high level of investment noted above.
Debt levels have shown a net increase of £132m, up 8% on the previous year mainly due to funding the high level of corporate activity seen in the year. There have also been some balance sheet reorganisations. Despite this, gearing levels have actually fallen slightly due to the growth of shareholder funds. Cambridgeshire Ltd continues to accumulate profits and generally the balance sheet is very strong.
FRS102
FRS102 came into effect for accounting periods beginning on or after 1 January 2015. This is a fundamental change to the accounting framework that applies to UK privately owned companies. The detailed affects of this new accounting standard are many and varied. These result in both the amendment of previously reported figures and the introduction of new items.
For Cambridgeshire Ltd the biggest impact has been the recognition of £43m of additional pension scheme and liabilities. Various other liabilities totalling £6m have also been recognised, partially offset by the recognition of the fair value of financial instruments and asset revaluations of £4m.
The overall impact is a £45m reduction in shareholder funds. At just over 1% this seems fairly insignificant. However, for the companies effected, the reduction represents a fall in shareholder funds of 53%. Clearly a very significant effect for these individual companies.
Many companies have not yet reported their transition to FRS102, and so further adjustments to shareholder funds are likely to be seen in 2017.Review of balance sheet 2016 2015 Increase /
(Decrease)
Fixed assets £m 3,571 3,133 14%
Current assets £m 5,182 4,505 15%
Current liabilities £m 3,981 3,234 23%
Net current assets £m 1,201 1,271 (6%)
Total debt £m 1,814 1,682 8%
Shareholder funds £m 3,671 3,328 10%
Gearing (debt/equity) % 49.4% 50.5% (1.1%)
Cash/bank deposits £m 1,792 1,630 10%
FRS102 transitional adjustments Increase / (decrease)
in shareholder funds
£’000
Additional liabilities (888)
Derivatives (207)
Leases 85
Effective interest rate (2,751)
Taxation (1,119)
Amortisation (173)
Financial instruments at fair value 653
Hedge accounting (577)
Pension liabilities (43,222)
Fixed asset revaluations 3,810
Intangible assets (293)
Net decrease in shareholder funds (44,682)
10

Cambridgeshire Limited 2016 Investing for success | Top 100 companies
Company Sector
Compound growth
in turnover
Turnover
£’000
1 Cambridge Maintenance Services Limited Business Support Services 36% 14,212
2 Acrabuild (Anglia) Limited Property and Construction 33% 12,772
3 One Call Recruitment Limited Business Support Services 32% 12,879
4 G. Webb Haulage Limited Business Support Services 28% 12,697
5 Buffaload Logistics Limited Business Support Services 25% 14,082
6 LDA 2014 LLP Business Support Services 23% 12,711
7 Pico Technology (Holdings) Limited Technology 16% 15,034
8 Pure Resourcing Solutions Ltd Business Support Services 13% 13,190
9 Norfolk Free Range Limited Food and Beverage 12% 17,007
10 Hawkins & Associates Limited Business Support Services 11% 14,377
11 Flocklynn Limited Manufacturing 11% 13,092
12 Z-Tech Control Systems Limited Business Support Services 10% 12,608
13 Masteroast Holdings Limited Retail and Wholesale 10% 14,814
14 LH Holdings Limited Manufacturing 10% 17,558
15 International Direct Packaging Limited Manufacturing 9% 13,093
16 Prior Scientific Instruments Limited Technology 9% 15,566
17 London Internet Exchange Limited Business Support Services 7% 13,279
18 Fencor Packaging Group Limited Manufacturing 7% 16,496
19 Eacs Limited Technology 6% 16,943
20 Firstan Holdings Limited Manufacturing 5% 17,843
21 Hewitsons LLP Business Support Services 5% 14,183
22 The I.S. Group Limited Retail and Wholesale 4% 16,177
23 Welch's Group Holdings Limited Business Support Services 3% 13,084
24 ASL Technology Holdings Ltd. Business Support Services 3% 15,361
25 Coulson Group Limited Property and Construction 2% 12,702
The 'Ones to Watch'
Cambridgeshire has a vibrant and successful entrepreneurial culture that nurtures companies with an ambition of growth.Some of the strongest growth is seen just outside of the Top 100.
Based on cumulative average growth over the last two years, the 25 emerging companies below are the 'Ones to Watch'. The total compound turnover growth of these companies is 12%. This is sustained growth by companies across a range of sectors, which demonstrates the diversity and vibrancy of Cambridgeshire.
Fundamental to the continued success of these companies is that profits haven't been sacrificed in the hunt for growth. The EBITDA of the 'Ones to Watch' has increased by 19% over this same period.
Having a vibrant economy creates opportunities for people, and the 'Ones to Watch' are making a significant contribution to this. They employ 3,994 people, an increase of 12% over the last two years.
11

Cambridgeshire Limited 2016 Investing for success | Top 100 companies
Company Sector
Increase
%
Position on
Top 100 list
1 Frontier Developments PLC Technology 12,237% 81
2 Baker Perkins Limited Manufacturing 1,338% 39
3 Marblelane Limited Food and Beverage 289% 72
4 Cambridge & Counties Bank Limited Business Support Services 153% 73
5 Lawrence David Limited Manufacturing 102% 26
6 Creightons PLC Manufacturing 86% 85
7 Mick George Limited Services 83% 23
8 Welding Institute(The) Business Support Services 83% 25
9 G S Shropshire Holdings Limited Land and Rural 83% 46
10 Magdalene Holdings Limited Technology 80% 55
11 M.J.S. Construction (March) Limited Property and Construction 79% 93
12 TOY Brokers Holdings Limited Retail and Wholesale 77% 69
13 Cambridge Commodities Limited Business Support Services 65% 65
14 Linaro Limited Technology 59% 59
15 Chiltern Cold Storage Group Holdings Limited Business Support Services 56% 97
16 Munro Building Services Holdings Ltd Business Support Services 55% 52
17 Scotsdale Nursery And Garden Centre Limited Retail and Wholesale 45% 86
18 Car World (Cambs) Ltd Automotive 45% 76
19 Princebuild Holdings Limited Property and Construction 44% 56
20 Eagle Foods Ltd Food and Beverage 42% 98
21 Elektron Technology PLC Technology 42% 42
22 AK Retail Holdings Limited Retail and Wholesale 40% 35
23 Secure Group Limited Business Support Services 39% 74
24 Vital Recruitment Limited Business Support Services 39% 24
25 P.C. Howard Limited Business Support Services 36% 90
Growth Index 2016
The Growth Index charts the 25 companies within Cambridgeshire Ltd with the highest rate of improvement in EBITDA, providing a measure of rapid profit growth within the Top 100 companies.
These companies have reported turnover of £907m, an increase of 24%. This is strong growth. However it is at profit level that the performance of the growth index is measured, and here the growth is quite phenomenal, up £56m to £111m, an increase of 102%. All these companies have reported consistent improvements in profits over the past two years.
The index consists of small and mid-sized entities, the latter being most prominent. What is really exciting is that six companies are new entrants to the Top 100 this year. Cambridge & Counties Bank Ltd and Chiltern Cold Storage Group Holdings Ltd were both identified as “Ones to Watch” in our 2015 report and so it is fantastic to see them continue their growth in the current year.
The growth in profits has also lead to increased opportunities for people. These companies have generated just over 1,000 new jobs in the year and now employ 11,285 people. That’s an increase of 12%, so well ahead of the average growth rate.
Sustainable profit growth and opportunities for people, this demonstrates why Cambridgeshire is such a vibrant economy.
12
Cambridgeshire Limited 2016 Investing for success | Top 100 companies
Eastern Powerhouse
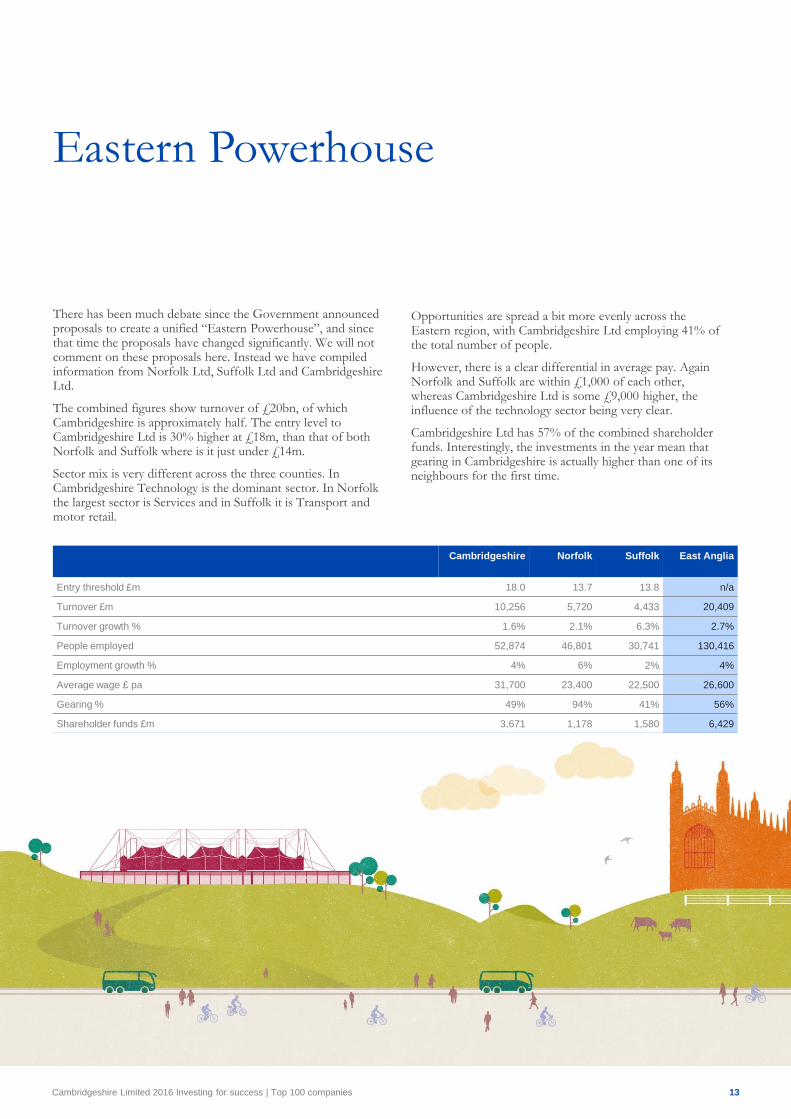
Cambridgeshire Norfolk Suffolk East Anglia
Entry threshold £m 18.0 13.7 13.8 n/a
Turnover £m 10,256 5,720 4,433 20,409
Turnover growth % 1.6% 2.1% 6.3% 2.7%
People employed 52,874 46,801 30,741 130,416
Employment growth % 4% 6% 2% 4%
Average wage £ pa 31,700 23,400 22,500 26,600
Gearing % 49% 94% 41% 56%
Shareholder funds £m 3,671 1,178 1,580 6,429
13
There has been much debate since the Government announced proposals to create a unified “Eastern Powerhouse”, and since that time the proposals have changed significantly. We will not comment on these proposals here. Instead we have compiled information from Norfolk Ltd, Suffolk Ltd and Cambridgeshire Ltd.
The combined figures show turnover of £20bn, of which Cambridgeshire is approximately half. The entry level to Cambridgeshire Ltd is 30% higher at £18m, than that of both Norfolk and Suffolk where is it just under £14m.
Sector mix is very different across the three counties. In Cambridgeshire Technology is the dominant sector. In Norfolk the largest sector is Services and in Suffolk it is Transport and motor retail.
Opportunities are spread a bit more evenly across the Eastern region, with Cambridgeshire Ltd employing 41% of the total number of people.
However, there is a clear differential in average pay. Again Norfolk and Suffolk are within £1,000 of each other, whereas Cambridgeshire Ltd is some £9,000 higher, the influence of the technology sector being very clear.
Cambridgeshire Ltd has 57% of the combined shareholder funds. Interestingly, the investments in the year mean that gearing in Cambridgeshire is actually higher than one of its neighbours for the first time.

Cambridgeshire Limited 2016 Investing for success | Top 100 companies
Land and Rural
Retail and WholesaleTechnology
Food and Beverage
Automotive
Business Support Services
Manufacturing
Property and Construction
Sector review 2016
Cambridgeshire Limited comprises eight sectors:
14
Cambridgeshire Limited 2016 Investing for success | Top 100 companies
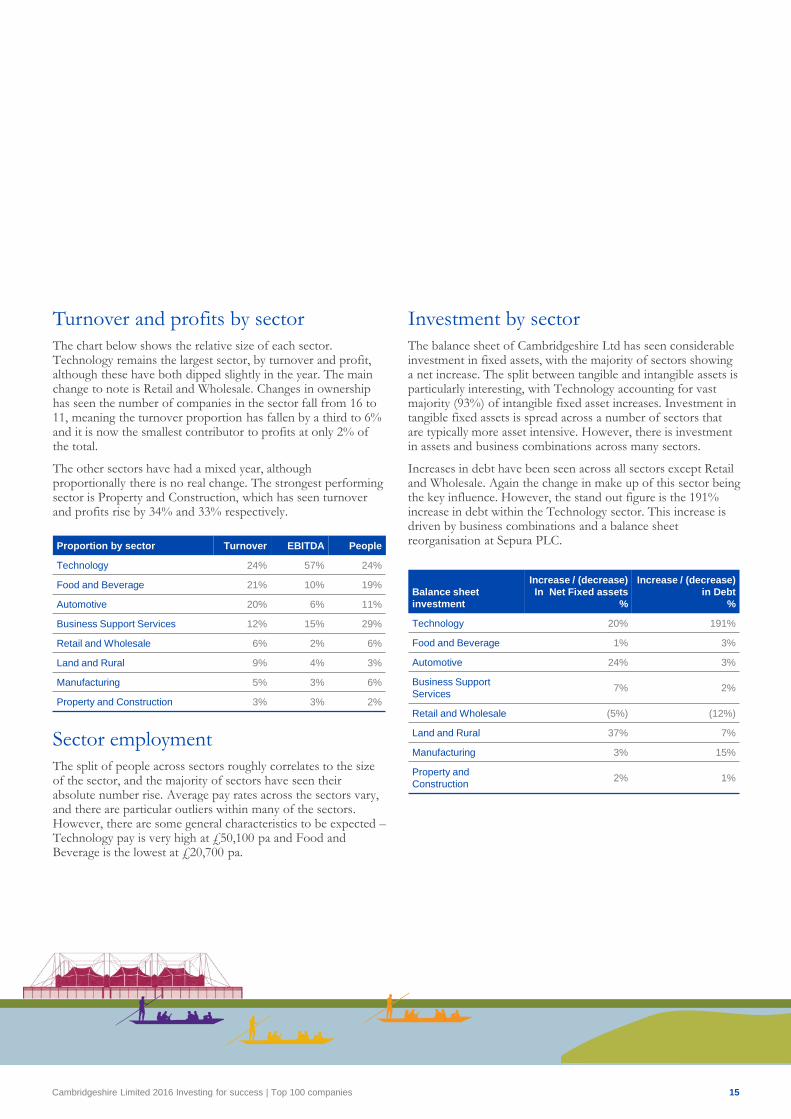
Turnover and profits by sector
The chart below shows the relative size of each sector. Technology remains the largest sector, by turnover and profit, although these have both dipped slightly in the year. The main change to note is Retail and Wholesale. Changes in ownership has seen the number of companies in the sector fall from 16 to 11, meaning the turnover proportion has fallen by a third to 6% and it is now the smallest contributor to profits at only 2% of the total.
The other sectors have had a mixed year, although proportionally there is no real change. The strongest performing sector is Property and Construction, which has seen turnover and profits rise by 34% and 33% respectively.
Sector employment
The split of people across sectors roughly correlates to the size of the sector, and the majority of sectors have seen their absolute number rise. Average pay rates across the sectors vary, and there are particular outliers within many of the sectors. However, there are some general characteristics to be expected –Technology pay is very high at £50,100 pa and Food and Beverage is the lowest at £20,700 pa.
Investment by sector
The balance sheet of Cambridgeshire Ltd has seen considerable investment in fixed assets, with the majority of sectors showing a net increase. The split between tangible and intangible assets is particularly interesting, with Technology accounting for vast majority (93%) of intangible fixed asset increases. Investment in tangible fixed assets is spread across a number of sectors that are typically more asset intensive. However, there is investment in assets and business combinations across many sectors.
Increases in debt have been seen across all sectors except Retail and Wholesale. Again the change in make up of this sector being the key influence. However, the stand out figure is the 191% increase in debt within the Technology sector. This increase is driven by business combinations and a balance sheet reorganisation at Sepura PLC.
Proportion by sector Turnover EBITDA People
Technology 24% 57% 24%
Food and Beverage 21% 10% 19%
Automotive 20% 6% 11%
Business Support Services 12% 15% 29%
Retail and Wholesale 6% 2% 6%
Land and Rural 9% 4% 3%
Manufacturing 5% 3% 6%
Property and Construction 3% 3% 2%
Balance sheet
investment
Increase / (decrease)
In Net Fixed assets
%
Increase / (decrease)
in Debt
%
Technology 20% 191%
Food and Beverage 1% 3%
Automotive 24% 3%
Business Support
Services7% 2%
Retail and Wholesale (5%) (12%)
Land and Rural 37% 7%
Manufacturing 3% 15%
Property and
Construction2% 1%
15

Cambridgeshire Limited 2016 Investing for success | Top 100 companies
2016 2015
Increase /
(decrease)
Turnover £m 2,455 2,539 (3%)
EBITDA £m 607 683 (11%)
EBITDA margin % 25% 27% (2%)
Average pay £ (pa) 50,100 47,200 3%
No. of people employed 12,577 13,419 (6%)
Gearing % 5% 2% 3%
Fixed assets £m 1,924 1,601 20%
Shareholders funds £m 3,083 2,744 12%
Technology
The Technology sector is often considered to have higher rewards
to recompense for higher risks. Well it is these higher risks that
have become more evident for the first time this year. Both
turnover and EBITDA have dipped as a number of the largest, well
known businesses in the sector have reported lower results.
However, this should be seen in the context that the sector remains
the largest and most profitable of all the sectors of Cambridgeshire
Ltd. It also reflects a high degree of corporate activity.
Despite this reduction in profits, the high levels of average pay have
increased further, up by 3% to £50,100. This is well above the
national and regional average. The increase demonstrating the
fiercely competitive market for highly skilled people.
The sector has had a very busy year with many of the companies
investing in new business opportunities and acquisitions. This is
clearly seen in the increase in fixed assets, which is largely goodwill
from business combinations. The sector accounts for 75% of the
total net investment in fixed assets in the year.
Generally funded by shareholder funds, the sector has taken on
some additional debt this year, mainly to fund the noted
acquisitions. This can been seen in the gearing, which whilst very
low shows a proportionally large jump from 2% to 5%.
Nethertheless, the balance sheet remains strong and shareholder
funds are up by 12%.
Food and Beverage
The Food and Beverage sector consists of 10 companies within the
food supply chain. Pricing pressures have again lead to a fall in
turnover for the sector. However, investment in efficient processes
and product innovation have actually resulted in an increase in
profits.
The sector employs 19% of all people within Cambridgeshire Ltd,
and the increase of 522 people is the second highest increase in the
year. However, as in previous years these are on average lower paid
roles. The sector has the lowest average pay at £20,700 pa, which is
just under 1% down on the previous year. Given the upward
pressures from the National Minimum Wage, it may be companies
are countering this with greater use of more flexible working hours.
The balance sheet shows a stronger position. The investment in
fixed assets (£4m) is perhaps evidence of the continued drive for
process efficiencies. This has been funded by a similar increase in
net debt. However, the retention of the increased profits within
shareholder funds means the gearing ratio actually shows a
reduction at 60%.
2016 2015
Increase /
(decrease)
Turnover £m 2,108 2,111 (<1%)
EBITDA £m 121 91 33%
EBITDA margin % 5% 4% 1%
Average pay £ (pa) 20,700 20,900 (1%)
No. of people employed 9,917 9,395 6%
Gearing % 60% 67% (7%)
Fixed assets £m 319 315 1%
Shareholders funds £m 256 223 15%
16

Cambridgeshire Limited 2016 Investing for success | Top 100 companies
2016 2015
Increase /
(decrease)
Turnover £m 2,064 1,886 9%
EBITDA £m 65 65 -
EBITDA margin % 3% 3% -
Average pay £ (pa) 33,400 33,000 1%
No. of people employed 5,794 5,514 5%
Gearing % 34% 33% 1%
Fixed assets £m 277 224 24%
Shareholders funds £m 218 215 1%
Automotive
The automotive sector has shown strong growth in the year, with
all except one company reporting increased sales. As with many of
the other sectors, business combinations have had a significant
influence on the results for the year, particularly for Marshall of
Cambridge. The company is the largest in Cambridgeshire Ltd and
its motor division has reported high growth following acquisitions
in the year. Other companies also reported growth, as consumer
spending on cars remained relatively buoyant in the year.
At the profit level the picture is mixed, with profit increases of
some being cancelled out by reductions at others to give an overall
neutral position. It is interesting to note that the effective tax rate
for the sector is quite high at 29%. Other than disallowable
expenses there does not appear to be one underlying reason for
this.
The increase in people is wholly attributable to Marshall, and again
much of this will be from the acquisition in the year. The rest of the
sector has seen a very small reduction in numbers. Average pay has
increased by a modest 1% to £33,400pa, and this increase is seen
across the majority of automotive companies.
The increase in fixed assets of £53m is the second largest of any
sector, an effective net investment of 24%. Although there have
been acquisitions, most of the increase is actually the purchase of
new assets. The majority of this has been funded from own
resources, although there is a slight increase in net debt, up £2m.
Business Support Services
The sector has been very active in the year. It has seen the largest
number of new entrants (5) to the Top 100. Together with
consistent growth across most companies this has generated a 11%
increase in turnover, the second highest of all sectors.
The sector also reports relatively high profit margins, second only
to Technology at 14%. However, reductions at the two largest
companies mask profit growth across the majority of other
companies.
The diversity of the companies in the sector is perhaps best
illustrated by the range of average pay, which stretches from
£12,400 pa to £96,700 pa. There are a broad mix of ups and
downs across the companies and the average for the sector is
slightly down at £24,700pa.
The sector is the largest employer, and has again increased its
people numbers. The larger employers contributing most to this,
whilst smaller employers are generally showing little change.
Net investment in tangible fixed assets is surprisingly the highest of
any sector at £47m, an increase of 22%. Much of this by Mick
George Ltd, which is also the fastest growing company in the
sector.
The level of debt has increased sharply in the year. This is from a
combination of the fixed asset investment and balance sheet re-
organisation. Excluding the effects of the large deficit in
shareholder funds of BHL, adjusted gearing is 195%, up on the
previous year level of 134%.
2016 2015
Increase /
(decrease)
Turnover £m 1,270 1,143 11%
EBITDA £m 176 194 (9%)
EBITDA margin % 14% 17% (3%)
Average pay £ (pa) 24,700 24,900 (1%)
No. of people employed 15,109 13,303 14%
Gearing % (473%) (653%) 180%
Fixed assets £m 627 588 20%
Shareholders funds £m (200) (142) (41%)
17

Cambridgeshire Limited 2016 Investing for success | Top 100 companies
2016 2015
Increase /
(decrease)
Turnover £m 661 887 (25%)
EBITDA £m 19 42 (55%)
EBITDA margin % 3% 5% (2%)
Average pay £ (pa) 23,300 23,600 (1%)
No. of people employed 3,370 4,030 (16%)
Gearing % 267% 209% 58%
Fixed assets £m 155 163 (5%)
Shareholders funds £m 60 87 (31%)
Retail and Wholesale
The Retail and Wholesale sector has had a busy year, following
changes in ownership and structure the number of companies has
fallen from 16 to 11. Not surprisingly this means the sector has
seen its turnover fall, down 25%. However, the remaining
companies are performing quite well. On a like for like basis
turnover is actually up 11%.
Profits have fallen disproportionately, mainly due to one off costs
at Ideal Shopping, the largest company in the sector, such that it
now has the lowest profit margin at 3%. However, underlying
profits for the rest of the sector are up.
On a like for like basis, people numbers have increased by 8%.
However, it is disappointing to note the fall in average pay for what
is already a relatively lower paid sector. As with the Food and
Beverage sector it could be that flexible working hours are
compensating for upward legislative pressures.
The apparent weakening of the balance sheet reflects the smaller
number of companies, and the losses at the largest company.
Land and Rural
This sector comprises ten companies which include growers, grain
and feed merchants, and suppliers of chemicals, fertilisers, plant
and equipment to growers.
Turnover for the sector has grown by 10%, although this isn’t seen
uniformly across all companies.
The sector is characterised by low profit margins. At 4% the
EBITDA margin is the second lowest, although this is a fraction
higher than last year. In absolute terms EBITDA has
demonstrated strong growth, increasing by 13%.
The sector is the second smallest employer, although there has
been an above average increase in people, up 14% to 1,898. Whilst
pay rates are above average, these have dipped a little, down 2% to
£33,200 pa.
There has been further investment in fixed assets, the second
highest of any sector, although this has not been matched by a
large increase in debt and so gearing has reduced.
2016 2015
Increase /
(decrease)
Turnover £m 933 850 10%
EBITDA £m 41 36 13%
EBITDA margin % 4% 4% -
Average pay £ (pa) 33,200 34,000 (2%)
No. of people employed 1,898 1,664 14%
Gearing % 37% 47% (10%)
Fixed assets £m 70 51 37%
Shareholders funds £m 134 98 15%
18

Cambridgeshire Limited 2016 Investing for success | Top 100 companies
2016 2015
Increase /
(decrease)
Turnover £m 511 489 5%
EBITDA £m 33 30 9%
EBITDA margin % 6% 6% -
Average pay £ (pa) 30,400 30,900 (2%)
No. of people employed 3,382 3,126 8%
Gearing % 337% 309% 28%
Fixed assets £m 112 109 3%
Shareholders funds £m 45 43 6%
Manufacturing
The focus of manufacturing in Cambridgeshire Ltd is on
technology and high quality. The sector turned in another solid set
of results, performing ahead of the average. This is on the back of
very good performance in the previous year, and so demonstrates a
degree of sustainability that is perhaps not seen in the sector across
the wider UK economy. Turnover has increased by 5% and
EBITDA by 9%.
People numbers have been increasing over the last couple of years
and this has continued in 2016 with a 8% increase to 3,382 people.
The sector has a tradition of in-house training and development of
its people through apprenticeship training. It is possible that many
of these new roles are for trainees as the average pay has decreased
slightly. That being the case, it will be interesting to see what effect
the Apprenticeship Levy will have when it comes into effect in
April 2017.
The net effective tax rate is exceptionally high at 51%, mainly due
to relatively high levels of disallowable expenditure at a small
number of the companies.
The sector is asset intensive, and with a low level of shareholders
funds gearing is particularly high. Net debt has increased by 15%
and so gearing levels are now 337%, the highest of any sector.
Property and Construction
As you travel round the county there is much evidence of the
vibrancy of the sector, with strong growth and investment in
commercial and residential property.
It is the fastest growing sector at turnover and profit level, both of
which are up by approximately a third. For a small sector it has
seen a high level of new entrants (3) and this has helped drive up
performance, although growth is seen across all companies in the
sector. However, Property and Construction remains the smallest
sector by turnover and second smallest by absolute profit level.
There has also been a 34% increase in people, again the highest of
any sector. Although, a reduction in average pay is seen across all
companies, so that the total for the sector is down 3% to £34,800.
Profits have been retained within the balance sheet such that
shareholder funds are up by 23%. Despite a slight increase in net
debt, gearing levels have actually dropped back a little to 161%, the
third highest.
2016 2015
Increase /
(decrease)
Turnover £m 252 188 34%
EBITDA £m 29 22 33%
EBITDA margin % 11% 11% -
Average pay £ (pa) 34,800 36,000 (3%)
No. of people employed 827 618 34%
Gearing % 161% 197% (36%)
Fixed assets £m 86 84 2%
Shareholders funds £m 74 60 23%
19

Cambridgeshire Limited 2016 Investing for success | Top 100 companies
Location, location, location
The location of businesses within Cambridgeshire shows that commercial activity is spread throughout our county. This is a sign of vibrancy of the whole county, not just the city centre hot spots. It is clear that the most profitable companies are in Cambridge city centre, many of these are technology companies located on the Science and Business Parks. This is in stark contrast to those companies in the ring of villages that circle the city. These perform far worse, generating only marginal profits.
Peterborough is home to one more company than Cambridge, although turnover and profit generation is less. It is perhaps surprising that Wisbech and the surrounding Fenland villages
are home to a relatively large number of companies and generate the second highest profit margin. These companies cover a range of different sectors, perhaps reflecting the commercial heritage of the area.
Cambridge and Peterborough are the locations with the highest number of people employed. With 10 companies Ely punches above its weight with 5,541 people, the third highest location.
Looking at average pay shows what most people would expect, high salaries in Cambridge, and these show a marked reduction as you move further away from the city. The one exception being Wisbech, a function of the mix of sectors found there.
Location No of companies Turnover £m EBITDA £m No of people Average pay pa
Peterborough 25 £1,641 £107 15,258 £22,600
Wisbech 11 £748 £51 3,812 £26,400
Ely 10 £1,017 £57 5,541 £22,400
Huntingdon 6 £1,284 £70 3,703 £22,900
St Ives 5 £492 £13 1,149 £28,800
Cambridge villages 19 £898 £2 5,014 £41,200
Cambridge City 24 £4,176 £775 18,397 £42,500
20

Cambridgeshire Limited 2016 Investing for success | Top 100 companies
Cambridgeshire Ltd 2016
A breakdown of the auditors used by the companies in Cambridgeshire Ltd is as follows:
2016
Grant Thornton UK LLP 19
Deloitte LLP 11
KPMG LLP 8
PricewaterhouseCoopers LLP 7
Ernest & Young LLP 5
MHA Macintyre Hudson LLP 4
Rawlinsons Chartered Accountants 4
RSM UK Audit LLP 4
Price Bailey LLP 4
Wheelers 3
Others (2 or less each) 31
21

Cambridgeshire Limited 2016 Investing for success | Top 100 companies
Grant Thornton is one of the world’s
leading organisations of independent
assurance, tax and advisory firms. These
firms help dynamic organisations unlock
their potential for growth by providing
meaningful, forward looking advice.
Proactive teams, led by approachable
partners in these firms, use insights,
experience and instinct to understand
complex issues for privately owned,
publicly listed and public sector clients
and help them to find solutions.
10/10Full service offering
Grant Thornton Cambridge
100 people 5 Partners Added value
'Clients would
use Grant
Thornton for
similar
engagements
in the future'
Leading financial and business
adviser to MSBs
Grant Thornton
Winner of the Accountancy Firm of the Year
Larger clients 2014 & 2016 (FD's Excellence Awards)
UK member firm of Grant Thornton International Ltd
185 Partners 4,756 people
Services over 40,000 individuals, privately held businesses and public interest entities
52%FTSE 100 are
non-auditclients
Grant Thornton UK LLP
In the UK, we are led by 185 partners
and employ over 4,300 of the
profession's brightest minds, operating
from 28 offices. We provide assurance,
tax and specialist advisory services to
over 40,000 privately-held businesses,
public interest entities and individuals
nationwide.
£520m
Turnover
28offices
Feeincome
$4.7bn
42,000+ people in 139 countries
Fastest growing of world's six largest accounting organisations
World's Most Attractive Employers
(Universum 2015)
Best Programme for Leadership
Managing Partners' Forum Awards 2015
Global methodologies, strategy, global brand, global values –
consistent global service
Grant Thornton International Ltd
We are a member firm of
Grant Thornton International Ltd.
More than 42,000 Grant Thornton
people across over 139 countries are
focused on making a difference to
clients, colleagues and the communities
in which we live and work.
Darren BearT +44 (0)7977 147108
Paul BrownT +44 (0)7773 314638
Phil SharpeT +44 (0)7798 662609
Audit 19 of Top 100
Science ParkLocation
22

For electronic copies please visit:
www.grantthornton.co.uk/CambridgeshireLtd
Alternatively to request printed copies of this report:
T 01223 225600

GRT104470