Investigation on the pressure response behavior of two ...
18
HAL Id: hal-03080855 https://hal.archives-ouvertes.fr/hal-03080855 Submitted on 17 Dec 2020 HAL is a multi-disciplinary open access archive for the deposit and dissemination of sci- entific research documents, whether they are pub- lished or not. The documents may come from teaching and research institutions in France or abroad, or from public or private research centers. L’archive ouverte pluridisciplinaire HAL, est destinée au dépôt et à la diffusion de documents scientifiques de niveau recherche, publiés ou non, émanant des établissements d’enseignement et de recherche français ou étrangers, des laboratoires publics ou privés. Investigation on the pressure response behavior of two-layer vertical mixed boundary reservoir: field cases in Western Sichuan XC gas field, China Wenyang Shi, Yuedong Yao, Shiqing Cheng, He Li, Mi Wang, Nan Cui, Chengwei Zhang, Hong Li, Kun Tu, Zhiliang Shi To cite this version: Wenyang Shi, Yuedong Yao, Shiqing Cheng, He Li, Mi Wang, et al.. Investigation on the pressure response behavior of two-layer vertical mixed boundary reservoir: field cases in Western Sichuan XC gas field, China. Oil & Gas Science and Technology - Revue d’IFP Energies nouvelles, Institut Français du Pétrole (IFP), 2021, 76, pp.2. 10.2516/ogst/2020082. hal-03080855
Transcript of Investigation on the pressure response behavior of two ...

HAL Id: hal-03080855https://hal.archives-ouvertes.fr/hal-03080855
Submitted on 17 Dec 2020
HAL is a multi-disciplinary open accessarchive for the deposit and dissemination of sci-entific research documents, whether they are pub-lished or not. The documents may come fromteaching and research institutions in France orabroad, or from public or private research centers.
L’archive ouverte pluridisciplinaire HAL, estdestinée au dépôt et à la diffusion de documentsscientifiques de niveau recherche, publiés ou non,émanant des établissements d’enseignement et derecherche français ou étrangers, des laboratoirespublics ou privés.
Investigation on the pressure response behavior oftwo-layer vertical mixed boundary reservoir: field cases
in Western Sichuan XC gas field, ChinaWenyang Shi, Yuedong Yao, Shiqing Cheng, He Li, Mi Wang, Nan Cui,
Chengwei Zhang, Hong Li, Kun Tu, Zhiliang Shi
To cite this version:Wenyang Shi, Yuedong Yao, Shiqing Cheng, He Li, Mi Wang, et al.. Investigation on the pressureresponse behavior of two-layer vertical mixed boundary reservoir: field cases in Western Sichuan XCgas field, China. Oil & Gas Science and Technology - Revue d’IFP Energies nouvelles, Institut Françaisdu Pétrole (IFP), 2021, 76, pp.2. �10.2516/ogst/2020082�. �hal-03080855�

Investigation on the pressure response behavior of two-layervertical mixed boundary reservoir: field cases inWestern Sichuan XC gas field, ChinaWenyang Shi1,2, Yuedong Yao1,*, Shiqing Cheng1,*, He Li1, Mi Wang2, Nan Cui2, Chengwei Zhang1,Hong Li1, Kun Tu1, and Zhiliang Shi3
1 State Key Laboratory of Petroleum Resources and Prospecting, China University of Petroleum, 102249 Beijing, PR China2University of Leeds, LS2 9JT Leeds, UK3 SINOPEC Petroleum Exploration and Production Research Institute, 100083 Beijing, PR China
Received: 23 June 2020 / Accepted: 15 October 2020
Abstract. Pressure response behavior of two-layered reservoir with a vertical mixed boundary is easy to bemistaken for that of the radial composite reservoir or dual-pore reservoir. It is difficult to fit the pressureresponse curve and easy to obtain abnormal parameter values using a misunderstood model. In this paper,we present the interpretation of three different types of pressure responses of vertical mixed boundary reservoirby our proposed models, where the diagnostic window and feature value are captured for different mixedboundary types. Results show that the mixed boundary with closed boundary and infinite-acting boundaryinduces the fake pressure response of a radial composite reservoir with poor permeability outer zone. The mixedboundary with the main constant-pressure and non-main closed boundary produces a fake pressure response ofa dual-porosity reservoir. The diagnostic window of pressure response curves shape can easily capture the mixedboundary type, and the feature value of the feature values of pressure response value can quickly obtain thepermeability ration of one layer. Aiming at different representative types of pressure response cases in thewestern Sichuan XC gas field, China, we innovatively analyze them from a different perspective and get anew understanding of pressure response behavior of vertical mixed boundary, which provides a guideline forthe interpretation of layered oil and gas reservoir with the complex boundary in the vertical direction.
NomenclatureParameters and variables
B Fluid isotherm volume factor, m3/m3
C Wellbore storage coefficient, m3/MPac Fluid compressibility, MPa�1
ct Total compressibility of the reservoir, MPa�1
h Reservoir thickness of, mk Permeability, mDpi Initial reservoir pressure, MPapw Bottom-hole pressure, MPaq Producing rate, m3/dr Radial distance, mre Boundary distance, mrw Well radius, mS Skin factor, dimensionlesst Production time, hZ Gas compressibility factor, dimensionless
l Viscosity, mPa�s/ Porosity, %
Subscripts and superscripts
�� Laplace domain parameter **D Dimensionless parameter **j Layer j Parameter **g Gas parameter *
Symbols
1 Infinite-acting boundaryH Closed boundaryX Const-pressure bounded boundary
1 Introduction
Modern well testing interpretation and analysis methodshave a wide range of applications in acquiring reservoir
* Corresponding authors: [email protected];[email protected]
This is an Open Access article distributed under the terms of the Creative Commons Attribution License (https://creativecommons.org/licenses/by/4.0),which permits unrestricted use, distribution, and reproduction in any medium, provided the original work is properly cited.
Oil & Gas Science and Technology – Rev. IFP Energies nouvelles 76, 2 (2021) Available online at:�W. Shi et al., published by IFP Energies nouvelles, 2020 ogst.ifpenergiesnouvelles.fr
https://doi.org/10.2516/ogst/2020082
REGULAR ARTICLEREGULAR ARTICLE
physical property parameters and detecting reservoirboundary information [1–5]. Lefkovits et al. [6] firstanalyzed the pressure dynamic characteristics of combinedproduction wells and laid the foundation for the well testingmethod of multi-layer combined production reservoirs.However, more and more oil and gas field reservoirs with
complex boundaries have been discovered with the deple-tion of conventional oil and gas resources and the improve-ment of exploration technology.
The Pressure Transient Analysis (PTA) method is aneffective technology to capture the boundary informationof the layered reservoir based on the well test data [7].
(a)
(b)
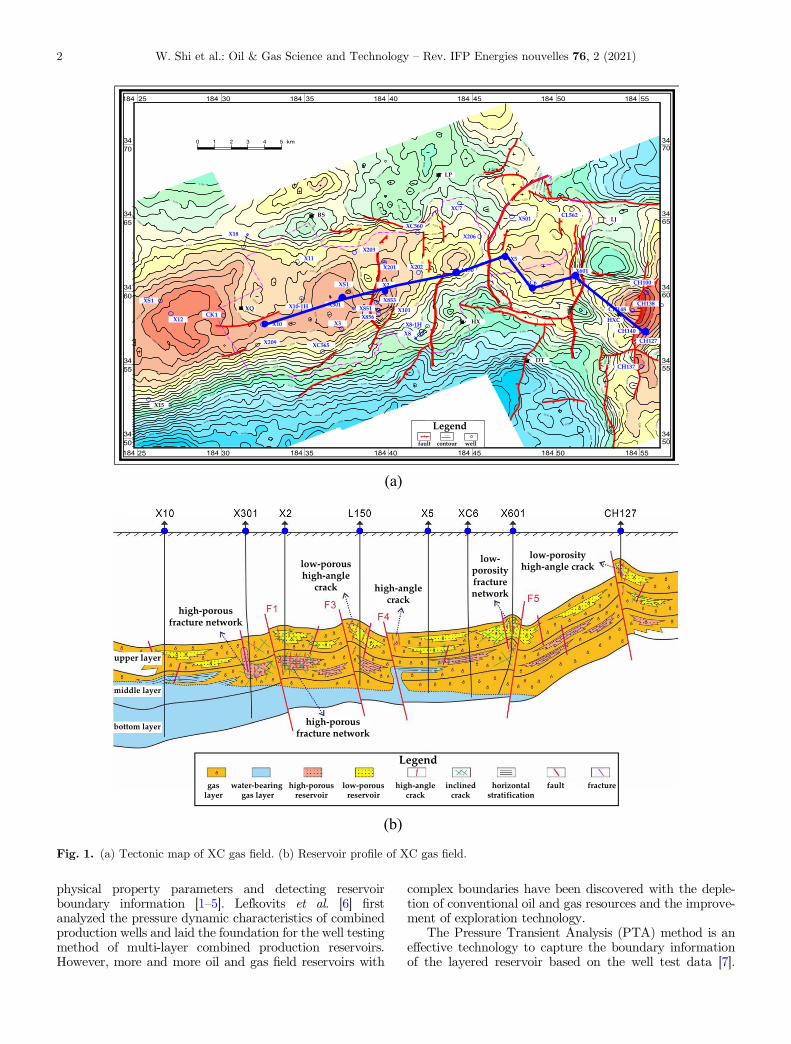
Fig. 1. (a) Tectonic map of XC gas field. (b) Reservoir profile of XC gas field.
W. Shi et al.: Oil & Gas Science and Technology – Rev. IFP Energies nouvelles 76, 2 (2021)2
Chao et al. [8] analyzed the responses of commingled sys-tems with mixed inner and outer boundary conditions usingpressure response derivatives and discussed the pressureresponse derivative characteristics of a unique reservoirradius in a two-layer reservoir. However, the two-layerreservoir only can capture the four type boundaries: thetop-boundary distant larger than the bottom-boundarywith high-permeability or low-permeability top-layer, andthe bottom-layer distant larger than the top-layer withhigh-permeability or low-permeability top-layer. Shi et al.[9] extended the n-layered reservoir with the outer-convexshape reservoir boundary radius. Their case studies showthat the pressure response of a reservoir with a verticalnon-uniform boundary distance can easily be mistaken forthe pressure response of a radial composite reservoir. Sunet al. [10] have proved that the vertical inhomogeneousclosed boundary may produce a fake pressure responsebehavior of a radial composite reservoir with poor perme-ability outer zone, and interpreted this phenomenon by atype gas well in the western Sichuan Basin. Shi et al. [11]use a two-layer reservoir with different boundary types inthe vertical direction show that the pressure responsebehavior in the radial composite reservoir model probablyinduced by a two-layer reservoir with one closed boundedlayer and another infinite layer, and the pressure responsebehavior in dual-pore reservoir model may be caused by atwo-layer reservoir with one closed layer and anotherconstant-pressure layer.
Apart from using transient well testing pressure data,geophysical 4D seismic data is nowadays an importantway to investigate boundaries [12]. Yin et al. [13] compre-hensively reviewed the role of 4D time-lapse seismic technol-ogy as a reservoir monitoring and surveillance tool, anddetails discussed the application of 4D seismic technologyin extending the life of hydrocarbon fields and improvinghydrocarbon recovery, with specific consideration to theprogresses made over the last decades. Suleen et al.[14, 15] applied the pressure transient analysis and 4D seis-mic to integrated waterflood surveillance. In their paper,the deep-water case study results show that the Integrationof an engineering technique, namely PTA, with geophysicaldata such as 4D interpretation, lends deeper insights intothe dynamic changes in the reservoir whereas either
standalone method would be more limited in application.Yin et al. [16] enhanced the dynamic reservoir interpreta-tion by correlating multiple 4D seismic monitors to wellbehavior. In detail, the cross-correlation, “well2seis”, wasachieved by defining a linear relationship between the 4Dseismic signals and changes in the cumulative fluid volumesat the wells. Sambo et al. [17] extended the newly developed“well2seis” technique to evaluate the inter-well connectivityusing well fluctuations and 4D seismic data.
The XC gas field in western Sichuan, China, has devel-oped abundant reverse faults in the northeast-southwestdirection (Fig. 1a). The industrial production gas well islocated near the fault zone because there are more high-angle cracks and fracture networks near the fault(Fig. 1b). The complex reservoir structure and fluid distri-bution bring many difficulties and challenges to capturethe reservoir information and analyze the transient behav-ior of production gas well. Given the poor matching ofthe pressure response and abnormal parameter values ofthe XC gas field interpreted by the conventional radialcomposite reservoir and the dual-pore reservoir model, theresults interpreted based on these misleading pressureresponse behaviors are likely to be wrong.
To solve this problem and better understand thismisleading pressure response phenomenon, this paper, basedon the theoretical research of reference [11], reviews andextends three representative pressure responses behavior ofthe vertical mixed boundary reservoir. Firstly, the pressureresponse behavior and flow regime characteristics aresummary and comparison under three mixed boundarytypes, including infinite mixed boundary, equidistantmixed boundary, and non-equidistant mixed boundary.After that, the diagnosis and capture method of three mixedboundary types is presented. Lastly, pressure responses ofthree typical production gas well in the XC gas field,Western Sichuan Basin, are interpreted by the modelswe proposed to give the transient pressure well-testingengineer and analyzer a new and comprehensive under-standing of the pressure response behaviors in the verticalmixed boundary reservoir.
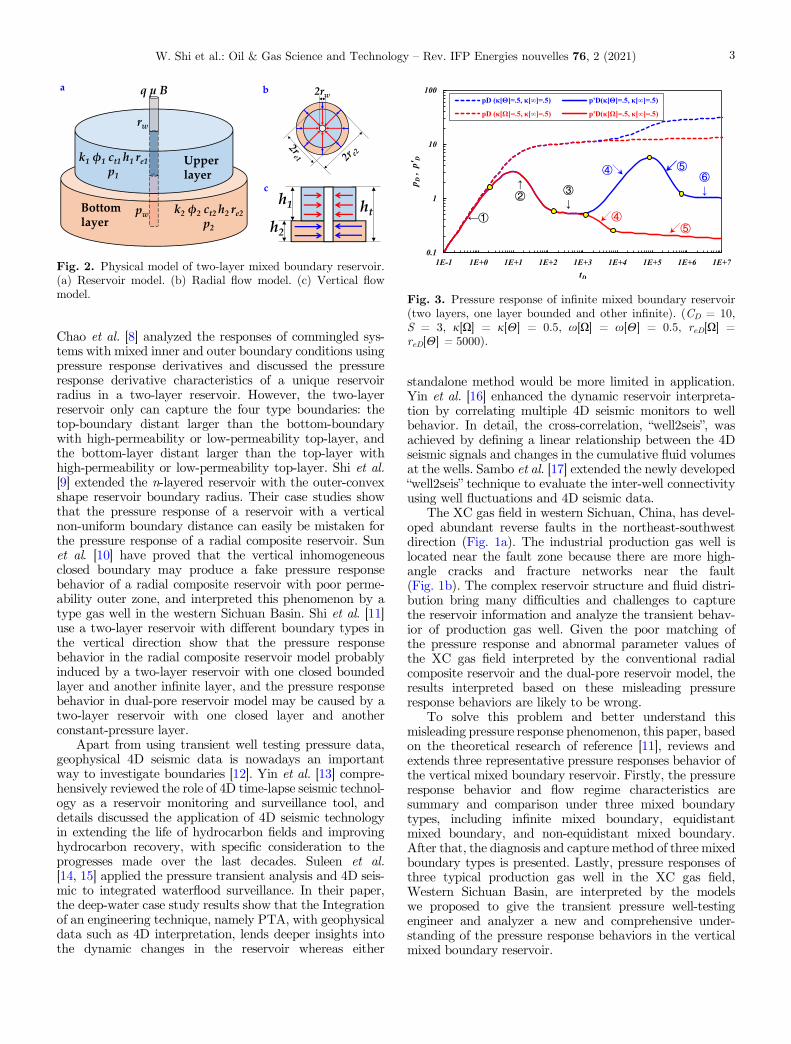
Fig. 2. Physical model of two-layer mixed boundary reservoir.(a) Reservoir model. (b) Radial flow model. (c) Vertical flowmodel. Fig. 3. Pressure response of infinite mixed boundary reservoir
(two layers, one layer bounded and other infinite). (CD = 10,S = 3, j[X] = j[H] = 0.5, x[X] = x[H] = 0.5, reD[X] =reD[H] = 5000).
W. Shi et al.: Oil & Gas Science and Technology – Rev. IFP Energies nouvelles 76, 2 (2021) 3

2 Methodology
2.1 Model and solution
The physical model of the two-layer mixed boundary reser-voir with different boundary types and boundary distancesas shown in Figure 2a. The basic assumptions are presentedas follows:
1. The physical properties of each layer are different,including permeability (k), porosity (/), total com-pressibility (ct), thickness (h), pressure (p), boundaryradius (re), boundary type (constant-pressure bound-ary X, closed boundary H, infinite-acting boundary1), and each horizontal layer is homogeneous isother-mal and isotropic.
Table 1. Boundary flow response behavior of Figure 3.
Symbol description Closed & infinite, reD[H] & reD[1] Const-pressure & infinite, reD[X] & reD[1]
Model sketch
Identifiable window
0.1
1
1E+3 1E+5 1E+7
Response behavior rWellbore storage: unit slope rWellbore storage: unit slopesSkin transition flow sSkin transition flowtIARF: const derivative 0.5 tIARF: const derivative 0.5uCBF: unit slop uCpBF: const slope (�2.5 is its limit)vCpBF vPseudo-CpBF: const slope m = aj[X]wPseudo-IARF: const derivative l = l0/j[1]
Where j[1] is the permeability ratio of infinite layer, l0 is the pressure derivative value when the j[X] = 1, a is thecoefficient.Notes: “IARF” is Infinite-Acting Radial Flow, “CBF” is Closed Boundary Flow, “CpBF” is the Const-Pressure Boundaryflow.
Fig. 4. Pressure response of equidistant mixed boundaryreservoir (two layers, one layer closed and other const-pressure).(CD = 10, S = 3, j[X] 6¼ j[H], x[X] = x[H] = 0.5,reD[X] = reD[H] = 5000).
Fig. 5. Pressure response of non-equidistant mixed boundaryreservoir (closed boundary is near, and const-pressure boundaryis far). (CD = 10, S = 3, j[H] = {0.1, 0.9}, j[X] = {0.1, 0.9},x[X] = x[H] = 0.5, reD[H] = 5000, reD[X] = 500 000).
W. Shi et al.: Oil & Gas Science and Technology – Rev. IFP Energies nouvelles 76, 2 (2021)4
2. Before well opening, the reservoir is filled with single-phase, slightly compressible liquid. During produc-tion, the viscosity (l) and volume factor (B) of liquidremain constant.
3. The initial pressure (pi) in the upper layer and bottomlayer are uniform before well opening. The welllocated at the center of the reservoir, and the bottom-hole pressure (pw) changes with the production timewhen the production rate (q) is constant.
4. Fluid from each layer only flows radially into the well-bore (rw) from that layer (Fig. 2b). No formationcrossflow occurs between the upper layer and the bot-tom layer due to the existence of an impermeableinterlayer (Fig. 2c).
5. Thewellbore storage and skin effect are considered.Thegravity effect and temperature change are negligible.
Appendix A in reference [11] gives the dimensionlessmathematical model of Figure 2 in the Laplace domainthrough the Laplace transform [18–20]. Based on the Besselequation solution [21], Cramer’s rule [22], Duhamel’s
principle [23], and Stehfest numerical inversion [24],Appendix B in reference [11] provides the dimensionlessbottom-hole pressure response solution in the real-timedomain. The pressure response and its derivative combinedtype curves in the log–log coordinate can be drawn todiagnose the flow characteristics and capture the boundaryinformation. Appendix C in reference [11] provides therelationship between the draw-off well test method andthe build-up well test method [25].
2.2 Pressure response behavior
2.2.1 Infinite mixed boundary
Figure 3 is the pressure and pressure derivative combinedtype curves of the mixed boundary reservoir with one layerbounded and other infinite. Table 1 is the flow regimescharacteristics and pressure response behavior of Figure 3.where the pseudo-IARF is the identifiable feature in theidentifiable window of the reD[H] & reD[1], and “pseudo-CpBF” is the identifiable feature in the identifiable windowof the reD[X] & reD[1]. Readers should be careful to note
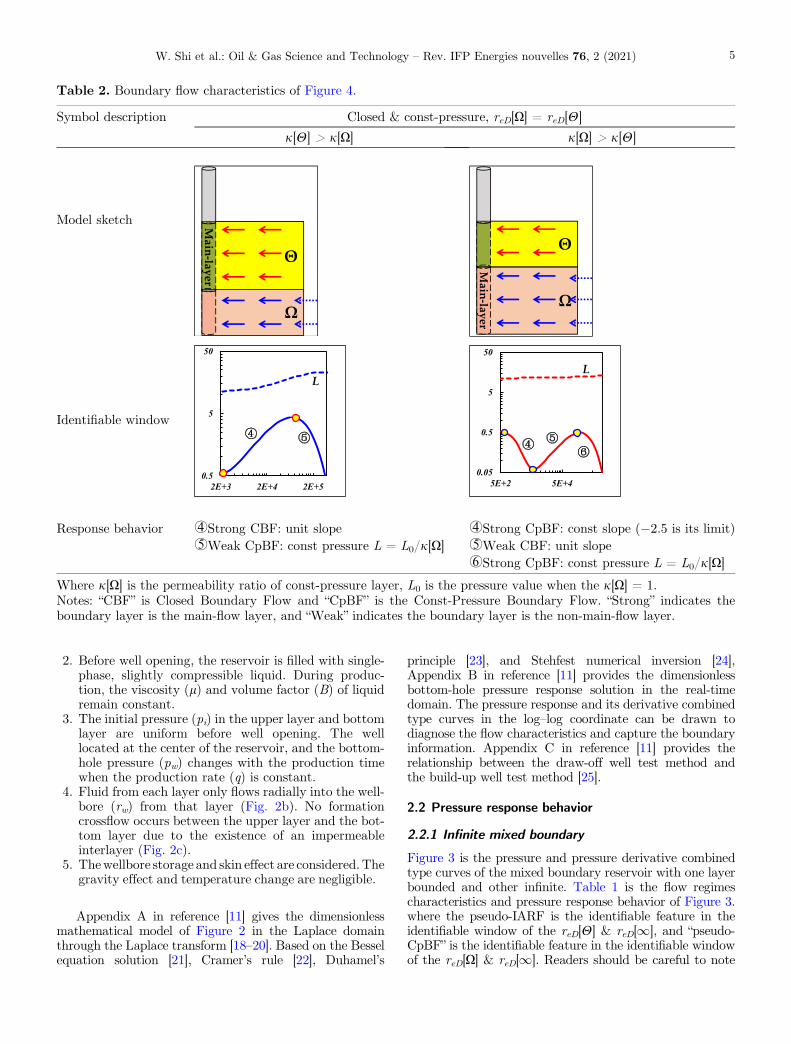
Table 2. Boundary flow characteristics of Figure 4.
Symbol description Closed & const-pressure, reD[X] = reD[H]
j[H] > j[X] j[X] > j[H]
Model sketch
Identifiable window
0.5
5
50
2E+3 2E+4 2E+50.05
0.5
5
50
5E+2 5E+4
Response behavior uStrong CBF: unit slope uStrong CpBF: const slope (�2.5 is its limit)vWeak CpBF: const pressure L = L0/j[X] vWeak CBF: unit slope
wStrong CpBF: const pressure L = L0/j[X]
Where j[X] is the permeability ratio of const-pressure layer, L0 is the pressure value when the j[X] = 1.Notes: “CBF” is Closed Boundary Flow and “CpBF” is the Const-Pressure Boundary Flow. “Strong” indicates theboundary layer is the main-flow layer, and “Weak” indicates the boundary layer is the non-main-flow layer.
W. Shi et al.: Oil & Gas Science and Technology – Rev. IFP Energies nouvelles 76, 2 (2021) 5
that the pressure response behavior of reD[H] & reD[1] isvery similar to that of the radial composite reservoir withpoor permeability outer zone.
2.2.2 Equidistant mixed boundary
Figure 4 is the pressure response behavior of the equidistantmixed boundary reservoir with one layer closed and otherconstant pressure. Table 2 is the boundary flow character-istics and pressure response behavior of Figure 4. The “firstCBF and then CpBF” is the identification window of thereD[X] = reD[H]. The appearance of CBF means the closedlayer is the main-flow layer (j[H] > j[X]), and the appear-ance of CpBF means the constant-pressure layer is themain-flow layer (j[X] > j[H]). Readers should be carefulto note that the pressure response behavior of reD[X] &reD[H] when j[X] > j[H] is very similar to that of thedual-pores reservoir with an obvious V shape.
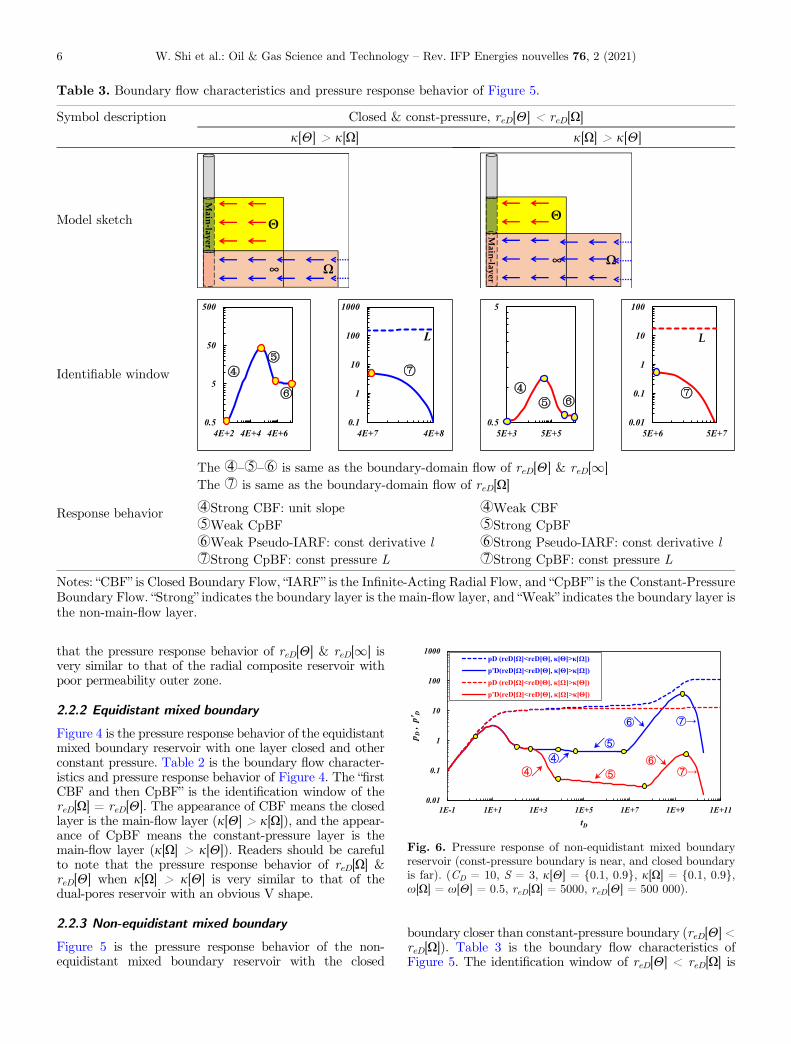
2.2.3 Non-equidistant mixed boundary
Figure 5 is the pressure response behavior of the non-equidistant mixed boundary reservoir with the closed
boundary closer than constant-pressure boundary (reD[H] <reD[X]). Table 3 is the boundary flow characteristics ofFigure 5. The identification window of reD[H] < reD[X] is
Table 3. Boundary flow characteristics and pressure response behavior of Figure 5.
Symbol description Closed & const-pressure, reD[H] < reD[X]
j[H] > j[X] j[X] > j[H]
Model sketch
Identifiable window
0.5
5
50
500
4E+2 4E+4 4E+60.1
1
10
100
1000
4E+7 4E+8
L
0.5
5
5E+3 5E+50.01
0.1
1
10
100
5E+6 5E+7
Response behavior
The u–v–w is same as the boundary-domain flow of reD[H] & reD[1]The x is same as the boundary-domain flow of reD[X]
uStrong CBF: unit slope uWeak CBFvWeak CpBF vStrong CpBFwWeak Pseudo-IARF: const derivative l wStrong Pseudo-IARF: const derivative lxStrong CpBF: const pressure L xStrong CpBF: const pressure L
Notes: “CBF” is Closed Boundary Flow, “IARF” is the Infinite-Acting Radial Flow, and “CpBF” is the Constant-PressureBoundary Flow. “Strong” indicates the boundary layer is the main-flow layer, and “Weak” indicates the boundary layer isthe non-main-flow layer.
Fig. 6. Pressure response of non-equidistant mixed boundaryreservoir (const-pressure boundary is near, and closed boundaryis far). (CD = 10, S = 3, j[H] = {0.1, 0.9}, j[X] = {0.1, 0.9},x[X] = x[H] = 0.5, reD[X] = 5000, reD[H] = 500 000).
W. Shi et al.: Oil & Gas Science and Technology – Rev. IFP Energies nouvelles 76, 2 (2021)6
the first identifiable window of reD[H] & reD[1] and thenthe identifiable window of reD[X]. The larger the permeabil-ity ratio of closed layer k[H], the more obvious the identifi-able window of reD[H] & reD[1].
Figure 6 is the pressure response behavior of thenon-equidistant mixed boundary reservoir with the
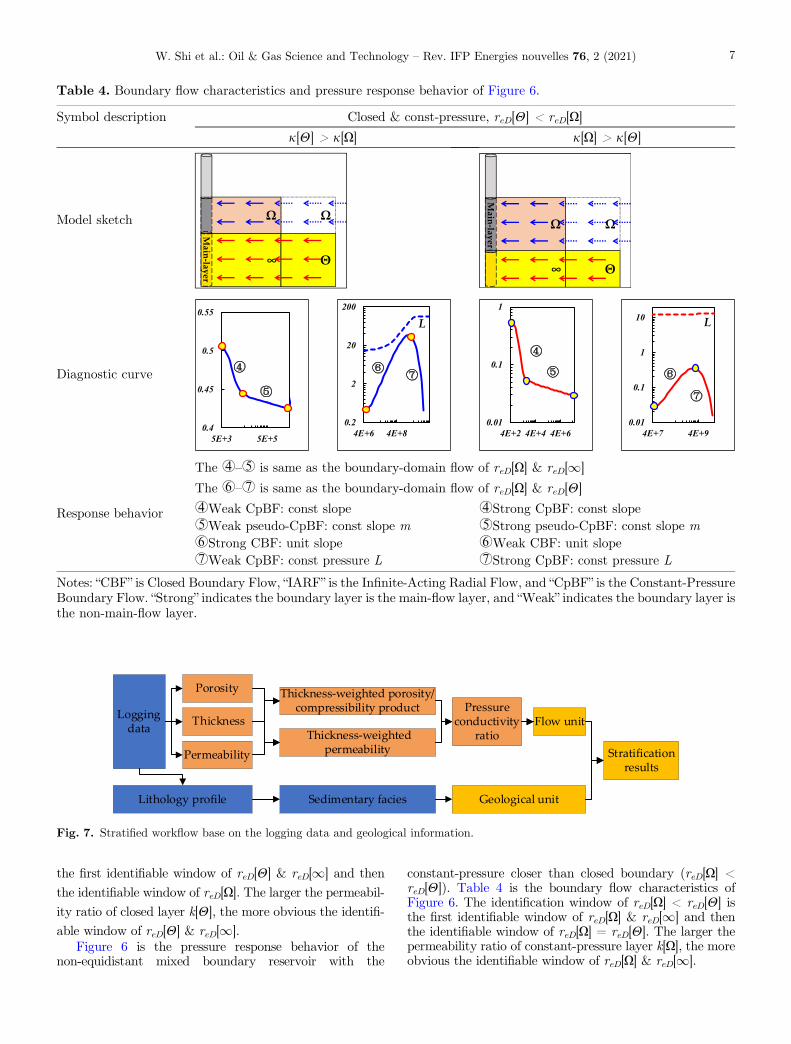
constant-pressure closer than closed boundary (reD[X] <reD[H]). Table 4 is the boundary flow characteristics ofFigure 6. The identification window of reD[X] < reD[H] isthe first identifiable window of reD[X] & reD[1] and thenthe identifiable window of reD[X] = reD[H]. The larger thepermeability ratio of constant-pressure layer k[X], the moreobvious the identifiable window of reD[X] & reD[1].
Table 4. Boundary flow characteristics and pressure response behavior of Figure 6.
Symbol description Closed & const-pressure, reD[H] < reD[X]
j[H] > j[X] j[X] > j[H]
Model sketch
Diagnostic curve
0.4
0.45
0.5
0.55
5E+3 5E+5
0.2
2
20
200
4E+6 4E+8
0.01
0.1
1
4E+2 4E+4 4E+6
0.01
0.1
1
10
4E+7 4E+9
Response behavior
The u–v is same as the boundary-domain flow of reD[X] & reD[1]
The w–x is same as the boundary-domain flow of reD[X] & reD[H]uWeak CpBF: const slope uStrong CpBF: const slopevWeak pseudo-CpBF: const slope m vStrong pseudo-CpBF: const slope mwStrong CBF: unit slope wWeak CBF: unit slopexWeak CpBF: const pressure L xStrong CpBF: const pressure L
Notes: “CBF” is Closed Boundary Flow, “IARF” is the Infinite-Acting Radial Flow, and “CpBF” is the Constant-PressureBoundary Flow. “Strong” indicates the boundary layer is the main-flow layer, and “Weak” indicates the boundary layer isthe non-main-flow layer.
Fig. 7. Stratified workflow base on the logging data and geological information.
W. Shi et al.: Oil & Gas Science and Technology – Rev. IFP Energies nouvelles 76, 2 (2021) 7
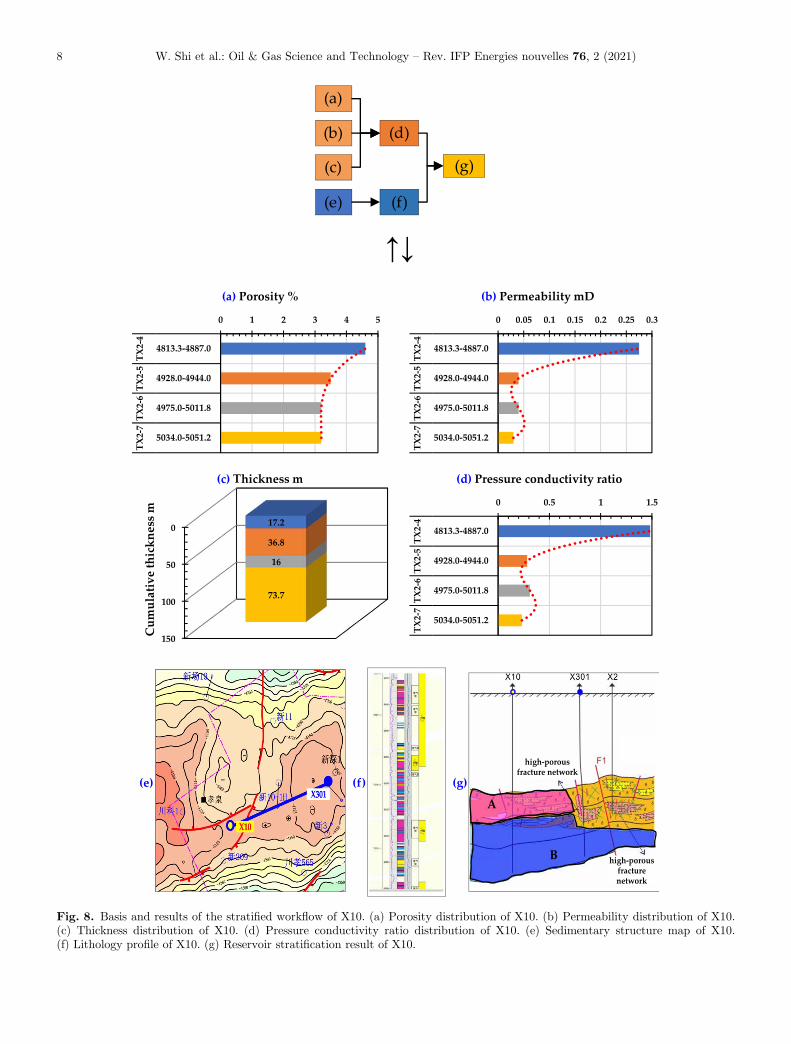
Fig. 8. Basis and results of the stratified workflow of X10. (a) Porosity distribution of X10. (b) Permeability distribution of X10.(c) Thickness distribution of X10. (d) Pressure conductivity ratio distribution of X10. (e) Sedimentary structure map of X10.(f) Lithology profile of X10. (g) Reservoir stratification result of X10.
W. Shi et al.: Oil & Gas Science and Technology – Rev. IFP Energies nouvelles 76, 2 (2021)8
3 Field cases
In this part, the well cases from the XC gas field, westernSichuan Basin, China are analyzed in detail through themodels andmethods provided above. As shown in Figure 1a,there are abundant reverse faults in the reservoir of the XCgas field in the North–South direction, and the overall reser-voir is low in the east and high in the west. Figure 1b is thecross-well profile (X10–X301–X2–L150–X5–X601–CH127)of the blue line in Figure 1a. On the one hand, the cross-well profile shows the gas reservoir has obvious layeredcharacteristics in the vertical direction. The upper layer is
a low-porosity gas-bearing layer, the middle layer is ahigh-porosity gas-bearing layer, and the bottom layer is awater-bearing gas layer that gradually thins and disappearsfrom east to west. On the other hand, there are a lot ofcracks and fractures near the fault. Therefore, the reservoiris very complex and strongly heterogeneous in the verticaland horizontal directions. In the following analysis case,the reservoir of the target well stratified by the workflowshown in Figure 7. The workflow considers two judgmentconditions, flow unit obtained by the logging data, and
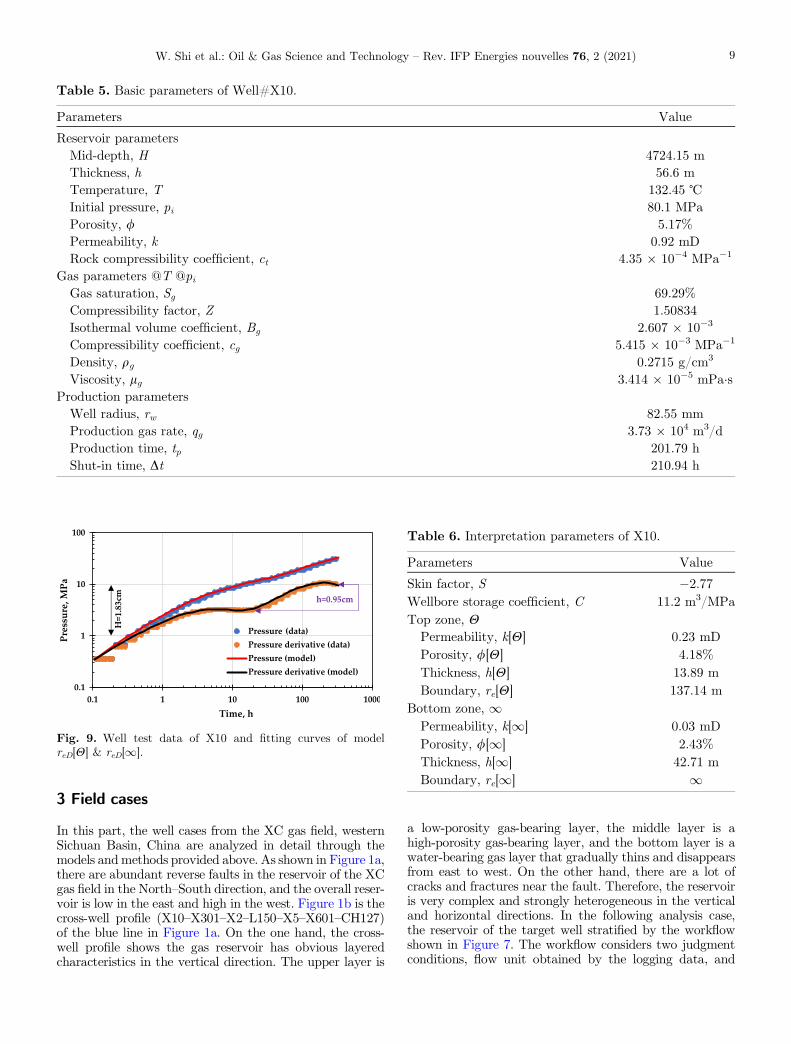
Table 5. Basic parameters of Well#X10.
Parameters Value
Reservoir parametersMid-depth, H 4724.15 mThickness, h 56.6 mTemperature, T 132.45 ℃Initial pressure, pi 80.1 MPaPorosity, / 5.17%Permeability, k 0.92 mDRock compressibility coefficient, ct 4.35 � 10�4 MPa�1
Gas parameters @T @piGas saturation, Sg 69.29%Compressibility factor, Z 1.50834Isothermal volume coefficient, Bg 2.607 � 10�3
Compressibility coefficient, cg 5.415 � 10�3 MPa�1
Density, qg 0.2715 g/cm3
Viscosity, lg 3.414 � 10�5 mPa�sProduction parameters
Well radius, rw 82.55 mmProduction gas rate, qg 3.73 � 104 m3/dProduction time, tp 201.79 hShut-in time, Dt 210.94 h
Fig. 9. Well test data of X10 and fitting curves of modelreD[H] & reD[1].
Table 6. Interpretation parameters of X10.
Parameters Value
Skin factor, S �2.77Wellbore storage coefficient, C 11.2 m3/MPaTop zone, H
Permeability, k[H] 0.23 mDPorosity, /[H] 4.18%Thickness, h[H] 13.89 mBoundary, re[H] 137.14 m
Bottom zone, 1Permeability, k[1] 0.03 mDPorosity, /[1] 2.43%Thickness, h[1] 42.71 mBoundary, re[1] 1
W. Shi et al.: Oil & Gas Science and Technology – Rev. IFP Energies nouvelles 76, 2 (2021) 9

the geological unit came from the lithology profile and sed-imentary facies. The method of judging the flow unit of amulti-layer reservoir can be found in reference [11].
3.1 Case well of closed and infinite model
Well#X10 is a vertical production gas well located in theNortheast corner of a northeast closed intersecting faultzone (Fig. 8e). In terms of flow unit, the pressure conductiv-ity ratio distribution (Fig. 8d) is calculated by the loggingdate including the porosity (Fig. 8a), permeability(Fig. 8b), and thickness information (Fig. 8c). In terms ofgeological unit, the reservoir lithology profile (Fig. 8f) isyielded by the structure sedimentary facies (Fig. 8e). Onthe one hand, the flow unit and geological unit consistently
show that the top zone (A in Fig. 8g) is a better productiongas layer than the bottom zone (B in Fig. 8g). On the otherhand, the top near-well zone is a relatively closed boundedzone due to there are a high-porous fracture network andfault (F1 in Fig. 8g) in the top far-well zone, and thebottom zone is a very wide water-bearing gas layer farlarger than the top zone. Therefore, the mixed boundaryreservoir model with bounded closed top zone and infi-nite-acting bottom zone, reD[H] & reD[1], is used to analyzeX10. The basic parameters including the reservoir parame-ters, gas parameters, and production parameters of X10 arelisted in Table 5.
Based on the relationship between the pressure draw-down and the pressure build-up, use the selected modelreD[H] & reD[1], to fit pressure build-up data of X10.
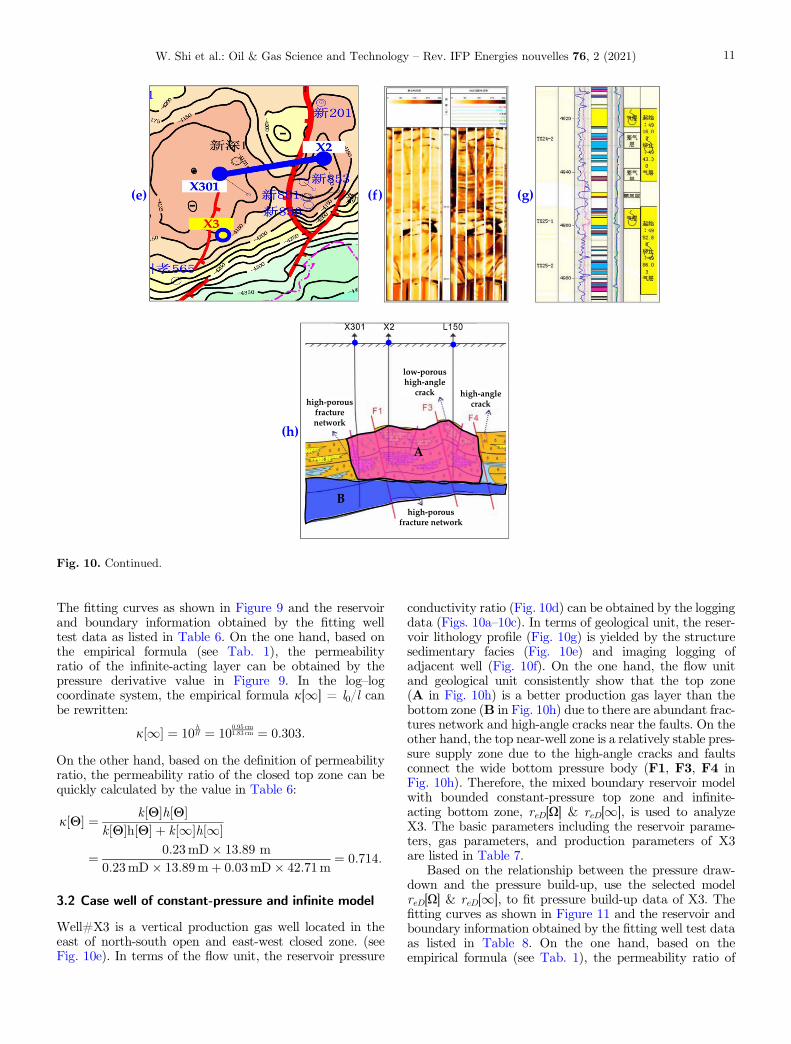
Fig. 10. Basis and results of the stratified workflow of X3. (a) Porosity distribution. (b) Permeability distribution. (c) Thicknessdistribution. (d) Pressure conductivity ratio distribution. (e) Sedimentary structure map of X3. (f) Imaging logging of X3.(g) Lithology profile of adjacent wells X301. (h) Reservoir stratification result of X301.
W. Shi et al.: Oil & Gas Science and Technology – Rev. IFP Energies nouvelles 76, 2 (2021)10
The fitting curves as shown in Figure 9 and the reservoirand boundary information obtained by the fitting welltest data as listed in Table 6. On the one hand, based onthe empirical formula (see Tab. 1), the permeabilityratio of the infinite-acting layer can be obtained by thepressure derivative value in Figure 9. In the log–logcoordinate system, the empirical formula j[1] = l0/l canbe rewritten:
j 1½ � ¼ 10hH ¼ 10
0:95 cm1:83 cm ¼ 0:303:
On the other hand, based on the definition of permeabilityratio, the permeability ratio of the closed top zone can bequickly calculated by the value in Table 6:
j H½ � ¼ k½H�h½H�k H½ �h H½ � þ k 1½ �h½1�
¼ 0:23mD� 13:89 m0:23mD� 13:89mþ 0:03mD� 42:71m
¼ 0:714:
3.2 Case well of constant-pressure and infinite model
Well#X3 is a vertical production gas well located in theeast of north-south open and east-west closed zone. (seeFig. 10e). In terms of the flow unit, the reservoir pressure
conductivity ratio (Fig. 10d) can be obtained by the loggingdata (Figs. 10a–10c). In terms of geological unit, the reser-voir lithology profile (Fig. 10g) is yielded by the structuresedimentary facies (Fig. 10e) and imaging logging ofadjacent well (Fig. 10f). On the one hand, the flow unitand geological unit consistently show that the top zone(A in Fig. 10h) is a better production gas layer than thebottom zone (B in Fig. 10h) due to there are abundant frac-tures network and high-angle cracks near the faults. On theother hand, the top near-well zone is a relatively stable pres-sure supply zone due to the high-angle cracks and faultsconnect the wide bottom pressure body (F1, F3, F4 inFig. 10h). Therefore, the mixed boundary reservoir modelwith bounded constant-pressure top zone and infinite-acting bottom zone, reD[X] & reD[1], is used to analyzeX3. The basic parameters including the reservoir parame-ters, gas parameters, and production parameters of X3are listed in Table 7.
Based on the relationship between the pressure draw-down and the pressure build-up, use the selected modelreD[X] & reD[1], to fit pressure build-up data of X3. Thefitting curves as shown in Figure 11 and the reservoir andboundary information obtained by the fitting well test dataas listed in Table 8. On the one hand, based on theempirical formula (see Tab. 1), the permeability ratio of
Fig. 10. Continued.
W. Shi et al.: Oil & Gas Science and Technology – Rev. IFP Energies nouvelles 76, 2 (2021) 11

constant-pressure bottom zone can be obtained by the pres-sure derivative value in Figure 11:
j X½ � ¼ ma¼ tan h2
tan h1¼ 0:307
0:845¼ 0:365:
On the other hand, based on the definition of permeabilityratio, the permeability ratio of constant-pressure bottomzone can be quickly calculated by the value in Table 8:
j X½ � ¼ k X½ �h½X�k X½ �h X½ � þ k 1½ �h½1�
¼ 0:414mD� 8:5m0:414mD� 8:5 mþ 0:198 mD� 27 m
¼ 0:397:
3.3 Case well of closed and constant-pressure model
Well#X5 is a vertical production gas well located in thesouth of a groove-shaped closed fault zone (see Fig. 12e).In terms of the flow unit, the reservoir pressure conductivityratio (Fig. 12d) can be obtained by the logging data(Figs. 12a–12c). In terms of the geological unit, reservoirlithology profile (Fig. 10g) is yielded by the structure sedi-mentary facies (Fig. 10e) and imaging logging (Fig. 10f). Onthe one hand, the flow unit and geological unit consistentlyshow that the top zone (B in Fig. 12h) is a better produc-tion gas layer than the bottom zone (A in Fig. 12h) due to
Table 7. Basic parameters of X3.
Parameters Value
Reservoir parametersMid-depth, H 4887.7 mThickness, h 35.5 mTemperature, T 131.98 �CInitial pressure, pi 68.74 MPaPorosity, / 4.36%Permeability, k 23.20 mDRock compressibility coefficient, ct 4.35 � 10�4 MPa�1
Gas parameters @T @piGas saturation, Sg 44.97%Compressibility factor, Z 1.3764Isothermal volume coefficient, Bg 2.836 � 10�3
Compressibility coefficient, cg 6.989 � 10�3 MPa�1
Density, qg 0.248 g/cm3
Viscosity, lg 3.149 � 10�5 mPa�sProduction parameters
Well radius, rw 74.60 mmProduction gas rate, qg [7.01, 11.51, 15.15, 19.93] 104 m3/dProduction time, tp [28.25, 24, 23, 46] hShut-in time, Dt 138.99 h
Fig. 11. Well test data of X3 and fitting curves of modelreD[X] & reD[1].
Table 8. Interpretation parameters of X3.
Parameters Value
Skin factor, S 1.67Wellbore storage coefficient, C 2.33 m3/MPaBounded constant-pressure top zone, X
Permeability, k[X] 0.414 mDPorosity, /[X] 6.9%Thickness, h[X] 8.5 mBoundary, re[X] 202.5 m
Infinite-acting bottom zone, 1Permeability, k[1] 0.198 mDPorosity, /[1] 3.5%Thickness, h[1] 27 mBoundary, re[1] 1
W. Shi et al.: Oil & Gas Science and Technology – Rev. IFP Energies nouvelles 76, 2 (2021)12

the porosity and permeability of the top zone is higher thanthat of the bottom zone. On the other hand, the imaginglogging and reservoir profile consistently show the bottomwater can easily invade the top zone through the fault(F4 & F5 in Fig. 12h) and high-angle cracks. Therefore,the mixed boundary reservoir model with bounded con-stant-pressure top zone and the bounded closed bottomzone, reD[X] & reD[H], is used to analyze X5. The basicparameters including the reservoir parameters, gas parame-ters, and production parameters of X5 are listed in Table 9.
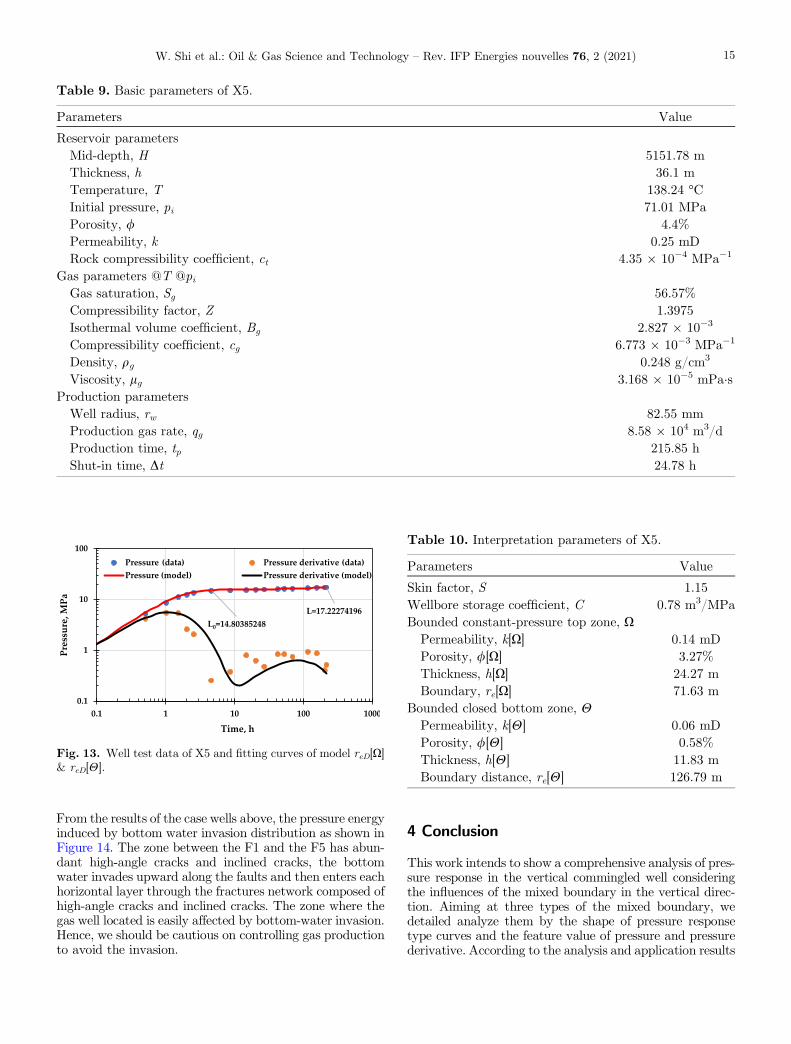
Due to the production time is far longer than the shut-intime, so the pressure draw-down response model chosen tofit the well test data. The fitting curves as shown inFigure 13 and the reservoir and boundary informationobtained by the fitting well test data as shown in Table 10.
On the one hand, based on the empirical formula (seeTab. 2), the permeability ratio of constant-pressure layercan be obtained by the pressure value in Figure 13:
j X½ � ¼ L0
L¼ 14:80
17:22¼ 0:859:
On the other hand, based on the definition of permeabilityratio, the permeability ratio of constant-pressure top zonecan be quickly calculated by the value in Table 10:
j X½ � ¼ k X½ �h½X�k X½ �h X½ � þ k H½ �h½H�
¼ 0:14mD� 24:27m0:14mD� 24:27mþ 0:06mD� 11:83m
¼ 0:846:
Fig. 12. Basis and results of the stratified workflow of X5. (a) Porosity distribution of X5. (b) Permeability distribution of X5.(c) Thickness distribution of X5. (d) Pressure conductivity ratio distribution of X5. (e) Sedimentary facies map of X5. (f) Imaginglogging of X5. (g) Lithology profile of X5. (h) Reservoir stratification result of X5.
W. Shi et al.: Oil & Gas Science and Technology – Rev. IFP Energies nouvelles 76, 2 (2021) 13
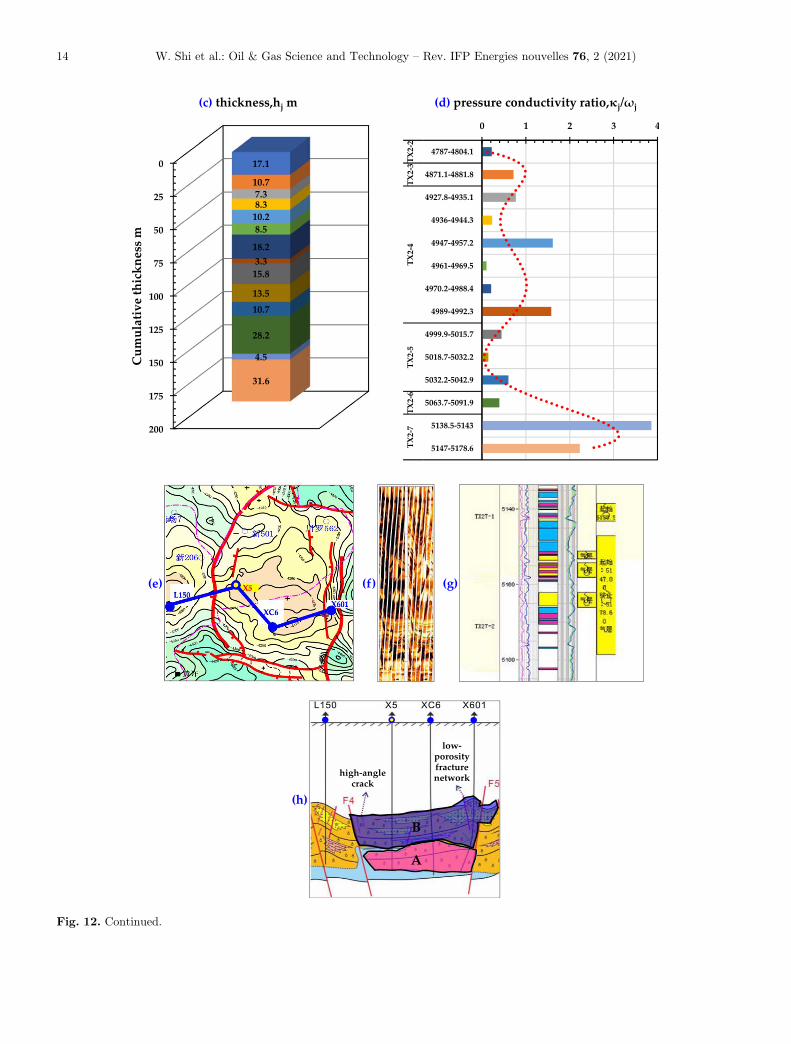
Fig. 12. Continued.
W. Shi et al.: Oil & Gas Science and Technology – Rev. IFP Energies nouvelles 76, 2 (2021)14
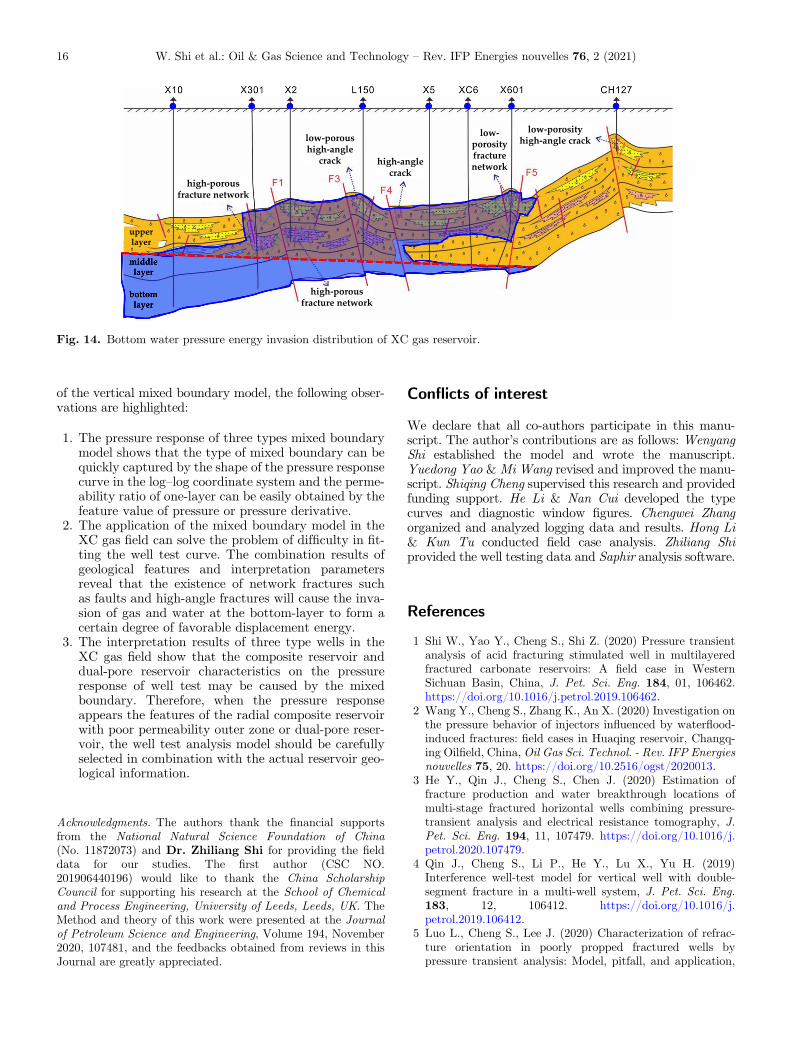
From the results of the case wells above, the pressure energyinduced by bottom water invasion distribution as shown inFigure 14. The zone between the F1 and the F5 has abun-dant high-angle cracks and inclined cracks, the bottomwater invades upward along the faults and then enters eachhorizontal layer through the fractures network composed ofhigh-angle cracks and inclined cracks. The zone where thegas well located is easily affected by bottom-water invasion.Hence, we should be cautious on controlling gas productionto avoid the invasion.
4 Conclusion
This work intends to show a comprehensive analysis of pres-sure response in the vertical commingled well consideringthe influences of the mixed boundary in the vertical direc-tion. Aiming at three types of the mixed boundary, wedetailed analyze them by the shape of pressure responsetype curves and the feature value of pressure and pressurederivative. According to the analysis and application results
Table 9. Basic parameters of X5.
Parameters Value
Reservoir parametersMid-depth, H 5151.78 mThickness, h 36.1 mTemperature, T 138.24 �CInitial pressure, pi 71.01 MPaPorosity, / 4.4%Permeability, k 0.25 mDRock compressibility coefficient, ct 4.35 � 10�4 MPa�1
Gas parameters @T @piGas saturation, Sg 56.57%Compressibility factor, Z 1.3975Isothermal volume coefficient, Bg 2.827 � 10�3
Compressibility coefficient, cg 6.773 � 10�3 MPa�1
Density, qg 0.248 g/cm3
Viscosity, lg 3.168 � 10�5 mPa�sProduction parameters
Well radius, rw 82.55 mmProduction gas rate, qg 8.58 � 104 m3/dProduction time, tp 215.85 hShut-in time, Dt 24.78 h
Fig. 13. Well test data of X5 and fitting curves of model reD[X]& reD[H].
Table 10. Interpretation parameters of X5.
Parameters Value
Skin factor, S 1.15Wellbore storage coefficient, C 0.78 m3/MPaBounded constant-pressure top zone, X
Permeability, k[X] 0.14 mDPorosity, /[X] 3.27%Thickness, h[X] 24.27 mBoundary, re[X] 71.63 m
Bounded closed bottom zone, HPermeability, k[H] 0.06 mDPorosity, /[H] 0.58%Thickness, h[H] 11.83 mBoundary distance, re[H] 126.79 m
W. Shi et al.: Oil & Gas Science and Technology – Rev. IFP Energies nouvelles 76, 2 (2021) 15
of the vertical mixed boundary model, the following obser-vations are highlighted:
1. The pressure response of three types mixed boundarymodel shows that the type of mixed boundary can bequickly captured by the shape of the pressure responsecurve in the log–log coordinate system and the perme-ability ratio of one-layer can be easily obtained by thefeature value of pressure or pressure derivative.
2. The application of the mixed boundary model in theXC gas field can solve the problem of difficulty in fit-ting the well test curve. The combination results ofgeological features and interpretation parametersreveal that the existence of network fractures suchas faults and high-angle fractures will cause the inva-sion of gas and water at the bottom-layer to form acertain degree of favorable displacement energy.
3. The interpretation results of three type wells in theXC gas field show that the composite reservoir anddual-pore reservoir characteristics on the pressureresponse of well test may be caused by the mixedboundary. Therefore, when the pressure responseappears the features of the radial composite reservoirwith poor permeability outer zone or dual-pore reser-voir, the well test analysis model should be carefullyselected in combination with the actual reservoir geo-logical information.
Acknowledgments. The authors thank the financial supportsfrom the National Natural Science Foundation of China(No. 11872073) and Dr. Zhiliang Shi for providing the fielddata for our studies. The first author (CSC NO.201906440196) would like to thank the China ScholarshipCouncil for supporting his research at the School of Chemicaland Process Engineering, University of Leeds, Leeds, UK. TheMethod and theory of this work were presented at the Journalof Petroleum Science and Engineering, Volume 194, November2020, 107481, and the feedbacks obtained from reviews in thisJournal are greatly appreciated.
Conflicts of interest
We declare that all co-authors participate in this manu-script. The author’s contributions are as follows: WenyangShi established the model and wrote the manuscript.Yuedong Yao & Mi Wang revised and improved the manu-script. Shiqing Cheng supervised this research and providedfunding support. He Li & Nan Cui developed the typecurves and diagnostic window figures. Chengwei Zhangorganized and analyzed logging data and results. Hong Li& Kun Tu conducted field case analysis. Zhiliang Shiprovided the well testing data and Saphir analysis software.
References
1 Shi W., Yao Y., Cheng S., Shi Z. (2020) Pressure transientanalysis of acid fracturing stimulated well in multilayeredfractured carbonate reservoirs: A field case in WesternSichuan Basin, China, J. Pet. Sci. Eng. 184, 01, 106462.https://doi.org/10.1016/j.petrol.2019.106462.
2 Wang Y., Cheng S., Zhang K., An X. (2020) Investigation onthe pressure behavior of injectors influenced by waterflood-induced fractures: field cases in Huaqing reservoir, Changq-ing Oilfield, China, Oil Gas Sci. Technol. - Rev. IFP Energiesnouvelles 75, 20. https://doi.org/10.2516/ogst/2020013.
3 He Y., Qin J., Cheng S., Chen J. (2020) Estimation offracture production and water breakthrough locations ofmulti-stage fractured horizontal wells combining pressure-transient analysis and electrical resistance tomography, J.Pet. Sci. Eng. 194, 11, 107479. https://doi.org/10.1016/j.petrol.2020.107479.
4 Qin J., Cheng S., Li P., He Y., Lu X., Yu H. (2019)Interference well-test model for vertical well with double-segment fracture in a multi-well system, J. Pet. Sci. Eng.183, 12, 106412. https://doi.org/10.1016/j.petrol.2019.106412.
5 Luo L., Cheng S., Lee J. (2020) Characterization of refrac-ture orientation in poorly propped fractured wells bypressure transient analysis: Model, pitfall, and application,
Fig. 14. Bottom water pressure energy invasion distribution of XC gas reservoir.
W. Shi et al.: Oil & Gas Science and Technology – Rev. IFP Energies nouvelles 76, 2 (2021)16

J. Nat. Gas Sci. Eng. 79, 07, 103332. https://doi.org/10.1016/j.jngse.2020.103332.
6 Lefkovits H.C., Hazebroek P., Allen E.E., Matthews C.S.(1961) A study of the behavior of bounded reservoirscomposed of stratified layers, SPE J. 1, 01, 43–58. SPE-1329-G. https://doi.org/10.2118/1329-G.
7 Kamal M.M., Abbaszadeh M. (2008) Transient well testing(Monograph Series), Society of Petroleum Engineers, Mono-graph Series Vol. 23. https://store.spe.org/Transient-Well-Testing-P380.aspx.
8 Chao G., Jones J.R., Raghavan R., Lee W.J. (1994)Responses of commingled systems with mixed inner andouter boundary conditions using derivatives, SPE Form.Evalu. 9, 04, 264–271. SPE-22681-PA. https://doi.org/10.2118/22681-PA.
9 Shi W., Cheng S., Meng L., Gao M., Zhang J., Shi Z., WangF., Duan L. (2020) Pressure transient behavior of layeredcommingled reservoir with vertical inhomogeneous closedboundary, J. Pet. Sci. Eng. 189, 06, 106995. https://doi.org/10.1016/j.petrol.2020.106995.
10 Sun B., Shi W., Zhang R., Cheng S., Zhang C., Di S., Cui N.(2020) Transient behavior of vertical commingled well invertical non-uniform boundary radii reservoir, Energies 13,9, 2305. https://doi.org/10.3390/en13092305.
11 Shi W., Yao Y., Cheng S., Shi Z., Wang Y., Zhang J., ZhangC., Gao M. (2020) Pressure transient behavior and flowregimes characteristics of vertical commingled well withvertical combined boundary: A field case in XC gas field ofnorthwest Sichuan Basin, China, J. Pet. Sci. Eng. 194, 11,107481. https://doi.org/10.1016/j.petrol.2020.107481.
12 Yin Z., MacBeth C. (2014) Simulation model updating withmultiple 4D seismic in a fault-compartmentalized NorwegianSea Field, in: Conference Proceedings, 76th EAGE Confer-ence and Exhibition, 11, 6, pp. 1–5. https://doi.org/10.3997/2214-4609.20141146.
13 Yin Z., Ayzenberg M., MacBeth C., Feng T., Chassagne R.(2015) Enhancement of dynamic reservoir interpretation bycorrelating multiple 4D seismic monitors to well behavior,Interpretation 3, 2, 35–52. https://library.seg.org/doi/abs/10.1190/INT-2014-0194.1.
14 Suleen F., Oppert S., Chambers G., Libby L., Carley S.,Alonso D., Olayomi J. (2017) Application of pressuretransient analysis and 4D seismic for integrated waterfloodsurveillance-a deepwater case study, in: Paper Presented atSPE Western Regional Meeting, 23–27 April, Bakersfield,California. SPE-185646-MS. https://doi.org/10.2118/185646-MS.
15 Suleen F., Oppert S., Lari U., Jose A. (2019) Application ofpressure transient analysis and 4D seismic in evaluating andquantifying compaction in a deepwater reservoir, in: PaperPresented at SPE Western Regional Meeting, 23–26 April,San Jose, California, USA. SPE-195290-MS. https://doi.org/10.2118/195290-MS.
16 Yin Z., MacBeth C., Chassagne R., Vazquez O. (2016)Evaluation of inter-well connectivity using well fluctuationsand 4D seismic data, J. Pet. Sci. Eng. 145, 09, 533–547.https://doi.org/10.1016/j.petrol.2016.06.021.
17 Sambo C., Iferobi C.C., Babasafari A.A., Rezaei S., AkanniO.A. (2020) The role of 4D time-lapse seismic technology asreservoir monitoring and surveillance tool: A comprehensivereview, J. Nat. Gas Sci. Eng. 80, 08, 103312. https://doi.org/10.1016/j.jngse.2020.103312.
18 Agarwal R.G. (1979) “Real Gas Pseudo-Time” – a newfunction for pressure buildup analysis of MHF gas wells, in:Paper Presented at SPE Annual Technical Conference andExhibition, 23–26 September, Las Vegas, Nevada. SPE-8279-MS. https://doi.org/10.2118/8279-MS.
19 Al-Hussainy R., Ramey H.J., Crawford P.B. (1966) The flowof real gases through porous media, J. Pet. Technol. 18, 5,624–636. SPE-1243-A-PA. https://doi.org/10.2118/1243-A-PA.
20 Wang Y., Ayala L.F. (2020) Explicit determination ofreserves for variable-bottomhole-pressure conditions in gasrate-transient analysis, SPE J. 25, 1, 369–390. SPE-195691-PA. https://doi.org/10.2118/195691-PA.
21 Bourdet D. (1985) Pressure behavior of layered reservoirswith crossflow, in: Paper Present at SPE California RegionalMeeting, 27–29 March, Bakersfield, California. SPE-13628-MS. https://doi.org/10.2118/13628-MS.
22 Colin MacLaurin A.M. (1748. A treatise of algebra.https://books.google.co.uk/books?id=BIrWrEEi-n5YC&hl=zh-CN&source=gbs_navlinks_s.
23 Van Everdingen A.F., Hurst W. (1949) The application ofthe Laplace transformation to flow problems in reservoirs, J.Pet. Technol. 1, 12, 305–324. SPE-949305-G. https://doi.org/10.2118/949305-G.
24 Stehfest H. (1970) Algorithm 368: Numerical inversion ofLaplace transforms [D5], Commun. ACM 13, 1, 47–49.https://dl.acm.org/doi/10.1145/361953.361969.
25 Bourdet D. (2002) Chapter 2 – the analysis methods, in: Partvolume of Well Ttest analysis: The use of advancedinterpretation models, Handbook of Petroleum Explorationand Production 3, pp. 25–46. https://doi.org/10.1016/S1567-8032(03)80028-9.
W. Shi et al.: Oil & Gas Science and Technology – Rev. IFP Energies nouvelles 76, 2 (2021) 17