Investigation on the Anisotropic Mechanical Behaviour of ... · suggested by ISRM (International...
112
GRS - 360 Investigation on the Anisotropic Mechanical Behaviour of the Callovo- Oxfordian Clay Rock Final Report within the framework of ANDRA/GRS cooperation programme
Transcript of Investigation on the Anisotropic Mechanical Behaviour of ... · suggested by ISRM (International...

GRS - 360
Investigation on theAnisotropic MechanicalBehaviour of the Callovo-Oxfordian Clay Rock
Final Report
within the framework of ANDRA/GRS cooperation programme


Investigation on theAnisotropic MechanicalBehaviour of the Callovo-Oxfordian Clay Rock
within the framework ofANDRA/GRS cooperationprogramme Final Report
Chun-Liang Zhang (GRS)Gilles Armand (ANDRA)Nathalie Conil (ANDRA)
January 2015
Acknowledgement:
This report was prepared under contract No. 059844 with the French Agence Nationale Pour la Gestion de Déchets Radioactifs (ANDRA).
The work was conducted by the Gesellschaft für Anlagen- und Reaktorsicherheit (GRS) gGmbH.
The author is responsible for the content of this report.
GRS - 360 ISBN 978-3-944161-41-9
Gesellschaft für Anlagen- und Reaktorsicherheit (GRS) gGmbH

Keywords
Callovo-Oxfordian Clay Rock, Experiment, Compression, Extension, Failure Strength, Mechanical Anisotropy, Stress-Strain Behaviour

I
Table of contents
1 Introduction .............................................................................................. 1
2 Characterization of samples ................................................................... 3
2.1 Coring and sample preparation .................................................................. 3
2.2 Mineral composition ................................................................................... 6
2.3 Physical properties .................................................................................... 8
3 Laboratory experiments ........................................................................ 13
3.1 Test programme ...................................................................................... 13
3.2 Test methods ........................................................................................... 14
3.3 Test results .............................................................................................. 17
3.3.1 Hydrostatic pre-compaction ..................................................................... 18
3.3.2 Triaxial compression at constant strain rate ............................................. 24
3.3.3 Triaxial compression at constant stress rate ............................................ 28
3.3.4 Triaxial extension by lateral compression at constant axial stress ............ 30
3.3.5 Triaxial extension by lateral compression and axial tension ..................... 30
3.3.6 Triaxial creep under multistep stresses .................................................... 32
3.4 Analysis of the test results ....................................................................... 35
3.4.1 Elastic properties ..................................................................................... 35
3.4.2 Failure strength and mode ....................................................................... 46
4 Conclusions ........................................................................................... 53
List of tables .......................................................................................... 57
List of figures ......................................................................................... 59
Appendix
A Appendix: Drilled cores and sample preparation ................................ 65
B Appendix: Mineral composition of drilled cores ................................. 67
C Appendix: Characteristics of tested samples ...................................... 69
II
D Appendix: Test plan .............................................................................. 73
E Appendix: Test data .............................................................................. 75
E.1 TCD – triaxial compression tests with strain control ................................. 75
E.2 TCS – triaxial compression tests with stress control ................................ 88
E.3 TES – triaxial extension tests at constant axial stress .............................. 93
E.4 TEM – triaxial extension tests at constant mean stress ............................ 98
E.5 TCC – triaxial creep tests at multistep stress states ............................... 103
1
1 Introduction
An underground repository for disposal of radioactive waste is planned to be construct-
ed in the sedimentary Callovo-Oxfordian argillaceous formation (COX) in France /AND
05/. The clay rock exhibits inherent anisotropy with bedding structure, which leads to
directional dependences of the rock properties (e.g. mineralogical, physical, mechani-
cal, hydraulic, thermal, etc.) with respect to the bedding planes. For the design of the
repository and the assessment of its safety during the operation and post-closure
phases it is necessary to characterise and predict the anisotropic properties and pro-
cesses in the host rock, particularly in the excavation damaged zone (EDZ) near the
openings.
Within the framework of the bilateral cooperation agreement between the French Na-
tional Radioactive Waste Management Agency (ANDRA) and the German Federal Min-
istry of Economics and Technology (BMWi), concerning the research activities in the
Meuse/Haute-Marne Underground Research Laboratory (MHM-URL), a joint research
programme was initiated by ANDRA and GRS in 2013 to investigate mechanical an-
isotropy of the COX clay rock for the purpose of precise characterization, better under-
standing and reliable prediction of the development of EDZ around the repository. This
programme was funded by ANDRA under contract number 059844 and performed by
GRS during the time period of November 2013 to December 2014. GRS gratefully
acknowledges the financial support from and the fruitful cooperation with ANDRA.
The research work focused on laboratory investigations on COX core samples extract-
ed from boreholes drilled in different orientations at the -490m main level of the MHM-
URL. Various kinds of experiments were performed under different stress conditions,
including triaxial compression and extension, and time effects. The stress-strain behav-
iour, the elastic properties, the damage and failure strength were determined and ana-
lysed with regard to the structural anisotropy of the clay rock. The anisotropic behav-
iour of the COX clay rock is briefly compared with other clay rocks such as the Opal-
inus clay at Mont Terri and the Tournemire shale based on the data from literature.
Some important results from previous studies by GRS are also involved in the analysis
concerning effects of confining stress and load duration. The experiments and results
are presented in this report.


3
2 Characterization of samples
2.1 Coring and sample preparation
Six coring boreholes were drilled in different directions from a horizontal gallery NER at
the -490m main level of the MHM-URL. The position of the gallery is marked within a
red circle in Fig. 2.1. The boreholes intercepted the quasi-horizontal bedding planes at
approximately five angles of α ≈ 0°, 30°, 45°, 60° and 90° (see Fig. 2.2):
1. OHZ6565 and OHZ6564 parallel to the horizontal bedding with an angle of α ≈ 0°;
2. OHZ6563 inclined to the horizontal bedding with an angle of α ≈ 30°;
3. OHZ6562 inclined to the horizontal bedding with an angle of α ≈ 45°;
4. OHZ6561 inclined to the horizontal bedding with an angle of α ≈ 60°;
5. OHZ6560 perpendicular to the horizontal bedding with an angle of α ≈ 90°.
Fig. 2.1 Position of the coring drift NER at the -490m main level of the MHM-URL

4
Fig. 2.2 Arrangement of the boreholes and sampling positions
5
The boreholes were pneumatically drilled to depths of 6 to 13 meters. Five of them lay
in a vertical plane across the gallery, except for the horizontal borehole OHZ6565. To-
tally, 47 cores of 78.5 mm diameter and 200 – 300 mm lengths were extracted from the
boreholes in the depths of 5 to 10 meters beyond the damaged zone near the drift wall.
The positions of the cores are marked in Fig. 2.2. At least 9 cores were taken for each
direction. The cores were immediately confined in T-cells or in aluminium foils after cor-
ing in order to prevent desaturation and damage. Some photos of the drilled cores are
presented in Appendix A for an unpacked core from the T-cell and another one from
the foil. A few cores were damaged after unpacking and they were not used for testing.
The confined cores were delivered by ANDRA to the GRS laboratory and stored in a
climate-controlled room at 22 °C until testing. From the cores, cylindrical samples were
carefully prepared by cutting and smoothing the surfaces in a lathe (a photo in App. A).
Two sample sizes were defined as diameter/length = 50mm/100mm and 70mm/140mm
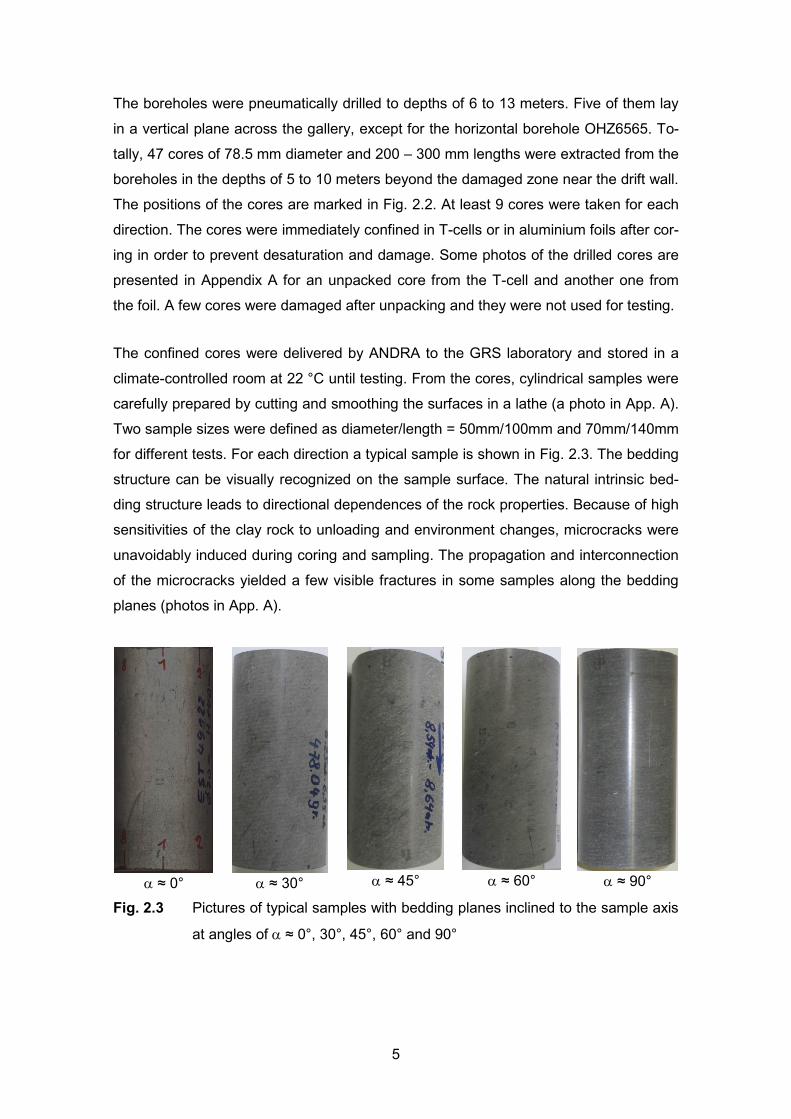
for different tests. For each direction a typical sample is shown in Fig. 2.3. The bedding
structure can be visually recognized on the sample surface. The natural intrinsic bed-
ding structure leads to directional dependences of the rock properties. Because of high
sensitivities of the clay rock to unloading and environment changes, microcracks were
unavoidably induced during coring and sampling. The propagation and interconnection
of the microcracks yielded a few visible fractures in some samples along the bedding
planes (photos in App. A).
α ≈ 0°
α ≈ 30°
α ≈ 45°
α ≈ 60°
α ≈ 90°
Fig. 2.3 Pictures of typical samples with bedding planes inclined to the sample axis
at angles of α ≈ 0°, 30°, 45°, 60° and 90°

6
2.2 Mineral composition
Main mineralogical components of the samples, including clay, carbonate and quartz,
were estimated by ANDRA. The results are summarised in Appendix B and in Fig. 2.4.
The mineralogical components vary from one position to another, indicating the inher-
ent heterogeneous nature of the rock. On average, the investigated rock region con-
tains 35 % clay minerals, 33 % carbonates, 31 % quartz and small amounts of others.
Additionally, there are also some organic components in the rock as observed in some
cores (photos in App. A). The organic components affect negatively the rock mass
strength.
Fig. 2.4 Distributions of the main mineralogical components (clay, carbonate,
quartz etc.) in the sampling region
20
25
30
35
40
45
50
0 2 4 6 8 10
Cla
y co
nten
t
(%)
Borehole depth (m)
OHZ6560-90° OHZ6561-60° OHZ6562-45°
OHZ6563-30° OHZ6564-0° OHZ6565-0°
42.0%
35.0%
27.0%

7
Fig. 2.4 Distributions of the main mineralogical components (clay, carbonate,
quartz etc.) in the sampling region
20
25
30
35
40
45
50
0 2 4 6 8 10
Car
bona
te c
onte
nt
(%
)
Borehole depth (m)
OHZ6560-90° OHZ6561-60° OHZ6562-45°
OHZ6563-30° OHZ6564-0° OHZ6565-0°
38.0%
33.0%
28.0%
20
25
30
35
40
45
50
0 2 4 6 8 10
Qua
rtz
cont
ent
(%
)
Borehole depth (m)
OHZ6560-90° OHZ6561-60° OHZ6562-45°
OHZ6563-30° OHZ6564-0° OHZ6565-0°
36.5%
31.0%
26.5%

8
2.3 Physical properties
The physical properties of the samples were determined according to testing methods
suggested by ISRM (International Society for Rock Mechanics) /ISR 81/, including
grain density, dry density, bulk density, porosity, water content, and degree of water
saturation. The properties are defined as follows.
Grain density: 𝜌𝑠 = 𝑀𝑠𝑉𝑠
(2.1)
Ms = mass of solids, Vs = volume of solids.
Bulk density: 𝜌𝑏 = 𝑀𝑉
= 𝑀𝑠+𝑀𝑤𝑉
(2.2)
M = mass of bulk sample, V = volume of bulk sample,
Ms = mass of solids, Mw = mass of water.
Dry density: 𝜌𝑑 = 𝑀𝑠𝑉
(2.3)
Porosity: 𝜑 = 𝑉𝑣𝑉
= �1 − 𝜌𝑑𝜌𝑠
� (2.4)
Vv = volume of voids.
Water content: 𝑤 = 𝑀𝑤𝑀𝑠
(2.5)
Degree of water saturation:
𝑆𝑤 = 𝑉𝑤𝑉𝑣
= 𝜌𝑑∙𝑤𝜌𝑤∙𝜑
(2.6)
ρw = density of pore water.
Before starting each test, the bulk density of the samples with natural water content
was determined by measuring their volume and weight. The water content was meas-
ured on pieces remaining from sample preparation. They were dried in an oven at a
temperature of 105 °C for 2 days. On basis of the measured bulk density and water
content, the dry density was calculated. The grain density was measured on powder
produced during sample preparation by use of pycnometer with helium gas. The po-
rosity was calculated on basis of the measured grain and dry densities. The basic
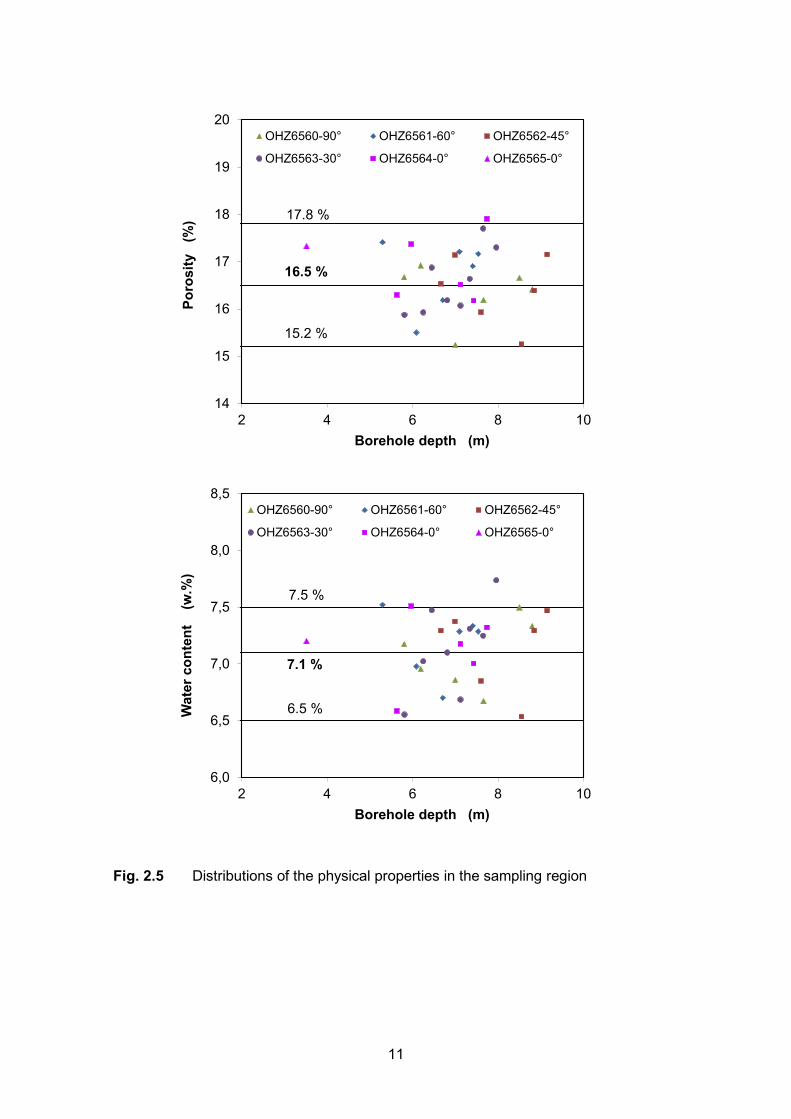
characteristics determined on the samples are summarized in Appendix C and in Fig.
2.5. As a result of the different mineralogical components and the different intensities of
the disturbance by sampling, the physical properties are somewhat varying from one
sample to another, and of course, do not exactly represent the original properties of the
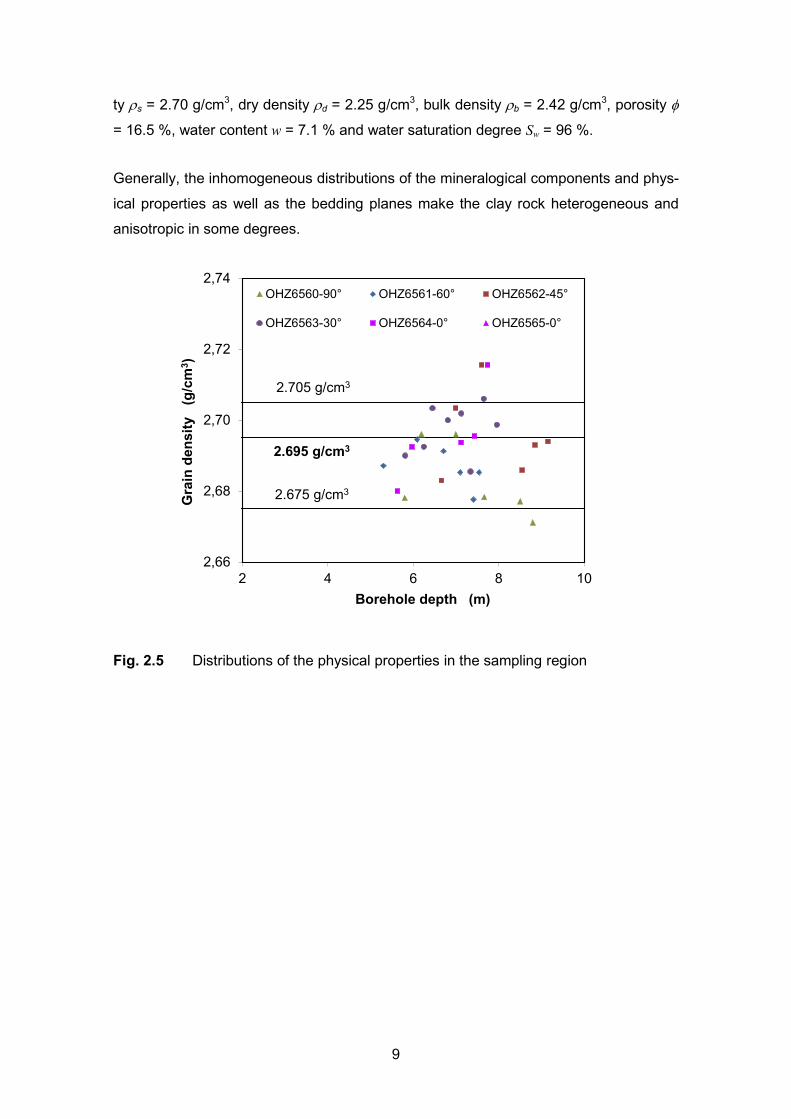
natural rock mass. The average properties determined on the samples are: grain densi-
9
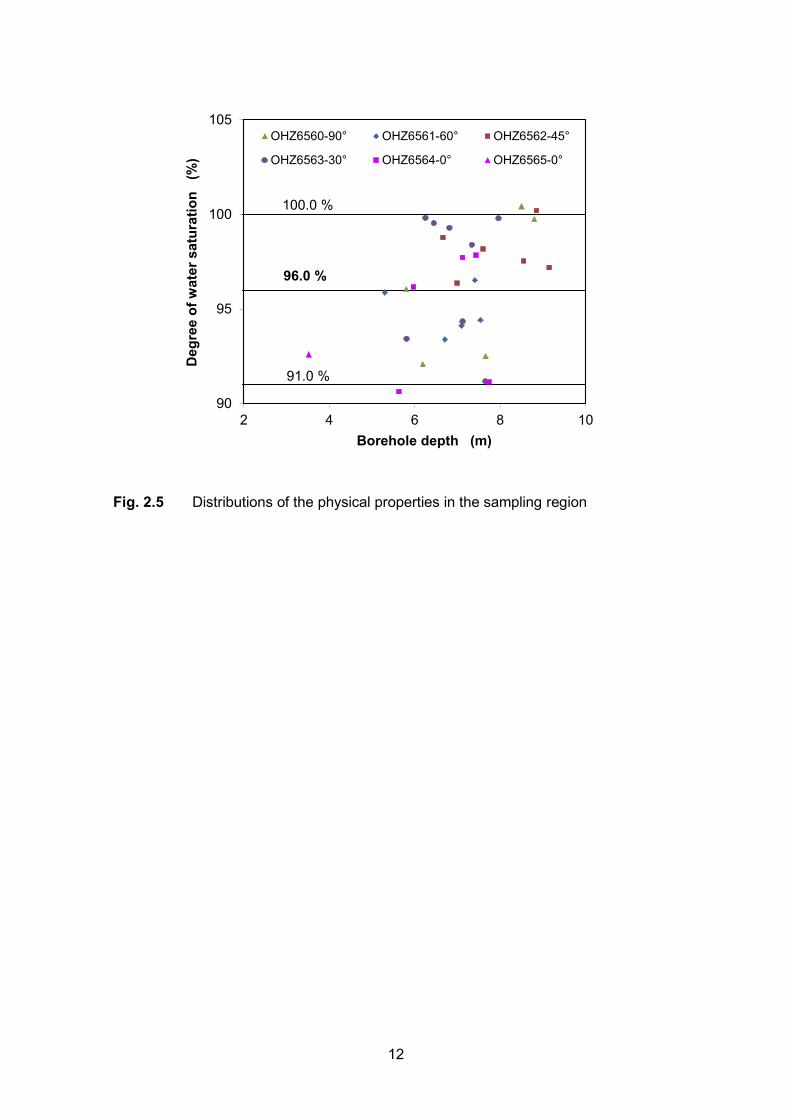
ty ρs = 2.70 g/cm3, dry density ρd = 2.25 g/cm3, bulk density ρb = 2.42 g/cm3, porosity φ
= 16.5 %, water content w = 7.1 % and water saturation degree Sw = 96 %.
Generally, the inhomogeneous distributions of the mineralogical components and phys-
ical properties as well as the bedding planes make the clay rock heterogeneous and
anisotropic in some degrees.
Fig. 2.5 Distributions of the physical properties in the sampling region
2,66
2,68
2,70
2,72
2,74
2 4 6 8 10
Gra
in d
ensi
ty
(g/c
m3 )
Borehole depth (m)
OHZ6560-90° OHZ6561-60° OHZ6562-45°
OHZ6563-30° OHZ6564-0° OHZ6565-0°
2.695 g/cm3
2.705 g/cm3
2.675 g/cm3

10
Fig. 2.5 Distributions of the physical properties in the sampling region
2,20
2,22
2,24
2,26
2,28
2,30
2,32
2 4 6 8 10
Dry
den
sity
(g
/cm
3 )
Borehole depth (m)
OHZ6560-90° OHZ6561-60° OHZ6562-45°
OHZ6563-30° OHZ6564-0° OHZ6565-0°
2.25 g/cm3
2.28 g/cm3
2.22 g/cm3
2,38
2,40
2,42
2,44
2,46
2,48
2 4 6 8 10
Bul
k de
nsity
(g
/cm
3 )
Borehole depth (m)
OHZ6560-90° OHZ6561-60° OHZ6562-45°
OHZ6563-30° OHZ6564-0° OHZ6565-0°
2.42 g/cm3
2.45 g/cm3
2.40 g/cm3
11
Fig. 2.5 Distributions of the physical properties in the sampling region
14
15
16
17
18
19
20
2 4 6 8 10
Poro
sity
(%
)
Borehole depth (m)
OHZ6560-90° OHZ6561-60° OHZ6562-45°
OHZ6563-30° OHZ6564-0° OHZ6565-0°
16.5 %
17.8 %
15.2 %
6,0
6,5
7,0
7,5
8,0
8,5
2 4 6 8 10
Wat
er c
onte
nt
(w.%
)
Borehole depth (m)
OHZ6560-90° OHZ6561-60° OHZ6562-45°
OHZ6563-30° OHZ6564-0° OHZ6565-0°
7.1 %
7.5 %
6.5 %
12
Fig. 2.5 Distributions of the physical properties in the sampling region
90
95
100
105
2 4 6 8 10
Deg
ree
of w
ater
sat
urat
ion
(%
)
Borehole depth (m)
OHZ6560-90° OHZ6561-60° OHZ6562-45°
OHZ6563-30° OHZ6564-0° OHZ6565-0°
96.0 %
100.0 %
91.0 %
13
3 Laboratory experiments
3.1 Test programme
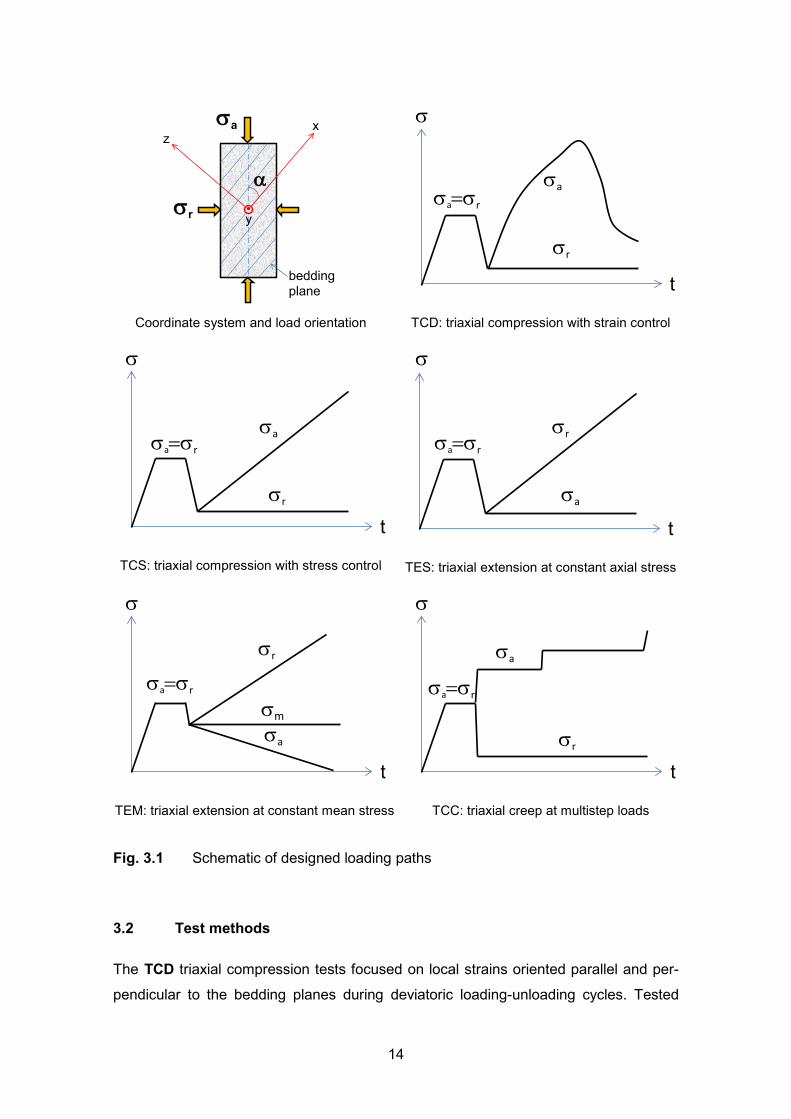
The mechanical anisotropy of the COX clay rock was investigated on the core samples
under different triaxial load conditions. Five essential loading paths were applied, as il-
lustrated in Fig. 3.1:
TCD – triaxial compression by axial deformation εa at constant radial stress sr;
TCS – triaxial compression by axial loading sa at constant radial stress sr;
TES – triaxial extension by increasing radial stress sr at a constant axial stress sa;
TEM – triaxial extension by keeping mean stress sm = (sa+2sr)/3 constant with simul-
taneously increasing radial stress sr and decreasing axial stress sa;
TCC – triaxial creep under multistep constant stress states, sa = const. and sr = const.
A structural coordinate system is defined so that an axis z is normal to bedding planes
and two orthogonal axes x and y are parallel to bedding. Loading orientation is defined
by the angle α between the axial stress and the bedding planes. All the test types men-
tioned above were planned and carried out on the samples in each coring direction: α =
0°, 30°, 45°, 60° and 90°. The detailed test plan is given in Appendix D. Totally, 40
tests were successfully performed: 7 x TCD, 7 x TCS, 10 x TES, 10 x TEM, and 6 x
TCC. A few other tests could not be conducted because the samples had been dam-
aged during preparation.
In order to minimize the effects of microcracks in the disturbed samples and to gather
representative data for the intact clay rock, all samples were pre-compacted by hydro-
static loading up to 16 MPa, corresponding to the in situ maximum horizontal stress
/AND 05/. The subsequent deviatoric loading was applied along each designed path at
an identical confining stress: TCD and TCS at sr = 5 MPa, TES at sa = 5 MPa, TEM at
sm = 13.7 MPa, TCC at sr = 5 MPa and sa ≥ 15 MPa.
14
Coordinate system and load orientation
TCD: triaxial compression with strain control
TCS: triaxial compression with stress control
TES: triaxial extension at constant axial stress
TEM: triaxial extension at constant mean stress
TCC: triaxial creep at multistep loads
Fig. 3.1 Schematic of designed loading paths
3.2 Test methods
The TCD triaxial compression tests focused on local strains oriented parallel and per-
pendicular to the bedding planes during deviatoric loading-unloading cycles. Tested
sa
sr
α
bedding plane
zx
y
s
t
sa=sr
sr
sa
s
t
sa=sr
sr
sa
t
s
sa=sr
sa
sr
s
t
sm
sa=sr
sa
sr
s
t
sa=sr
sr
sa

15
were samples (d/l = 70mm/140mm) with bedding orientations of α = 0°, 30°, 45° and
90° inclined to the axis. At a radial stress of sr = 5 MPa, axial loading-unloading cycles
were carried out within short ranges by axial deformation at rate of sa /101 5−⋅±=ε . The
loading-unloading cycles serves to determine influences of load magnitude and orienta-
tion on the elastic properties of the material. A Karman type triaxial testing apparatus
was used, which allows instrumentation of two strain gauges for the measurement of
the local strains. As shown in Fig. 3.2, both strain gauges were glued on the surface of
each sample at its middle and oriented parallel and perpendicular to bedding planes
respectively, namely ε⫽ and ε⊥. Additionally, a linear variable differential transducer
(LVDT) was installed outside of the cell for axial strain εa over the entire sample with
angle α to the bedding. The stiffness of the testing system was taken into account in
evaluation of the εa - data. Based on the measured data ε⫽, ε⊥ and εa, the radial strain εr
and volumetric strain εv was approximately obtained by
𝜀𝑟 = �∆𝜀𝑟⫽+∆𝜀𝑟⊥�2
= �∆𝜀⫽𝑠𝑠𝑠𝑠+∆𝜀⊥𝑐𝑐𝑠𝑠�2
(3.1)
𝜀𝑣 = 𝜀𝑎 + 2𝜀𝑟 (3.2)
where εr⫽ and εr⊥ are the components of the measured strains ε⫽ and ε⊥ in radial direc-
tion.
Fig. 3.2 Orientations of local strain measurements with respect to bedding planes
The TCS, TES and TEM tests aimed at estimating the strength anisotropy of the clay
rock under triaxial compression and extension. For these tests, another triaxial testing
apparatus was applied, which allows different loading paths such as compression, ex-
tension and torsion. Fig. 3.3 shows the assembly of a sample with instrumentation in
sa
sr ε⊥ ε//εa//
0°
sa
sr ε⊥ε//
εaα
α
sa
sr
90°
ε//εa⊥
ε⊥

16
the triaxial cell. Tested were samples (d/l = 50mm/100mm) with bedding orientations of
α = 0°, 30°, 45°, 60° and 90° inclined to the axis. For the TES and TEM extension
tests, guard rings were installed between the load pistons and the sample end planes
in order to prevent local damage of the rubber jacket due to possible separation be-
tween piston and sample during the axial elongation. Constant stress rates were con-
trolled during each loading path: axial compression loading at sMPaa /007.0=s and at
sr = 5 MPa in TCS tests; radial compression loading at sMPar /007.0=s and at sa = 5
MPa in TES tests; radial compression and axial tension loading at 2/ar ss −= and at
sm = 13.7 MPa in TEM tests. In each test, the axial strain εa was recorded using a
LVDT transducer mounted inside the cell between the upper and lower loading piston,
while radial strain εr was monitored by means of a circumferential extensometer chain
mounted around the sample at its middle. The volumetric strain was calculated accord-
ing to equation (3.2). During the TCS and TES tests, a unloading-reloading cycle was
carried out at a stress difference of ∆s = ׀sa – sr10 = ׀ MPa to determine elastic pa-
rameters.
11BFig. 3.3 Test set up for triaxial compression and extension testing
The TCC triaxial creep tests were designed to examine time effects on deformation and
strength of the clay rock in different load orientations of α = 0°, 30°, 45°, 60° and 90°. A
triaxial creep rig was used, which allows testing two samples of d/l = 70mm/140mm
simultaneously. Fig. 3.4 shows the creep rig with main components and instrumenta-
tions. The samples were placed in two separated triaxial cells and loaded at identical
LVDT deformation transducer
MTS circumferential extensometer
specimen
heater
pore fluid duct
pore fluid duct
cell
upper platen
lower platen
guard ring
after testing

17
axial stress adjusted by a syringe pump connected to the oil in the load piston. The lat-
eral confining stress was applied independently to each sample using two individual sy-
ringe pumps. High axial stresses of sa ≥ 20 MPa were stepwise applied up to failure at
constant radial stress of sr = 5 MPa. In the tests, only axial strain was measured using
individual LVDT deformation transducers.
Fig. 3.4 Coupled rig for triaxial creep testing on two samples one upon another
It is to be pointed out that the test conditions are not hydraulically “undrained” because
the samples were not fully water-saturated, even though they were sealed between
rubber jackets and load pistons. Additionally, pore pressure was not monitored be-
cause of the difficulties of its accurate measurement in such highly consolidated clay-
stones. So the total stress recorded during testing is applied in the following evaluation
and analysis of the tests.
3.3 Test results
Test data obtained from the various tests are given in Appendix D in terms of the phys-
ical properties, stress-strain curves, elastic parameters, and strengths of the samples
under different load conditions:
P
P
P
LVDT transducer
syringe pump A
oil pump
syringepump B
triaxialcell
heaterchamber
sample
load frame
heaters
P syringepump C
load piston
PT 100

18
• App. D.1 for TCD - triaxial compression tests with strain control;
• App. D.2 for TCS - triaxial compression tests with stress control;
• App. D.3 for TES - triaxial extension tests by lateral compression at constant axial
stress;
• App. D.4 for TEM - triaxial extension tests by lateral compression and axial tension
at constant mean stress;
• App. D.5 for TCC - triaxial creep tests at multistep stresses.
Major findings are presented and discussed below.
3.3.1 Hydrostatic pre-compaction
All data of the hydrostatic pre-compaction are given in Tab. D.1 to D.4. They show that
the applied maximum hydrostatic stress of 16 MPa almost completely closed up the
microcracks in the disturbed samples. The total porosities measured decrease from the
initial values of φo = 16.5% - 17.1% to φ = 15.7% - 16.6%. The differences of ∆φ = 0.5%
- 1.0% are attributed to the microcracks. In correspondence to the closure of the mi-
crocracks, the degrees of water saturation in the samples are rising from the initial val-
ues of Swo = 93% - 97% to Sw = 97% - 100%. Obviously, recompaction improves the
quality of the samples significantly making them comparable to the intact claystone.
However, the cohesion of the closed microcracks might not be fully recovered because
they might be more or less desaturated due to the opening and the apertures could not
be exactly rematched again under the applied load.
Moreover, the structural anisotropy of the clay rock can be characterised from the
measured strains in the principal orientations perpendicular and parallel to the bedding
planes. As typical examples, Fig. 3.5 shows the strains in three orientations of perpen-
dicular, parallel and inclined to bedding (ε⊥, ε⫽, εaα) during the hydrostatic loading and
unloading for the axial load angles of α = 0°, 30°, 45°, and 90°.

19
α = 0°
α = 30°
Fig. 3.5 Strains measured in orientations normal, parallel and inclined to bedding
planes (ε⊥, ε⫽, εaα) during hydrostatic loading-unloading cycle
0,0
0,1
0,2
0,3
0,4
0 2 4 6 8 10 12 14 16 18
Stra
in
(%)
Hydrostatic stress s (MPa)
εa⫽
EST49122A-0°
timeeffect
ε⊥
ε⫽
0,0
0,1
0,2
0,3
0,4
0,5
0 2 4 6 8 10 12 14 16 18
Stra
in
(%)
Hydrostatic stress s (MPa)
εa30°
EST48979A-30°
ε⫽
ε⊥

20
α = 45°
α = 90°
Fig. 3.5 Strains measured in orientations normal, parallel and inclined to bedding
planes (ε⊥, ε⫽, εaα) during hydrostatic loading-unloading cycle
-0,1
0,0
0,1
0,2
0,3
0 2 4 6 8 10 12 14 16 18
Stra
in
(%)
Hydrostatic stress s (MPa)
εa45°EST49056A-45°
timeeffect
ε⫽
ε⊥
-0,1
0,0
0,1
0,2
0,3
0 2 4 6 8 10 12 14 16 18
Stra
in
(%)
Hydrostatic stress s (MPa)
εa⊥EST49111A-90°
timeeffect
ε⊥
ε⫽

21
The following main phenomena can be identified from the stress-strain curves:
• Hydrostatic loading leads to non-linear compressive strains in all directions. How-
ever, the strain normal to bedding ε⊥ is significantly larger than parallel to bedding
ε⫽. The normal direction is the major opening direction of the microcracks.
• The global axial strains εa⫽ and εa⊥ recorded on the samples with α = 0° and α =
90°, respectively, are larger than those local values of ε⫽ and ε⊥ measured on the
sample surfaces. This could be attributed to some heterogeneity of the testing ma-
terial on the one hand and to some errors of the testing system on the other hand
such as imperfect contact between sample and piston.
• Taking into account the systematic difference, the strains in the bedding planes
shall be isotropic (unfortunately it could not be measured due to instrumental limi-
tations of the strain gauges used). That means that the mechanical behaviour in
bedding planes is isotropic and the major anisotropic direction is normal to bed-
ding. So the sedimentary clay rock can be considered a transversely isotropic ma-
terial /SAR 07/, /YAN 13/, like the Opalinus clay /NAU 07/, /POP 07/, /BOC 10/ and
the Tournemire shale /NIA 96/, /VAL 04/.
• Time effects can be identified during the compaction under the maximum constant
load. However, due to the very small voids of the remaining microcracks they are
considered to be insignificant.
• Note that the anisotropic deformation behaviour observed during the loading path
is actually of significance for the disturbed samples rather than for the natural in-
tact rock.
• Unloading leads to linear reversible strains in all directions. The stress-strain
curves along the unloading path are represented again in Fig. 3.6 to highlight the
structural anisotropy of the intact clay rock. The linear elastic strain normal to bed-
ding is larger than parallel to bedding, |𝜀⊥| > �𝜀⫽�. Taking into account the system-
atic difference between the local and global strains in axial direction, the elastic
strains in orientations 0° < α < 90° should lie between the values of normal and
parallel to bedding, �𝜀⫽� < |𝜀α| < |𝜀⊥|. The elastic deformability in the major and mi-
nor principal direction can be adopted for characterization of the structural anisot-
ropy of the clay rock,
𝑅𝑐 = ∆𝜀⊥ ∆𝜎⁄∆𝜀⫽ ∆𝜎⁄ = ∆𝜀⊥
∆𝜀⫽ (3.3)

22
The Rc-values are calculated on the basis of the locally recorded strains during unload-
ing. The mean value is obtained to Rc = 2.2±0.48, i.e., the elastic deformability in direc-
tion normal to bedding is about twice that in parallel direction.
Based on the volumetric strain from the unloading path, elastic bulk modulus of the clay
rock can be obtained
𝐾 = ∆𝜎∆𝜀𝑣
(3.4)
The bulk modulus obtained is equal to K = 5.6±1.5 GPa in TCD tests, K = 4.6±0.3 GPa in
TCS, K = 4.6±0.5 GPa in TES, and K = 6.4±0.4 GPa in TEM. The differences are relative-
ly small. On average, K = 5.5±0.6 GPa is determined for the clay rock. As mentioned in
/NIA 97/, the bulk modulus is not a representative material constant for anisotropic me-
dia. It can only be used when the anisotropy of the material is negligible.
α = 0°
Fig. 3.6 Elastic strains measured in orientations normal, parallel and inclined to
bedding planes (ε⊥, ε⫽, εaα) during hydrostatic unloading
-0,10
-0,08
-0,06
-0,04
-0,02
0,00
0 2 4 6 8 10 12 14 16 18
Stra
in
(%)
Hydrostatic stress s (MPa)
εa⫽
EST49122A-0°
ε⊥
ε⫽

23
α = 30°
α = 45°
Fig. 3.6 Elastic strains measured in orientations normal, parallel and inclined to
bedding planes (ε⊥, ε⫽, εaα) during hydrostatic unloading
-0,10
-0,08
-0,06
-0,04
-0,02
0,00
0 2 4 6 8 10 12 14 16 18
Stra
in
(%)
Hydrostatic stress s (MPa)
ε⊥
ε⫽
εa30°
EST48979A-30°
-0,12
-0,09
-0,06
-0,03
0,00
0 2 4 6 8 10 12 14 16 18
Stra
in
(%)
Hydrostatic stress s (MPa)
ε⊥
ε⫽
εa45°
EST49056A-45°

24
α = 90°
Fig. 3.6 Elastic strains measured in orientations normal, parallel and inclined to
bedding planes (ε⊥, ε⫽, εaα) during hydrostatic unloading
3.3.2 Triaxial compression at constant strain rate
The TCD triaxial compression tests were carried out with multiple loading-unloading
cycles at axial strain rate of sa /101 5−⋅±=ε and at a radial stress of sr = 5 MPa. Each
loading-unloading cycle was performed within a short range of ∆sa = 4 MPa. Fig. 3.7 il-
lustrates the typical stress-strain curves in orientations normal, parallel and inclined to
bedding planes (ε⊥, ε⫽, εaα) for the axial load directions of α = 0°, 30°, 45°, and 90° with
respect to the bedding.
All the curves show certain non-linearity of the stress-strain relationships, hysteresis in
the unloading–reloading cycles and irreversibility of the strains after unloading. During
axial loading in direction parallel to bedding (α = 0°), the transversely recorded strains
show extension in both orientations normal and parallel to bedding. The magnitude of
the normal extension ε⊥ is larger than the parallel extension, |𝜀⊥| > �𝜀⫽�. This indicates
that opening of bedding planes dominates. However, the opening of the bedding
planes decreases with increasing the axial load angle to bedding. As α > 45°, the bed-
-0,16
-0,12
-0,08
-0,04
0,00
0 2 4 6 8 10 12 14 16 18
Stra
in
(%)
Hydrostatic stress s (MPa)
εa⊥
EST49111A-90°
ε⊥
ε⫽

25
ding planes turn to close up, i.e., ε⊥ > 0. The maximum closure of the bedding planes is
reached when the major principle load is normal to the bedding (α = 90°).
α = 0°
α = 30°
Fig. 3.7 Stress-strain curves obtained in directions normal, parallel and inclined to
bedding planes (∆s–ε⊥, ∆s–ε⫽, ∆s–εaα) during strain-controlled axial com-
pression oriented at angles of α = 0°, 30°, 45° and 90° to bedding and at
lateral stress of 5 MPa
0
5
10
15
20
25
30
35
-0,6 -0,4 -0,2 0,0 0,2 0,4 0,6 0,8 1,0 1,2
Diff
eren
tial s
tres
s ∆
s(M
Pa)
Strain (%)
εa⫽EST49122A-0°ε⫽ε⊥
sr = 5 MPa
0
5
10
15
20
25
30
35
-0,8 -0,6 -0,4 -0,2 0,0 0,2 0,4 0,6 0,8 1,0 1,2
Diff
eren
tial s
tres
s ∆
s(M
Pa)
Strain (%)
εa30°ε⫽ε⊥
sr = 5 MPa
EST48979A-30°

26
α = 45°
α = 90°
Fig. 3.7 Stress-strain curves obtained in directions normal, parallel and inclined to
bedding planes (∆s–ε⊥, ∆s–ε⫽, ∆s–εaα) during strain-controlled axial com-
pression oriented at angles of α = 0°, 30°, 45° and 90° to bedding and at
lateral stress of 5 MPa
0
5
10
15
20
25
30
35
-0,6 -0,4 -0,2 0,0 0,2 0,4 0,6 0,8 1,0 1,2
Diff
eren
tial s
tres
s ∆
s(M
Pa)
Strain (%)
εa45°ε⫽ε⊥
sr = 5 MPa
EST49056A-45°
0
5
10
15
20
25
30
35
-0,6 -0,4 -0,2 0,0 0,2 0,4 0,6 0,8 1,0 1,2 1,4 1,6
Diff
eren
tial s
tres
s ∆
s(M
Pa)
Strain (%)
ε⫽ε⊥
sr = 5 MPa
εa⊥
EST49111A-90°
27
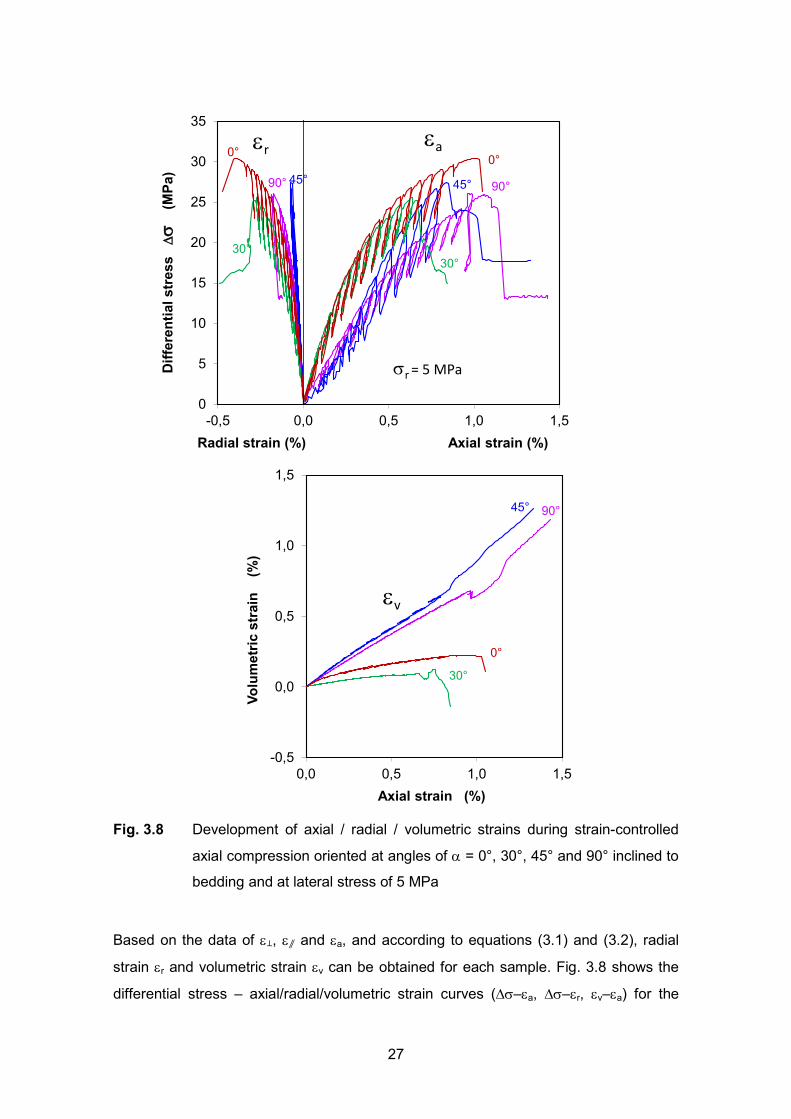
Fig. 3.8 Development of axial / radial / volumetric strains during strain-controlled
axial compression oriented at angles of α = 0°, 30°, 45° and 90° inclined to
bedding and at lateral stress of 5 MPa
Based on the data of ε⊥, ε⫽ and εa, and according to equations (3.1) and (3.2), radial
strain εr and volumetric strain εv can be obtained for each sample. Fig. 3.8 shows the
differential stress – axial/radial/volumetric strain curves (∆s–εa, ∆s–εr, εv–εa) for the
0
5
10
15
20
25
30
35
-0,5 0,0 0,5 1,0 1,5
Diff
eren
tial s
tres
s ∆
s(M
Pa)
Radial strain (%) Axial strain (%)
sr = 5 MPa
0°εa
30°30°
0°
45°45° 90°90°
εr
-0,5
0,0
0,5
1,0
1,5
0,0 0,5 1,0 1,5
Volu
met
ric s
trai
n
(%)
Axial strain (%)
εv
0°
30°
45° 90°
28
load orientations of α = 0°, 30°, 45° and 90°. The non-linearity of the stress-strain enve-
lopes and the deformation anisotropy of the claystone are reflected again. Generally,
the increase in differential stress (∆s = sa – sr) results in axial compression, radial ex-
tension, and volume compaction until the brittle failure at the peak stress. The failure is
accompanied by volume dilatancy in the samples at α = 0° and 30°, while no dilatancy
could be measured on the other samples at α = 45° and 90° before the peak strength.
Commonly, dilatancy or damage takes place due to the generation and accumulation of
microcracks in such clay rocks under high deviatoric stresses close to the peak
strength /NAU 07/, /POP 07/ and /ZHA 10/13/14/. The peak strengths and elastic pa-
rameters determined during the loading-unloading cycles will be presented and ana-
lysed later in section 3.4 together with other results from the TCS, TES, TEM and TCC
tests.
3.3.3 Triaxial compression at constant stress rate
In additional to the strain-controlled triaxial compression tests (TCD) described above,
another series of triaxial compression tests (TCS) was carried out with stress control by
increasing axial load at a rate of sMPaa /007.0=s and at radial stress of sr = 5 MPa.
Fig. 3.9 illustrates the stress-strain curves obtained on the samples in five load orienta-
tions of α = 0°, 30°, 45°, 60° and 90°. It is evident that the stress-strain curves are quite
similar to the stress-strain envelopes of the multiple loading-unloading cycles in the
strain-controlled TCD tests (cf. Fig. 3.8), i.e. non-linear stress-strain relations, irreversi-
bility of the strains after unloading, no dilatancy before peak failure, and influence of the
loading orientation on the strength. The elastic parameters were determined during an
unloading-reloading cycle at ∆s = 10 MPa. The characteristics of the stress-strain be-
haviour, including the elastic parameters, peak strengths and failure strains, will be
presented and discussed later in section 3.4.

29
Fig. 3.9 Stress-strain curves obtained during stress-controlled axial compression
oriented at angles of α = 0°, 30°, 45°, 60° and 90° inclined to bedding and
at lateral stress sr = 5 Mpa
0
5
10
15
20
25
30
-0,5 0,0 0,5 1,0 1,5
Diff
eren
tial s
tres
s ∆
s(M
Pa)
Radial strain (%) Axial strain (%)
sr = 5 MPa
0°εa
30°30°
0°
45°
90°90° εr
45°
60°60°
0,0
0,2
0,4
0,6
0,8
0,0 0,5 1,0 1,5
Volu
met
ric s
trai
n
(%)
Axial strain (%)
εv0°
30°45°
90°
60°

30
3.3.4 Triaxial extension by lateral compression at constant axial stress
The TES – triaxial extension tests were performed by increasing radial stress sr at a
rate of sMPar /007.0=s and under constant axial stress of sa = 5 MPa. The stress dif-
ference is defined here by ∆s = sr – sa. Fig. 3.10 illustrates the typical stress-strain
curves obtained on the samples in five load orientations of α = 0°, 30°, 45°, 60° and
90°. As expected, axial elongation (εa < 0) occurs in the minor principle stress direction
sa during the lateral compression (εr > 0). The strains are related non-linearly to the de-
viatoric stress. The volume is decreasing continuously with increasing the deviatoric
loading until failure. The elastic stiffness was obtained during an unloading-reloading
cycle at ∆s = 10 MPa, which is referred here to C = ∆s / ∆εr (see App. D.3). The peak
strengths and failure strains will be presented and analysed in section 3.4 with regard
to loading directions.
3.3.5 Triaxial extension by lateral compression and axial tension
Another set of triaxial extension tests (TEM) was conducted at a constant mean stress
sm = 13.7 MPa, which was controlled by simultaneously increasing radial stress sr and
decreasing axial stress sa with a load rate ratio of 2/1/ −=ar ss . Typical results are
presented in Fig. 3.11. The samples deformed in radial compression and axial tension
with a ratio of 2/1/ ≈ar εε , almost in coincidence with the load ratio. The resultant vol-
umetric compression is relatively small. Most samples showed no dilatancy before the
peak failure, except for the sample at the load angle of α = 60°. Generally, the peak
strengths reached during the TEM loading at constant mean stress are lower than
those obtained during the TES loading at constant axial stress. Detailed discussions
will be given later in section 3.4.

31
Fig. 3.10 Stress-strain curves obtained during lateral compression at constant axial
stress sa = 5 MPa for the axial load angles of α = 0°, 30°, 45°, 60° and 90°
inclined to bedding
0
5
10
15
20
25
30
-0,8 -0,4 0,0 0,4 0,8
Diff
eren
tial s
tres
s ∆
s(M
Pa)
Axial strain (%) Radial strain (%)
sa = 5 MPa
0°εa
30°30°0°
45°
90°90°
εr45°
60°60°
0,0
0,2
0,4
0,6
0,8
0,0 0,2 0,4 0,6 0,8
Volu
met
ric s
trai
n
(%)
Radial strain (%)
εv
0°30° 45°
90°60°

32
Fig. 3.11 Stress-strain curves obtained during lateral compression and axial exten-
sion at constant mean stress sm = 13.7 MPa for the axial load angles of α
= 0°, 30°, 45°, 60° and 90° inclined to bedding
3.3.6 Triaxial creep under multistep stresses
Time-dependent deformation and strength of the clay rock was investigated with triaxial
creep tests (TCC) on the samples under multistep stresses for five load orientations of
0
5
10
15
20
-0,6 -0,4 -0,2 0,0 0,2 0,4
Diff
eren
tial s
tres
s ∆
s(M
Pa)
Axial strain (%) Radial strain (%)
sm = 13.7 MPa
0°εa30°30°0°
45°
90°90° εr45°
60°60°
-0,2
-0,1
0,0
0,1
0,2
0,0 0,1 0,2 0,3
Volu
met
ric s
trai
n
(%)
Radial strain (%)
εv0°
30°
45°
90°
60°

33
α = 0°, 30°, 45°, 60° and 90°. The samples were firstly reconsolidated under a hydro-
static load of 16 MPa for 2 to 4 weeks. Following that, the stresses were adjusted to sr
= 5 MPa and sa = 20 MPa within 30 minutes, and then sa = 22 MPa. The data obtained
during the whole test procedure are summarized in App. E.5. Fig. 3.12 shows the
measured evolution of axial strain and strain rate of the samples in three groups under
the deviatoric loads. The radial and volumetric strains were not measured during the
tests. The rapid loading resulted in a sudden increase in axial strain, which continued
with time at sr = 5 MPa and sa = 20 MPa. Over 3 weeks, creep rupture took place at
sample EST49020 subjected to the axial load parallel to the bedding planes. Unfortu-
nately, this led also to the termination of the other test EST48983 in α = 30° in the
same group 1. In the other two groups, the second load phase was conducted at in-
creased axial stress of sa = 22 MPa and at sr = 5 MPa. The resulting axial strains in-
creased with time over more than a month and then accelerated rapidly to failure for all
samples. The creep rates and failure stresses seem to be less dependent on the load
orientations. Comparing with the short-term tests, the creep failure stresses are signifi-
cantly lower.
Group 1 with two samples at axial load angle of α = 0° and 30°
Fig. 3.12 Evolution of axial strain and strain rate during the triaxial creep tests under
multistep stresses of sr = 5 MPa and sa = 20 / 22 MPa and at axial load
angles of α = 0°, 30°, 45°, 60° and 90° inclined to bedding
1E-6
1E-5
1E-4
1E-3
1E-2
1E-1
1E+0
0,0
0,2
0,4
0,6
0,8
0 5 10 15 20 25
Cre
ep ra
te
(1/d
)
Axia
l str
ain
(%
)
Time (day)
EST49020-0° EST48983-30°
rupture∆s = 15 MPa sr = 5 MPa
axial strain
creep rate
T = 24.5 °C
axial strain

34
Group 2 with two samples at axial load angle of α = 30° and 45°
Group 3 with two samples at axial load angle of α = 60° and 90°
Fig. 3.12 Evolution of axial strain and strain rate during the triaxial creep tests under
multistep stresses of sr = 5 MPa and sa = 20 / 22 MPa and at axial load
angles of α = 0°, 30°, 45°, 60° and 90° inclined to bedding
1E-6
1E-5
1E-4
1E-3
1E-2
1E-1
1E+0
0,0
0,2
0,4
0,6
0,8
0 5 10 15 20 25 30 35 40 45 50
Cre
ep ra
te
(1/d
)
Axia
l str
ain
(%
)
Time (day)
EST48979-30° EST49061-45°
∆s = 15 MPa axial strain
creep rate
∆s = 17 MPa rupture
T = 24.5 °C sr = 5 MPa
1E-6
1E-5
1E-4
1E-3
1E-2
1E-1
1E+0
0,0
0,2
0,4
0,6
0 5 10 15 20 25 30 35 40 45
Cre
ep ra
te
(1/d
)
Axia
l str
ain
(%
)
Time (day)
EST49106-90° EST49082-60°
rupture
∆s = 15 MPa
sr = 5 MPa
axial strain
creep rate
∆s = 17 MPa T = 24.5 °C
35
3.4 Analysis of the test results
Based on the test results, the anisotropy of the mechanical behaviour of the COX clay
rock will be analysed and discussed in terms of elastic deformability and failure
strength as function of deviatoric stress, loading path and orientation with respect to the
bedding planes.
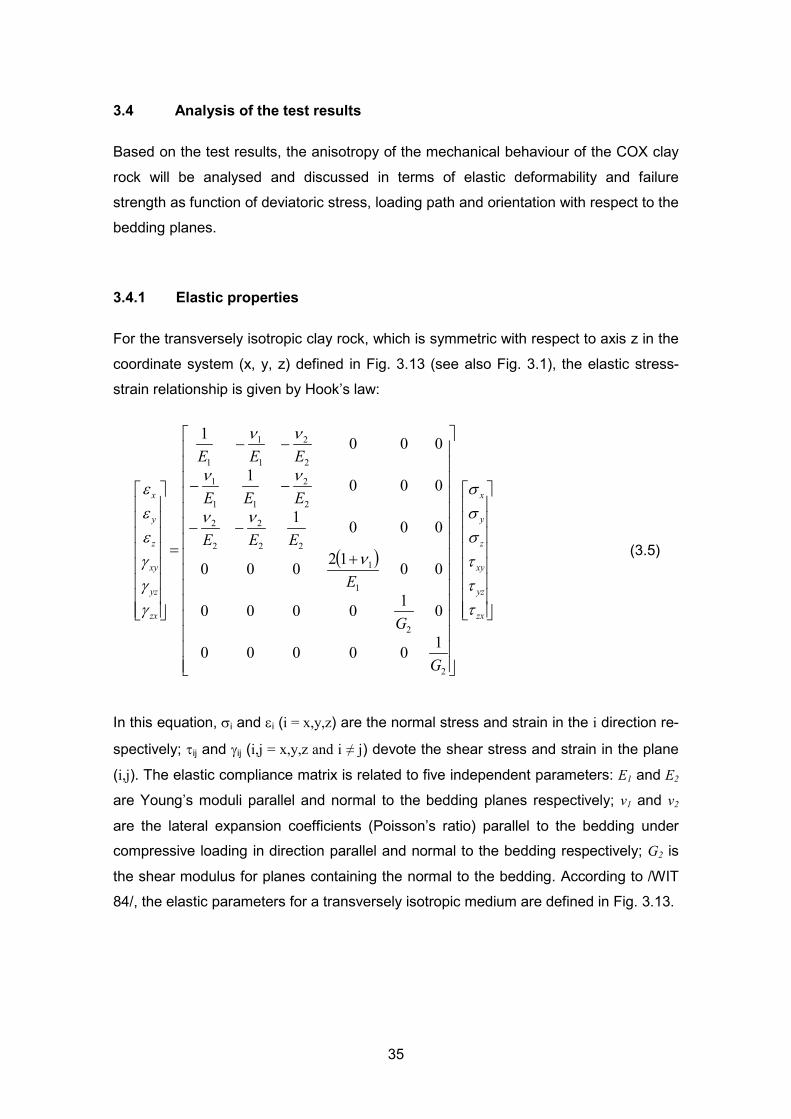
3.4.1 Elastic properties
For the transversely isotropic clay rock, which is symmetric with respect to axis z in the
coordinate system (x, y, z) defined in Fig. 3.13 (see also Fig. 3.1), the elastic stress-
strain relationship is given by Hook’s law:
( )
+
−−
−−
−−
=
zx
yz
xy
z
y
x
zx
yz
xy
z
y
x
G
G
E
EEE
EEE
EEE
τττsss
ν
νν
νν
νν
γγγεεε
2
2
1
1
22
2
2
2
2
2
11
1
2
2
1
1
1
100000
010000
0012000
0001
0001
0001
(3.5)
In this equation, si and εi (i = x,y,z) are the normal stress and strain in the i direction re-
spectively; τij and γij (i,j = x,y,z and i ≠ j) devote the shear stress and strain in the plane
(i,j). The elastic compliance matrix is related to five independent parameters: E1 and E2
are Young’s moduli parallel and normal to the bedding planes respectively; v1 and v2
are the lateral expansion coefficients (Poisson’s ratio) parallel to the bedding under
compressive loading in direction parallel and normal to the bedding respectively; G2 is
the shear modulus for planes containing the normal to the bedding. According to /WIT
84/, the elastic parameters for a transversely isotropic medium are defined in Fig. 3.13.

36
Fig. 3.13 Definition of the elastic parameters for a transversely isotropic rock with
bedding planes (after /WIT 84/)
yz
x

37
Elastic properties of a rock are generally dependent upon applied load. In order to in-
vestigate the variations of the elastic parameters of the clay rock with stress, multiple
loading-unloading cycles were conducted in the TCD – triaxial compression tests (sec-
tion 3.3.2). From the stress-strain curves obtained along the loading and unloading
path, one can determine the elastic Young’s modulus E and Poisson’s ratio ν by
𝐸 = ∆𝜎𝑎∆𝜀𝑎
(3.6)
𝑣 = − ∆𝜀𝑟∆𝜀𝑎
(3.7)
According to the approach applied in /NIA 97/, the Young’s moduli E1 and E2 are deter-
mined from the tests performed in α = 0° and α = 90° respectively. Similarly, Poisson’s
ratio ν1 is determined from the tests in α = 0° (ν1 = -∆εr⫽/∆εa⫽), while ν2 can be obtained
from the tests in α = 0° (ν2 = -∆εr⊥/∆εa⫽) and/or from the tests in α = 90° (ν2 = -∆εr⫽/∆εa⊥).
Finally, the shear modulus G2 can be derived from any tests performed in an out-of-axis
orientation:
1𝐸𝛼
= 𝑠𝑠𝑠4𝑠𝐸2
+ � 1𝐺2
− 2 𝑣2𝐸2
� ∙ 𝑠𝑠𝑠2𝛼 ∙ 𝑐𝑐𝑠2𝛼 + 𝑐𝑐𝑠4𝑠𝐸2
(3.8)
where Eα is the axial Young’s modulus determined from a test performed in the α direc-
tion (0° < α < 90°), and thus G2 is deduced from this equation. There are also some
simple formulas available for approximately estimating G2 /WIT 84/, for instance, the
Saint-Venant’s formula used in /NIA 97/:
1𝐺2
= 1𝐸1
+ 1𝐸2
+ 2 𝑣2𝐸2
(3.9)
The measured elastic parameters are plotted in Fig. 3.14 for Young’s moduli E1 and E2
and in Fig. 3.15 for Poisson’s ratios ν1 and ν2 as a function of applied deviatoric stress.
It is obvious that the parameters are not constant but vary with the stress.
Both Young’s modulus E1 parallel and E2 normal to bedding are increasing with devia-
toric stress in the beginning before ∆s < 10-12 MPa, due to the hardening effect with
volume compaction. With further increase in the stress until the peak sF, the Young’s
moduli do not change much. The values determined from unloading path are slightly
higher than those from loading path. Additionally, the data also vary from a sample to
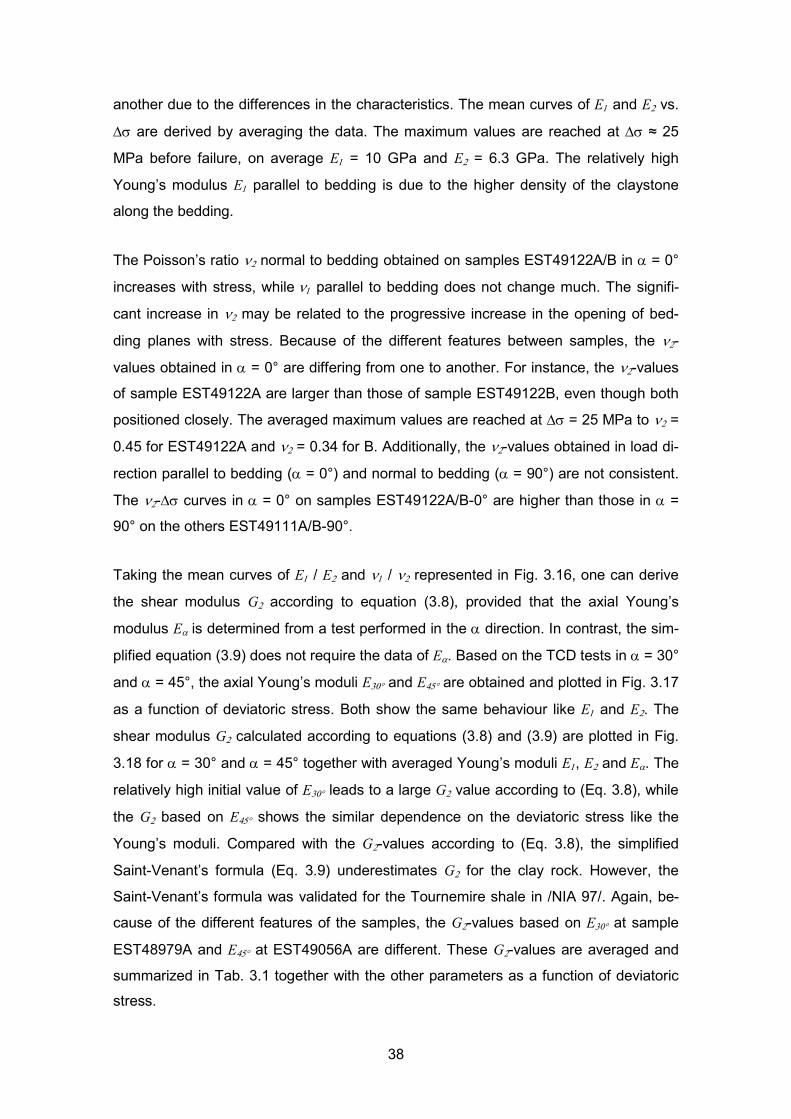
38
another due to the differences in the characteristics. The mean curves of E1 and E2 vs.
∆s are derived by averaging the data. The maximum values are reached at ∆s ≈ 25
MPa before failure, on average E1 = 10 GPa and E2 = 6.3 GPa. The relatively high
Young’s modulus E1 parallel to bedding is due to the higher density of the claystone
along the bedding.
The Poisson’s ratio ν2 normal to bedding obtained on samples EST49122A/B in α = 0°
increases with stress, while ν1 parallel to bedding does not change much. The signifi-
cant increase in ν2 may be related to the progressive increase in the opening of bed-
ding planes with stress. Because of the different features between samples, the ν2-
values obtained in α = 0° are differing from one to another. For instance, the ν2-values
of sample EST49122A are larger than those of sample EST49122B, even though both
positioned closely. The averaged maximum values are reached at ∆s = 25 MPa to ν2 =
0.45 for EST49122A and ν2 = 0.34 for B. Additionally, the ν2-values obtained in load di-
rection parallel to bedding (α = 0°) and normal to bedding (α = 90°) are not consistent.
The ν2-∆s curves in α = 0° on samples EST49122A/B-0° are higher than those in α =
90° on the others EST49111A/B-90°.
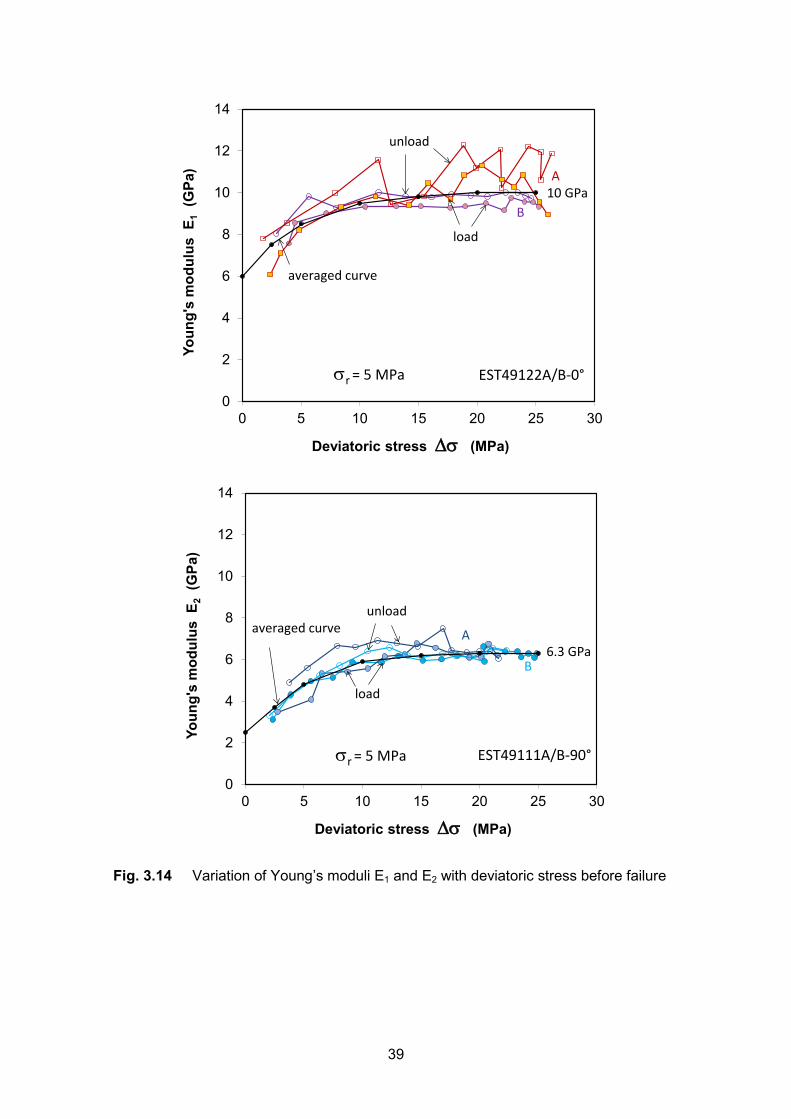
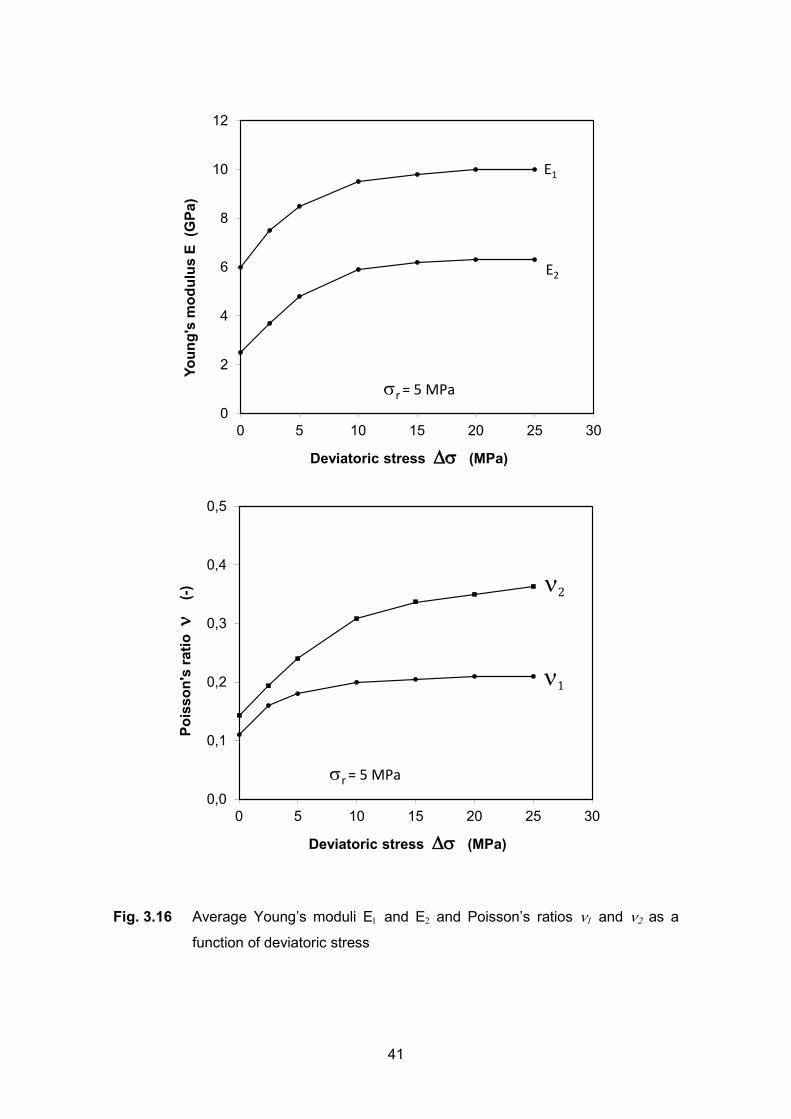
Taking the mean curves of E1 / E2 and ν1 / ν2 represented in Fig. 3.16, one can derive
the shear modulus G2 according to equation (3.8), provided that the axial Young’s
modulus Eα is determined from a test performed in the α direction. In contrast, the sim-
plified equation (3.9) does not require the data of Eα. Based on the TCD tests in α = 30°
and α = 45°, the axial Young’s moduli E30° and E45° are obtained and plotted in Fig. 3.17
as a function of deviatoric stress. Both show the same behaviour like E1 and E2. The
shear modulus G2 calculated according to equations (3.8) and (3.9) are plotted in Fig.
3.18 for α = 30° and α = 45° together with averaged Young’s moduli E1, E2 and Eα. The
relatively high initial value of E30° leads to a large G2 value according to (Eq. 3.8), while
the G2 based on E45° shows the similar dependence on the deviatoric stress like the
Young’s moduli. Compared with the G2-values according to (Eq. 3.8), the simplified
Saint-Venant’s formula (Eq. 3.9) underestimates G2 for the clay rock. However, the
Saint-Venant’s formula was validated for the Tournemire shale in /NIA 97/. Again, be-
cause of the different features of the samples, the G2-values based on E30° at sample
EST48979A and E45° at EST49056A are different. These G2-values are averaged and
summarized in Tab. 3.1 together with the other parameters as a function of deviatoric
stress.
39
Fig. 3.14 Variation of Young’s moduli E1 and E2 with deviatoric stress before failure
0
2
4
6
8
10
12
14
0 5 10 15 20 25 30
Youn
g's
mod
ulus
E1
(GPa
)
Deviatoric stress ∆s (MPa)
load
sr = 5 MPa
A
EST49122A/B-0°
B
unload
10 GPa
averaged curve
0
2
4
6
8
10
12
14
0 5 10 15 20 25 30
Youn
g's
mod
ulus
E2
(GPa
)
Deviatoric stress ∆s (MPa)
sr = 5 MPa
A
B
load
EST49111A/B-90°
unload
6.3 GPa
averaged curve

40
Fig. 3.15 Variation of Poisson’s ratios ν1 and ν2 with deviatoric stress before failure
0,0
0,1
0,2
0,3
0,4
0,5
0 5 10 15 20 25 30
Pois
son'
s ra
tio ν
1,ν 2
(-)
Deviatoric stress ∆s (MPa)
load
sr = 5 MPa
unload
EST49122A/B-0°
load
unload
A
B
A
ν2
ν10.21
0.34
ν20.45
averaged curve
0,0
0,1
0,2
0,3
0,4
0,5
0 5 10 15 20 25 30
Pois
son'
s ra
tio ν
2(-)
Deviatoric stress ∆s (MPa)
load
sr = 5 MPa
unload
EST49111A/B-90°
ν20.30
averaged curve
41
Fig. 3.16 Average Young’s moduli E1 and E2 and Poisson’s ratios ν1 and ν2 as a
function of deviatoric stress
0
2
4
6
8
10
12
0 5 10 15 20 25 30
Youn
g's
mod
ulus
E (
GPa
)
Deviatoric stress ∆s (MPa)
E1
sr = 5 MPa
E2
0,0
0,1
0,2
0,3
0,4
0,5
0 5 10 15 20 25 30
Pois
son'
s ra
tio ν
(-)
Deviatoric stress ∆s (MPa)
sr = 5 MPa
ν1
ν2
42
Fig. 3.17 Variation of Young’s modulus Eα with deviatoric loading in α = 30° and 45°
0
2
4
6
8
10
12
0 5 10 15 20 25 30
Youn
g's
mod
ulus
E30
°(G
Pa)
Deviatoric stress ∆s (MPa)
load
sr = 5 MPa
E30° 9.0 GPa
unload averaged curve
EST48979A-30°
0
2
4
6
8
10
12
0 5 10 15 20 25 30
Youn
g's
mod
ulus
E45
°(G
Pa)
Deviatoric stress ∆s (MPa)
sr = 5 MPa
load
unload
8.3 GPa
averaged curve
E45°
EST49056A-45°

43
Fig. 3.18 Shear modulus G2 based on the axial Young’s modulus E30° and E45°
0
2
4
6
8
10
12
0 5 10 15 20 25 30
Youn
g's
/she
ar m
odul
us E
/ G
(G
Pa)
Deviatoric stress ∆s (MPa)
E1
sr = 5 MPa
E30°
E2
G2
G2
Eq.(3.8)
Eq.(3.9)
0
2
4
6
8
10
12
0 5 10 15 20 25 30
Youn
g's
/she
ar m
odul
us E
/ G
(G
Pa)
Deviatoric stress ∆s (MPa)
E1
sr = 5 MPa
E45°
E2G2
G2
Eq.(3.8)
Eq.(3.9)

44
The degree of the elastic anisotropy may be characterised by the following two param-
eters
𝑅𝐸 = 𝐸1𝐸2
(3.10)
𝑅𝑣 = 𝑣2𝑣1
(3.11)
Based on the averaged values of E1 / E2 and ν2 / ν1 depicted in Fig. 3.16, the parame-
ters of the elastic anisotropy are determined and illustrated in Fig. 3.19 as a function of
deviatoric stress. Both parameters show different variations with the stress. Whereas
RE decreases due to the relatively fast increase in Young’s modulus E2 normal to bed-
ding, in contrast Rv increases due to the relatively fast increase in Poisson’s ratio ν2
normal to bedding. Both parameters tend towards constant values close to each other,
RE = 1.6 and Rv = 1.7 for the range of ∆s = 10 to 25 MPa. It indicates that the elastic an-
isotropy of the claystone tends to be stabilized in the relatively high stress region above
10 MPa.
Fig. 3.19 Variation of the elastic anisotropy parameters as a function of deviatoric
stress
1,0
1,5
2,0
2,5
0 5 10 15 20 25 30
Elas
tic a
niso
trop
ic d
egre
e (-
)
Deviatoric stress ∆s (MPa)
sr = 5 MPa
Rν
RE

45
The average values of the five independent elastic parameters obtained according to
(Eq. 3.8) and the elastic anisotropic degrees are summarized in Tab. 3.1 for the COX
clay rock at different deviatoric stresses. The relatively constant values of the parame-
ters in the range of ∆s = 10 to 25 MPa are representative for the intact rock mass. The
data can be used for comparison of the elastic anisotropy of the COX clay rock with
others such as the Opalinus clay and Tournemire shale. Based on the data from litera-
ture, the elastic parameters of the Opalinus clay rock at Mont Terri /BOC 10/ and the
Tournemire shale /NIA 97/ are represented in Tab. 3.1. The parameters of the Opalinus
clay were given as constant while they were determined for the Tournemire shale at
different stress conditions. For the comparison purpose, the parameters of the Tour-
nemire shale are taken for the radial confining stress of 5 MPa. From Tab. 3.1 one can
identify that the elastic stiffness of the COX clay rock is higher than that of the Opalinus
clay but lower than the Tournemire shale. The elastic anisotropy of the COX clay rock
is less significant compared withthe other two clay rocks.
Tab. 3.1 Average values of the five independent elastic parameters and the aniso-
tropic parameters of the COX clay rock at different deviatoric stresses
∆s (MPa) E1 (GPa) E2 (GPa) G2 (GPa) ν1 ν2 RE=E1/E2 Rν=ν2/ν1
0 6.0 2.5 3.73 0.11 0.14 2.4 1.3 2.5 7.5 3.7 4.23 0.16 0.19 2.0 1.2 5 8.5 4.8 4.44 0.18 0.24 1.8 1.3 10 9.5 5.9 4.82 0.20 0.31 1.6 1.5 15 9.8 6.2 4.93 0.21 0.34 1.6 1.6 20 10.0 6.3 4.95 0.21 0.35 1.6 1.7 25 10.0 6.3 4.95 0.21 0.36 1.6 1.7
Elastic parameters of the Opalinus clay at Mont-Terri /BOC 10/
assumed E1 (GPa) E2 (GPa) G2 (GPa) ν1 ν2 RE=E1/E2 Rν=ν2/ν1
constant 10.0 4.0 3.5 0.25 0.35 2.5 1.4
Elastic parameters of the Tournemire shale at confining stress = 5 MPa /NIA 97/
assumed E1 (GPa) E2 (GPa) G2 (GPa) ν1 ν2 RE=E1/E2 Rν=ν2/ν1
constant 30.0 10.0 5.0 0.15 0.30 3.0 2.0

46
3.4.2 Failure strength and mode
Like most of transversely isotropic rocks, the failure strength and mode of the COX clay
rock are closely related to the bedding structure, the orientation of the major principal
stress, and the loading type such as triaxial compression and extension. Fig. 3.20
summarizes the peak strengths (sF = ׀sa - sr׀) and the axial failure strains (εa-f) reached
during the TCD and TCS triaxial compression and the TES and TEM triaxial extension
as a function of the orientation of the major principal stress s1 inclined to the bedding
planes. The orientation of the major principal stress is defined here as the angle θ of s1
to bedding: s1 = sa and θ = α for the TCD and TCS tests; s1 = sr and θ = (90° - α) for
the TES and TEM tests. The following points can be generally concluded:
• In a given orientation of θ, the peak strengths developed during TCD and TCS
compression are higher than those reached during TES and TEM extension; in
more detail, the TCD strain-controlled compressive strength is higher than the TCS
stress-controlled strength, while the TEM extensive strength reached by simulta-
neously lateral compression and axial extension is lower than the TES extensive
strength by lateral compression at constant axial stress.
• For each loading type (TCD, TCS, TES, TEM), the maximum strength values are
reached at θ = 0° and θ = 90°, and both are comparable; the minimum strength oc-
curs at θ ≈ 45° by TCD and TCS compression and at θ ≈ 30° by TES and TEM ex-
tension respectively.
• The axial failure strains show a similar behaviour as the strength. The compressive
failure strains occurred during TCD and TCS loading are comparable and higher
than the tensile failure strains reached during TES and TEM loading. The maxi-
mum TCD and TCS compressive failure strains are reached at θ = 90° and θ = 0°
and the minimum occurs at θ = 30-45°, while the TES and TEM extension failure
strains are relatively constant for the different load orientations.

47
Fig. 3.20 Peak failure strength and axial failure strain developed along different load-
ing paths as function of the orientation of the major principal stress with re-
spect to bedding planes
10
15
20
25
30
35
0 10 20 30 40 50 60 70 80 90
Peak
str
engt
h s
F(M
Pa)
Orientation to the bedding plane θ (°)
TCD - data TCS - dataModel for TCD Model for TCSTES - data TEM - dataModel for TES Model for TEM
-1,0
-0,5
0,0
0,5
1,0
1,5
0 10 20 30 40 50 60 70 80 90
Axia
l fai
lure
str
ain
εa
(%)
Orientation to the bedding plane θ (°)
TCD - data TCS - data TES - data TEM - data
compression
extension

48
After testing, failure modes of the failed samples were visually inspected. Fig. 3.21
shows pictures of some failed samples during TCD triaxial compression, TES and TEM
triaxial extension. The failure modes observed after the TCD triaxial compression are
quite similarly to those observed on the Tournemire shale in /NIA 97/ and the other
rocks with a strong planar anisotropy /GAT 02/, /VAL 04/, /NAU 07/, /POP 07/, /GHO
14/. For α = 0°, the failure is dominated by extension of the bedding planes and thus
the fractures are mainly oriented parallel and subparallel to the bedding planes, i.e. the
fracture angle β is close to the bedding angle α (β ≈ α). For 30° < α < 45°, the failure is
mainly controlled by sliding along the bedding planes and thus the fracture orientation
is also close to the bedding angle (β ≈ α). For 60° < α < 90°, the failure is caused by
shearing the claystone matrix and the fractures are crossing the bedding planes in an-
gle of α - β ≈ 30°. In the TES and TEM triaxial extension tests, most of the induced
fractures are relatively parallel or subparallel to the major principal stress in radial di-
rection. For α = 0° the main fractures are normally crossing the bedding planes; for 30°
< α < 60° some fractures are also developing along the bedding planes; and for α = 90°
tensile splitting takes place between the bedding planes. Obviously, failure of the clay
rock occurs not only along the bedding planes but also in the matrix, which depends on
the orientation of the major principal stress to the bedding planes.
Jaeger (1960) introduced an instructive analysis of anisotropic rock containing a set of
parallel weakness planes and proposed a criterion for failure along the weakness
planes based on the Coulomb’s criterion /JAE 60/, /BRA 06/. Considering the failure
modes observed in most of the anisotropic rocks, the Jaeger criterion was improved by
McLamore and Gray /MCL 67/ by introducing continuously variable cohesion and fric-
tion angle. Yuan et al /YUA 13/ successfully applied this improved model with variable
cohesion but constant friction angle for the analysis of borehole stability in a shale:
𝜎𝐹 = (𝜎1 − 𝜎3)𝐹 = 2(𝑐𝑜+𝜎3𝑡𝑎𝑠𝜑)�𝑡𝑎𝑠2𝜑+1−𝑡𝑎𝑠𝜑
(3.12a)
𝑐𝑐 = 𝐴 − 𝐵[𝑐𝑐𝑠2(𝜃 − 𝜃𝑐𝑐)]𝑠, 0° < 𝜃 < 𝜃𝑐𝑐 (3.12b)
𝑐𝑐 = 𝐶 − 𝐷[𝑐𝑐𝑠2(𝜃 − 𝜃𝑐𝑐)]𝑚, 𝜃𝑐𝑐 < 𝜃 < 90° (3.12c)
where s1 and s3 are the major and minor principal stress respectively, ϕ is the inner
friction angle, co is the inherent cohesion depending on the angle θ of the major princi-
pal stress s1 direction to the bedding planes, and θco is the value of θ at which co takes
minimum value.

49
bedding angle α Fracture angle β
α = 0°
β = 0-15°
α = 30°
β = 25-30°
α = 45°
β = 30-45°
α = 90°
β = 28-33°
TCD axial compression at s3 = sr = 5 MPa
bedding angle α Fracture angle β
α = 0° β ≈ 80°
α = 30° β = 75-80°
α = 45°
β = 45-80°
α = 90° β ≈ 90°
TES lateral compression at s3 = sa = 5 MPa
bedding angle α Fracture angle β
α = 0° β ≈ 90°
α = 30° β = 80-90°
α = 45° β = 45-80°
α = 90° β ≈ 90°
TEM lateral compression and axial tension at sm = (s3+2s1)/3 = 13.7 MPa
Fig. 3.21 Pictures of failed samples with induced fractures after various kinds of tri-
axial loading
s1
s3
αbedding plane
fracture plane
β
s3
s1
αbedding plane
fracture plane
β
s3
s1
αbedding plane
fracture plane
β

50
Because the maximum strengths of the clay rock developed in the load orientations
parallel and perpendicular to bedding are comparable, only one equation among
(3.12b) and (3.12c) is required for fitting the data over the entire range of 0° ≤ α ≤ 90°.
Based on the previous tests /ZHA 13/14/, the friction angle of ϕ = 24° determined in α =
0° is adopted here. The other parameters are determined for each kind of test (TCD,
TCS, TES and TEM) by fitting the strength data respectively. Whereas s3 = 5 MPa is
known for the TCD, TCS and TES tests, it varies in a range of 1 to 3 MPa during the
TEM tests at constant mean stress sm = 13.7 MPa. A mean value s3 = 2 MPa is taken
for fitting the TEM strength data. All the parameters for each type of test are summa-
rized in Tab. 3.2. Most of the parameters are equal or close for all test types. Fig. 3.20
compares the empirical criterion with the strength data. A reasonable agreement be-
tween them for all kinds of the tests can be identified.
Tab. 3.2 Strength parameters for the various kinds of load conditions
Test type s3 ≡ s1 ≡ ϕ (°) αco(°) A (MPa) B (MPa) n (-)
TCD sr = 5 MPa sa 24 45 7.0 2.0 4 TCS sr = 5 MPa sa 24 45 6.5 2.0 4 TES sa = 5 MPa sr 24 35 5.5 1.5 4 TEM sa ≈ 2 MPa sr 24 30 5.5 1.5 4
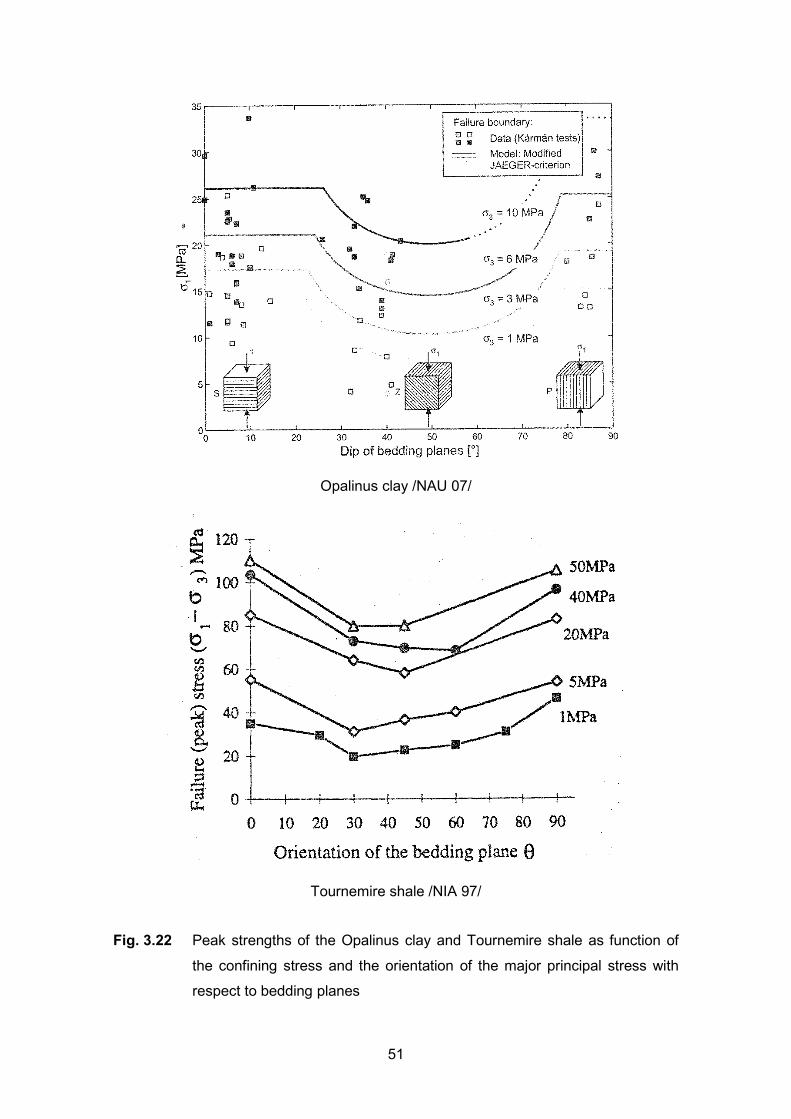
The similar dependency of the strength on the load orientation was also observed for
the Opalinus clay /NAU 07/ and the Tournemire shale /NIA 97/. The strength data ob-
tained at various confining stresses are represented in Fig. 3.22. Note that the dip of
bedding plane for the Opalinus clay is equal to 90° - θ. The peak strengths of both clay
rocks increase with increasing confining stress. For the same confining stress of s3 = 5
MPa, the compressive strength of the COX clay rock is higher than that of the Opalinus
clay but lower than the Tournemire shale.
51
Opalinus clay /NAU 07/
Tournemire shale /NIA 97/
Fig. 3.22 Peak strengths of the Opalinus clay and Tournemire shale as function of
the confining stress and the orientation of the major principal stress with
respect to bedding planes

53
4 Conclusions
The anisotropic mechanical behaviour of the COX clay rock has been investigated with
various kinds of triaxial compression and extension tests on the cores drilled in different
directions with respect to the bedding planes. In order to enhance their quality and thus
the transferability of the test data to the natural clay rock, the samples were hydrostati-
cally pre-compacted before testing. The following conclusions can be drawn from the
test results:
• The degree of structural anisotropy of the clay rock is about 2, determined during
hydrostatic loading-unloading and characterized by the ratio of the elastic deform-
ability in normal to parallel direction to the bedding.
• The clay rock exhibits the elasto-plastic behaviour during short-term deviatoric
compression and extension, characterised by non-linearity of the stress-strain rela-
tion, hysteresis in loading-unloading, irreversibility of strains after unloading, and
volume compaction until the peak failure stress.
• The deformation is influenced by the bedding planes and depends on the orienta-
tion of the major principal stress to the bedding. When the load is parallel and sub-
parallel to bedding, the opening of the bedding planes is the dominating damage
mechanism; when the load is normal and subnormal to bedding, the bedding
planes are going to close up; and in between, sliding along the bedding planes
plays an important role.
• The Young’s moduli and Poisson’s ratios determined in the applied load orienta-
tions increase in the beginning of deviatoric loading due to hardening effect and
then tend to constant before peak failure. Five independent elastic parameters are
obtained for the clay rock.
• The short-term strength is dependent on loading path and direction with respect to
the bedding. For a given major load direction, the compressive strength is higher
than the extensive one and the lowest strength occurs by triaxial extension at con-
stant mean stress. In each loading path, the maximum strength values are reached
in parallel and normal to bedding, while the minimum occurs at the load orientation
of ~45° during compression and of ~30° during extension. The dependence of the
strength on the major load orientation can be described by an empirical model for
each kind of the tests.
• Significant time effects on the deformation and strength are observed during the
long-term creep tests. The long-term deformation rate seems to be less dependent
on load orientation, i.e., insignificant anisotropy of the long-term behaviour.

54
It has to be pointed out that more precise experiments on the clay rock are needed to
enhance the certainty of the test results and conclusions, particularly with regard to the
effect of confining stress on the mechanical behaviour and anisotropy, the long-term
deformation and damage.

55
References
/AND 05/ ANDRA DOSSIER (2005): Synthesis – Evaluation of the feasibility of a
geological repository in an argillaceous formation
/BRA 06/ Brady, B.H.G. and Brown, E.T. (2006): Rock Mechanics for Underground
Mining, third edition, Springer
/BOC 10/ Bock, H., Dehandschutter, B., Martin, C.D., Mazurek, M., Haller, A.D.,
Skoczylas, F., Davy, C. (2010): Self-Sealing of Fractures in Argillaceous
Formations in the Context of Geological Disposal of Radioactive Waste –
Review and Synthesis, OECD 2010, NEA No. 6184
/GAT 02/ Gatelier, N., Pellet, F., Loret, B. (2002): Mechanical damage of an aniso-
tropic porous rock in cyclic triaxial tests, Int. J. Rock Mech. Min. Sci. Vol 39
335-354
/GHO 14/ Gholami, R., Rasouli, V. (2014): Mechanical Elastic Properties of Trans-
versely Isotropic Slate, Rock Mech Rock Eng 47: 1763-1773
/ISR 81/ ISRM: Rock Characterization Testing & Monitoring – IRSM suggested
methods, 1981
/JAE 60/ Jaeger, J. C. (1960): Shear fracture of anisotropic rocks, Geol. Mag. 97: 65-
72
/MCL 67/ McLamore, R. and Gray, K.E. (1967): The mechanical behaviour of
anisotropic sedimentary rocks, J. Energy for Industry, Trans. Am. Soc.
Mech. Engers Ser. B, 89: 62-73
/NAU 07/ Naumann, M., Hunsche, U., Schulze, O. (2007): Experimental
investigations on anisotropy in dilatancy, failure and creep of Opalinus
Clay, Phys. Chem. Earth Parts 32, 889–895
/NIA 97/ Niandou, H., Shao, J.F., Henry, J.P., Fourmaintraux, D. (1997): Laboratory
Investigation of the Mechanical Behaviour of Tournemire Shale, Int. J. Rock
Mech. Min. Sci. Vol 34, No. 1, pp. 3-16

56
/POP 07/ Popp, T., Salzer, K. (2007): Anisotropy of seismic and mechanical
properties of Opalinus clay during triaxial deformation in a multi-anvil
apparatus, Phys. Chem. Earth Parts 32, 879–888
/SAR 07/ Sarout, J., Molez, L., Gueguen, Y., Hoteit, N. (2007): Shale dynamic
properties and anisotropy under triaxial loading: Experimental and
theoretical investigations, Phys. Chem. Earth Parts 32, 896-906
/VAL 04/ Vales, F., Nguyen Minh, D., Gharbi, H., Rejeb, A. (2004): Experimental
study of the influence of the degree of saturation on physical and mechani-
cal properties in Tornemire shale (France), Appl. Clay Sci. 26, 197-207
/VAL 12/ Valente, S., Fidelibus, C., Loew, S., Cravero, M., Iabichino, G., Barpi, F.
(2012): Analysis of Fracture Mechanics Tests on Opalinus Clay, Rock
Mech Rock Eng 45:767-779
/WIT 84/ Wittke, W. (1984): Felsmechanik – Grundlagen für wirtschaftliches Bauern
im Fels, Springer-Verlag
/YAN 13/ Yang, D., Chanchole, S., Valli, P., Chen, L. (2013): Study of the Anisotropic
properties of argillite under moisture and mechanical loads, Rock Mech
Rock Eng (2013), 46: 247-257
/YOU 13/ Yuan, J.L., Deng, J.G., Tan, Q., Yu, B.H., Jin, X.C. (2013): Borehole
stability analysis of horizontal drilling in shale gas reversoirs, Rock Mech
Rock Eng (2013), 46: 1157-1164
/ZHA 10/ Zhang, C.L., Czaikowski, O., Rothfuchs, T. (2010): Thermo-Hydro-
Mechanical Behaviour of the Callovo-Oxfordian Clay Rock, Final report of
the BURE-HAUPT/EC-TIMODAZ project, GRS-266
/ZHA 13/ Zhang C.L., Czaikowski O., Rothfuchs T., Wieczorek K. (2013): Thermo-
Hydro-Mechanical Processes in the Nearfield around a HLW Repository in
Argillaceous Formations, Project Report THM-TON, GRS-312
/ZHA 14/ Zhang C.L. (2014): Deliverables D3.28 and D5.5 of the EC project DOPAS:
Status report on characterization and modelling of clay rock and claystone-
based seal material

57
List of tables
Tab. 3.1 Average values of the five independent elastic parameters and the
anisotropic parameters of the COX clay rock at different deviatoric
stresses ................................................................................................... 45
Tab. 3.2 Strength parameters for the various kinds of load conditions ................... 50


59
List of figures
Fig. 2.1 Position of the coring drift NER at the -490m main level of the MHM-
URL ........................................................................................................... 3
Fig. 2.2 Arrangement of the boreholes and sampling positions ............................... 4
Fig. 2.3 Pictures of typical samples with bedding planes inclined to the
sample axis at angles of α ≈ 0°, 30°, 45°, 60° and 90° ............................... 5
Fig. 2.4 Distributions of the main mineralogical components (clay, carbonate,
quartz etc.) in the sampling region ............................................................. 6
Fig. 2.5 Distributions of the physical properties in the sampling region ................... 9
Fig. 3.1 Schematic of designed loading paths ....................................................... 14
Fig. 3.2 Orientations of local strain measurements with respect to bedding
planes ...................................................................................................... 15
Fig. 3.3 Test set up for triaxial compression and extension testing ....................... 16
Fig. 3.4 Coupled rig for triaxial creep testing on two samples one upon
another .................................................................................................... 17
Fig. 3.5 Strains measured in orientations normal, parallel and inclined to
bedding planes (ε⊥, ε⫽, εaα) during hydrostatic loading-unloading cycle .... 19
Fig. 3.6 Elastic strains measured in orientations normal, parallel and inclined
to bedding planes (ε⊥, ε⫽, εaα) during hydrostatic unloading ...................... 22
Fig. 3.7 Stress-strain curves obtained in directions normal, parallel and
inclined to bedding planes (∆s–ε⊥, ∆s–ε⫽, ∆s–εaα) during strain-
controlled axial compression oriented at angles of α = 0°, 30°, 45°
and 90° to bedding and at lateral stress of 5 MPa .................................... 25
Fig. 3.8 Development of axial / radial / volumetric strains during strain-
controlled axial compression oriented at angles of α = 0°, 30°, 45°
and 90° inclined to bedding and at lateral stress of 5 MPa ....................... 27

60
Fig. 3.9 Stress-strain curves obtained during stress-controlled axial
compression oriented at angles of α = 0°, 30°, 45°, 60° and 90°
inclined to bedding and at lateral stress sr = 5 Mpa ................................. 29
Fig. 3.10 Stress-strain curves obtained during lateral compression at constant
axial stress sa = 5 MPa for the axial load angles of α = 0°, 30°, 45°,
60° and 90° inclined to bedding ............................................................... 31
Fig. 3.11 Stress-strain curves obtained during lateral compression and axial
extension at constant mean stress sm = 13.7 MPa for the axial load
angles of α = 0°, 30°, 45°, 60° and 90° inclined to bedding ...................... 32
Fig. 3.12 Evolution of axial strain and strain rate during the triaxial creep tests
under multistep stresses of sr = 5 MPa and sa = 20 / 22 MPa and at
axial load angles of α = 0°, 30°, 45°, 60° and 90° inclined to bedding ...... 33
Fig. 3.13 Definition of the elastic parameters for a transversely isotropic rock
with bedding planes (after /WIT 84/) ........................................................ 36
Fig. 3.14 Variation of Young’s moduli E1 and E2 with deviatoric stress before
failure ....................................................................................................... 39
Fig. 3.15 Variation of Poisson’s ratios ν1 and ν2 with deviatoric stress before
failure ....................................................................................................... 40
Fig. 3.16 Average Young’s moduli E1 and E2 and Poisson’s ratios ν1 and ν2 as
a function of deviatoric stress................................................................... 41
Fig. 3.17 Variation of Young’s modulus Eα with deviatoric loading in α = 30°
and 45° .................................................................................................... 42
Fig. 3.18 Shear modulus G2 based on the axial Young’s modulus E30° and E45° ...... 43
Fig. 3.19 Variation of the elastic anisotropy parameters as a function of
deviatoric stress ....................................................................................... 44
Fig. 3.20 Peak failure strength and axial failure strain developed along
different loading paths as function of the orientation of the major
principal stress with respect to bedding planes ........................................ 47
Fig. 3.21 Pictures of failed samples with induced fractures after various kinds
of triaxial loading ...................................................................................... 49
61
Fig. 3.22 Peak strengths of the Opalinus clay and Tournemire shale as
function of the confining stress and the orientation of the major
principal stress with respect to bedding planes ........................................ 51
Fig. A.1 A core unpacked from T-cell .................................................................... 65
Fig. A.2 A core unpacked from aluminium foil ....................................................... 65
Fig. A.3 A damaged core unpacked from aluminium foil ....................................... 65
Fig. A.4 Organic component in cores (I) ................................................................ 66
Fig. A.5 Organic component in cores (II) ............................................................... 66
Fig. A.6 Sample preparation ................................................................................. 66
Fig. E.1 Sample EST49122A in axial load orientation α = 0° with respect to
bedding .................................................................................................... 77
Fig. E.2 Stress-strain curves during hydrostatic pre-compaction and
deviatoric loading ..................................................................................... 77
Fig. E.3 Elastic parameters as a function of applied deviatoric stress ................... 78
Fig. E.4 Sample EST49122B in axial load orientation α = 0° with respect to
bedding .................................................................................................... 78
Fig. E.5 Stress-strain curves during hydrostatic pre-compaction and
deviatoric loading ..................................................................................... 79
Fig. E.6 Elastic parameters as a function of applied deviatoric stress ................... 79
Fig. E.7 Sample EST48979A in axial load orientation α = 30° with respect to
bedding .................................................................................................... 80
Fig. E.8 Stress-strain curves during hydrostatic pre-compaction and
deviatoric loading ..................................................................................... 80
Fig. E.9 Elastic parameters as a function of applied deviatoric stress ................... 81
Fig. E.10 Sample EST49056A in axial load orientation α = 45° with respect to
bedding .................................................................................................... 82

62
Fig. E.11 Stress-strain curves during hydrostatic pre-compaction and
deviatoric loading ..................................................................................... 82
Fig. E.12 Elastic parameters as a function of applied deviatoric stress ................... 83
Fig. E.13 Sample EST49056B in axial load orientation α = 45° with respect to
bedding .................................................................................................... 83
Fig. E.14 Stress-strain curves during hydrostatic pre-compaction and
deviatoric loading ..................................................................................... 84
Fig. E.15 Elastic parameters as a function of applied deviatoric stress ................... 84
Fig. E.16 Sample EST49111A in axial load orientation α = 90° with respect to
bedding .................................................................................................... 85
Fig. E.17 Stress-strain curves during hydrostatic pre-compaction and
deviatoric loading ..................................................................................... 85
Fig. E.18 Elastic parameters as a function of applied deviatoric stress ................... 86
Fig. E.19 Sample EST49111B in axial load orientation α = 90° with respect to
bedding .................................................................................................... 86
Fig. E.20 Stress-strain curves during hydrostatic pre-compaction and
deviatoric loading ..................................................................................... 87
Fig. E.21 Elastic parameters as a function of applied deviatoric stress ................... 87
Fig. E.22 Stress-strain curves from TC hydrostatic and deviatoric compression ..... 91
Fig. E.23 Parameters obtained from the TCS hydrostatic pre-compaction .............. 91
Fig. E.24 Parameters obtained from the TCS triaxial deviatoric compression ......... 92
Fig. E.25 Stress-strain curves from TES triaxial extension tests ............................. 96
Fig. E.26 Parameters obtained from the TES hydrostatic pre-compaction .............. 97
Fig. E.27 Parameters obtained from the TES triaxial extension .............................. 97
Fig. E.28 Stress-strain curves from TEM triaxial extension tests ........................... 101
Fig. E.29 Parameters obtained from the TEM hydrostatic pre-compaction ............ 102

63
Fig. E.30 Parameters obtained from the TEM triaxial extension ............................ 102
Fig. E.31 Creep curves obtained under constant triaxial stress conditions ............ 105


65
A Appendix: Drilled cores and sample preparation
Fig. A.1 A core unpacked from T-cell
Fig. A.2 A core unpacked from aluminium foil
Fig. A.3 A damaged core unpacked from aluminium foil

66
Fig. A.4 Organic component in cores (I)
Fig. A.5 Organic component in cores (II)
Fig. A.6 Sample preparation
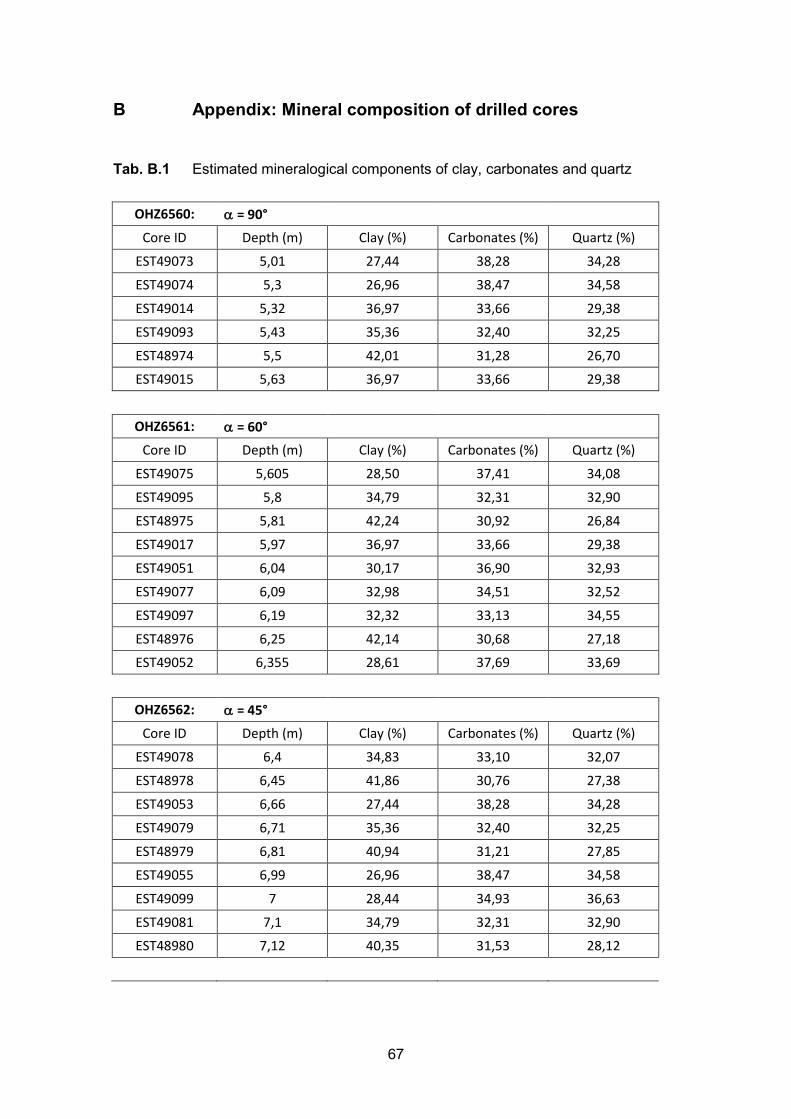
67
B Appendix: Mineral composition of drilled cores
Tab. B.1 Estimated mineralogical components of clay, carbonates and quartz
OHZ6560: α = 90° Core ID Depth (m) Clay (%) Carbonates (%) Quartz (%)
EST49073 5,01 27,44 38,28 34,28
EST49074 5,3 26,96 38,47 34,58
EST49014 5,32 36,97 33,66 29,38
EST49093 5,43 35,36 32,40 32,25
EST48974 5,5 42,01 31,28 26,70
EST49015 5,63 36,97 33,66 29,38
OHZ6561: α = 60°
Core ID Depth (m) Clay (%) Carbonates (%) Quartz (%)
EST49075 5,605 28,50 37,41 34,08
EST49095 5,8 34,79 32,31 32,90
EST48975 5,81 42,24 30,92 26,84
EST49017 5,97 36,97 33,66 29,38
EST49051 6,04 30,17 36,90 32,93
EST49077 6,09 32,98 34,51 32,52
EST49097 6,19 32,32 33,13 34,55
EST48976 6,25 42,14 30,68 27,18
EST49052 6,355 28,61 37,69 33,69
OHZ6562: α = 45°
Core ID Depth (m) Clay (%) Carbonates (%) Quartz (%)
EST49078 6,4 34,83 33,10 32,07
EST48978 6,45 41,86 30,76 27,38
EST49053 6,66 27,44 38,28 34,28
EST49079 6,71 35,36 32,40 32,25
EST48979 6,81 40,94 31,21 27,85
EST49055 6,99 26,96 38,47 34,58
EST49099 7 28,44 34,93 36,63
EST49081 7,1 34,79 32,31 32,90
EST48980 7,12 40,35 31,53 28,12

68
OHZ6563: α = 30° Core ID Depth (m) Clay (%) Carbonates (%) Quartz (%)
EST49019 7,12 36,97 33,66 29,38
EST49056 7,3 27,65 37,97 34,38
EST49101 7,33 28,43 34,96 36,60
EST48982 7,34 39,71 31,89 28,40
EST49082 7,41 33,95 32,53 33,52
EST49020 7,43 36,97 33,66 29,38
EST48983 7,65 38,32 32,67 29,01
EST49057 7,6 30,82 35,93 33,25
EST49103 7,66 30,15 34,13 35,72
OHZ6564: α = 0°
Core ID Depth (m) Clay (%) Carbonates (%) Quartz (%)
EST49083 7,72 31,73 33,37 34,90
EST49021 7,74 36,97 33,66 29,38
EST48984 7,96 37,59 33,07 29,35
EST49105 8,5 37,75 29,97 32,28
EST49060 8,55 35,14 32,79 32,07
EST49106 8,8 39,40 29,13 31,47
OHZ6565: α = 0°
Core ID Depth (m) Clay (%) Carbonates (%) Quartz (%)
EST49121 2,84 38,38 30,06 31,56
EST49122 3,14 38,38 30,06 31,56
EST49124 3,52 41,04 27,68 31,28
EST49061 8,85 35,36 32,40 32,25
EST49062 9,15 35,08 32,28 32,64
EST49108 9,22 41,87 28,66 29,47

C Appendix: Characteristics of tested samples
Tab. C.1 Basic properties measured on the samples before testing
Physical properties Grain density Dry density Bulk density Porosity Water content Water saturation
(g/cm3) (g/cm3) (g/cm3) (%) (%) (%)
Mean value 2,695 2,25 2,42 16,5 7,1 96.0
Upper & lower limit ±0.020 ±0.030 ±0.030 ±1.30 ±0.40 ±4.0
Borehole OHZ6560: α = 90° Grain density Dry density Bulk density Porosity Water content Water saturation
Core ID confinement top (m) end (m) depth (m) (g/cm3) (g/cm3) (g/cm3) (%) (%) (%)
EST49093 CP13504 5,33 5,53 5,43
EST49095 T12097 5,64 5,96 5,80 2,68 2,23 2,40 16,7 7,2 96,0
EST49097 CP13504 6,09 6,29 6,19 2,70 2,24 2,41 16,9 7,0 92,1
EST49099 CP13505 6,90 7,10 7,00 2,70 2,29 2,45 15,2 6,9 102,9
EST49101 T12098 7,17 7,49 7,33
EST49103 CP13505 7,56 7,76 7,66 2,68 2,24 2,41 16,2 6,7 92,5
EST49105 CP13505 8,40 8,60 8,50 2,68 2,23 2,41 16,7 7,5 100,4
EST49106 T12099 8,65 8,95 8,80 2,68 2,23 2,41 16,4 7,3 98,0
EST49108 CP13505 9,12 9,32 9,22
EST49111 T12101 9,80 10,10 9,95 2,69 2,40 2,23 17,0 7,2 94,0 EST49113 T12102 10,31 10,61 10,46
69

Borehole OHZ6561: α = 60° Grain density Dry density Bulk density Porosity Water content Water saturation
Core ID confinement top (m) end (m) depth (m) (g/cm3) (g/cm3) (g/cm3) (%) (%) (%)
EST49073 CP13500 4,91 5,11 5,01
EST49074 T12094 5,15 5,45 5,30 2,69 2,22 2,40 17,4 7,5 95,9
EST49075 CP13500 5,50 5,71 5,61
EST49077 CP13500 5,99 6,19 6,09 2,69 2,28 2,45 15,5 7,0 102,5
EST49078 T12095 6,24 6,56 6,40
EST49079 CP13500 6,61 6,81 6,71 2,69 2,26 2,42 16,2 6,7 93,4
EST49081 CP13501 7,00 7,20 7,10 2,69 2,22 2,40 17,2 7,3 94,1
EST49082 T12096 7,25 7,57 7,41 2,68 2,22 2,40 16,9 7,3 96,5
EST49083 CP13501 7,26 7,82 7,54 2,69 2,22 2,40 17,2 7,3 94,4
Borehole OHZ6562: α = 45° Grain density Dry density Bulk density Porosity Water content Water saturation
Core ID confinement top (m) end (m) depth (m) (g/cm3) (g/cm3) (g/cm3) (g/cm3) (%) (%)
EST49051 CP13497 5,94 6,14 6,04
EST49052 T12091 6,20 6,51 6,36
EST49053 CP13497 6,56 6,76 6,66 2,68 2,24 2,42 16,5 7,3 98,8
EST49055 CP13497 6,89 7,09 6,99 2,70 2,24 2,42 17,1 7,4 96,4
EST49056 T12092 7,15 7,45 7,30 2,70 2,43 2,26 16,4 7,0 96,5 EST49057 CP13497 7,50 7,70 7,60 2,72 2,28 2,45 15,9 6,9 98,2
EST49060 CP13497 8,45 8,65 8,55 2,69 2,28 2,44 15,3 6,5 97,5
EST49061 T12093 8,70 9,00 8,85 2,69 2,25 2,43 16,4 7,3 100,2
EST49062 CP13497 9,05 9,25 9,15 2,69 2,23 2,41 17,2 7,5 97,2
70

Borehole OHZ6563: α = 30° Grain density Dry density Bulk density Porosity Water content Water saturation
Core ID confinement top (m) end (m) depth (m) (g/cm3) (g/cm3) (g/cm3) (%) (%) (%)
EST48974 CP13481 5,40 5,60 5,50
EST48975 T12086 5,65 5,97 5,81 2,69 2,26 2,42 15,9 6,6 93,4
EST48976 CP13481 6,15 6,35 6,25 2,69 2,26 2,43 15,9 7,0 99,8
EST48978 CP13481 6,35 6,55 6,45 2,70 2,25 2,43 16,9 7,5 99,5
EST48979 T12087 6,65 6,97 6,81 2,70 2,26 2,44 16,2 7,1 99,3
EST48980 CP13482 7,02 7,22 7,12 2,70 2,27 2,43 16,1 6,7 94,3
EST48982 CP13482 7,24 7,44 7,34 2,69 2,24 2,42 16,6 7,3 98,4
EST48983 T12088 7,49 7,81 7,65 2,70 2,23 2,41 17,7 7,2 93,8 EST48984 CP13482 7,86 8,06 7,96 2,70 2,23 2,42 17,3 7,7 99,8
Borehole OHZ6564: α = 0° Grain density Dry density Bulk density Porosity Water content Water saturation
Core ID confinement top (m) end (m) depth (m) (g/cm3) (g/cm3) (g/cm3) (%) (%) (%)
EST49014 CP13489 5,22 5,42 5,32
EST49015 T12089 5,47 5,79 5,63 2,68 2,24 2,40 16,3 6,6 90,6
EST49017 CP13489 5,87 6,07 5,97 2,69 2,22 2,41 17,4 7,5 96,2
EST49019 CP13490 7,02 7,22 7,12 2,69 2,25 2,42 16,5 7,2 97,7
EST49020 T12090 7,27 7,59 7,43 2,70 2,26 2,43 16,2 7,0 97,8
EST49021 CP13490 7,64 7,84 7,74 2,72 2,23 2,41 17,9 7,3 91,1
Borehole OHZ6565: α = 0° Grain density Dry density Bulk density Porosity Water content Water saturation
EST49121 CP13508 2,74 2,94 2,84
EST49122 T12104 2,99 3,29 3,14 2,70 2,41 2,23 17,2 7,2 93,0 EST49124 CP13508 3,42 3,62 3,52 2,69 2,23 2,40 17,3 7,2 92,6
71


73
D Appendix: Test plan
Tab. D.1 Test plan and realization with COX samples drilled in different directions
TC: triaxial compression test at constant stress TE: triaxial extension test at constant axial stress TM: triaxial test at constant mean stress TCD: triaxial compression test at constant strain rate TCC: triaxial creep test at constant triaxial stress state x: test was planned and performed f: test was failed due to sample damage
OHZ6560: α = 90° Core
ID confine-ment
top (m)
end (m)
depth (m)
TCD-test sr =5MPa
sa /101 5−⋅=ε
TCS-test sr =5MPa
sMPaa
/107 3−⋅=s
TES-test sa =5MPa
sMPar
/107 3−⋅=s
TEM-test sm=13.7
sMPaa
/107 3−⋅=s
TCC-test sa≥15MPa sr =5MPa
EST49093 CP13504 5,33 5,53 5,43 f
EST49095 T12097 5,64 5,96 5,80 x
EST49097 CP13504 6,09 6,29 6,19 x
EST49099 CP13505 6,90 7,10 7,00 x
EST49101 T12098 7,17 7,49 7,33 f
EST49103 CP13505 7,56 7,76 7,66 f
EST49105 CP13505 8,40 8,60 8,50 x
EST49106 T12099 8,65 8,95 8,80 x x
EST49108 CP13505 9,12 9,32 9,22 f
EST49111 T12101 9,80 10,10 9,95 x, x
EST49113 T12102 10,31 10,61 10,46 x OHZ6561: α = 60°
EST49073 CP13500 4,91 5,11 5,01 f
EST49074 T12094 5,15 5,45 5,30 f x
EST49075 CP13500 5,50 5,71 5,61
EST49077 CP13500 5,99 6,19 6,09 f x
EST49078 T12095 6,24 6,56 6,40 f
EST49079 CP13500 6,61 6,81 6,71 x
EST49081 CP13501 7,00 7,20 7,10 x
EST49082 T12096 7,25 7,57 7,41 x x
EST49083 CP13501 7,26 7,82 7,54
f

74
OHZ6562: α = 45°
EST49051 CP13497 5,94 6,14 6,04 f
EST49052 T12091 6,20 6,51 6,36 f
EST49053 CP13497 6,56 6,76 6,66 x
EST49055 CP13497 6,89 7,09 6,99 x
EST49056 T12092 7,15 7,45 7,30 x, x
EST49057 CP13497 7,50 7,70 7,60 x
EST49060 CP13497 8,45 8,65 8,55 x
EST49061 T12093 8,70 9,00 8,85
x
EST49062 CP13497 9,05 9,25 9,15 x
OHZ6563: α = 30°
EST48974 CP13481 5,40 5,60 5,50 f
EST48975 T12086 5,65 5,97 5,81 x EST48976 CP13481 6,15 6,35 6,25 x EST48978 CP13481 6,35 6,55 6,45 x EST48979 T12087 6,65 6,97 6,81 x
EST48980 CP13482 7,02 7,22 7,12 x EST48982 CP13482 7,24 7,44 7,34 x EST48983 T12088 7,49 7,81 7,65 x, x x EST48984 CP13482 7,86 8,06 7,96 x
OHZ6564/5: α = 0°
EST49014 CP13489 5,22 5,42 5,32 f EST49015 T12089 5,47 5,79 5,63 x
EST49017 CP13489 5,87 6,07 5,97 f EST49019 CP13490 7,02 7,22 7,12 x
EST49020 T12090 7,27 7,59 7,43 x x EST49021 CP13490 7,64 7,84 7,74 f EST49121 CP13508 2,74 2,94 2,84 f EST49122 T12104 2,99 3,29 3,14 x, x x, x
EST49124 CP13508 3,42 3,62 3,52 f

75
E Appendix: Test data
E.1 TCD – triaxial compression tests with strain control
Tab. E.1 Characteristic parameters determined from the TCD compression tests
Basic properties of the samples before testing
sample D/L angle to bedding
grain density
bulk density
dry density
initial porosity
water content
water satura-
tion ID (mm) α (°) (g/cm3) (g/cm3) (g/cm3) (%) (%) (%)
EST49122A 70/140 0 2,698 2,407 2,234 17,21 7,2 93,5 EST49122B 70/140 0 2,698 2,410 2,236 17,11 7,2 94,1 EST48979A 70/140 30 2,700 2,420 2,248 16,73 7,1 95,4 EST49056A 70/90 45 2,703 2,430 2,260 16,39 7,0 96,5 EST49056B 70/85 45 2,703 2,395 2,227 17,60 7,0 88,6 EST49111A 70/130 90 2,688 2,390 2,218 17,49 7,2 91,3 mean value 2,697 2,408 2,236 17,08 7,13 93,4 standard deviation 0,006 0,013 0,013 0,386 0,088 2,454
Hydrostatic pre-compaction up to 16 MPa
sample angle to bedding
max. mean stress
max. axial strain
max. radial strain
max. volume strain
bulk modulus
anisotropy ratio
ID α (°) sm (MPa) εa-m (%) εr-m (%) εv-m (%) K (GPa) R (-) EST49122A 0 16 0,18 0,20 0,56 4,75 2,16 EST49122B 0 16 0,16 0,16 0,48 3,49 x EST48979A 30 16 0,17 0,21 0,58 6,76 2,83 EST49056A 45 16 0,28 0,11 0,51 7,79 x EST49056B 45 16 0,32 x x x x EST49111A 90 16 0,30 0,08 0,32 5,22 1,65 EST49111B 90 16 0,30 x x x x mean value 0,24 0,13 0,45 5,60 2,21 standard deviation 0,065 0,072 0,116 1,514 0,483
sample angle to bedding
max. mean stress
bulk density
dry density
porosity water content
water saturation
ID α (°) sm (MPa) (g/cm3) (g/cm3) (%) (%) (%) EST49122A 0 16 2,421 2,246 16,74 7,2 96,6 EST49122B 0 16 2,422 2,247 16,71 7,2 96,9 EST48979A 30 16 2,434 2,261 16,25 7,1 98,8 EST49056A 45 16 2,438 2,267 15,98 7,0 98,4 EST49056B 45 16 7,0 EST49111A 90 16 2,398 2,225 17,23 7,2 93,0 EST49111B 90 16 7,20 mean value 2,422 2,249 16,61 7,13 96,7 standard deviation 0,014 0,015 0,392 0,088 2,051

76
Deviatoric loading at constant radial stress of 5 MPa
sample angle to bedding
radial stress
Young's modulus
anisot-ropy ratio
Poisson’s ratio
peak strength
failure strain
fracture angle
ID α (°) (MPa) E (GPa) R (-) ν (-) sF (MPa) εa-f (%) ß (°)
EST49122A 0 5 6,0-12,0 1,0-2,6 0,13-0,36 30,4 1,03 21,0 EST49122B 0 5 8,0-10,0 x x 30,4 1,00 20,0 EST48979A 30 5 8,2-9,6 2,4-2,5 0,37-0,47 25,4 0,65 25,0 EST49056A 45 5 2,8-8,4 0,3-2,2 0,08-0,21 27,4 0,85 28,0 EST49056B 45 5 2,1-6,1 x 0,02-0,19 22,3 0,96 35,0 EST49111A 90 5 3,5-6,4 x 0,20-0,29 25,8 1,07 32,0 EST49111B 90 5 3,3-6,4 x 0,20-0,34 27,2 1,20 30,0
mean value 27,0 0,97 27,3
standard deviation 2,66 0,16 5,18

77
before testing
after testing
Fig. E.1 Sample EST49122A in axial load orientation α = 0° with respect to bedding
Hydrostatic compression
strains in different directions
Deviatoric compression
strains in different directions
axial / radial / volumetric strain
axial / radial / volumetric strain
Fig. E.2 Stress-strain curves during hydrostatic pre-compaction and deviatoric load-
ing
0,0
0,1
0,2
0,3
0,4
0 2 4 6 8 10 12 14 16 18
Stra
in
(%)
Hydrostatic stress s (MPa)
εa⫽
EST49122A-0°
timeeffect
ε⊥
ε⫽
0
5
10
15
20
25
30
35
-0,6 -0,4 -0,2 0,0 0,2 0,4 0,6 0,8 1,0 1,2
Diff
eren
tial s
tres
s ∆
s(M
Pa)
Strain (%)
εa⫽EST49122A-0°ε⫽ε⊥
sr = 5 MPa
0,0
0,1
0,2
0,3
0,4
0,5
0,6
0 2 4 6 8 10 12 14 16 18
Stra
in
(%)
Hydrostatic stress s (MPa)
εr
EST49122A-0° εvEST49122A-0°
εa⫽
0
5
10
15
20
25
30
35
-0,6 -0,4 -0,2 0,0 0,2 0,4 0,6 0,8 1,0 1,2
Diff
eren
tial s
tres
s ∆
s(M
Pa)
Strain (%)
EST49122A-0°
εvεr
sr = 5 MPa
εa⫽

78
Young’s modulus
strain ratios ν⫽ = εr⫽/εa, ν⊥ = εr⊥/εa
anisotropy ratio Rν
Poisson’s ratio
Fig. E.3 Elastic parameters as a function of applied deviatoric stress
before testing
after testing
Fig. E.4 Sample EST49122B in axial load orientation α = 0° with respect to bedding
0
2
4
6
8
10
12
14
0 5 10 15 20 25 30
Youn
g's
mod
ulus
E (
GPa
)
Deviatoric stress ∆s (MPa)
EST49122A-0°
loading
unloading
sr = 5 MPa0,0
0,1
0,2
0,3
0,4
0,5
0,6
0 5 10 15 20 25 30
Stra
in ra
tio
ν (-
)
Deviatoric stress ∆s (MPa)
EST49122A-0°
loading
unloading
sr = 5 MPa
ν⊥
ν⫽
0,0
0,5
1,0
1,5
2,0
2,5
3,0
0 5 10 15 20 25 30
Anis
otro
py ra
tio
R
(-)
Deviatoric stress ∆s (MPa)
EST49122A-0°
loading
unloading
sr = 5 MPa0,0
0,1
0,2
0,3
0,4
0,5
0 5 10 15 20 25 30
Pois
son'
s ra
tio ν
(-)
Deviatoric stress ∆s (MPa)
EST49122A-0°
loading
unloading
sr = 5 MPa
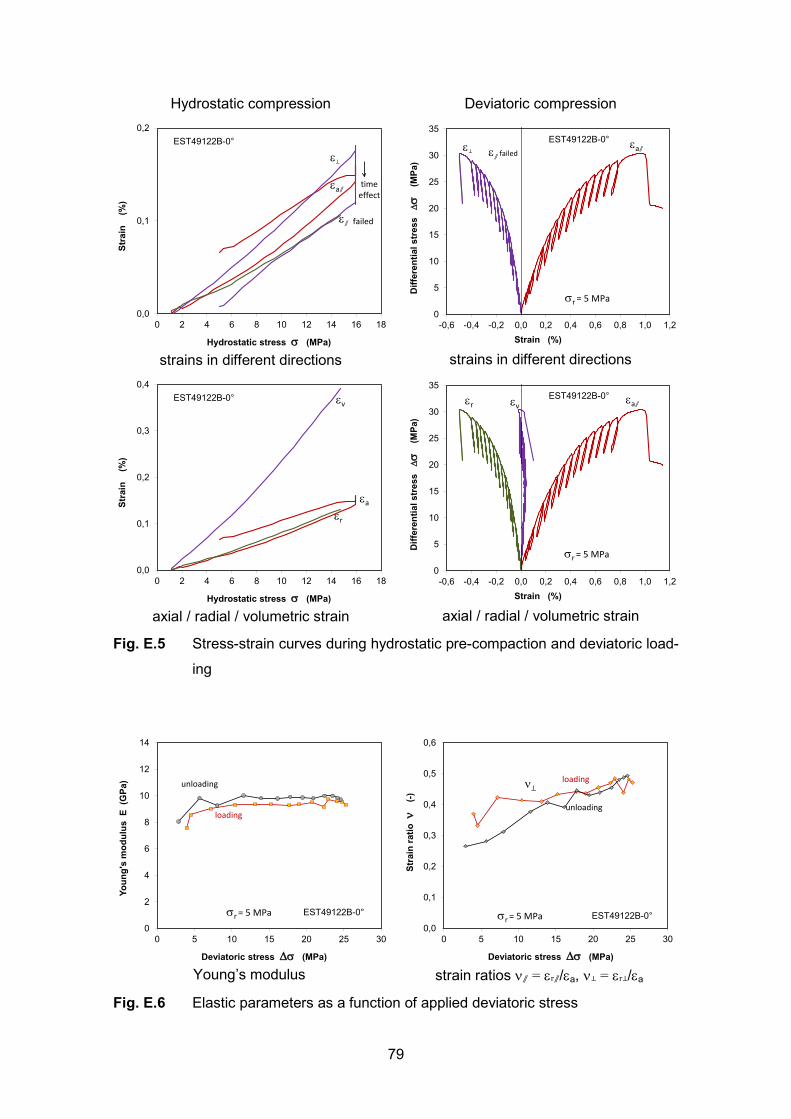
79
Hydrostatic compression
strains in different directions
Deviatoric compression
strains in different directions
axial / radial / volumetric strain
axial / radial / volumetric strain
Fig. E.5 Stress-strain curves during hydrostatic pre-compaction and deviatoric load-
ing
Young’s modulus
strain ratios ν⫽ = εr⫽/εa, ν⊥ = εr⊥/εa
Fig. E.6 Elastic parameters as a function of applied deviatoric stress
0,0
0,1
0,2
0 2 4 6 8 10 12 14 16 18
Stra
in
(%)
Hydrostatic stress s (MPa)
εa⫽
EST49122B-0°
timeeffect
ε⫽
ε⊥
failed
0
5
10
15
20
25
30
35
-0,6 -0,4 -0,2 0,0 0,2 0,4 0,6 0,8 1,0 1,2
Diff
eren
tial s
tres
s ∆
s(M
Pa)
Strain (%)
εa⫽EST49122B-0°
ε⫽ failedε⊥
sr = 5 MPa
0,0
0,1
0,2
0,3
0,4
0 2 4 6 8 10 12 14 16 18
Stra
in
(%)
Hydrostatic stress s (MPa)
εa
EST49122B-0°
εr
εv
0
5
10
15
20
25
30
35
-0,6 -0,4 -0,2 0,0 0,2 0,4 0,6 0,8 1,0 1,2
Diff
eren
tial s
tres
s ∆
s(M
Pa)
Strain (%)
EST49122B-0°εvεr
sr = 5 MPa
εa⫽
0
2
4
6
8
10
12
14
0 5 10 15 20 25 30
Youn
g's
mod
ulus
E (
GPa
)
Deviatoric stress ∆s (MPa)
EST49122B-0°
loading
unloading
sr = 5 MPa0,0
0,1
0,2
0,3
0,4
0,5
0,6
0 5 10 15 20 25 30
Stra
in ra
tio ν
(-)
Deviatoric stress ∆s (MPa)
EST49122B-0°
loading
unloading
sr = 5 MPa
ν⊥

80
before testing
after testing
Fig. E.7 Sample EST48979A in axial load orientation α = 30° with respect to bed-
ding
Hydrostatic compression
strains in different directions
Deviatoric compression
strains in different directions
axial / radial / volumetric strain
axial / radial / volumetric strain
Fig. E.8 Stress-strain curves during hydrostatic pre-compaction and deviatoric load-
ing
0,0
0,1
0,2
0,3
0,4
0,5
0 2 4 6 8 10 12 14 16 18
Stra
in
(%)
Hydrostatic stress s (MPa)
εa30°
EST48979A-30°
ε⫽
ε⊥
0
5
10
15
20
25
30
35
-0,8 -0,6 -0,4 -0,2 0,0 0,2 0,4 0,6 0,8 1,0 1,2
Diff
eren
tial s
tres
s ∆
s(M
Pa)
Strain (%)
εa30°ε⫽ε⊥
sr = 5 MPa
EST48979A-30°
0,0
0,1
0,2
0,3
0,4
0,5
0,6
0 2 4 6 8 10 12 14 16 18
Stra
in
(%)
Hydrostatic stress s (MPa)
εa30°
EST48979A-30° εv
εr
0
5
10
15
20
25
30
35
-0,6 -0,4 -0,2 0,0 0,2 0,4 0,6 0,8 1,0 1,2
Diff
eren
tial s
tres
s ∆
s(M
Pa)
Strain (%)
εa30°εr εv
sr = 5 MPa
EST48979A-30°

81
Young’s modulus
strain ratios ν⫽ = -εr⫽/εa, ν⊥ = -εr⊥/εa
anisotropy ratio Rν
Poisson’s ratio
Fig. E.9 Elastic parameters as a function of applied deviatoric stress
0
2
4
6
8
10
12
14
0 5 10 15 20 25 30
Youn
g's
mod
ulus
E (
GPa
)
Deviatoric stress ∆s (MPa)
EST48979A-30°
loading
unloading
sr = 5 MPa0,0
0,2
0,4
0,6
0,8
1,0
0 5 10 15 20 25 30
Stra
in ra
tio ν
(-)
Deviatoric stress ∆s (MPa)
EST48979A-30°
loading
unloading
sr = 5 MPa
ν⊥30°
ν⫽30°
0,0
0,5
1,0
1,5
2,0
2,5
3,0
0 5 10 15 20 25 30
Anis
otro
py ra
tio
R
(-)
Deviatoric stress ∆s (MPa)
EST48979A-30°
loading
unloading
sr = 5 MPa0,0
0,1
0,2
0,3
0,4
0,5
0 5 10 15 20 25 30
Pois
son'
s ra
tio ν
(-)
Deviatoric stress ∆s (MPa)
EST48979A-30°
loading
unloading
sr = 5 MPa

82
before testing
after testing
Fig. E.10 Sample EST49056A in axial load orientation α = 45° with respect to bed-
ding
Hydrostatic compression
strains in different directions
Deviatoric compression
strains in different directions
axial / radial / volumetric strain
axial / radial / volumetric strain
Fig. E.11 Stress-strain curves during hydrostatic pre-compaction and deviatoric load-
ing
-0,1
0,0
0,1
0,2
0,3
0 2 4 6 8 10 12 14 16 18
Stra
in
(%)
Hydrostatic stress s (MPa)
εa45°EST49056A-45°
timeeffect
ε⫽
ε⊥
0
5
10
15
20
25
30
35
-0,6 -0,4 -0,2 0,0 0,2 0,4 0,6 0,8 1,0 1,2
Diff
eren
tial s
tres
s ∆
s(M
Pa)
Strain (%)
εa45°ε⫽ε⊥
sr = 5 MPa
EST49056A-45°
0,0
0,1
0,2
0,3
0,4
0,5
0 2 4 6 8 10 12 14 16 18
Stra
in
(%)
Hydrostatic stress s (MPa)
εa
EST49056A-45° εv
εr
0
5
10
15
20
25
30
35
-0,6 -0,4 -0,2 0,0 0,2 0,4 0,6 0,8 1,0 1,2
Diff
eren
tial s
tres
s ∆
s(M
Pa)
Strain (%)
εaεvεr
sr = 5 MPa
EST49056A-45°

83
Young’s modulus
strain ratios ν⫽ = -εr⫽/εa, ν⊥ = -εr⊥/εa
anisotropy ratio Rν
Poisson’s ratio
Fig. E.12 Elastic parameters as a function of applied deviatoric stress
before testing
after testing
Fig. E.13 Sample EST49056B in axial load orientation α = 45° with respect to bed-
ding
Hydrostatic compression Deviatoric compression
0
2
4
6
8
10
12
14
0 5 10 15 20 25 30
Youn
g's
mod
ulus
E (
GPa
)
Deviatoric stress ∆s (MPa)
EST49056A-45°
loading
unloading
sr = 5 MPa0,0
0,1
0,2
0,3
0,4
0,5
0 5 10 15 20 25 30
Stra
in ra
tio ν
(-)
Deviatoric stress ∆s (MPa)
EST49056A-45°
loading
sr = 5 MPa
ν⊥45°
unloading
ν⫽45°
0,0
0,5
1,0
1,5
2,0
2,5
3,0
0 5 10 15 20 25 30
Anis
otro
py ra
tio
R
(-)
Deviatoric stress ∆s (MPa)
EST49056A-45°
loading
unloading
sr = 5 MPa0,0
0,1
0,2
0,3
0,4
0,5
0 5 10 15 20 25 30
Pois
son'
s ra
tio ν
(-)
Deviatoric stress ∆s (MPa)
EST49056A-45°
loading
sr = 5 MPa
unloading
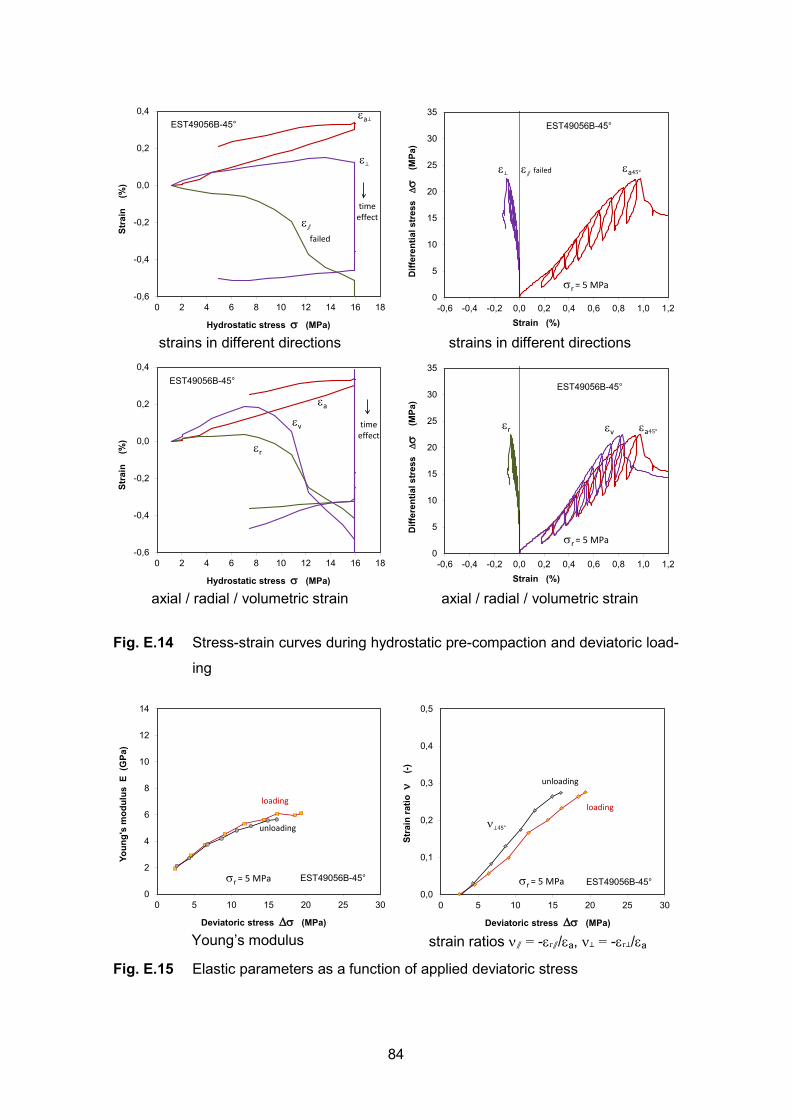
84
strains in different directions
strains in different directions
axial / radial / volumetric strain
axial / radial / volumetric strain
Fig. E.14 Stress-strain curves during hydrostatic pre-compaction and deviatoric load-
ing
Young’s modulus
strain ratios ν⫽ = -εr⫽/εa, ν⊥ = -εr⊥/εa
Fig. E.15 Elastic parameters as a function of applied deviatoric stress
-0,6
-0,4
-0,2
0,0
0,2
0,4
0 2 4 6 8 10 12 14 16 18
Stra
in
(%)
Hydrostatic stress s (MPa)
εa⊥EST49056B-45°
timeeffect
ε⊥
ε⫽
failed
0
5
10
15
20
25
30
35
-0,6 -0,4 -0,2 0,0 0,2 0,4 0,6 0,8 1,0 1,2
Diff
eren
tial s
tres
s ∆
s(M
Pa)
Strain (%)
ε⫽ failedε⊥
sr = 5 MPa
εa45°
EST49056B-45°
-0,6
-0,4
-0,2
0,0
0,2
0,4
0 2 4 6 8 10 12 14 16 18
Stra
in
(%)
Hydrostatic stress s (MPa)
εa
timeeffect
εv
εr
EST49056B-45°
0
5
10
15
20
25
30
35
-0,6 -0,4 -0,2 0,0 0,2 0,4 0,6 0,8 1,0 1,2
Diff
eren
tial s
tres
s ∆
s(M
Pa)
Strain (%)
εvεr
sr = 5 MPa
εa45°
EST49056B-45°
0
2
4
6
8
10
12
14
0 5 10 15 20 25 30
Youn
g's
mod
ulus
E (
GPa
)
Deviatoric stress ∆s (MPa)
EST49056B-45°
loading
unloading
sr = 5 MPa0,0
0,1
0,2
0,3
0,4
0,5
0 5 10 15 20 25 30
Stra
in ra
tio ν
(-)
Deviatoric stress ∆s (MPa)
EST49056B-45°
loading
sr = 5 MPa
ν⊥45°
unloading

85
before testing
after testing
Fig. E.16 Sample EST49111A in axial load orientation α = 90° with respect to bed-
ding
Hydrostatic compression
strains in different directions
Deviatoric compression
strains in different directions
axial / radial / volumetric strain
axial / radial / volumetric strain
Fig. E.17 Stress-strain curves during hydrostatic pre-compaction and deviatoric load-
ing
-0,1
0,0
0,1
0,2
0,3
0 2 4 6 8 10 12 14 16 18
Stra
in
(%)
Hydrostatic stress s (MPa)
εa⊥EST49111A-90°
timeeffect
ε⊥
ε⫽
0
5
10
15
20
25
30
35
-0,6 -0,4 -0,2 0,0 0,2 0,4 0,6 0,8 1,0 1,2 1,4 1,6
Diff
eren
tial s
tres
s ∆
s(M
Pa)
Strain (%)
ε⫽ε⊥
sr = 5 MPa
εa⊥
EST49111A-90°
-0,1
0,0
0,1
0,2
0,3
0,4
0 2 4 6 8 10 12 14 16 18
Stra
in
(%)
Hydrostatic stress s (MPa)
εa
EST49111A-90°
timeeffect
εv
εr
0
5
10
15
20
25
30
35
-0,6 -0,4 -0,2 0,0 0,2 0,4 0,6 0,8 1,0 1,2 1,4 1,6
Diff
eren
tial s
tres
s ∆
s(M
Pa)
Strain (%)
εvεr
sr = 5 MPa
EST49111A-90°
εa⊥

86
Young’s modulus
strain ratios ν⫽ = -εr⫽/εa, ν⊥ = -εr⊥/εa
anisotropy ratio Rν
Poisson’s ratio
Fig. E.18 Elastic parameters as a function of applied deviatoric stress
before testing
after testing
Fig. E.19 Sample EST49111B in axial load orientation α = 90° with respect to bed-
ding
0
2
4
6
8
10
12
14
0 5 10 15 20 25 30
Youn
g's
mod
ulus
E (
GPa
)
Deviatoric stress ∆s (MPa)
EST49111A-90°
loading
unloading
sr = 5 MPa-1,2
-1,0
-0,8
-0,6
-0,4
-0,2
0,0
0,2
0,4
0,6
0 5 10 15 20 25 30
Stra
in ra
tio ν
(-)
Deviatoric stress ∆s (MPa)
EST49111A-90°
loading
unloading
sr = 5 MPa
ν⊥90°
ν⫽90°
-4,0
-3,5
-3,0
-2,5
-2,0
0 5 10 15 20 25 30
Anis
otro
py ra
tio
R
(-)
Deviatoric stress ∆s (MPa)
EST49111A-90°
loading
unloading
sr = 5 MPa0,0
0,1
0,2
0,3
0,4
0,5
0 5 10 15 20 25 30
Pois
son'
s ra
tio ν
(- )
Deviatoric stress ∆s (MPa)
EST49111A-90°
loading
unloading
sr = 5 MPa

87
Hydrostatic compression
strains in different directions
Deviatoric compression
strains in different directions
axial / radial / volumetric strain
axial / radial / volumetric strain
Fig. E.20 Stress-strain curves during hydrostatic pre-compaction and deviatoric load-
ing
Elastic parameters as a function of applied deviatoric stress
Young’s modulus
strain ratios ν⫽ = -εr⫽/εa, ν⊥ = -εr⊥/εa
Fig. E.21 Elastic parameters as a function of applied deviatoric stress
-0,2
-0,1
0,0
0,1
0,2
0,3
0,4
0 2 4 6 8 10 12 14 16 18
Stra
in
(%)
Hydrostatic stress s (MPa)
εa⊥EST49111B-90°
timeeffect
ε⊥ failed
ε⫽
0
5
10
15
20
25
30
35
-0,6 -0,4 -0,2 0,0 0,2 0,4 0,6 0,8 1,0 1,2 1,4 1,6
Diff
eren
tial s
tres
s ∆
s(M
Pa)
Strain (%)
ε⫽ε⊥ failed
sr = 5 MPa
εa⊥
EST49111B-90°
-0,2
-0,1
0,0
0,1
0,2
0,3
0,4
0 2 4 6 8 10 12 14 16 18
Stra
in
(%)
Hydrostatic stress s (MPa)
εa
EST49111B-90°
timeeffect
εv
εr
0
5
10
15
20
25
30
35
-0,6 -0,4 -0,2 0,0 0,2 0,4 0,6 0,8 1,0 1,2 1,4 1,6
Diff
eren
tial s
tres
s ∆
s(M
Pa)
Strain (%)
εvεr
sr = 5 MPa
EST49111B-90°
εa⊥
0
2
4
6
8
10
12
14
0 5 10 15 20 25 30
Youn
g's
mod
ulus
E (
GPa
)
Deviatoric stress ∆s (MPa)
EST49111B-90°
loading
unloading
sr = 5 MPa0,0
0,1
0,2
0,3
0,4
0,5
0 5 10 15 20 25 30
PStr
ain
ratio
ν(-)
Deviatoric stress ∆s (MPa)
EST49111B-90°
loading
unloading
sr = 5 MPa
ν⫽90°

88
E.2 TCS – triaxial compression tests with stress control
Tab. E.2 Characteristic parameters determined from the TC stress-controlled tests
Basic properties of the samples before testing
sample D/L angle to bedding
grain density
bulk density
dry density
initial porosity
water content
water saturation
ID (mm) α (°) (g/cm3) (g/cm3) (g/cm3) (%) (%) (%) EST49106 50/100 0 2,698 2,422 2,244 16,81 7,3 97,9 EST49082 50/100 30 2,708 2,428 2,266 16,33 6,7 92,7 EST49055 50/100 45 2,703 2,397 2,221 17,85 7,4 91,6 EST49077 50/100 60 2,680 2,400 2,225 16,99 7,3 95,6 EST49082 50/100 60 2,695 2,409 2,232 17,18 7,4 95,5 EST49099 50/100 90 2,700 2,450 2,281 15,52 6,9 101,4 EST49105 50/100 90 2,696 2,443 2,275 15,60 6,9 100,0 mean value 2,697 2,421 2,249 16,61 7,11 96,4 standard deviation 0,008 0,019 0,023 0,786 0,267 3,365
Hydrostatic pre-compaction up to 16 MPa
sample angle to bedding
max. mean stress
max. axial strain
max. radial strain
max. volume strain
bulk modulus
ID α (°) sm (MPa) εa-m (%) εr-m (%) εv-m (%) K (GPa) EST49106 0 16 0,47 0,13 0,74 4,71 EST49082 30 16 0,26 0,17 0,60 4,45 EST49055 45 16 0,41 0,18 0,77 4,58 EST49077 60 16 0,30 0,14 0,57 4,29 EST49082 60 16 0,42 0,18 0,77 5,27 EST49099 90 16 0,39 0,14 0,67 4,44 EST49105 90 16 0,47 0,13 0,74 4,71
mean value 0,39 0,15 0,69 4,64 standard deviation 0,078 0,020 0,077 0,294
sample angle to bedding
max. mean stress
bulk density
dry density
porosity water content
water saturation
ID α (°) sm (MPa) (g/cm3) (g/cm3) (%) (%) (%) EST49106 0 16 2,440 2,261 16,19 7,3 102,4 EST49082 30 16 2,443 2,280 15,82 6,7 96,2 EST49055 45 16 2,416 2,238 17,21 7,4 95,7 EST49077 60 16 2,414 2,237 16,51 7,3 98,9 EST49082 60 16 2,428 2,249 16,54 7,4 100,0 EST49099 90 16 2,467 2,296 14,95 6,9 101,0 EST49105 90 16 2,461 2,292 14,97 6,9 105,0
mean value 2,438 2,265 16,03 7,11 101,0 standard deviation 0,019 0,023 0,778 0,267 3,746

89
Deviatoric loading at constant radial stress of 5 MPa
sample angle to bedding
Young's modulus
Poisson’s ratio
peak strength
failure strain
fracture angle
ID α (°) E (GPa) ν (-) sF (MPa) εa-f (%) ß (°) EST49106 0 4,31 0,29 23,7 1,06 x EST49082 30 5,48 0,23 23,1 0,77 25,0 EST49055 45 4,75 0,27 21,0 0,85 45,0 EST49077 60 4,92 0,24 23,9 0,92 30,0 EST49082 60 4,08 0,26 22,0 0,87 25,0 EST49099 90 5,29 0,22 27,4 1,17 25,0 EST49105 90 4,31 0,29 23,7 1,07 x
mean value 4,73 0,26 23,55 0,96 30,0
standard deviation 0,492 0,026 1,857 0,133 7,746

90
Axial loading orientation α = 0°
Hydrostatic pre-compaction
Deviatoric stress-strain curves
Axial loading orientation α = 30°
Hydrostatic pre-compaction
Deviatoric stress-strain curves
Axial loading orientation α = 45°
Hydrostatic pre-compaction
Deviatoric stress-strain curves
0,0
0,2
0,4
0,6
0,8
0 2 4 6 8 10 12 14 16 18
Stra
in
ε a/ ε
r/ ε
v(%
)
Hydrostatic stress s (MPa)
εr
εa
εv
EST49019-0°
timeeffect
0
5
10
15
20
25
30
-0,4 -0,2 0,0 0,2 0,4 0,6 0,8 1,0 1,2
Diff
eren
tial s
tres
s ∆
s(M
Pa)
Strain εa / εr / εv (%)
εrεaεv
EST49019-0°
0,0
0,2
0,4
0,6
0,8
0 2 4 6 8 10 12 14 16 18
Stra
in
ε a/ ε
r/ ε
v(%
)
Hydrostatic stress s (MPa)
εr
εa
εv
EST48978-30°
timeeffect
0
5
10
15
20
25
30
-0,4 -0,2 0,0 0,2 0,4 0,6 0,8 1,0 1,2
Diff
eren
tial s
tres
s ∆
s(M
Pa)
Strain εa / εr / εv (%)
εrεa
εv
EST48978-30°
0,0
0,2
0,4
0,6
0,8
0 2 4 6 8 10 12 14 16 18
Stra
in
ε a/ ε
r/ ε
v(%
)
Hydrostatic stress s (MPa)
εr
εa
εv
EST49055-45°time
effect
0
5
10
15
20
25
30
-0,4 -0,2 0,0 0,2 0,4 0,6 0,8 1,0 1,2
Diff
eren
tial s
tres
s ∆
s(M
Pa)
Strain εa / εr / εv (%)
εr εaεv
EST49055-45°

91
Axial loading orientation α = 60°
Hydrostatic pre-compaction
Deviatoric stress-strain curves
Axial loading orientation α = 90°
Hydrostatic pre-compaction
Deviatoric stress-strain curves
Fig. E.22 Stress-strain curves from TC hydrostatic and deviatoric compression
Compressive strains at s = 16 MPa
Bulk modulus
Fig. E.23 Parameters obtained from the TCS hydrostatic pre-compaction
0,0
0,2
0,4
0,6
0,8
0 2 4 6 8 10 12 14 16 18
Stra
in
ε a/ ε
r/ ε
v(%
)
Hydrostatic stress s (MPa)
εr
εa
εvEST49082-60°timeeffect
εvEST49077-60°
0
5
10
15
20
25
30
-0,4 -0,2 0,0 0,2 0,4 0,6 0,8 1,0 1,2
Diff
eren
tial s
tres
s ∆
s(M
Pa)
Strain εa / εr / εv (%)
εr εaεv
EST49082-60°
EST49077-60°
0,0
0,2
0,4
0,6
0,8
0 2 4 6 8 10 12 14 16 18
Stra
in
ε a/ ε
r/ ε
v(%
)
Hydrostatic stress s (MPa)
εr
εa
εv
EST49106-90°
timeeffect
EST49099-90°
0
5
10
15
20
25
30
-0,4 -0,2 0,0 0,2 0,4 0,6 0,8 1,0 1,2
Diff
eren
tial s
tres
s ∆
s(M
Pa)
Strain εa / εr / εv (%)
εr εaεv
EST49106-90°
EST49099-90°
0,0
0,2
0,4
0,6
0,8
0 10 20 30 40 50 60 70 80 90
Com
pres
sive
str
ain
(%
)
Axial load angle to bedding α (°)
Hydrostatic stress = 16 MPa
εa
εr
εv
4,0
4,5
5,0
5,5
6,0
0 10 20 30 40 50 60 70 80 90
Bul
k m
odul
us
K
(GPa
)
Axial load angle to bedding α (°)
Hydrostatic stress = 16 MPa
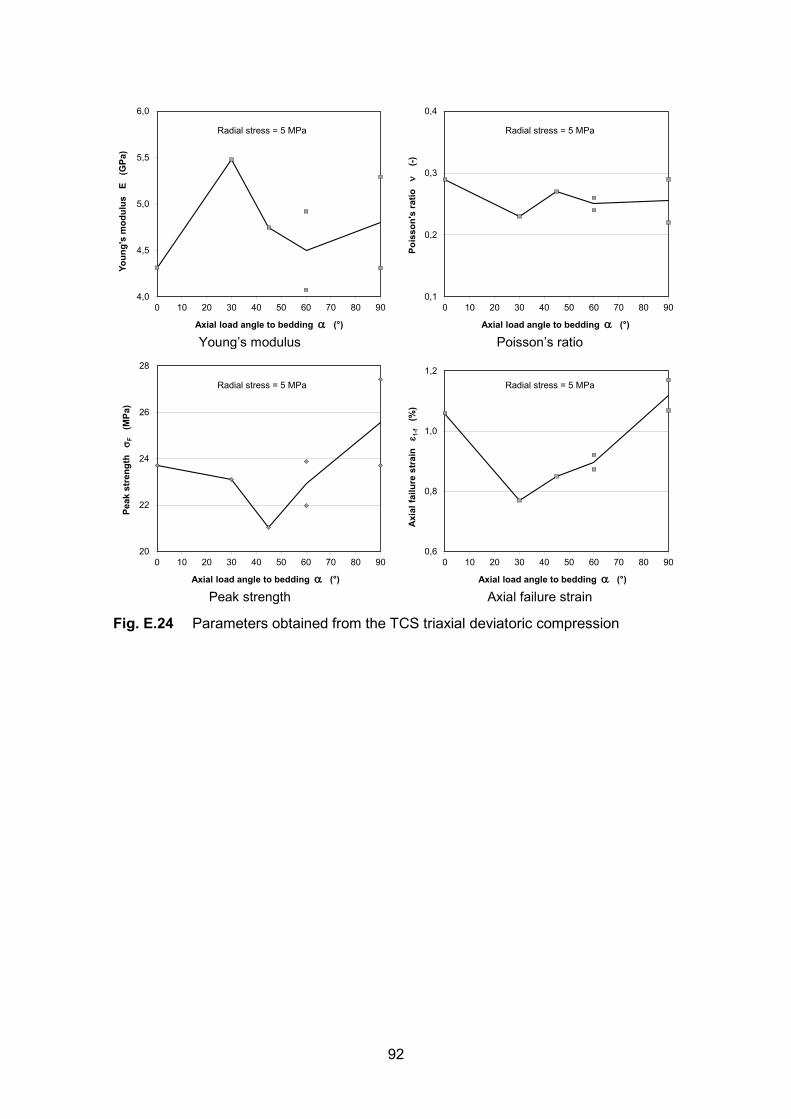
92
Young’s modulus
Poisson’s ratio
Peak strength
Axial failure strain
Fig. E.24 Parameters obtained from the TCS triaxial deviatoric compression
4,0
4,5
5,0
5,5
6,0
0 10 20 30 40 50 60 70 80 90
Youn
g's
mod
ulus
E
(G
Pa)
Axial load angle to bedding α (°)
Radial stress = 5 MPa
0,1
0,2
0,3
0,4
0 10 20 30 40 50 60 70 80 90
Pois
son'
s ra
tio
ν(-)
Axial load angle to bedding α (°)
Radial stress = 5 MPa
20
22
24
26
28
0 10 20 30 40 50 60 70 80 90
Peak
str
engt
h s
F(M
Pa)
Axial load angle to bedding α (°)
Radial stress = 5 MPa
0,6
0,8
1,0
1,2
0 10 20 30 40 50 60 70 80 90
Axia
l fai
lure
str
ain
ε1-
f(%
)
Axial load angle to bedding α (°)
Radial stress = 5 MPa

93
E.3 TES – triaxial extension tests at constant axial stress
Tab. E.3 Characteristic parameters determined from the TES extension tests
Basic properties of the samples before testing
sample D/L angle to bedding
grain density
bulk density
dry density
initial po-rosity
water content
water saturation
ID (mm) α (°) (g/cm3) (g/cm3) (g/cm3) (%) (%) (%) EST49021 50/100 0 2,715 2,405 2,229 17,91 7,3 91,2 EST49017 50/100 0 2,690 2,410 2,229 17,13 7,5 97,6 EST48980 50/100 30 2,702 2,430 2,267 16,08 6,7 94,3 EST48982 50/100 30 2,690 2,420 2,243 16,60 7,3 98,6 EST49057 50/100 45 2,715 2,451 2,295 15,46 6,4 94,3 EST49060 50/100 45 2,690 2,440 2,281 15,19 6,5 97,6 EST49079 50/100 60 2,691 2,417 2,262 15,96 6,4 91,1 EST49081 50/100 60 2,690 2,400 2,225 17,29 7,3 93,9 EST49105 50/100 90 2,685 2,410 2,234 16,79 7,3 97,1 EST49097 50/100 90 2,696 2,407 2,239 16,93 7,0 92,0 Mean value 2,696 2,419 2,251 16,54 6,97 94,8 standard deviation 0,010 0,016 0,023 0,810 0,414 2,666
Hydrostatic pre-compaction up to 16 MPa
sample angle to bedding
max. mean stress
max. axial strain
max. radial strain
max. vol-ume strain
bulk modulus
ID α (°) sm (MPa) εa-m (%) εr-m (%) εv-m (%) K (GPa) EST49021 0 16 0,40 0,23 0,86 4,62 EST49017 0 16 0,38 0,22 0,83 5,09 EST48980 30 16 0,38 0,18 0,74 4,62 EST48982 30 16 1,25 0,14 1,52 3,76 EST49057 45 16 0,26 0,16 0,58 5,58 EST49060 45 16 0,56 0,18 0,92 5,41 EST49079 60 16 0,47 0,14 0,74 4,58 EST49081 60 16 0,75 0,23 1,21 4,20 EST49105 90 16 1,13 0,09 1,32 4,15 EST49097 90 16 0,46 0,13 0,72 4,49
mean value 0,60 0,17 0,94 4,65 standard deviation 0,320 0,046 0,289 0,539

94
sample angle to bedding
max. mean stress
bulk density
dry density
porosity water content
water saturation
ID α (°) sm (MPa) (g/cm3) (g/cm3) (%) (%) (%) EST49021 0 16 2,426 2,248 17,20 7,3 95,8 EST49017 0 16 2,430 2,248 16,44 7,5 102,6 EST48980 30 16 2,448 2,284 15,45 6,7 98,9 EST48982 30 16 2,457 2,278 15,31 7,3 108,6 EST49057 45 16 2,465 2,309 14,96 6,4 98,0 EST49060 45 16 2,463 2,303 14,40 6,5 103,9 EST49079 60 16 2,435 2,278 15,33 6,4 95,6 EST49081 60 16 2,430 2,252 16,28 7,3 101,0 EST49105 90 16 2,442 2,264 15,68 7,3 105,4 EST49097 90 16 2,424 2,256 16,33 7,0 96,1
mean value 2,442 2,272 15,74 6,97 100,6 standard deviation 0,015 0,021 0,779 0,414 4,239
Radial stress increase at constant axial stress of 5 MPa
sample angle to bedding
elastic stiffness
εa / εr ratio
peak strength
failure strain
fracture angle
ID α (°) C (GPa) µ (-) sF (MPa) εa-f (%) ß (°) EST49021 0 12,61 1,15 22,4 -0,46 70,0 EST49017 0 13,39 1,36 24,5 -0,49 85,0 EST48980 30 6,25 0,66 22,5 -0,52 80,0 EST48982 30 10,34 1,25 22,8 -0,48 65,0 EST49057 45 8,68 0,83 24,3 -0,45 80,0 EST49060 45 12,38 1,24 27,0 -0,59 65,0 EST49079 60 16,48 1,63 19,8 -0,40 85,0 EST49081 60 18,00 1,82 19,2 -0,48 65,0 EST49105 90 7,97 0,74 22,9 -0,61 90,0 EST49097 90 11,97 1,08 22,9 -0,60 85,0
mean value 11,81 1,18 22,84 -0,51 77,0 standard deviation 3,481 0,354 2,123 0,067 9,274

95
Axial loading orientation α = 0°
Hydrostatic pre-compaction
Deviatoric stress-strain curves
Axial loading orientation α = 30°
Hydrostatic pre-compaction
Deviatoric stress-strain curves
Axial loading orientation α = 45°
Hydrostatic pre-compaction
Deviatoric stress-strain curves
0,0
0,2
0,4
0,6
0,8
1,0
0 2 4 6 8 10 12 14 16 18
Stra
in
ε a/ ε
r/ ε
v(%
)
Hydrostatic stress s (MPa)
εr
εa
εv
EST49017-0°
timeeffect
EST49021-0°
0
5
10
15
20
25
30
-0,6 -0,4 -0,2 0,0 0,2 0,4 0,6
Diff
eren
tial s
tres
s ∆
s(M
Pa)
Strain εa / εr / εv (%)
εrεaεv
EST49017-0°
EST49021-0°
0,0
0,2
0,4
0,6
0,8
1,0
1,2
1,4
1,6
0 2 4 6 8 10 12 14 16 18
Stra
in
ε a/ ε
r/ ε
v(%
)
Hydrostatic stress s (MPa)
εr
εa
εvEST48982-30°
timeeffect
εa
εvEST48980-30°
0
5
10
15
20
25
30
-0,6 -0,4 -0,2 0,0 0,2 0,4 0,6
Diff
eren
tial s
tres
s ∆
s(M
Pa)
Strain εa / εr / εv (%)
εrεa
εvEST48982-30° εv
EST48980-30°
0,0
0,2
0,4
0,6
0,8
1,0
0 2 4 6 8 10 12 14 16 18
Stra
in
ε a/ ε
r/ ε
v(%
)
Hydrostatic stress s (MPa)
εr
εa
εvEST49060-45°
timeeffect
εa
εv
EST49057-45°
0
5
10
15
20
25
30
-0,8 -0,6 -0,4 -0,2 0,0 0,2 0,4 0,6 0,8
Diff
eren
tial s
tres
s ∆
s(M
Pa)
Strain εa / εr / εv (%)
εrεa εv
EST49060-45°
EST49057-45°

96
Axial loading orientation α = 60°
Hydrostatic pre-compaction
Deviatoric stress-strain curves
Axial loading orientation α = 90°
Hydrostatic pre-compaction
Deviatoric stress-strain curves
Fig. E.25 Stress-strain curves from TES triaxial extension tests
0,0
0,2
0,4
0,6
0,8
1,0
1,2
1,4
0 2 4 6 8 10 12 14 16 18
Stra
in
ε a/ ε
r/ ε
v(%
)
Hydrostatic stress s (MPa)
εr
εa
εvEST49081-60°timeeffect
εaεv
EST49079-60°
0
5
10
15
20
25
-0,6 -0,4 -0,2 0,0 0,2 0,4 0,6
Diff
eren
tial s
tres
s ∆
s(M
Pa)
Strain εa / εr / εv (%)
εrεa εv
EST49081-60°
EST49079-60°
0,0
0,2
0,4
0,6
0,8
1,0
1,2
1,4
0 2 4 6 8 10 12 14 16 18
Stra
in
ε a/ ε
r/ ε
v(%
)
Hydrostatic stress s (MPa)
εr
εa
εv
EST49105-90°
timeeffect
εv
εa
EST49097-90°
0
5
10
15
20
25
30
-0,8 -0,6 -0,4 -0,2 0,0 0,2 0,4 0,6
Diff
eren
tial s
tres
s ∆
s(M
Pa)
Strain εa / εr / εv (%)
εrεaεv
EST49105-90°EST49097-90°
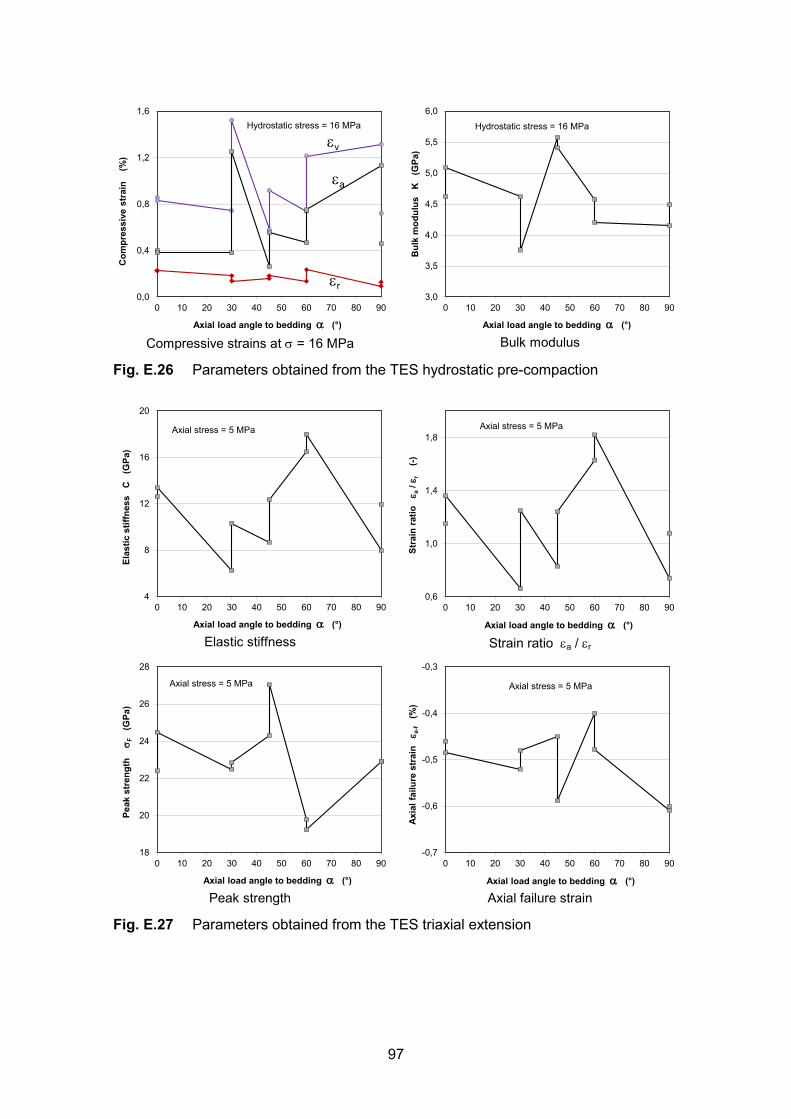
97
Compressive strains at s = 16 MPa
Bulk modulus
Fig. E.26 Parameters obtained from the TES hydrostatic pre-compaction
Elastic stiffness
Strain ratio εa / εr
Peak strength
Axial failure strain
Fig. E.27 Parameters obtained from the TES triaxial extension
0,0
0,4
0,8
1,2
1,6
0 10 20 30 40 50 60 70 80 90
Com
pres
sive
str
ain
(%
)
Axial load angle to bedding α (°)
Hydrostatic stress = 16 MPa
εa
εr
εv
3,0
3,5
4,0
4,5
5,0
5,5
6,0
0 10 20 30 40 50 60 70 80 90
Bul
k m
odul
us
K
(GPa
)
Axial load angle to bedding α (°)
Hydrostatic stress = 16 MPa
4
8
12
16
20
0 10 20 30 40 50 60 70 80 90
Elas
tic s
tiffn
ess
C
(GPa
)
Axial load angle to bedding α (°)
Axial stress = 5 MPa
0,6
1,0
1,4
1,8
0 10 20 30 40 50 60 70 80 90
Stra
in ra
tio
ε a/ ε
r(-)
Axial load angle to bedding α (°)
Axial stress = 5 MPa
18
20
22
24
26
28
0 10 20 30 40 50 60 70 80 90
Peak
str
engt
h
s F(G
Pa)
Axial load angle to bedding α (°)
Axial stress = 5 MPa
-0,7
-0,6
-0,5
-0,4
-0,3
0 10 20 30 40 50 60 70 80 90
Axia
l fai
lure
str
ain
εa-
f(%
)
Axial load angle to bedding α (°)
Axial stress = 5 MPa

98
E.4 TEM – triaxial extension tests at constant mean stress
Tab. E.4 Characteristic parameters determined from the TM extension tests
Basic properties of the samples before testing
sample D/L angle to bedding
grain density
bulk density
dry density
initial porosity
water content
water saturation
ID (mm) α (°) (g/cm3) (g/cm3) (g/cm3) (%) (%) (%) EST49015 50/100 0 2,680 2,405 2,246 16,18 6,6 91,6 EST49020 50/100 0 2,700 2,430 2,260 16,30 7,0 97,1 EST48984 50/100 30 2,702 2,420 2,234 17,32 7,7 99,2 EST48975 50/100 30 2,690 2,420 2,260 15,97 6,6 93,4 EST48976 50/100 30 2,690 2,430 2,260 15,99 7,0 98,9 EST49053 50/100 45 2,680 2,420 2,243 16,29 7,3 100,5 EST49074 50/100 60 2,691 2,417 2,236 16,92 7,5 99,1 EST49095 50/100 90 2,680 2,400 2,222 17,10 7,4 96,5 EST49113 50/100 90 mean value 2,689 2,418 2,245 16,51 7,14 97,0 standard deviation 0,008 0,010 0,013 0,492 0,381 2,907
Hydrostatic pre-compaction up to 16 MPa
sample angle to bedding
max. mean stress
max. axial strain
max. radial strain
max. vol-ume strain
bulk modulus
ID α (°) sm (MPa) εa-m (%) εr-m (%) εv-m (%) K (GPa) EST49015 0 16 0,44 0,35 1,14 6,87 EST49020 0 16 0,35 0,19 0,73 6,28 EST48984 30 16 0,50 0,16 0,81 6,44 EST48975 30 16 0,47 0,28 1,01 6,86 EST48976 30 16 0,31 0,18 0,65 6,54 EST49053 45 16 0,34 0,16 0,66 6,82 EST49074 60 16 1,13 0,22 1,56 6,26 EST49095 90 16 1,06 0,16 1,37 6,11 EST49113 90 16 0,45 0,16 0,76 5,76
mean value 0,56 0,21 0,97 6,44 standard deviation 0,292 0,063 0,311 0,356
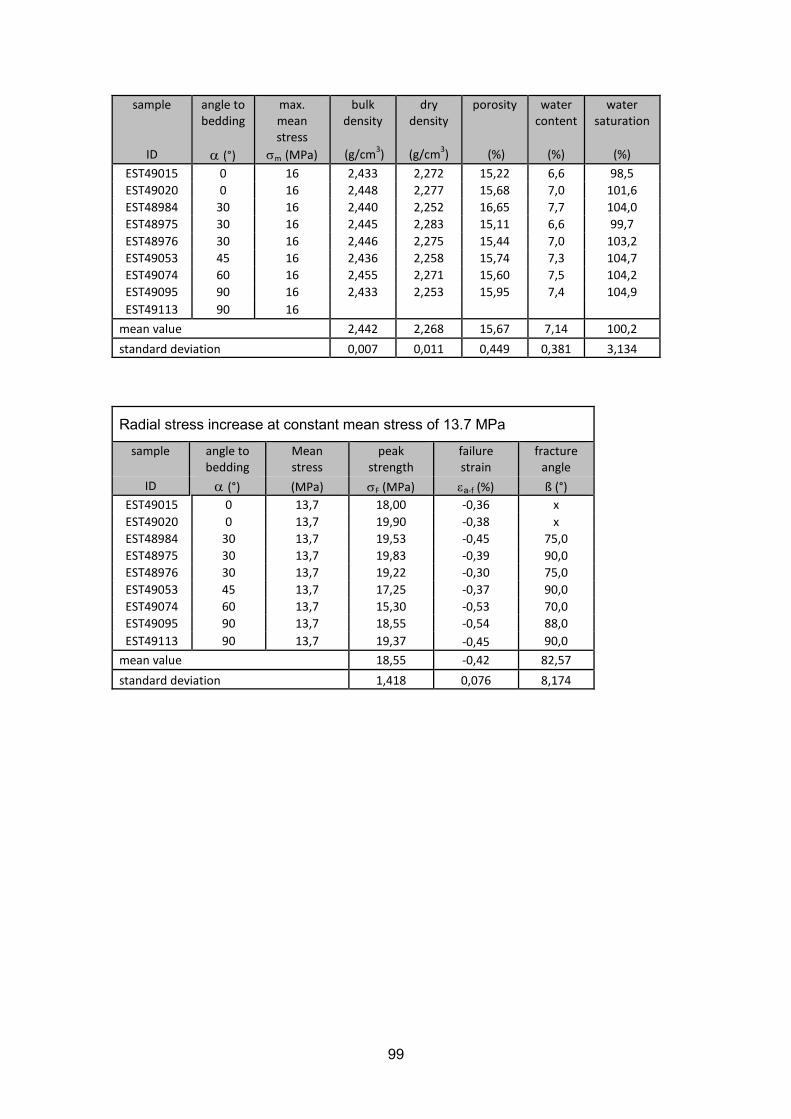
99
sample angle to bedding
max. mean stress
bulk density
dry density
porosity water content
water saturation
ID α (°) sm (MPa) (g/cm3) (g/cm3) (%) (%) (%) EST49015 0 16 2,433 2,272 15,22 6,6 98,5 EST49020 0 16 2,448 2,277 15,68 7,0 101,6 EST48984 30 16 2,440 2,252 16,65 7,7 104,0 EST48975 30 16 2,445 2,283 15,11 6,6 99,7 EST48976 30 16 2,446 2,275 15,44 7,0 103,2 EST49053 45 16 2,436 2,258 15,74 7,3 104,7 EST49074 60 16 2,455 2,271 15,60 7,5 104,2 EST49095 90 16 2,433 2,253 15,95 7,4 104,9 EST49113 90 16
mean value 2,442 2,268 15,67 7,14 100,2 standard deviation 0,007 0,011 0,449 0,381 3,134
Radial stress increase at constant mean stress of 13.7 MPa
sample angle to bedding
Mean stress
peak strength
failure strain
fracture angle
ID α (°) (MPa) sF (MPa) εa-f (%) ß (°) EST49015 0 13,7 18,00 -0,36 x EST49020 0 13,7 19,90 -0,38 x EST48984 30 13,7 19,53 -0,45 75,0 EST48975 30 13,7 19,83 -0,39 90,0 EST48976 30 13,7 19,22 -0,30 75,0 EST49053 45 13,7 17,25 -0,37 90,0 EST49074 60 13,7 15,30 -0,53 70,0 EST49095 90 13,7 18,55 -0,54 88,0 EST49113 90 13,7 19,37 -0,45 90,0
mean value 18,55 -0,42 82,57 standard deviation 1,418 0,076 8,174
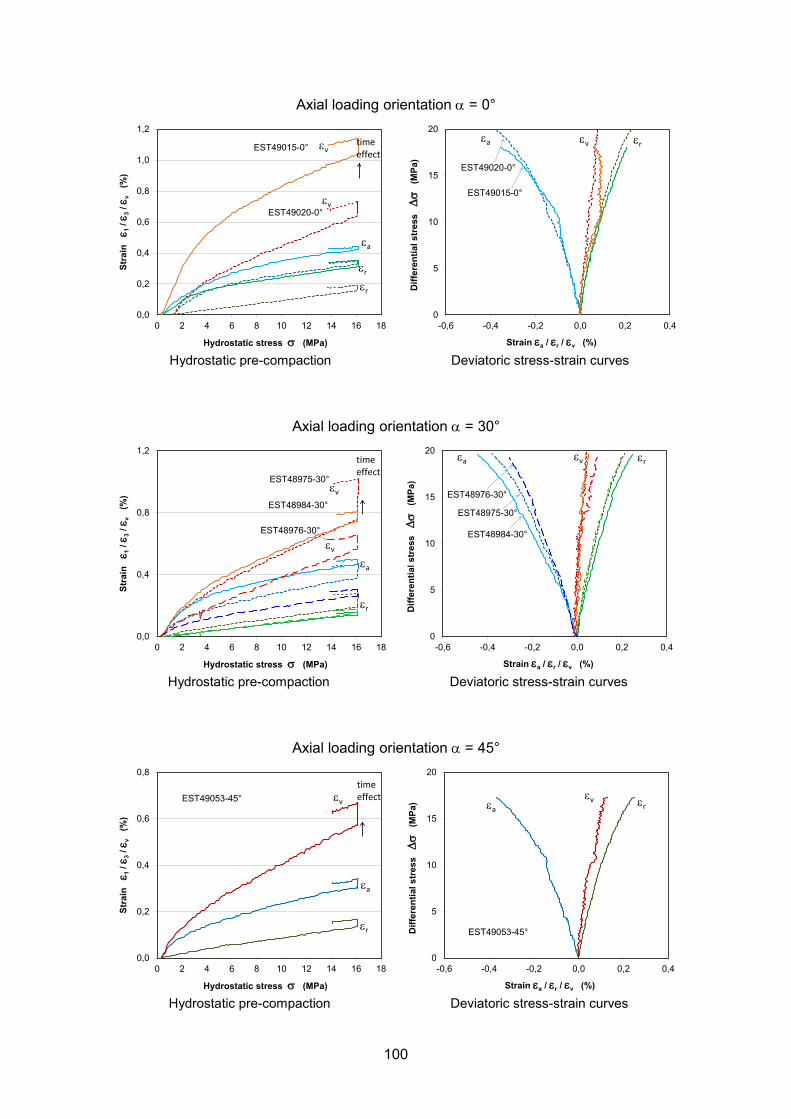
100
Axial loading orientation α = 0°
Hydrostatic pre-compaction
Deviatoric stress-strain curves
Axial loading orientation α = 30°
Hydrostatic pre-compaction
Deviatoric stress-strain curves
Axial loading orientation α = 45°
Hydrostatic pre-compaction
Deviatoric stress-strain curves
0,0
0,2
0,4
0,6
0,8
1,0
1,2
0 2 4 6 8 10 12 14 16 18
Stra
in
ε 1/ ε
3/ ε
v(%
)
Hydrostatic stress s (MPa)
εr
εvtimeeffect
εa
EST49020-0°
EST49015-0°
εv
εr
0
5
10
15
20
-0,6 -0,4 -0,2 0,0 0,2 0,4
Diff
eren
tial s
tres
s ∆
s(M
Pa)
Strain εa / εr / εv (%)
εrεa εv
EST49020-0°
EST49015-0°
0,0
0,4
0,8
1,2
0 2 4 6 8 10 12 14 16 18
Stra
in
ε 1/ ε
3/ ε
v(%
)
Hydrostatic stress s (MPa)
εr
εv
timeeffect
εa
EST48975-30°
EST48984-30°
EST48976-30°
εv
0
5
10
15
20
-0,6 -0,4 -0,2 0,0 0,2 0,4
Diff
eren
tial s
tres
s ∆
s(M
Pa)
Strain εa / εr / εv (%)
εrεa εv
EST48975-30°
EST48984-30°
EST48976-30°
0,0
0,2
0,4
0,6
0,8
0 2 4 6 8 10 12 14 16 18
Stra
in
ε 1/ ε
3/ ε
v(%
)
Hydrostatic stress s (MPa)
εr
εv
timeeffect
εa
EST49053-45°
0
5
10
15
20
-0,6 -0,4 -0,2 0,0 0,2 0,4
Diff
eren
tial s
tres
s ∆
s(M
Pa)
Strain εa / εr / εv (%)
εrεaεv
EST49053-45°
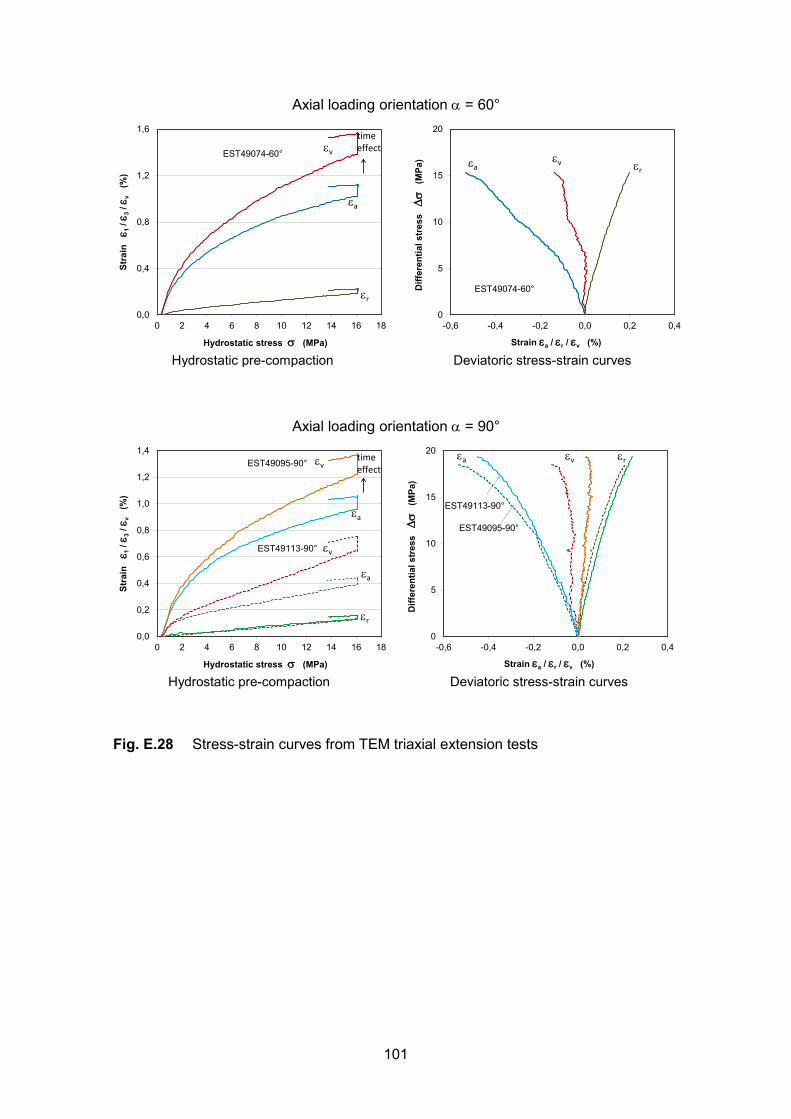
101
Axial loading orientation α = 60°
Hydrostatic pre-compaction
Deviatoric stress-strain curves
Axial loading orientation α = 90°
Hydrostatic pre-compaction
Deviatoric stress-strain curves
Fig. E.28 Stress-strain curves from TEM triaxial extension tests
0,0
0,4
0,8
1,2
1,6
0 2 4 6 8 10 12 14 16 18
Stra
in
ε 1/ ε
3/ ε
v(%
)
Hydrostatic stress s (MPa)
εr
εv
timeeffect
εa
EST49074-60°
0
5
10
15
20
-0,6 -0,4 -0,2 0,0 0,2 0,4
Diff
eren
tial s
tres
s ∆
s(M
Pa)
Strain εa / εr / εv (%)
εrεa
εv
EST49074-60°
0,0
0,2
0,4
0,6
0,8
1,0
1,2
1,4
0 2 4 6 8 10 12 14 16 18
Stra
in
ε 1/ ε
3/ ε
v(%
)
Hydrostatic stress s (MPa)
εr
εvtimeeffect
εa
EST49095-90°
εa
EST49113-90° εv
0
5
10
15
20
-0,6 -0,4 -0,2 0,0 0,2 0,4
Diff
eren
tial s
tres
s ∆
s(M
Pa)
Strain εa / εr / εv (%)
εrεa εv
EST49095-90°
EST49113-90°

102
Compressive strains at s = 16 MPa
Bulk modulus
Fig. E.29 Parameters obtained from the TEM hydrostatic pre-compaction
Peak strength
Axial failure strain
Fig. E.30 Parameters obtained from the TEM triaxial extension
0,0
0,4
0,8
1,2
1,6
0 10 20 30 40 50 60 70 80 90
Com
pres
sive
str
ain
(%
)
Load angle to bedding α (°)
Hydrostatic stress = 16 MPa
εa
εr
εv
5,0
6,0
7,0
8,0
0 10 20 30 40 50 60 70 80 90
Bul
k m
odul
us
K
(GPa
)
Load angle to bedding α (°)
Hydrostatic stress = 16 MPa
14
16
18
20
22
0 10 20 30 40 50 60 70 80 90
Peak
str
engt
h
s F(G
Pa)
Load angle to bedding α (°)
Axial stress = 5 MPa
-0,6
-0,5
-0,4
-0,3
-0,2
0 10 20 30 40 50 60 70 80 90
Axia
l fai
lure
str
ain
εa-
f(%
)
Load angle to bedding α (°)
Axial stress = 5 MPa

103
E.5 TCC – triaxial creep tests at multistep stress states
Tab. E.5 Characteristic parameters determined from the TCC creep tests
Basic properties of the samples before testing
sample D/L angle to bedding
grain density
bulk density
dry density
initial po-rosity
water content
water saturation
ID (mm) α (°) (g/cm3) (g/cm3) (g/cm3) (%) (%) (%) EST49020 70/140 0 2,700 2,430 2,260 16,30 7,0 97,1 EST48983 70/140 30 2,700 2,410 2,236 17,17 7,2 93,8 EST48979 70/140 30 2,700 2,440 2,267 16,05 7,1 100,3 EST49061 70/140 45 2,690 2,430 2,253 16,26 7,3 101,1 EST49082 70/140 60 2,680 2,400 2,225 16,99 7,3 95,6 EST49106 70/140 90 2,680 2,410 2,234 16,64 7,3 98,0 mean value 2,692 2,420 2,246 16,57 7,20 97,7 standard deviation 0,009 0,014 0,015 0,404 0,115 2,537
Creep failure stress and strain
sample angle to bedding
radial stress
axial stress
creep failure stress
failure strain
ID α (°) (MPa) (MPa) sF (MPa) εa-f (%) EST49020 0 5 20,0 15,0 0,50 EST48983 30 5 x x x EST48979 30 5 22,0 17,0 0,50 EST49061 45 5 22,0 17,0 0,55 EST49082 60 5 22,0 17,0 0,51 EST49106 90 5 22,0 17,0 0,50

104
Group 1 with two samples with axial loading angle α = 0° and 30°
Group 2 with two samples with axial loading angle α = 30° and 45°
0
5
10
15
20
25
0,0
0,2
0,4
0,6
0,8
1,0
0 10 20 30 40 50
Stre
ss (
MPa
)
Axia
l str
ain
(%
)
Time (day)
EST49020-0°EST48983-30°
sr = 5 MPa
sa = sr = 16 MPa
sa = 20 MPa
rupture
T = 24.5±0.2 °C
0
5
10
15
20
25
0,0
0,2
0,4
0,6
0,8
1,0
0 10 20 30 40 50 60 70
Stre
ss (
MPa
)
Axia
l str
ain
(%
)
Time (day)
EST49061-45° EST48979-30°
sr = 5 MPa
sa= sr = 16 MPa
sa = 20 MPa
sa = 22 MPa
rupture
T = 24.5±0.2 °C

105
Group 3 with two samples with axial loading angle α = 60° and 90°
Fig. E.31 Creep curves obtained under constant triaxial stress conditions
0
5
10
15
20
25
0,0
0,2
0,4
0,6
0,8
1,0
0 10 20 30 40 50 60
Stre
ss (
MPa
)
Axia
l str
ain
(%
)
Time (day)
EST49082-60° EST49106-90°
sr = 5 MPa
sa= sr = 16 MPa
sa = 20 MPa sa = 22 MPa
rupture
T = 24.5±0.2 °C
Schwertnergasse 150667 KölnTelefon +49 221 2068-0 Telefax +49 221 2068-888
Forschungszentrum85748 Garching b.MünchenTelefon +49 89 32004-0Telefax +49 89 32004-300
Kurfürstendamm 20010719 Berlin Telefon +49 30 88589-0Telefax +49 30 88589-111
Theodor-Heuss-Straße 438122 BraunschweigTelefon +49 531 8012-0 Telefax +49 531 8012-200
www.grs.de
Gesellschaft für Anlagen- und Reaktorsicherheit(GRS) gGmbH
ISBN 978-3-944161-41-9
French Agence Nationale Pour la Gestion des Déchets Radioactifs (ANDRA)1/7, rue Jean Monnet Parc de la Croix-Blanche 92298 Châtenay-Malabry cedexFRANCE
www.andra.fr


![Empirical relations of rock properties of outcrop and core ... · The bulk density, ρd [gcm−3], was determined from dry cylindrical specimens with a GeoPyc 1360 ... (ISRM, 2007).](https://static.fdocuments.net/doc/165x107/5ad4efa87f8b9a5d058c8265/empirical-relations-of-rock-properties-of-outcrop-and-core-bulk-density-d.jpg)