Investigation of UH-60A Rotor Structural Loads From Flight and … · Investigation of UH-60A Rotor...
21
Investigation of UH-60A Rotor Structural Loads From Flight and Wind Tunnel Tests Hyeonsoo Yeo Mark Potsdam US Army Aviation Development Directorate Aviation & Missile Research, Development & Engineering Center Research, Development, and Engineering Command Ames Research Center, Moffett Field, California Thomas R. Norman National Aeronautics and Space Administration Ames Research Center, Moffett Field, California ABSTRACT NASA/Army UH-60A Airloads Program flight test and full-scale UH-60A Airloads wind tunnel test data are investi- gated in order to better understand and predict the chord bending moments, one of the unresolved issues in the UH-60A rotor loads prediction. Coupled Helios/RCAS analysis is performed and the calculated rotor loads are compared with the test data. RCAS alone analysis is also performed by applying measured airloads from the tests as prescribed exter- nal loads. Effects of the lag damper model are examined by calculating lag damper loads using a nonlinear lag damper model or by applying measured lag damper loads as prescribed external loads. Both airloads and damper loads are important for the accurate prediction of chord bending moments. The calculated chord bending moments with the prescribed measured airloads and measured damper loads show the best correlation with the wind tunnel test data. In particular, the 4 and 5/rev harmonic correlation is excellent. The effects of drive train dynamics and hub impedance on the chord bending moments appear to be very small for the wind tunnel test. Those effects may still be important for the flight test vehicle, although they might be smaller than what was suggested in previous studies. NOTATION A rotor disk area a speed of sound C CBM chord bending moment coefficient, M CB /ρ (ΩR) 2 AR C FBM flap bending moment coefficient, M FB /ρ (ΩR) 2 AR C Mx hub rolling moment coefficient, M x /ρ (ΩR) 2 AR C My hub pitching moment coefficient, M y /ρ (ΩR) 2 AR C TM torsion moment coefficient, M T /ρ (ΩR) 2 AR C T rotor thrust coefficient, T /ρ (ΩR) 2 A c blade chord l section lift per unit length M 2 c l section lift coefficient, l / 1 2 ρ a 2 c M 2 c m section pitching moment coefficient, m/ 1 2 ρ a 2 c 2 M CB blade chord bending moment M FB blade flap bending moment M T blade torsion moment M tip hover tip Mach number M x hub rolling moment Presented at the AHS 72nd Annual Forum, West Palm Beach, FL, May 17–19, 2016. This is a work of the U.S. Government and is not subject to copyright protection in the U.S. DIS- TRIBUTION STATEMENT A. Approved for public release; distribution is unlimited. M y hub pitching moment m section pitching moment per unit length R rotor radius T rotor thrust α c corrected shaft angle, positive backward tilt μ advance ratio ρ freestream density σ rotor solidity Ω rotor angular velocity INTRODUCTION Rotorcraft aeromechanics prediction capability using cou- pled computational fluid dynamics (CFD) / rotorcraft com- prehensive analysis (CA) has advanced significantly in recent years (Refs. 1–7). For the loads analysis of a UH-60A rotor, three challenging level flight conditions (high speed C8534, low speed C8513, and high thrust C9017) of the NASA/Army UH-60A Airloads Program flight test data (Ref. 8) have been extensively studied using various combinations of CFD/CA tools (Refs. 1, 9–13). Figure 1 shows the UH-60A Airloads aircraft in flight. All the coupled analyses, in general, show satisfactory airloads correlation with the test data. However, 1
Transcript of Investigation of UH-60A Rotor Structural Loads From Flight and … · Investigation of UH-60A Rotor...
Investigation of UH-60A Rotor Structural Loads From Flightand Wind Tunnel Tests
Hyeonsoo Yeo Mark PotsdamUS Army Aviation Development Directorate
Aviation & Missile Research, Development & Engineering CenterResearch, Development, and Engineering Command
Ames Research Center, Moffett Field, California
Thomas R. NormanNational Aeronautics and Space AdministrationAmes Research Center, Moffett Field, California
ABSTRACTNASA/Army UH-60A Airloads Program flight test and full-scale UH-60A Airloads wind tunnel test data are investi-gated in order to better understand and predict the chord bending moments, one of the unresolved issues in the UH-60Arotor loads prediction. Coupled Helios/RCAS analysis is performed and the calculated rotor loads are compared withthe test data. RCAS alone analysis is also performed by applying measured airloads from the tests as prescribed exter-nal loads. Effects of the lag damper model are examined by calculating lag damper loads using a nonlinear lag dampermodel or by applying measured lag damper loads as prescribedexternal loads. Both airloads and damper loads areimportant for the accurate prediction of chord bending moments. The calculated chord bending moments with theprescribed measured airloads and measured damper loads show the best correlation with the wind tunnel test data. Inparticular, the 4 and 5/rev harmonic correlation is excellent. The effects of drive train dynamics and hub impedanceon the chord bending moments appear to be very small for the wind tunnel test. Those effects may still be importantfor the flight test vehicle, although they might be smaller than what was suggested in previous studies.
NOTATION
A rotor disk areaa speed of soundCCBM chord bending moment coefficient,MCB/ρ(ΩR)2ARCFBM flap bending moment coefficient,MFB/ρ(ΩR)2ARCMx hub rolling moment coefficient,Mx/ρ(ΩR)2ARCMy hub pitching moment coefficient,My/ρ(ΩR)2ARCT M torsion moment coefficient,MT /ρ(ΩR)2ARCT rotor thrust coefficient,T/ρ(ΩR)2Ac blade chordl section lift per unit lengthM2cl section lift coefficient,l/ 1
2ρa2cM2cm section pitching moment coefficient,m/ 1
2ρa2c2
MCB blade chord bending momentMFB blade flap bending momentMT blade torsion momentMtip hover tip Mach numberMx hub rolling moment
Presented at the AHS 72nd Annual Forum, West Palm Beach,FL, May 17–19, 2016. This is a work of the U.S. Governmentand is not subject to copyright protection in the U.S. DIS-TRIBUTION STATEMENT A. Approved for public release;distribution is unlimited.
My hub pitching momentm section pitching moment per unit lengthR rotor radiusT rotor thrustαc corrected shaft angle, positive backward tiltµ advance ratioρ freestream densityσ rotor solidityΩ rotor angular velocity
INTRODUCTION
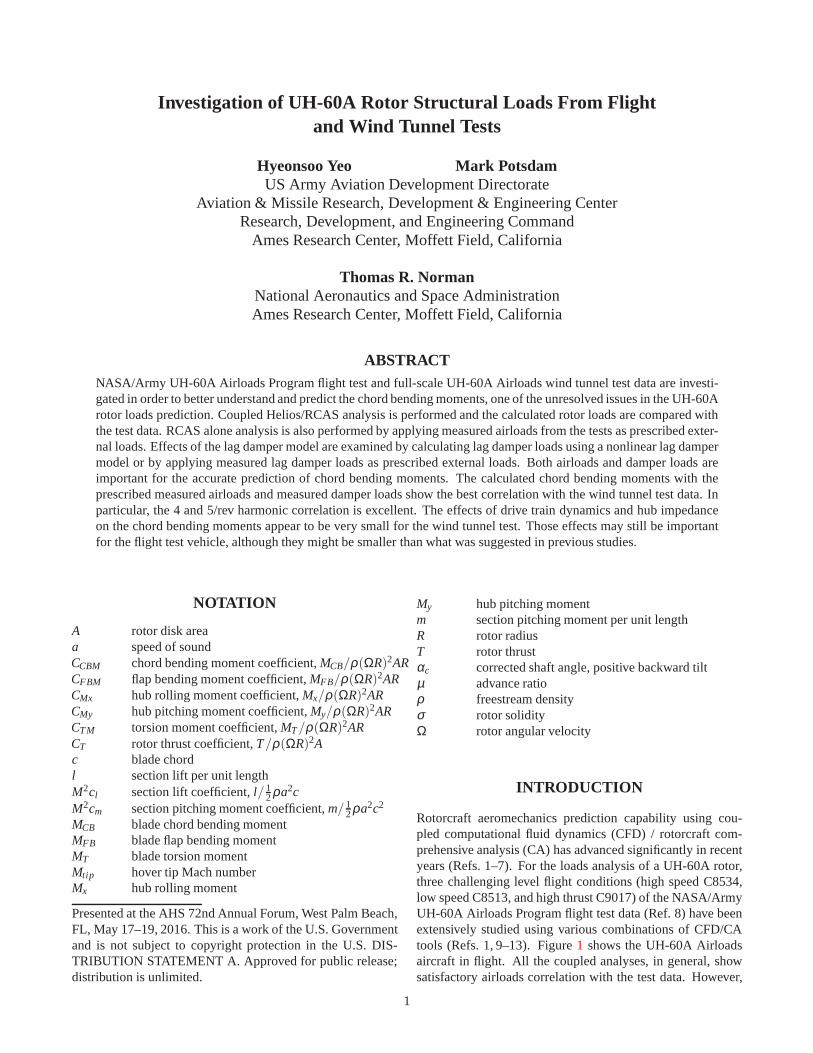
Rotorcraft aeromechanics prediction capability using cou-pled computational fluid dynamics (CFD) / rotorcraft com-prehensive analysis (CA) has advanced significantly in recentyears (Refs. 1–7). For the loads analysis of a UH-60A rotor,three challenging level flight conditions (high speed C8534,low speed C8513, and high thrust C9017) of the NASA/ArmyUH-60A Airloads Program flight test data (Ref. 8) have beenextensively studied using various combinations of CFD/CAtools (Refs. 1, 9–13). Figure1 shows the UH-60A Airloadsaircraft in flight. All the coupled analyses, in general, showsatisfactory airloads correlation with the test data. However,
1
the prediction of the structural loads did not show the samelevel of correlation. Although flap bending and torsion mo-ment correlation was reasonably good, chord bending mo-ment correlation was particularly poor. In Ref. 13, the cou-pled CFD/CA analyses significantly underpredicted peak-to-peak chord bending moments, especially 4/rev harmonic am-plitude. The effects of drive train dynamics were examinedusing a simple one degree-of-freedom shaft drive train model,which consists of polar mass moment of inertia, spring stiff-ness, and damping. Moment of inertia values were varied witha fixed stiffness value to simulate the high frequency drivetrain modes. The overall correlation in the half peak-to-peakmagnitude and 4/rev harmonic component started to improvewith a smaller moment of inertia value. This result showedthat the dynamic coupling between the rotor and the drivetrain is likely a key contributor for the improvement of chordbending moment correlation. However, due to the limitationsof the simple drive train model used in the parametric varia-tions, this study also suggested that a more complex drive trainmodel, which can capture higher frequency modes, should bedeveloped and incorporated into the analysis.
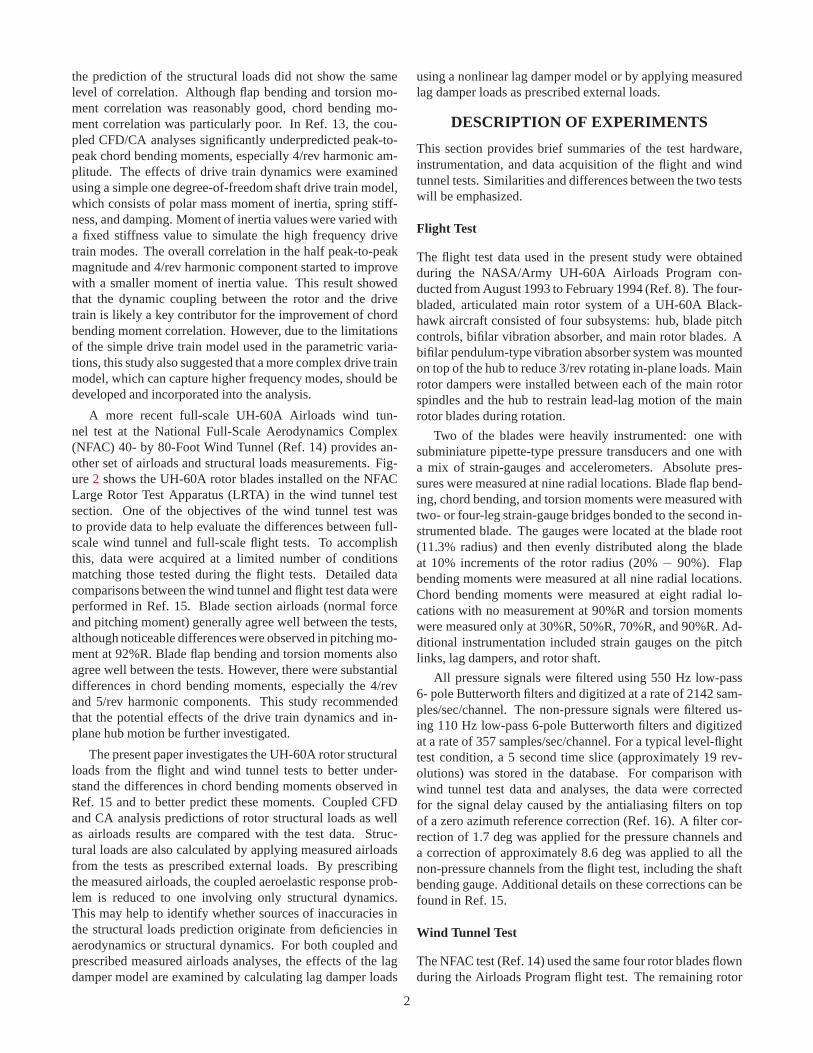
A more recent full-scale UH-60A Airloads wind tun-nel test at the National Full-Scale Aerodynamics Complex(NFAC) 40- by 80-Foot Wind Tunnel (Ref. 14) provides an-other set of airloads and structural loads measurements. Fig-ure2 shows the UH-60A rotor blades installed on the NFACLarge Rotor Test Apparatus (LRTA) in the wind tunnel testsection. One of the objectives of the wind tunnel test wasto provide data to help evaluate the differences between full-scale wind tunnel and full-scale flight tests. To accomplishthis, data were acquired at a limited number of conditionsmatching those tested during the flight tests. Detailed datacomparisons between the wind tunnel and flight test data wereperformed in Ref. 15. Blade section airloads (normal forceand pitching moment) generally agree well between the tests,although noticeable differences were observed in pitchingmo-ment at 92%R. Blade flap bending and torsion moments alsoagree well between the tests. However, there were substantialdifferences in chord bending moments, especially the 4/revand 5/rev harmonic components. This study recommendedthat the potential effects of the drive train dynamics and in-plane hub motion be further investigated.
The present paper investigates the UH-60A rotor structuralloads from the flight and wind tunnel tests to better under-stand the differences in chord bending moments observed inRef. 15 and to better predict these moments. Coupled CFDand CA analysis predictions of rotor structural loads as wellas airloads results are compared with the test data. Struc-tural loads are also calculated by applying measured airloadsfrom the tests as prescribed external loads. By prescribingthe measured airloads, the coupled aeroelastic response prob-lem is reduced to one involving only structural dynamics.This may help to identify whether sources of inaccuracies inthe structural loads prediction originate from deficiencies inaerodynamics or structural dynamics. For both coupled andprescribed measured airloads analyses, the effects of the lagdamper model are examined by calculating lag damper loads
using a nonlinear lag damper model or by applying measuredlag damper loads as prescribed external loads.
DESCRIPTION OF EXPERIMENTS
This section provides brief summaries of the test hardware,instrumentation, and data acquisition of the flight and windtunnel tests. Similarities and differences between the twotestswill be emphasized.
Flight Test
The flight test data used in the present study were obtainedduring the NASA/Army UH-60A Airloads Program con-ducted from August 1993 to February 1994 (Ref. 8). The four-bladed, articulated main rotor system of a UH-60A Black-hawk aircraft consisted of four subsystems: hub, blade pitchcontrols, bifilar vibration absorber, and main rotor blades. Abifilar pendulum-type vibration absorber system was mountedon top of the hub to reduce 3/rev rotating in-plane loads. Mainrotor dampers were installed between each of the main rotorspindles and the hub to restrain lead-lag motion of the mainrotor blades during rotation.
Two of the blades were heavily instrumented: one withsubminiature pipette-type pressure transducers and one witha mix of strain-gauges and accelerometers. Absolute pres-sures were measured at nine radial locations. Blade flap bend-ing, chord bending, and torsion moments were measured withtwo- or four-leg strain-gauge bridges bonded to the second in-strumented blade. The gauges were located at the blade root(11.3% radius) and then evenly distributed along the bladeat 10% increments of the rotor radius (20%− 90%). Flapbending moments were measured at all nine radial locations.Chord bending moments were measured at eight radial lo-cations with no measurement at 90%R and torsion momentswere measured only at 30%R, 50%R, 70%R, and 90%R. Ad-ditional instrumentation included strain gauges on the pitchlinks, lag dampers, and rotor shaft.
All pressure signals were filtered using 550 Hz low-pass6- pole Butterworth filters and digitized at a rate of 2142 sam-ples/sec/channel. The non-pressure signals were filtered us-ing 110 Hz low-pass 6-pole Butterworth filters and digitizedat a rate of 357 samples/sec/channel. For a typical level-flighttest condition, a 5 second time slice (approximately 19 rev-olutions) was stored in the database. For comparison withwind tunnel test data and analyses, the data were correctedfor the signal delay caused by the antialiasing filters on topof a zero azimuth reference correction (Ref. 16). A filter cor-rection of 1.7 deg was applied for the pressure channels anda correction of approximately 8.6 deg was applied to all thenon-pressure channels from the flight test, including the shaftbending gauge. Additional details on these corrections canbefound in Ref. 15.
Wind Tunnel Test
The NFAC test (Ref. 14) used the same four rotor blades flownduring the Airloads Program flight test. The remaining rotor
2
system hardware was predominantly UH-60A flight hardware(although not the same as used in flight), including spindles,hub, pitch links, and swashplate. For this test, the bifilar four-arm plate was installed but the pendulum weights were notattached (no 3/rev in-plane load absorption).
The rotor assembly was mounted on a large test stand withits own fixed system controls and rotor drive system (trans-mission, electric motors). The interface between the UH-60Arotor and test stand occurred at three locations: the UH-60Ashaft extender and test stand shaft, the swashplate guide andtransmission, and the non-rotating swashplate and the fixedsystem controls. The rotor and test stand were installed on athree-strut support system in the NFAC 40- by 80-Foot WindTunnel section as shown in Fig.2.
The rotor blade instrumentation was essentially identicaltothe flight test, with five additional blade torsion gages installedon the strain-gage blade. Equivalent pitch link, damper, andshaft bending gages were also installed. The test stand in-cluded a rotor balance and flex-coupling to provide directmeasurements of rotor hub forces/moments and shaft torque.Angle of attack was measured based on model rotation andairspeed based on calibration of wind tunnel wall pressures.
All pressure signals were filtered using 2000 Hz low-passfilters and digitized at a rate of 2048 samples/rev/channel.Thenon-pressure signals were filtered using 400 Hz filters anddigitized at a rate of 256 samples/rev/channel. Correctionsfor the time delay caused by the anti-aliasing filters were in-corporated in the data reduction process. A typical NFAC testpoint consisted of 128 revolutions of data.
The major differences between the flight and wind tunneltest mechanical system configurations can be categorized asdifferences in the drive train dynamics, impedance of the huband control system, and effects of the bifilar absorber on thehub. In terms of aerodynamic condition, the differences arethe aerodynamic inflow field caused by fuselage and LRTAfaired body and wall effects of the wind tunnel.
Matched Conditions
During the wind tunnel test, data were acquired at three con-ditions matching those tested during the Airloads Program.This section describes the specific trim and flight parametersthat were matched during the wind tunnel test and similaritiesand differences in the measured loads between the two tests.
During the wind tunnel test, specific non-dimensionalflight parameters and trim targets were matched. The trimtargets were rotor thrust (CT /σ ) and hub rolling and pitch-ing moments (CMx/σ andCMy/σ ) derived from the rotatingshaft bending gage. The flight operating conditions were tipMach number (Mtip), advance ratio (µ), and wind tunnel cor-rected rotor shaft angle (αc). There are uncertainties in theparameters for this matching process. Of these parameters,the one with the highest uncertainty from the flight test wasrotor thrust. The parameter with the highest uncertainty whenset in the wind tunnel was the corrected rotor shaft angle. Be-cause there was no direct measure of rotor thrust in flight, it
was estimated from known quantities. The main rotor lift (i.e.cosine component of the main rotor thrust) is estimated bysubtracting fuselage lift, stabilator lift, and canted tail rotorlift from gross weight (Refs. 13, 17). When testing in a windtunnel, the wind tunnel walls alter the streamlines around themodel and change the loads and effective angle of attack onthe model. A wind tunnel wall correction, in the form of aninduced angle correction, was used to estimate the change inangle of attack of the model due to the tunnel walls (Ref. 18).To account for these and other uncertainties in the trim andoperating conditions, the wind tunnel test obtained the base-line data by matching the estimated flight conditions and thenacquired additional data for derivative points around thisbase-line. These derivatives included changes in thrust, hub mo-ments (pitching and rolling), and shaft angle.
Three flight test points were simulated during the windtunnel testing and the trim and operating conditions for thesematched data sets are provided in Table1. During post-testanalysis of the data, it was found that some of the originalflight trim targets had been incorrectly specified. That is whythe rotor hub moments do not exactly match the trim targets.Nevertheless, the trim values remained relatively close and arewell within the trim range from the derivative points. The ef-fects of these trim differences are small for the airloads andstructural loads data which are used in this paper.
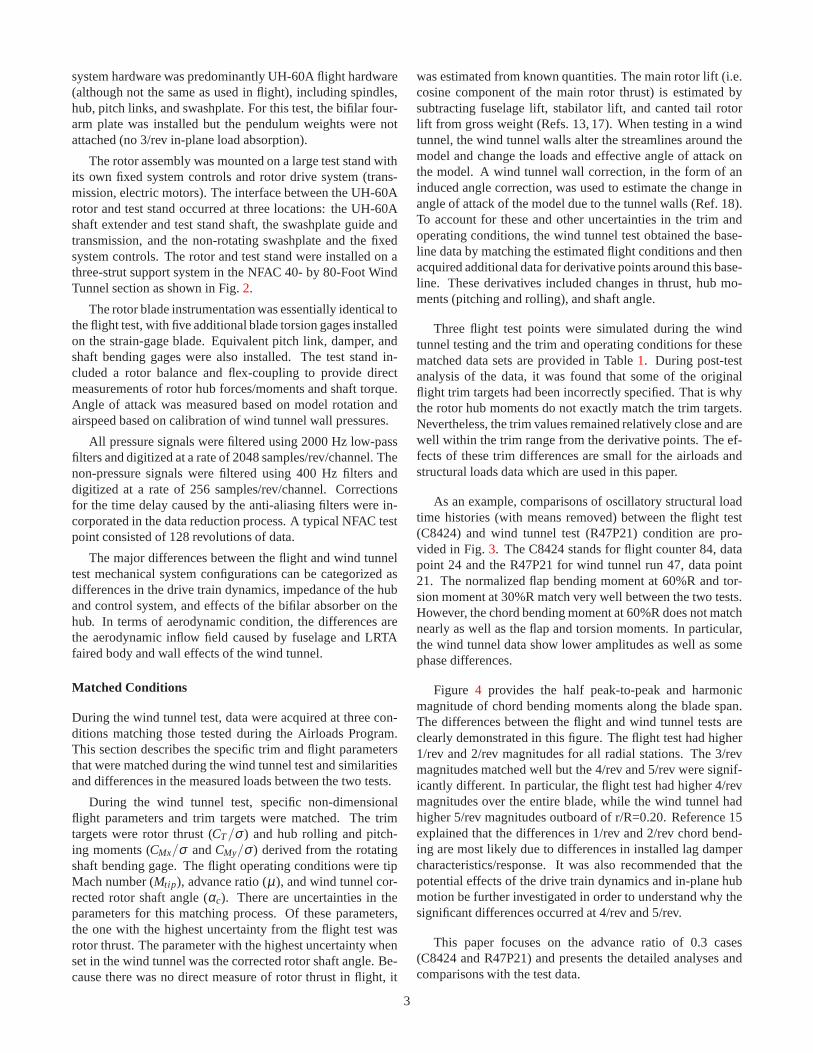
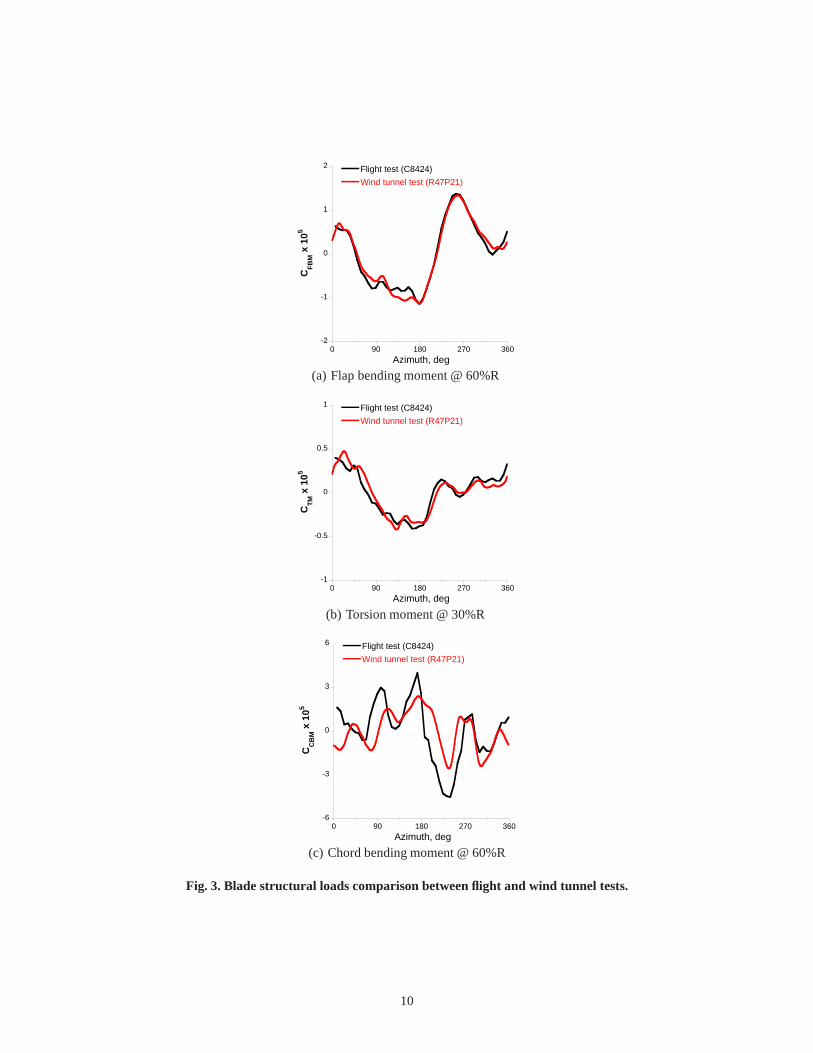
As an example, comparisons of oscillatory structural loadtime histories (with means removed) between the flight test(C8424) and wind tunnel test (R47P21) condition are pro-vided in Fig.3. The C8424 stands for flight counter 84, datapoint 24 and the R47P21 for wind tunnel run 47, data point21. The normalized flap bending moment at 60%R and tor-sion moment at 30%R match very well between the two tests.However, the chord bending moment at 60%R does not matchnearly as well as the flap and torsion moments. In particular,the wind tunnel data show lower amplitudes as well as somephase differences.
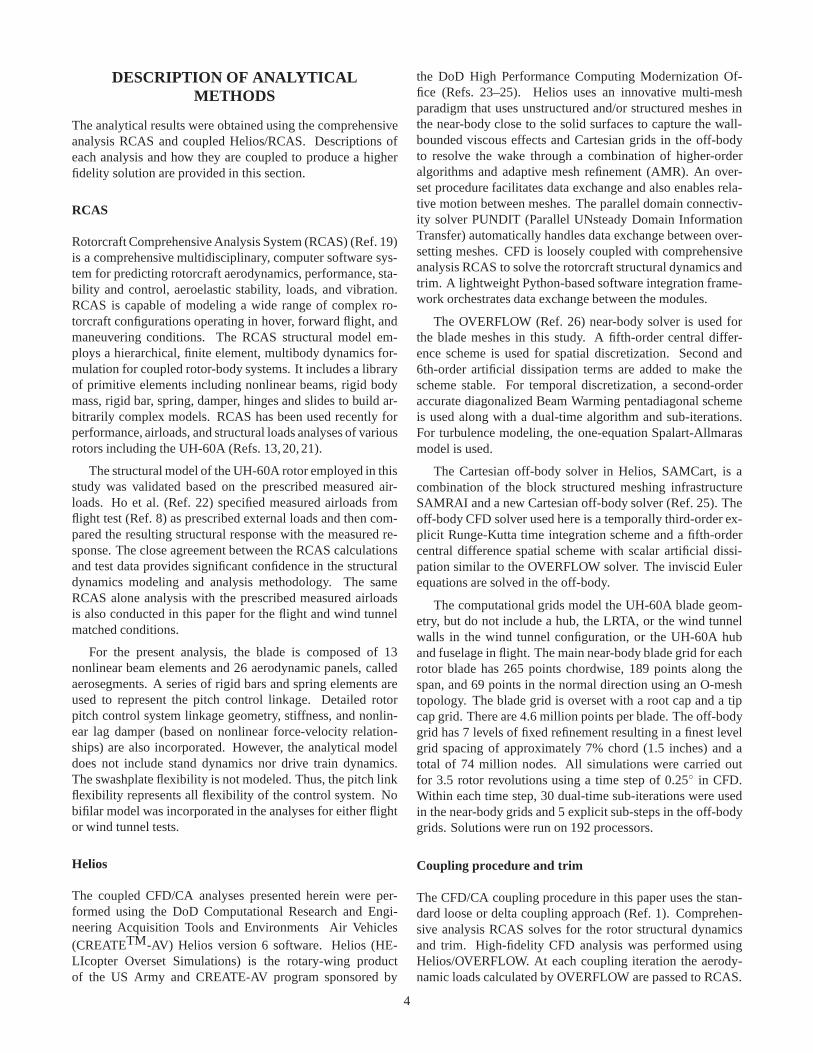
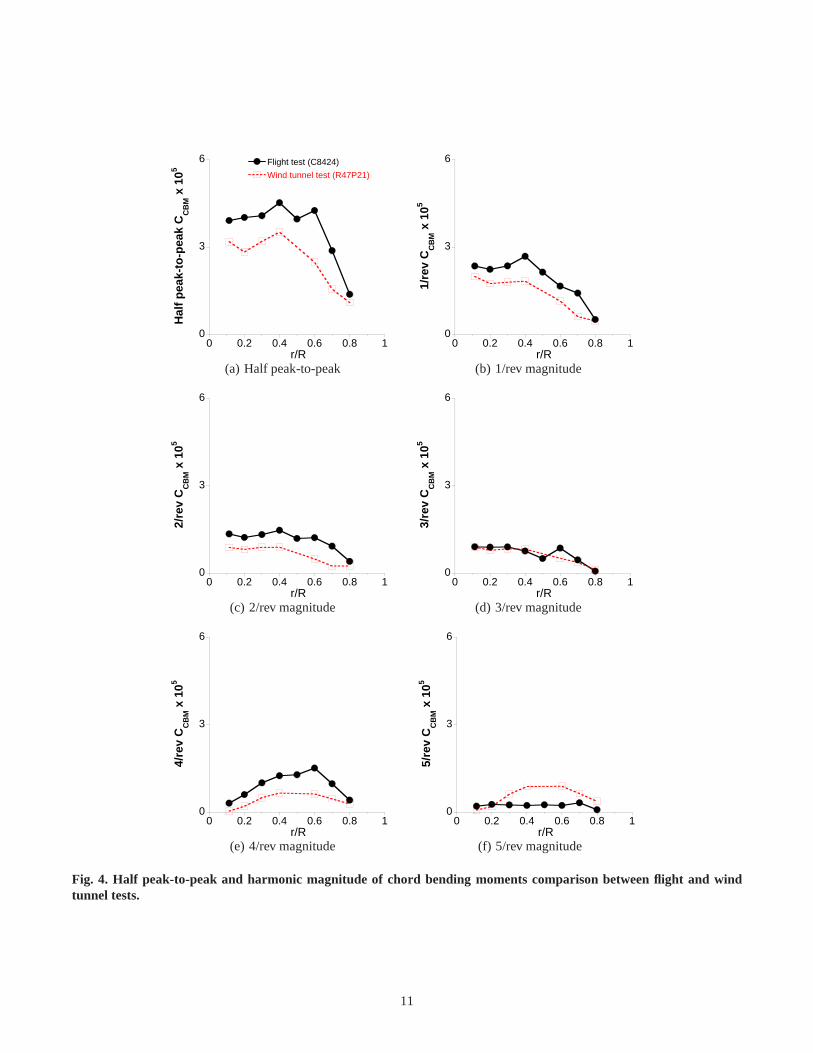
Figure 4 provides the half peak-to-peak and harmonicmagnitude of chord bending moments along the blade span.The differences between the flight and wind tunnel tests areclearly demonstrated in this figure. The flight test had higher1/rev and 2/rev magnitudes for all radial stations. The 3/revmagnitudes matched well but the 4/rev and 5/rev were signif-icantly different. In particular, the flight test had higher4/revmagnitudes over the entire blade, while the wind tunnel hadhigher 5/rev magnitudes outboard of r/R=0.20. Reference 15explained that the differences in 1/rev and 2/rev chord bend-ing are most likely due to differences in installed lag dampercharacteristics/response. It was also recommended that thepotential effects of the drive train dynamics and in-plane hubmotion be further investigated in order to understand why thesignificant differences occurred at 4/rev and 5/rev.
This paper focuses on the advance ratio of 0.3 cases(C8424 and R47P21) and presents the detailed analyses andcomparisons with the test data.
3
DESCRIPTION OF ANALYTICALMETHODS
The analytical results were obtained using the comprehensiveanalysis RCAS and coupled Helios/RCAS. Descriptions ofeach analysis and how they are coupled to produce a higherfidelity solution are provided in this section.
RCAS
Rotorcraft Comprehensive Analysis System (RCAS) (Ref. 19)is a comprehensive multidisciplinary, computer software sys-tem for predicting rotorcraft aerodynamics, performance,sta-bility and control, aeroelastic stability, loads, and vibration.RCAS is capable of modeling a wide range of complex ro-torcraft configurations operating in hover, forward flight,andmaneuvering conditions. The RCAS structural model em-ploys a hierarchical, finite element, multibody dynamics for-mulation for coupled rotor-body systems. It includes a libraryof primitive elements including nonlinear beams, rigid bodymass, rigid bar, spring, damper, hinges and slides to build ar-bitrarily complex models. RCAS has been used recently forperformance, airloads, and structural loads analyses of variousrotors including the UH-60A (Refs. 13,20,21).
The structural model of the UH-60A rotor employed in thisstudy was validated based on the prescribed measured air-loads. Ho et al. (Ref. 22) specified measured airloads fromflight test (Ref. 8) as prescribed external loads and then com-pared the resulting structural response with the measured re-sponse. The close agreement between the RCAS calculationsand test data provides significant confidence in the structuraldynamics modeling and analysis methodology. The sameRCAS alone analysis with the prescribed measured airloadsis also conducted in this paper for the flight and wind tunnelmatched conditions.
For the present analysis, the blade is composed of 13nonlinear beam elements and 26 aerodynamic panels, calledaerosegments. A series of rigid bars and spring elements areused to represent the pitch control linkage. Detailed rotorpitch control system linkage geometry, stiffness, and nonlin-ear lag damper (based on nonlinear force-velocity relation-ships) are also incorporated. However, the analytical modeldoes not include stand dynamics nor drive train dynamics.The swashplate flexibility is not modeled. Thus, the pitch linkflexibility represents all flexibility of the control system. Nobifilar model was incorporated in the analyses for either flightor wind tunnel tests.
Helios
The coupled CFD/CA analyses presented herein were per-formed using the DoD Computational Research and Engi-neering Acquisition Tools and Environments Air Vehicles(CREATETM-AV) Helios version 6 software. Helios (HE-LIcopter Overset Simulations) is the rotary-wing productof the US Army and CREATE-AV program sponsored by
the DoD High Performance Computing Modernization Of-fice (Refs. 23–25). Helios uses an innovative multi-meshparadigm that uses unstructured and/or structured meshes inthe near-body close to the solid surfaces to capture the wall-bounded viscous effects and Cartesian grids in the off-bodyto resolve the wake through a combination of higher-orderalgorithms and adaptive mesh refinement (AMR). An over-set procedure facilitates data exchange and also enables rela-tive motion between meshes. The parallel domain connectiv-ity solver PUNDIT (Parallel UNsteady Domain InformationTransfer) automatically handles data exchange between over-setting meshes. CFD is loosely coupled with comprehensiveanalysis RCAS to solve the rotorcraft structural dynamics andtrim. A lightweight Python-based software integration frame-work orchestrates data exchange between the modules.
The OVERFLOW (Ref. 26) near-body solver is used forthe blade meshes in this study. A fifth-order central differ-ence scheme is used for spatial discretization. Second and6th-order artificial dissipation terms are added to make thescheme stable. For temporal discretization, a second-orderaccurate diagonalized Beam Warming pentadiagonal schemeis used along with a dual-time algorithm and sub-iterations.For turbulence modeling, the one-equation Spalart-Allmarasmodel is used.
The Cartesian off-body solver in Helios, SAMCart, is acombination of the block structured meshing infrastructureSAMRAI and a new Cartesian off-body solver (Ref. 25). Theoff-body CFD solver used here is a temporally third-order ex-plicit Runge-Kutta time integration scheme and a fifth-ordercentral difference spatial scheme with scalar artificial dissi-pation similar to the OVERFLOW solver. The inviscid Eulerequations are solved in the off-body.
The computational grids model the UH-60A blade geom-etry, but do not include a hub, the LRTA, or the wind tunnelwalls in the wind tunnel configuration, or the UH-60A huband fuselage in flight. The main near-body blade grid for eachrotor blade has 265 points chordwise, 189 points along thespan, and 69 points in the normal direction using an O-meshtopology. The blade grid is overset with a root cap and a tipcap grid. There are 4.6 million points per blade. The off-bodygrid has 7 levels of fixed refinement resulting in a finest levelgrid spacing of approximately 7% chord (1.5 inches) and atotal of 74 million nodes. All simulations were carried outfor 3.5 rotor revolutions using a time step of 0.25 in CFD.Within each time step, 30 dual-time sub-iterations were usedin the near-body grids and 5 explicit sub-steps in the off-bodygrids. Solutions were run on 192 processors.
Coupling procedure and trim
The CFD/CA coupling procedure in this paper uses the stan-dard loose or delta coupling approach (Ref. 1). Comprehen-sive analysis RCAS solves for the rotor structural dynamicsand trim. High-fidelity CFD analysis was performed usingHelios/OVERFLOW. At each coupling iteration the aerody-namic loads calculated by OVERFLOW are passed to RCAS.
4
After trimming with the OVERFLOW airloads increment,RCAS computes the blade deflections relative to the bladeframe of reference and passes them back to OVERFLOW.The coupling between CFD and CA was done at every 90
rotor azimuth. The airloads and blade motions at consecutivecoupling CFD/CA iterations converged after 3.5 rotor revolu-tions. While an azimuthal step size of 0.25 (1440 steps perrotor revolution) was used in the Helios calculations, a 5.0
(72 steps per rotor revolution) azimuthal step size was usedforthe structural dynamic calculations in RCAS. The trim param-eters used in the predictions were the same as those from thetest, including non-dimensional rotor thrust, and hub rollingand pitching moments. In addition, rotor blade tip Mach num-ber, advance ratio, and shaft angle of attack were specified.
Prescribed measured airloads
Structural loads are also calculated by applying measured air-loads from the tests as prescribed external loads. By prescrib-ing the measured airloads, the coupled aeroelastic responseproblem is reduced to one involving only structural dynamics.This may help to identify whether sources of inaccuracies inthe structural loads prediction originate from deficiencies inaerodynamics or structural dynamics.
For the present analysis, measured blade section normalforce, chord force, and pitching moment are prescribed alongthe blade span to an isolated single-bladed rotor. Measuredairload data are available at nine radial locations, and so inter-polated airloads, by cell averaging, are prescribed at 26 radiallocations. The blade pitch controls are also prescribed. Themotion of the pitch control slide element in RCAS, which islocated at the base of the pushrod, is adjusted to match withthe measured collective and 1/rev cyclic angles at the pitchbearing. The azimuthal resolution of the analysis is 1.5 deg,which is same as the airloads resolution for the flight test.
RESULTS AND DISCUSSION
In this section, selected data from the flight (C8424) and windtunnel test (R47P21) are compared with predictions from bothcoupled Helios/RCAS analysis and RCAS analysis with pre-scribed measured airloads. For both analyses, the effects ofthe lag damper model are examined by calculating lag damperloads using a nonlinear lag damper model or by applying mea-sured lag damper loads as prescribed external loads.
Flight test condition, C8424
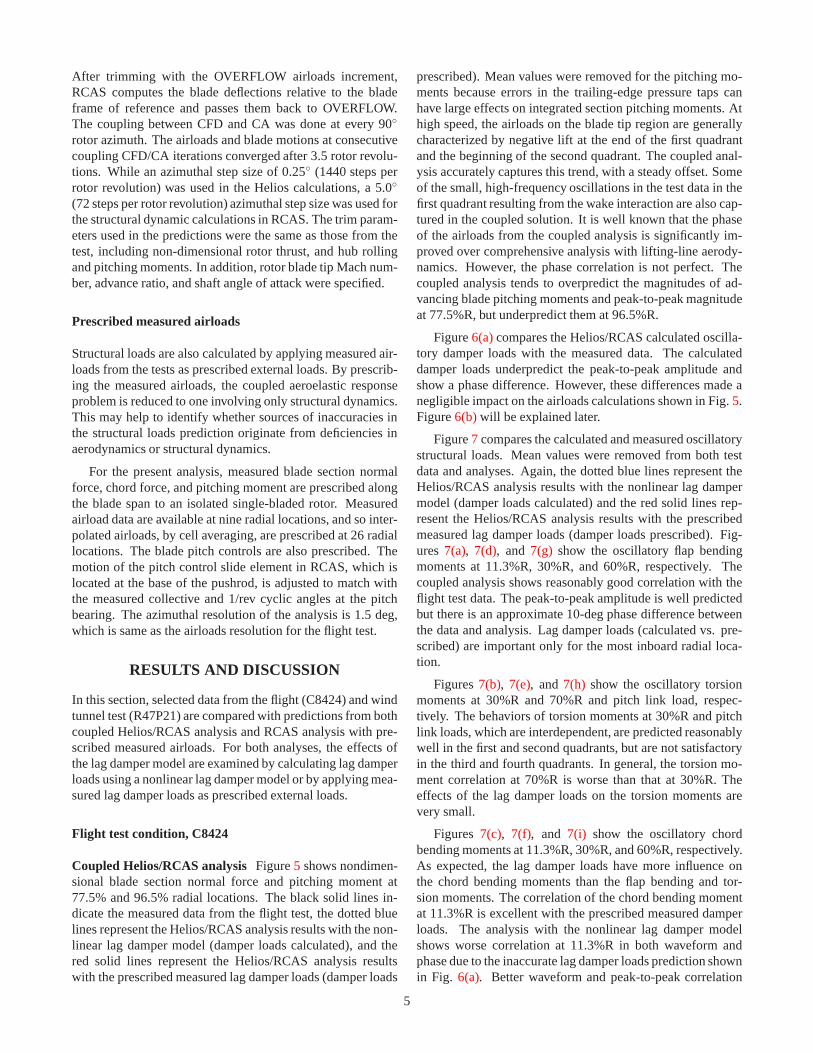
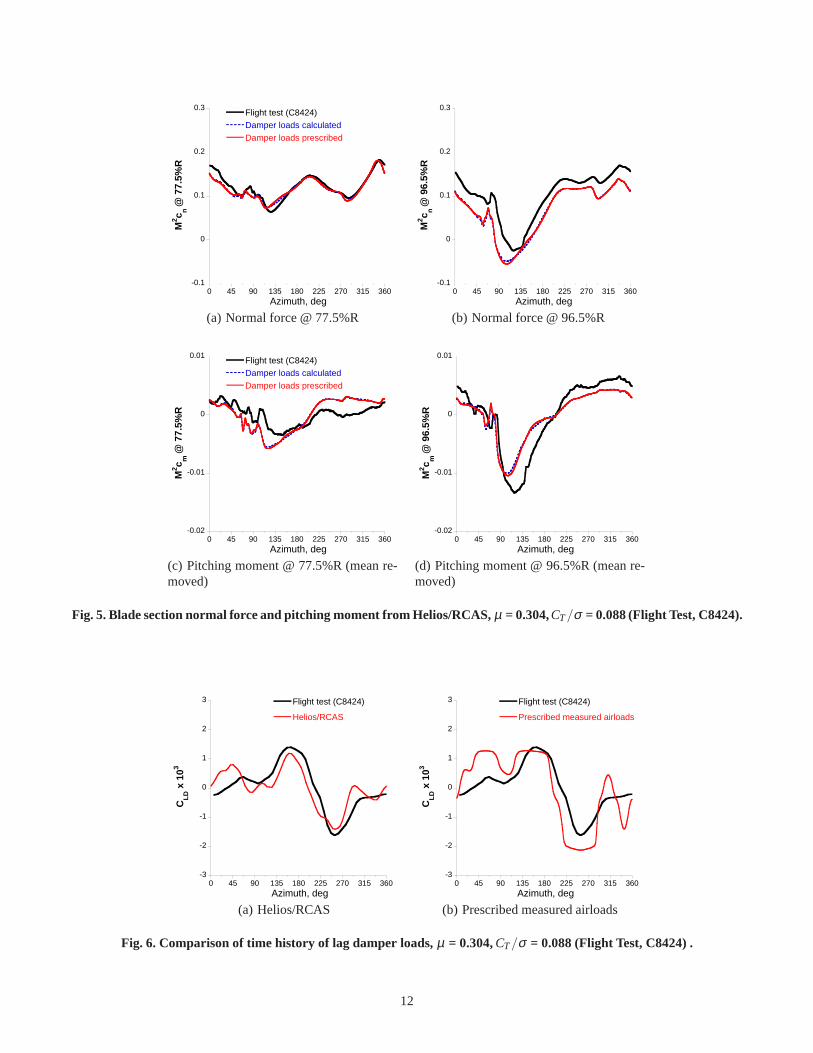
Coupled Helios/RCAS analysis Figure5 shows nondimen-sional blade section normal force and pitching moment at77.5% and 96.5% radial locations. The black solid lines in-dicate the measured data from the flight test, the dotted bluelines represent the Helios/RCAS analysis results with the non-linear lag damper model (damper loads calculated), and thered solid lines represent the Helios/RCAS analysis resultswith the prescribed measured lag damper loads (damper loads
prescribed). Mean values were removed for the pitching mo-ments because errors in the trailing-edge pressure taps canhave large effects on integrated section pitching moments.Athigh speed, the airloads on the blade tip region are generallycharacterized by negative lift at the end of the first quadrantand the beginning of the second quadrant. The coupled anal-ysis accurately captures this trend, with a steady offset. Someof the small, high-frequency oscillations in the test data in thefirst quadrant resulting from the wake interaction are also cap-tured in the coupled solution. It is well known that the phaseof the airloads from the coupled analysis is significantly im-proved over comprehensive analysis with lifting-line aerody-namics. However, the phase correlation is not perfect. Thecoupled analysis tends to overpredict the magnitudes of ad-vancing blade pitching moments and peak-to-peak magnitudeat 77.5%R, but underpredict them at 96.5%R.
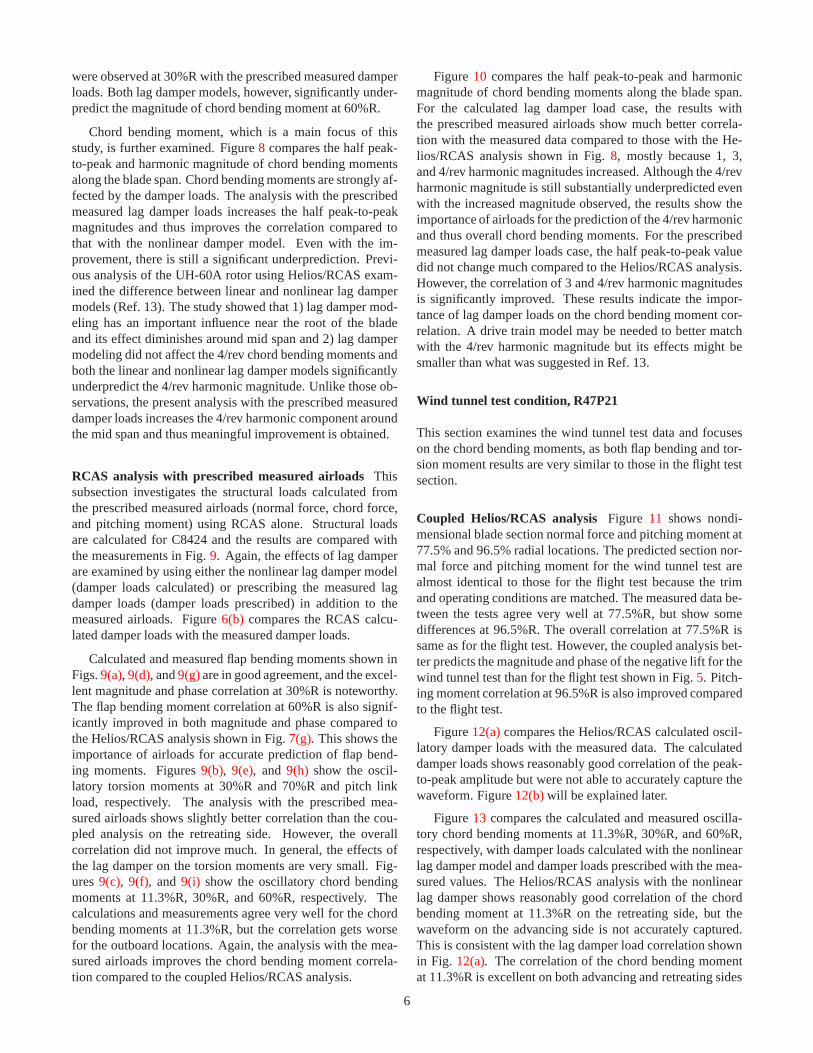
Figure6(a)compares the Helios/RCAS calculated oscilla-tory damper loads with the measured data. The calculateddamper loads underpredict the peak-to-peak amplitude andshow a phase difference. However, these differences made anegligible impact on the airloads calculations shown in Fig. 5.Figure6(b)will be explained later.
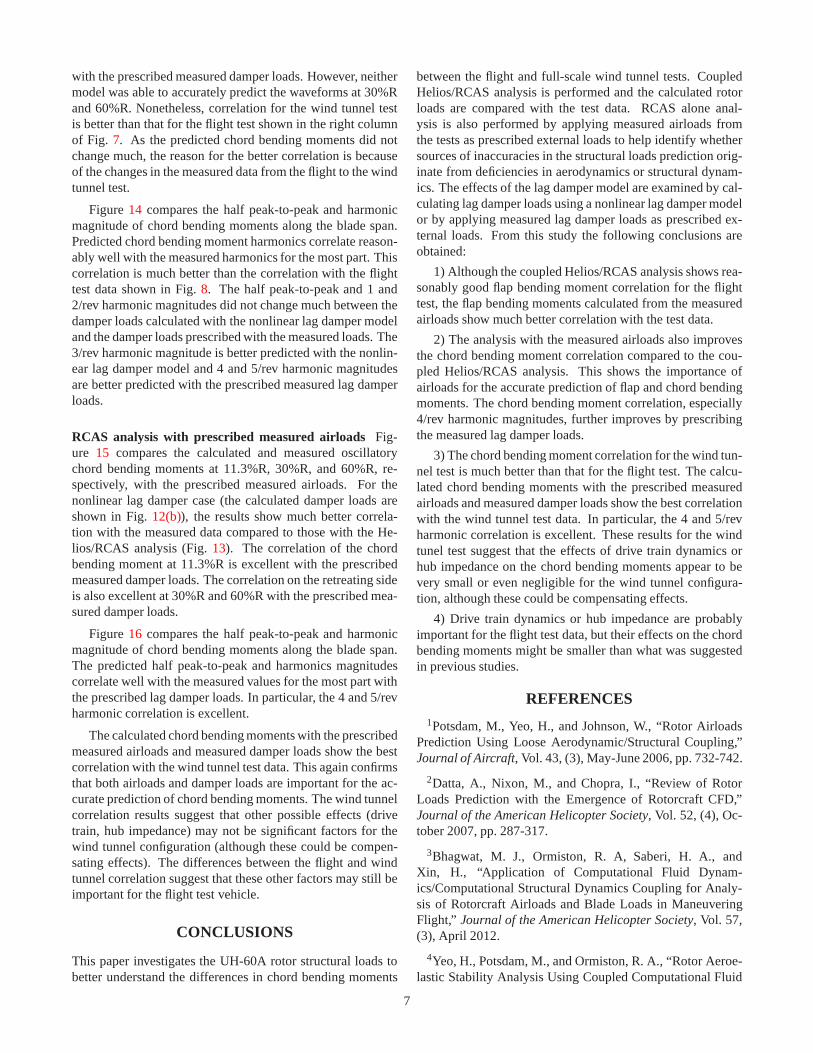
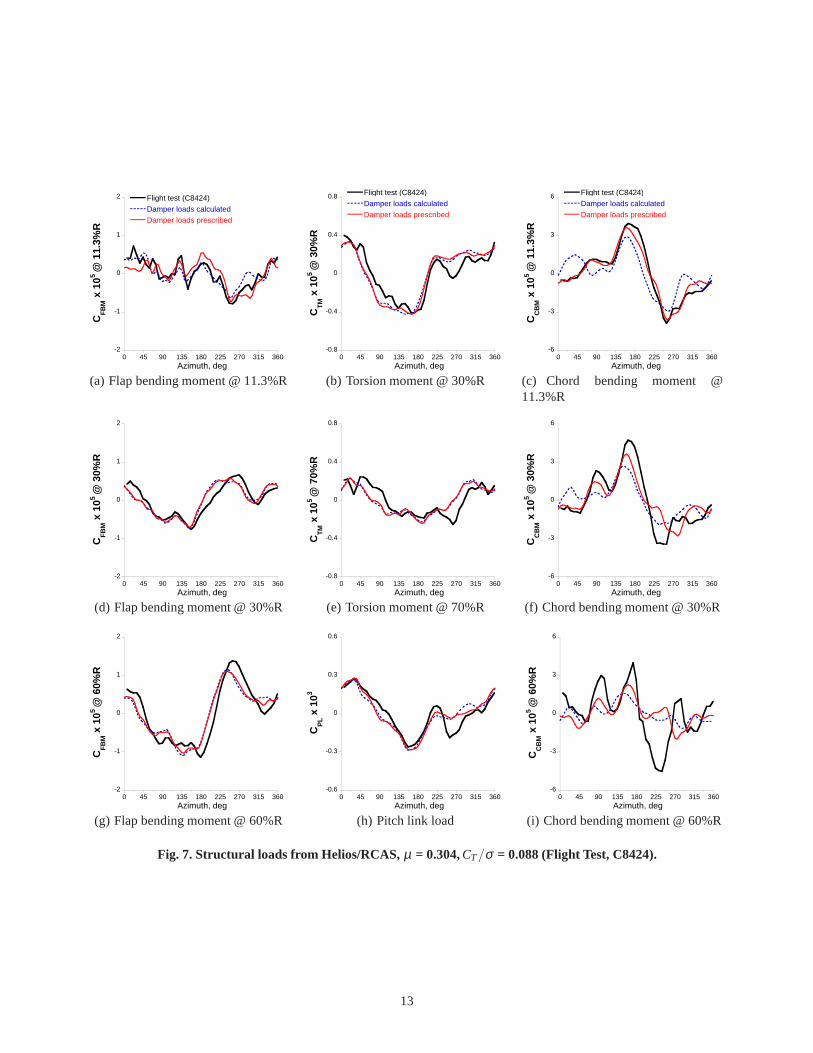
Figure7 compares the calculated and measured oscillatorystructural loads. Mean values were removed from both testdata and analyses. Again, the dotted blue lines represent theHelios/RCAS analysis results with the nonlinear lag dampermodel (damper loads calculated) and the red solid lines rep-resent the Helios/RCAS analysis results with the prescribedmeasured lag damper loads (damper loads prescribed). Fig-ures7(a), 7(d), and 7(g) show the oscillatory flap bendingmoments at 11.3%R, 30%R, and 60%R, respectively. Thecoupled analysis shows reasonably good correlation with theflight test data. The peak-to-peak amplitude is well predictedbut there is an approximate 10-deg phase difference betweenthe data and analysis. Lag damper loads (calculated vs. pre-scribed) are important only for the most inboard radial loca-tion.
Figures7(b), 7(e), and7(h) show the oscillatory torsionmoments at 30%R and 70%R and pitch link load, respec-tively. The behaviors of torsion moments at 30%R and pitchlink loads, which are interdependent, are predicted reasonablywell in the first and second quadrants, but are not satisfactoryin the third and fourth quadrants. In general, the torsion mo-ment correlation at 70%R is worse than that at 30%R. Theeffects of the lag damper loads on the torsion moments arevery small.
Figures 7(c), 7(f), and 7(i) show the oscillatory chordbending moments at 11.3%R, 30%R, and 60%R, respectively.As expected, the lag damper loads have more influence onthe chord bending moments than the flap bending and tor-sion moments. The correlation of the chord bending momentat 11.3%R is excellent with the prescribed measured damperloads. The analysis with the nonlinear lag damper modelshows worse correlation at 11.3%R in both waveform andphase due to the inaccurate lag damper loads prediction shownin Fig. 6(a). Better waveform and peak-to-peak correlation
5
were observed at 30%R with the prescribed measured damperloads. Both lag damper models, however, significantly under-predict the magnitude of chord bending moment at 60%R.
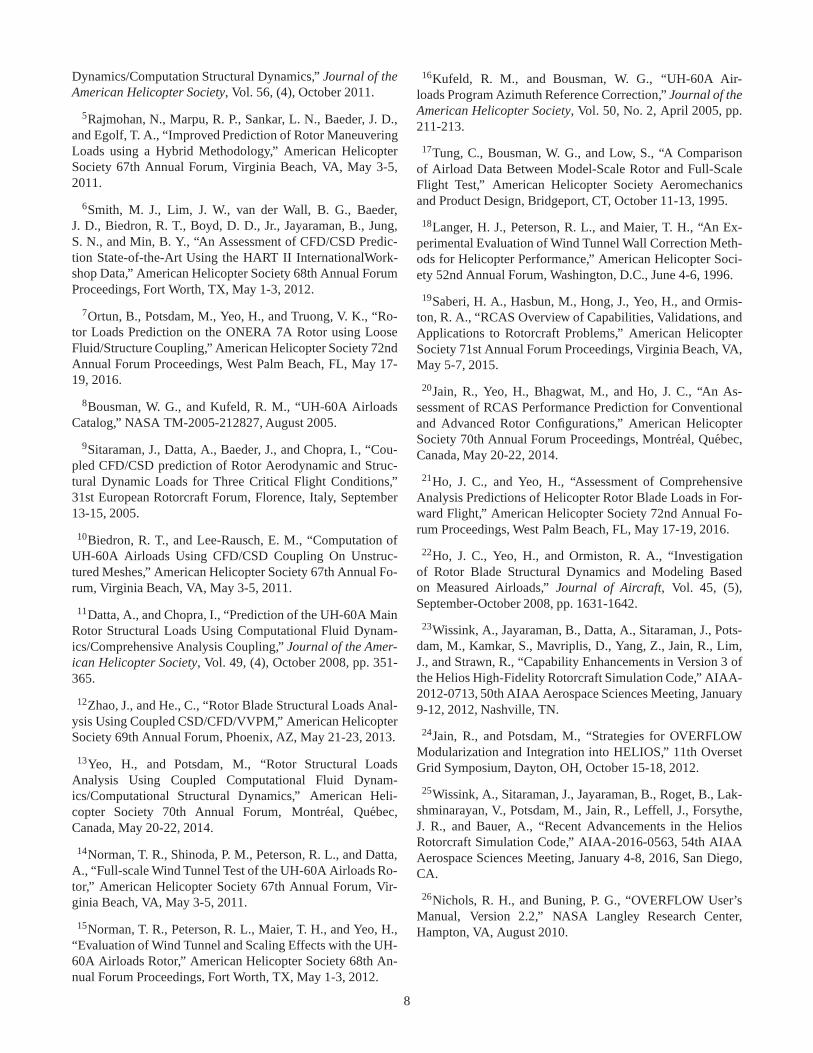
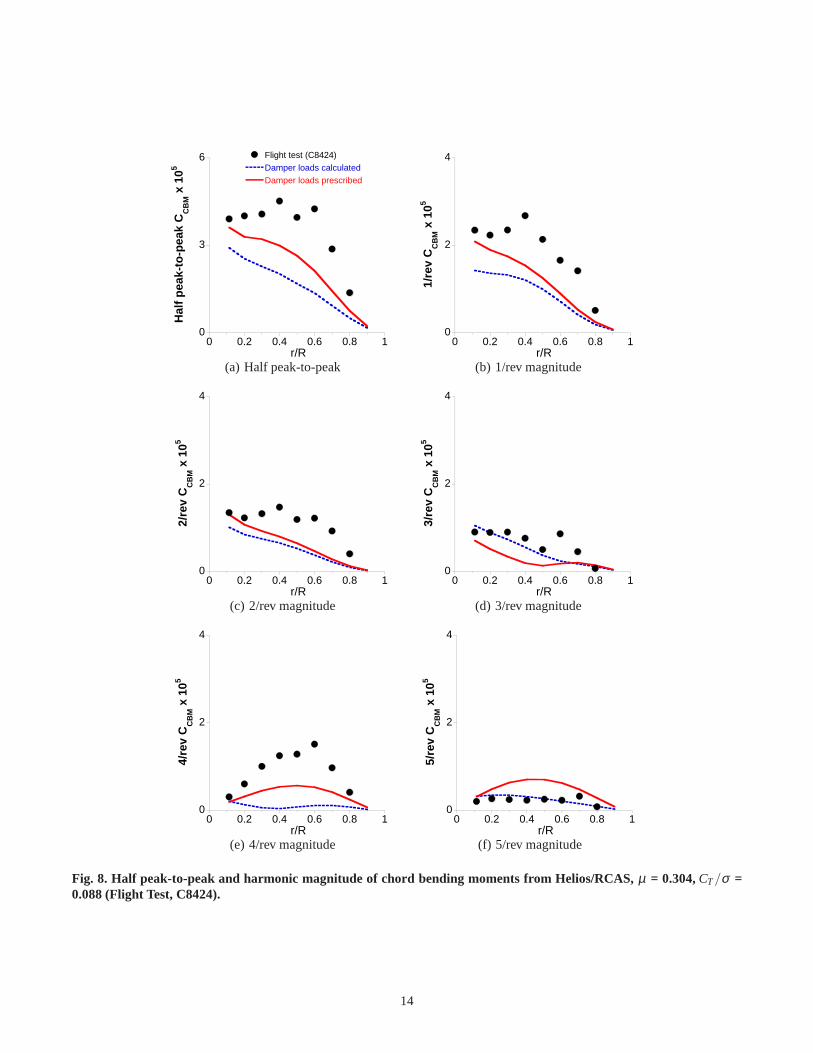
Chord bending moment, which is a main focus of thisstudy, is further examined. Figure8 compares the half peak-to-peak and harmonic magnitude of chord bending momentsalong the blade span. Chord bending moments are strongly af-fected by the damper loads. The analysis with the prescribedmeasured lag damper loads increases the half peak-to-peakmagnitudes and thus improves the correlation compared tothat with the nonlinear damper model. Even with the im-provement, there is still a significant underprediction. Previ-ous analysis of the UH-60A rotor using Helios/RCAS exam-ined the difference between linear and nonlinear lag dampermodels (Ref. 13). The study showed that 1) lag damper mod-eling has an important influence near the root of the bladeand its effect diminishes around mid span and 2) lag dampermodeling did not affect the 4/rev chord bending moments andboth the linear and nonlinear lag damper models significantlyunderpredict the 4/rev harmonic magnitude. Unlike those ob-servations, the present analysis with the prescribed measureddamper loads increases the 4/rev harmonic component aroundthe mid span and thus meaningful improvement is obtained.
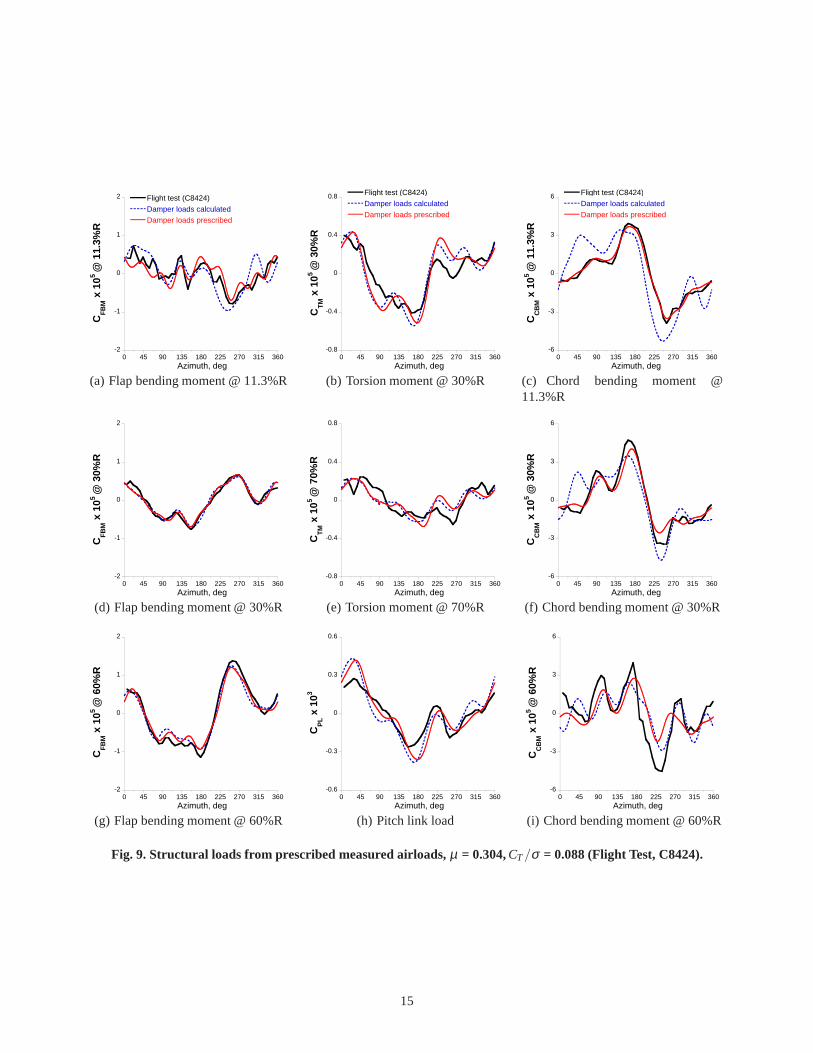
RCAS analysis with prescribed measured airloadsThissubsection investigates the structural loads calculated fromthe prescribed measured airloads (normal force, chord force,and pitching moment) using RCAS alone. Structural loadsare calculated for C8424 and the results are compared withthe measurements in Fig.9. Again, the effects of lag damperare examined by using either the nonlinear lag damper model(damper loads calculated) or prescribing the measured lagdamper loads (damper loads prescribed) in addition to themeasured airloads. Figure6(b) compares the RCAS calcu-lated damper loads with the measured damper loads.
Calculated and measured flap bending moments shown inFigs.9(a), 9(d), and9(g)are in good agreement, and the excel-lent magnitude and phase correlation at 30%R is noteworthy.The flap bending moment correlation at 60%R is also signif-icantly improved in both magnitude and phase compared tothe Helios/RCAS analysis shown in Fig.7(g). This shows theimportance of airloads for accurate prediction of flap bend-ing moments. Figures9(b), 9(e), and 9(h) show the oscil-latory torsion moments at 30%R and 70%R and pitch linkload, respectively. The analysis with the prescribed mea-sured airloads shows slightly better correlation than the cou-pled analysis on the retreating side. However, the overallcorrelation did not improve much. In general, the effects ofthe lag damper on the torsion moments are very small. Fig-ures9(c), 9(f), and9(i) show the oscillatory chord bendingmoments at 11.3%R, 30%R, and 60%R, respectively. Thecalculations and measurements agree very well for the chordbending moments at 11.3%R, but the correlation gets worsefor the outboard locations. Again, the analysis with the mea-sured airloads improves the chord bending moment correla-tion compared to the coupled Helios/RCAS analysis.
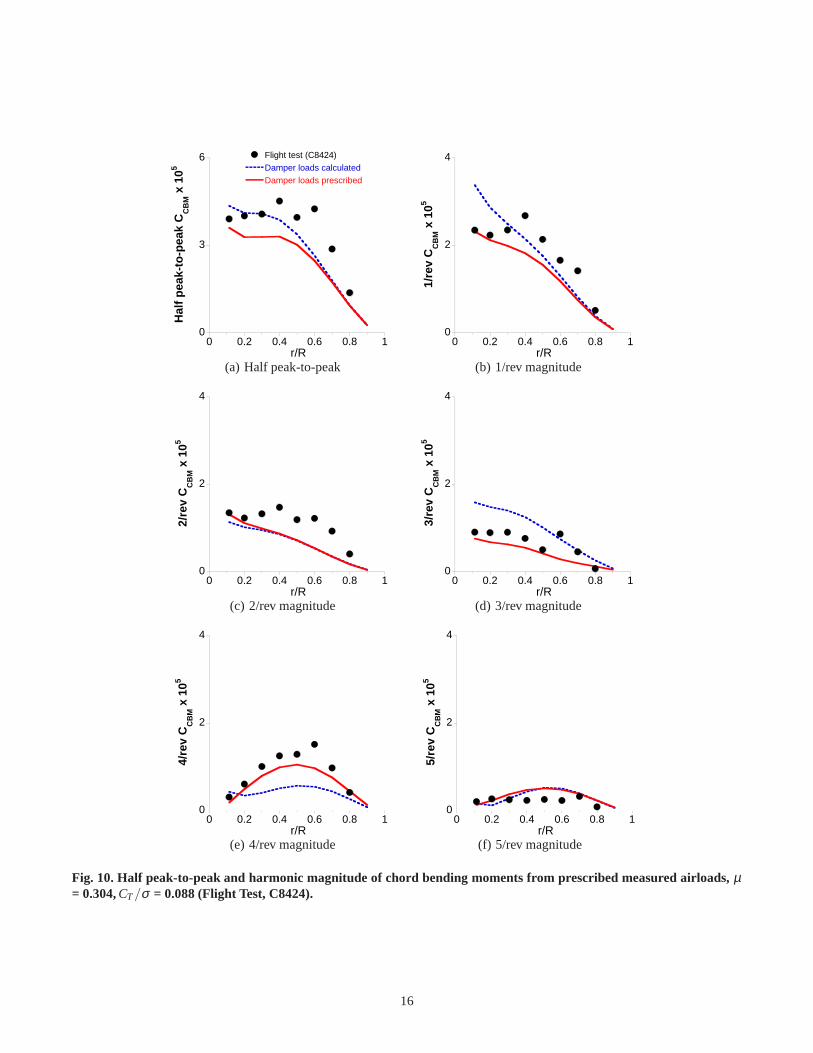
Figure 10 compares the half peak-to-peak and harmonicmagnitude of chord bending moments along the blade span.For the calculated lag damper load case, the results withthe prescribed measured airloads show much better correla-tion with the measured data compared to those with the He-lios/RCAS analysis shown in Fig.8, mostly because 1, 3,and 4/rev harmonic magnitudes increased. Although the 4/revharmonic magnitude is still substantially underpredictedevenwith the increased magnitude observed, the results show theimportance of airloads for the prediction of the 4/rev harmonicand thus overall chord bending moments. For the prescribedmeasured lag damper loads case, the half peak-to-peak valuedid not change much compared to the Helios/RCAS analysis.However, the correlation of 3 and 4/rev harmonic magnitudesis significantly improved. These results indicate the impor-tance of lag damper loads on the chord bending moment cor-relation. A drive train model may be needed to better matchwith the 4/rev harmonic magnitude but its effects might besmaller than what was suggested in Ref. 13.
Wind tunnel test condition, R47P21
This section examines the wind tunnel test data and focuseson the chord bending moments, as both flap bending and tor-sion moment results are very similar to those in the flight testsection.
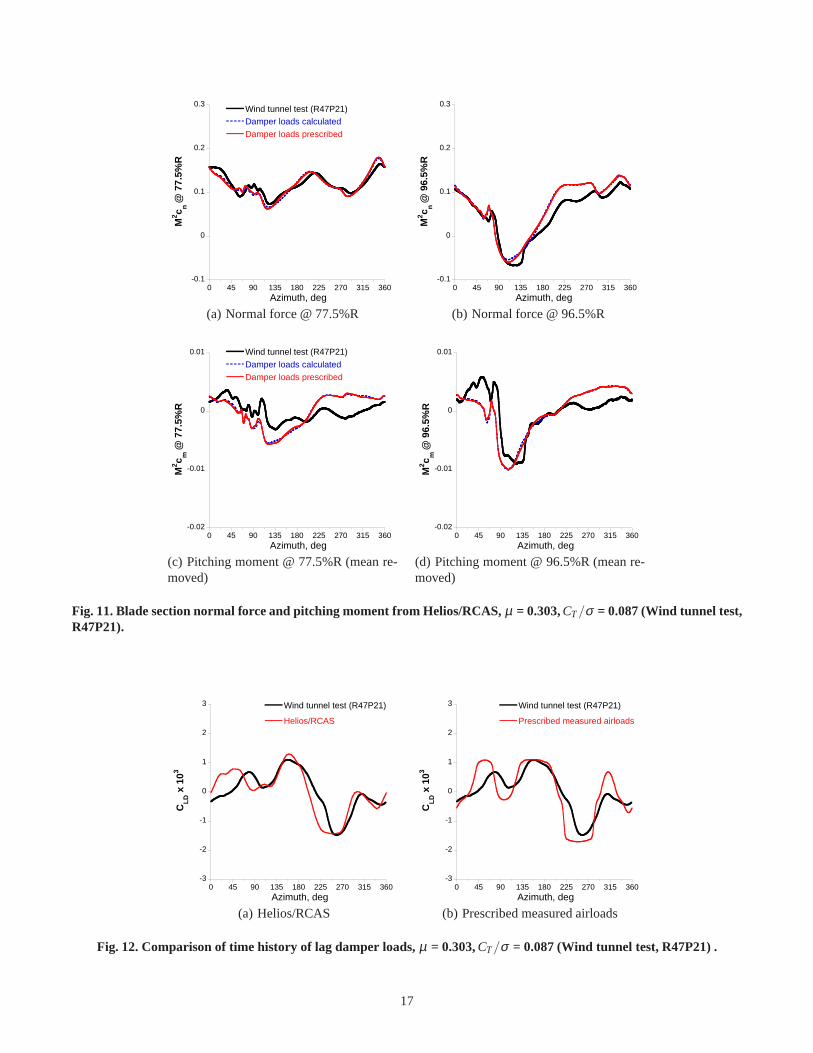
Coupled Helios/RCAS analysis Figure 11 shows nondi-mensional blade section normal force and pitching moment at77.5% and 96.5% radial locations. The predicted section nor-mal force and pitching moment for the wind tunnel test arealmost identical to those for the flight test because the trimand operating conditions are matched. The measured data be-tween the tests agree very well at 77.5%R, but show somedifferences at 96.5%R. The overall correlation at 77.5%R issame as for the flight test. However, the coupled analysis bet-ter predicts the magnitude and phase of the negative lift forthewind tunnel test than for the flight test shown in Fig.5. Pitch-ing moment correlation at 96.5%R is also improved comparedto the flight test.
Figure12(a)compares the Helios/RCAS calculated oscil-latory damper loads with the measured data. The calculateddamper loads shows reasonably good correlation of the peak-to-peak amplitude but were not able to accurately capture thewaveform. Figure12(b)will be explained later.
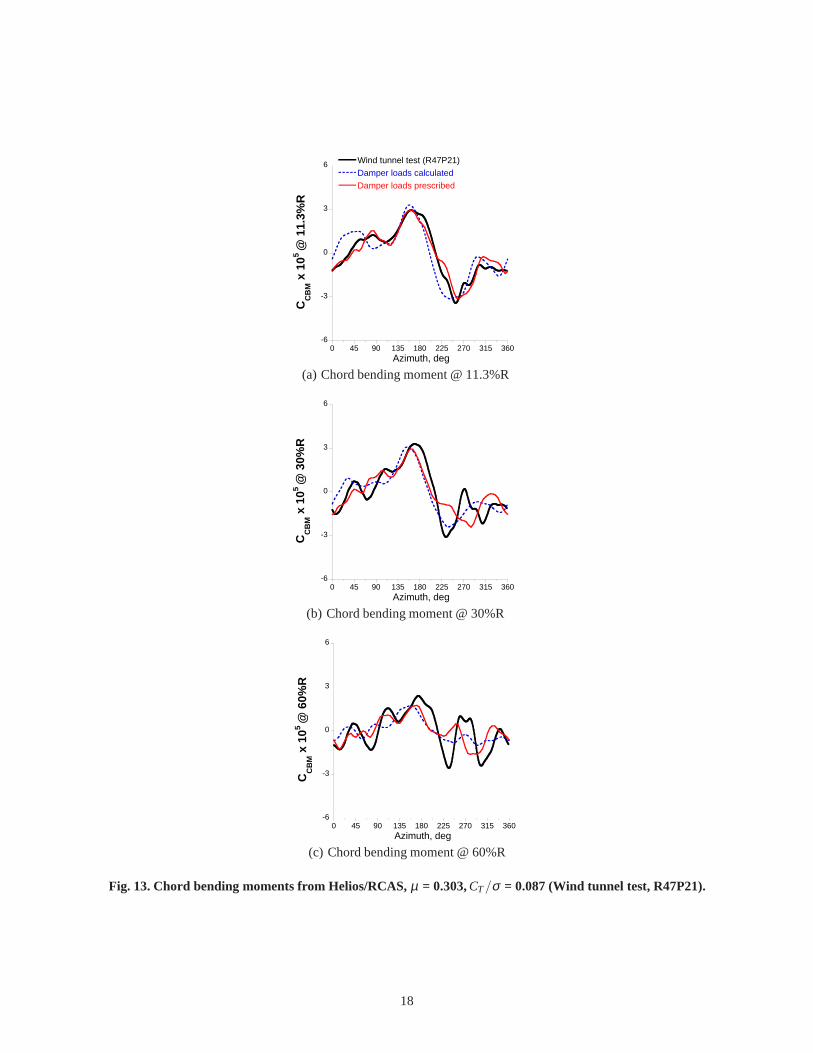
Figure13 compares the calculated and measured oscilla-tory chord bending moments at 11.3%R, 30%R, and 60%R,respectively, with damper loads calculated with the nonlinearlag damper model and damper loads prescribed with the mea-sured values. The Helios/RCAS analysis with the nonlinearlag damper shows reasonably good correlation of the chordbending moment at 11.3%R on the retreating side, but thewaveform on the advancing side is not accurately captured.This is consistent with the lag damper load correlation shownin Fig. 12(a). The correlation of the chord bending momentat 11.3%R is excellent on both advancing and retreating sides
6
with the prescribed measured damper loads. However, neithermodel was able to accurately predict the waveforms at 30%Rand 60%R. Nonetheless, correlation for the wind tunnel testis better than that for the flight test shown in the right columnof Fig. 7. As the predicted chord bending moments did notchange much, the reason for the better correlation is becauseof the changes in the measured data from the flight to the windtunnel test.
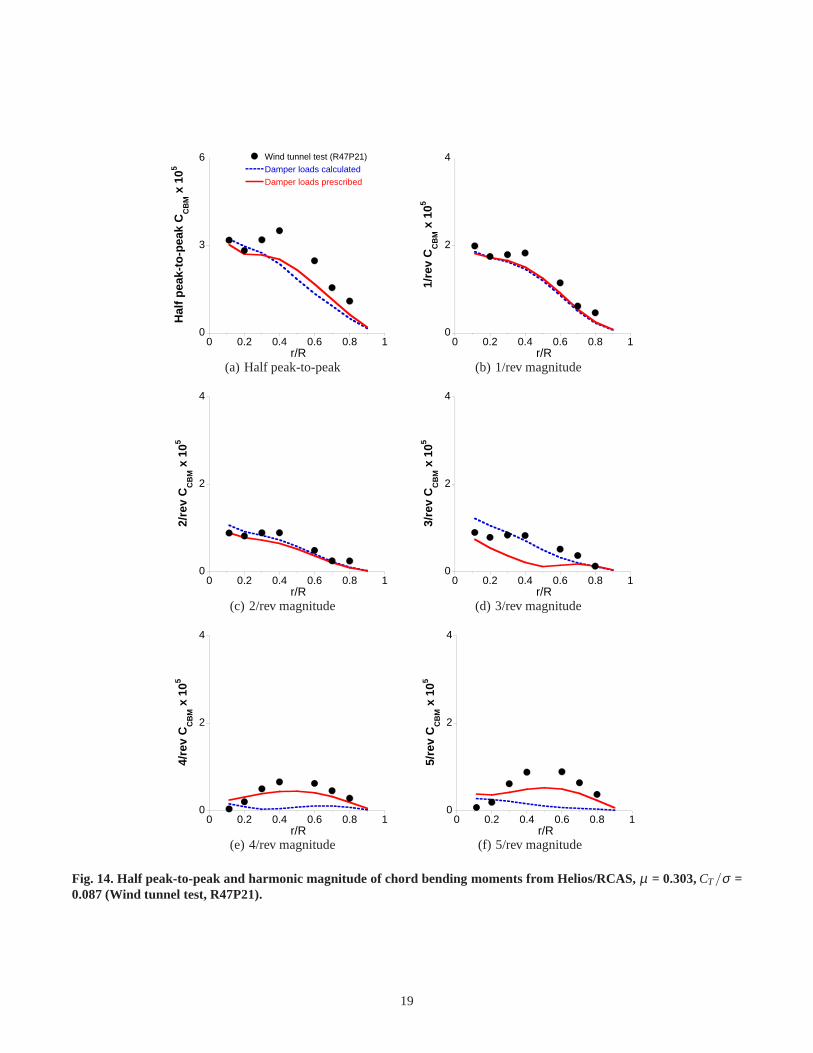
Figure 14 compares the half peak-to-peak and harmonicmagnitude of chord bending moments along the blade span.Predicted chord bending moment harmonics correlate reason-ably well with the measured harmonics for the most part. Thiscorrelation is much better than the correlation with the flighttest data shown in Fig.8. The half peak-to-peak and 1 and2/rev harmonic magnitudes did not change much between thedamper loads calculated with the nonlinear lag damper modeland the damper loads prescribed with the measured loads. The3/rev harmonic magnitude is better predicted with the nonlin-ear lag damper model and 4 and 5/rev harmonic magnitudesare better predicted with the prescribed measured lag damperloads.
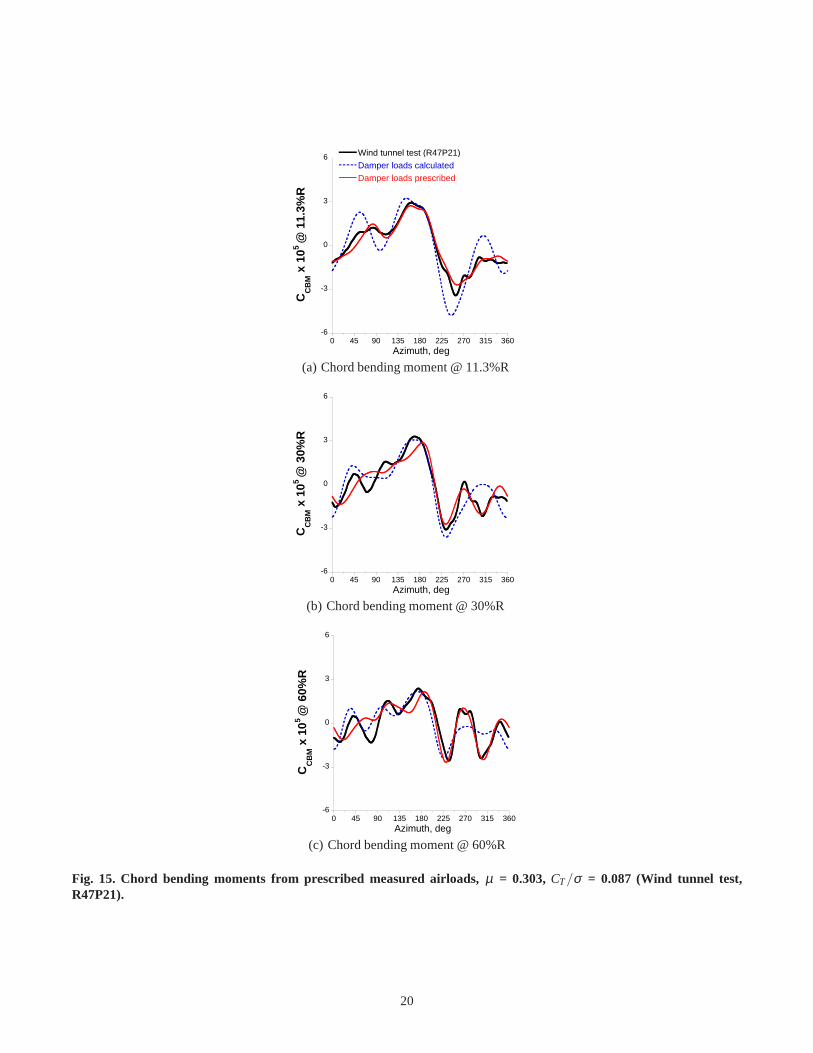
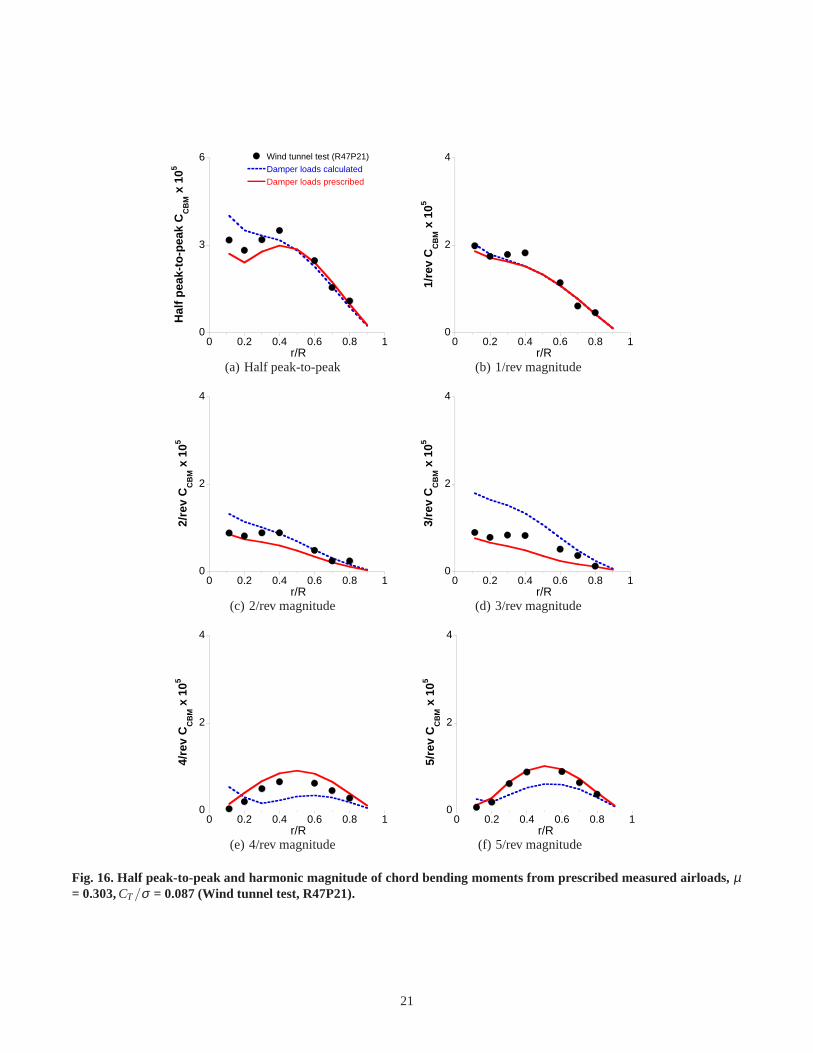
RCAS analysis with prescribed measured airloadsFig-ure 15 compares the calculated and measured oscillatorychord bending moments at 11.3%R, 30%R, and 60%R, re-spectively, with the prescribed measured airloads. For thenonlinear lag damper case (the calculated damper loads areshown in Fig.12(b)), the results show much better correla-tion with the measured data compared to those with the He-lios/RCAS analysis (Fig.13). The correlation of the chordbending moment at 11.3%R is excellent with the prescribedmeasured damper loads. The correlation on the retreating sideis also excellent at 30%R and 60%R with the prescribed mea-sured damper loads.
Figure 16 compares the half peak-to-peak and harmonicmagnitude of chord bending moments along the blade span.The predicted half peak-to-peak and harmonics magnitudescorrelate well with the measured values for the most part withthe prescribed lag damper loads. In particular, the 4 and 5/revharmonic correlation is excellent.
The calculated chord bending moments with the prescribedmeasured airloads and measured damper loads show the bestcorrelation with the wind tunnel test data. This again confirmsthat both airloads and damper loads are important for the ac-curate prediction of chord bending moments. The wind tunnelcorrelation results suggest that other possible effects (drivetrain, hub impedance) may not be significant factors for thewind tunnel configuration (although these could be compen-sating effects). The differences between the flight and windtunnel correlation suggest that these other factors may still beimportant for the flight test vehicle.
CONCLUSIONS
This paper investigates the UH-60A rotor structural loads tobetter understand the differences in chord bending moments
between the flight and full-scale wind tunnel tests. CoupledHelios/RCAS analysis is performed and the calculated rotorloads are compared with the test data. RCAS alone anal-ysis is also performed by applying measured airloads fromthe tests as prescribed external loads to help identify whethersources of inaccuracies in the structural loads predictionorig-inate from deficiencies in aerodynamics or structural dynam-ics. The effects of the lag damper model are examined by cal-culating lag damper loads using a nonlinear lag damper modelor by applying measured lag damper loads as prescribed ex-ternal loads. From this study the following conclusions areobtained:
1) Although the coupled Helios/RCAS analysis shows rea-sonably good flap bending moment correlation for the flighttest, the flap bending moments calculated from the measuredairloads show much better correlation with the test data.
2) The analysis with the measured airloads also improvesthe chord bending moment correlation compared to the cou-pled Helios/RCAS analysis. This shows the importance ofairloads for the accurate prediction of flap and chord bendingmoments. The chord bending moment correlation, especially4/rev harmonic magnitudes, further improves by prescribingthe measured lag damper loads.
3) The chord bending moment correlation for the wind tun-nel test is much better than that for the flight test. The calcu-lated chord bending moments with the prescribed measuredairloads and measured damper loads show the best correlationwith the wind tunnel test data. In particular, the 4 and 5/revharmonic correlation is excellent. These results for the windtunel test suggest that the effects of drive train dynamics orhub impedance on the chord bending moments appear to bevery small or even negligible for the wind tunnel configura-tion, although these could be compensating effects.
4) Drive train dynamics or hub impedance are probablyimportant for the flight test data, but their effects on the chordbending moments might be smaller than what was suggestedin previous studies.
REFERENCES1Potsdam, M., Yeo, H., and Johnson, W., “Rotor Airloads
Prediction Using Loose Aerodynamic/Structural Coupling,”Journal of Aircraft, Vol. 43, (3), May-June 2006, pp. 732-742.
2Datta, A., Nixon, M., and Chopra, I., “Review of RotorLoads Prediction with the Emergence of Rotorcraft CFD,”Journal of the American Helicopter Society, Vol. 52, (4), Oc-tober 2007, pp. 287-317.
3Bhagwat, M. J., Ormiston, R. A, Saberi, H. A., andXin, H., “Application of Computational Fluid Dynam-ics/Computational Structural Dynamics Coupling for Analy-sis of Rotorcraft Airloads and Blade Loads in ManeuveringFlight,” Journal of the American Helicopter Society, Vol. 57,(3), April 2012.
4Yeo, H., Potsdam, M., and Ormiston, R. A., “Rotor Aeroe-lastic Stability Analysis Using Coupled Computational Fluid
7
Dynamics/Computation Structural Dynamics,”Journal of theAmerican Helicopter Society, Vol. 56, (4), October 2011.
5Rajmohan, N., Marpu, R. P., Sankar, L. N., Baeder, J. D.,and Egolf, T. A., “Improved Prediction of Rotor ManeuveringLoads using a Hybrid Methodology,” American HelicopterSociety 67th Annual Forum, Virginia Beach, VA, May 3-5,2011.
6Smith, M. J., Lim, J. W., van der Wall, B. G., Baeder,J. D., Biedron, R. T., Boyd, D. D., Jr., Jayaraman, B., Jung,S. N., and Min, B. Y., “An Assessment of CFD/CSD Predic-tion State-of-the-Art Using the HART II InternationalWork-shop Data,” American Helicopter Society 68th Annual ForumProceedings, Fort Worth, TX, May 1-3, 2012.
7Ortun, B., Potsdam, M., Yeo, H., and Truong, V. K., “Ro-tor Loads Prediction on the ONERA 7A Rotor using LooseFluid/Structure Coupling,” American Helicopter Society 72ndAnnual Forum Proceedings, West Palm Beach, FL, May 17-19, 2016.
8Bousman, W. G., and Kufeld, R. M., “UH-60A AirloadsCatalog,” NASA TM-2005-212827, August 2005.
9Sitaraman, J., Datta, A., Baeder, J., and Chopra, I., “Cou-pled CFD/CSD prediction of Rotor Aerodynamic and Struc-tural Dynamic Loads for Three Critical Flight Conditions,”31st European Rotorcraft Forum, Florence, Italy, September13-15, 2005.
10Biedron, R. T., and Lee-Rausch, E. M., “Computation ofUH-60A Airloads Using CFD/CSD Coupling On Unstruc-tured Meshes,” American Helicopter Society 67th Annual Fo-rum, Virginia Beach, VA, May 3-5, 2011.
11Datta, A., and Chopra, I., “Prediction of the UH-60A MainRotor Structural Loads Using Computational Fluid Dynam-ics/Comprehensive Analysis Coupling,”Journal of the Amer-ican Helicopter Society, Vol. 49, (4), October 2008, pp. 351-365.
12Zhao, J., and He., C., “Rotor Blade Structural Loads Anal-ysis Using Coupled CSD/CFD/VVPM,” American HelicopterSociety 69th Annual Forum, Phoenix, AZ, May 21-23, 2013.
13Yeo, H., and Potsdam, M., “Rotor Structural LoadsAnalysis Using Coupled Computational Fluid Dynam-ics/Computational Structural Dynamics,” American Heli-copter Society 70th Annual Forum, Montreal, Quebec,Canada, May 20-22, 2014.
14Norman, T. R., Shinoda, P. M., Peterson, R. L., and Datta,A., “Full-scale Wind Tunnel Test of the UH-60A Airloads Ro-tor,” American Helicopter Society 67th Annual Forum, Vir-ginia Beach, VA, May 3-5, 2011.
15Norman, T. R., Peterson, R. L., Maier, T. H., and Yeo, H.,“Evaluation of Wind Tunnel and Scaling Effects with the UH-60A Airloads Rotor,” American Helicopter Society 68th An-nual Forum Proceedings, Fort Worth, TX, May 1-3, 2012.
16Kufeld, R. M., and Bousman, W. G., “UH-60A Air-loads Program Azimuth Reference Correction,”Journal of theAmerican Helicopter Society, Vol. 50, No. 2, April 2005, pp.211-213.
17Tung, C., Bousman, W. G., and Low, S., “A Comparisonof Airload Data Between Model-Scale Rotor and Full-ScaleFlight Test,” American Helicopter Society Aeromechanicsand Product Design, Bridgeport, CT, October 11-13, 1995.
18Langer, H. J., Peterson, R. L., and Maier, T. H., “An Ex-perimental Evaluation of Wind Tunnel Wall Correction Meth-ods for Helicopter Performance,” American Helicopter Soci-ety 52nd Annual Forum, Washington, D.C., June 4-6, 1996.
19Saberi, H. A., Hasbun, M., Hong, J., Yeo, H., and Ormis-ton, R. A., “RCAS Overview of Capabilities, Validations, andApplications to Rotorcraft Problems,” American HelicopterSociety 71st Annual Forum Proceedings, Virginia Beach, VA,May 5-7, 2015.
20Jain, R., Yeo, H., Bhagwat, M., and Ho, J. C., “An As-sessment of RCAS Performance Prediction for Conventionaland Advanced Rotor Configurations,” American HelicopterSociety 70th Annual Forum Proceedings, Montreal, Quebec,Canada, May 20-22, 2014.
21Ho, J. C., and Yeo, H., “Assessment of ComprehensiveAnalysis Predictions of Helicopter Rotor Blade Loads in For-ward Flight,” American Helicopter Society 72nd Annual Fo-rum Proceedings, West Palm Beach, FL, May 17-19, 2016.
22Ho, J. C., Yeo, H., and Ormiston, R. A., “Investigationof Rotor Blade Structural Dynamics and Modeling Basedon Measured Airloads,”Journal of Aircraft, Vol. 45, (5),September-October 2008, pp. 1631-1642.
23Wissink, A., Jayaraman, B., Datta, A., Sitaraman, J., Pots-dam, M., Kamkar, S., Mavriplis, D., Yang, Z., Jain, R., Lim,J., and Strawn, R., “Capability Enhancements in Version 3 ofthe Helios High-Fidelity Rotorcraft Simulation Code,” AIAA-2012-0713, 50th AIAA Aerospace Sciences Meeting, January9-12, 2012, Nashville, TN.
24Jain, R., and Potsdam, M., “Strategies for OVERFLOWModularization and Integration into HELIOS,” 11th OversetGrid Symposium, Dayton, OH, October 15-18, 2012.
25Wissink, A., Sitaraman, J., Jayaraman, B., Roget, B., Lak-shminarayan, V., Potsdam, M., Jain, R., Leffell, J., Forsythe,J. R., and Bauer, A., “Recent Advancements in the HeliosRotorcraft Simulation Code,” AIAA-2016-0563, 54th AIAAAerospace Sciences Meeting, January 4-8, 2016, San Diego,CA.
26Nichols, R. H., and Buning, P. G., “OVERFLOW User’sManual, Version 2.2,” NASA Langley Research Center,Hampton, VA, August 2010.
8
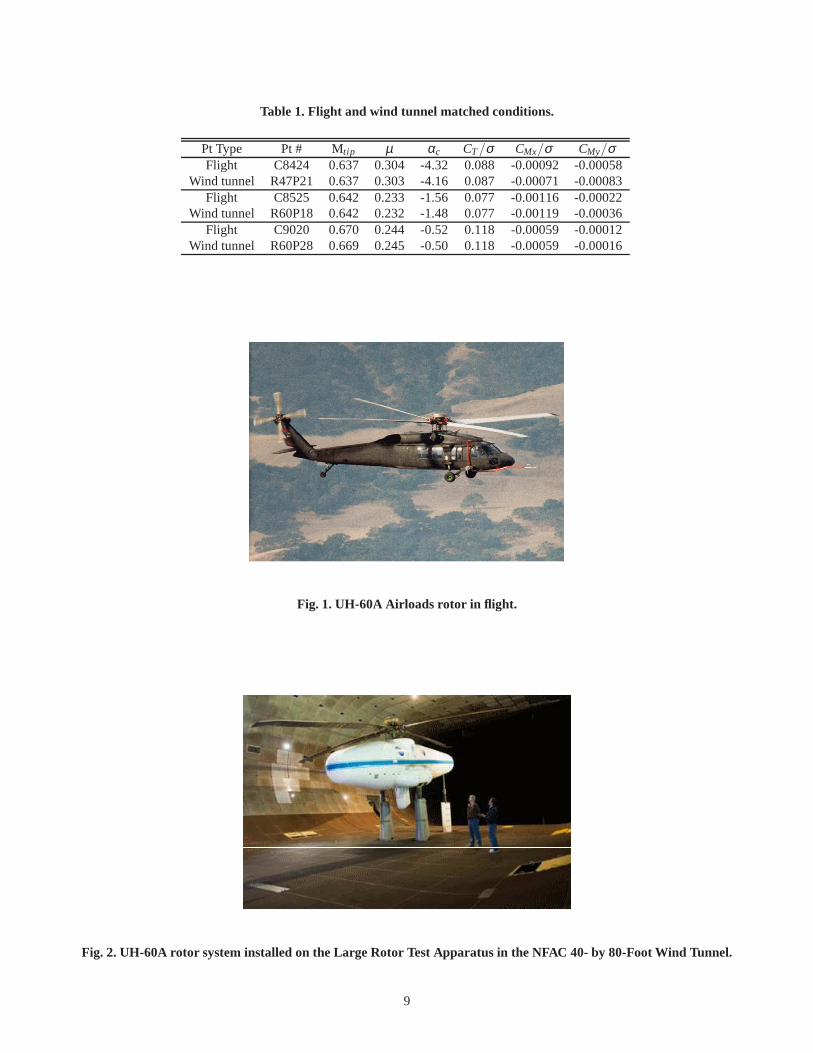
Table 1. Flight and wind tunnel matched conditions.
Pt Type Pt # Mtip µ αc CT /σ CMx/σ CMy/σFlight C8424 0.637 0.304 -4.32 0.088 -0.00092 -0.00058
Wind tunnel R47P21 0.637 0.303 -4.16 0.087 -0.00071 -0.00083Flight C8525 0.642 0.233 -1.56 0.077 -0.00116 -0.00022
Wind tunnel R60P18 0.642 0.232 -1.48 0.077 -0.00119 -0.00036Flight C9020 0.670 0.244 -0.52 0.118 -0.00059 -0.00012
Wind tunnel R60P28 0.669 0.245 -0.50 0.118 -0.00059 -0.00016
Fig. 1. UH-60A Airloads rotor in flight.
Fig. 2. UH-60A rotor system installed on the Large Rotor TestApparatus in the NFAC 40- by 80-Foot Wind Tunnel.
9
-2
-1
0
1
2
0 90 180 270 360
Flight test (C8424)
Wind tunnel test (R47P21)
CF
BM
x 1
05
Azimuth, deg
(a) Flap bending moment @ 60%R
-1
-0.5
0
0.5
1
0 90 180 270 360
Flight test (C8424)
Wind tunnel test (R47P21)
CT
M x
105
Azimuth, deg
(b) Torsion moment @ 30%R
-6
-3
0
3
6
0 90 180 270 360
Flight test (C8424)
Wind tunnel test (R47P21)
CC
BM
x 1
05
Azimuth, deg
(c) Chord bending moment @ 60%R
Fig. 3. Blade structural loads comparison between flight andwind tunnel tests.
10
0
3
6
0 0.2 0.4 0.6 0.8 1
Flight test (C8424)
Wind tunnel test (R47P21)H
alf
pea
k-to
-pea
k C
CB
M x
105
r/R(a) Half peak-to-peak
0
3
6
0 0.2 0.4 0.6 0.8 1
1/re
v C
CB
M x
105
r/R(b) 1/rev magnitude
0
3
6
0 0.2 0.4 0.6 0.8 1
2/re
v C
CB
M x
105
r/R(c) 2/rev magnitude
0
3
6
0 0.2 0.4 0.6 0.8 1
3/re
v C
CB
M x
105
r/R(d) 3/rev magnitude
0
3
6
0 0.2 0.4 0.6 0.8 1
4/re
v C
CB
M x
105
r/R(e) 4/rev magnitude
0
3
6
0 0.2 0.4 0.6 0.8 1
5/re
v C
CB
M x
105
r/R(f) 5/rev magnitude
Fig. 4. Half peak-to-peak and harmonic magnitude of chord bending moments comparison between flight and windtunnel tests.
11
-0.1
0
0.1
0.2
0.3
0 45 90 135 180 225 270 315 360
Flight test (C8424)Damper loads calculated
Damper loads prescribed
M2 c n
@ 7
7.5%
R
Azimuth, deg
(a) Normal force @ 77.5%R
-0.1
0
0.1
0.2
0.3
0 45 90 135 180 225 270 315 360
M2 c n
@ 9
6.5%
R
Azimuth, deg
(b) Normal force @ 96.5%R
-0.02
-0.01
0
0.01
0 45 90 135 180 225 270 315 360
Flight test (C8424)Damper loads calculated
Damper loads prescribed
M2 c m
@ 7
7.5%
R
Azimuth, deg
(c) Pitching moment @ 77.5%R (mean re-moved)
-0.02
-0.01
0
0.01
0 45 90 135 180 225 270 315 360
M2 c m
@ 9
6.5%
R
Azimuth, deg
(d) Pitching moment @ 96.5%R (mean re-moved)
Fig. 5. Blade section normal force and pitching moment from Helios/RCAS,µ = 0.304,CT /σ = 0.088 (Flight Test, C8424).
-3
-2
-1
0
1
2
3
0 45 90 135 180 225 270 315 360
Flight test (C8424)
Helios/RCAS
CL
D x
103
Azimuth, deg
(a) Helios/RCAS
-3
-2
-1
0
1
2
3
0 45 90 135 180 225 270 315 360
Flight test (C8424)
Prescribed measured airloads
CL
D x
103
Azimuth, deg
(b) Prescribed measured airloads
Fig. 6. Comparison of time history of lag damper loads,µ = 0.304,CT /σ = 0.088 (Flight Test, C8424) .
12
-2
-1
0
1
2
0 45 90 135 180 225 270 315 360
Flight test (C8424)
Damper loads calculatedDamper loads prescribed
CF
BM x
105
@ 1
1.3%
R
Azimuth, deg
(a) Flap bending moment @ 11.3%R
-0.8
-0.4
0
0.4
0.8
0 45 90 135 180 225 270 315 360
Flight test (C8424)
Damper loads calculated
Damper loads prescribed
CT
M x
105
@ 3
0%R
Azimuth, deg
(b) Torsion moment @ 30%R
-6
-3
0
3
6
0 45 90 135 180 225 270 315 360
Flight test (C8424)
Damper loads calculated
Damper loads prescribed
CC
BM x
105
@ 1
1.3%
R
Azimuth, deg
(c) Chord bending moment @11.3%R
-2
-1
0
1
2
0 45 90 135 180 225 270 315 360
CF
BM x
105
@ 3
0%R
Azimuth, deg
(d) Flap bending moment @ 30%R
-0.8
-0.4
0
0.4
0.8
0 45 90 135 180 225 270 315 360
CT
M x
105
@ 7
0%R
Azimuth, deg
(e) Torsion moment @ 70%R
-6
-3
0
3
6
0 45 90 135 180 225 270 315 360
CC
BM x
105
@ 3
0%R
Azimuth, deg
(f) Chord bending moment @ 30%R
-2
-1
0
1
2
0 45 90 135 180 225 270 315 360
CF
BM x
105
@ 6
0%R
Azimuth, deg
(g) Flap bending moment @ 60%R
-0.6
-0.3
0
0.3
0.6
0 45 90 135 180 225 270 315 360
CP
L x
103
Azimuth, deg
(h) Pitch link load
-6
-3
0
3
6
0 45 90 135 180 225 270 315 360
CC
BM x
105
@ 6
0%R
Azimuth, deg
(i) Chord bending moment @ 60%R
Fig. 7. Structural loads from Helios/RCAS,µ = 0.304,CT /σ = 0.088 (Flight Test, C8424).
13
0
3
6
0 0.2 0.4 0.6 0.8 1
Flight test (C8424)
Damper loads calculated
Damper loads prescribedH
alf
pea
k-to
-pea
k C
CB
M x
105
r/R(a) Half peak-to-peak
0
2
4
0 0.2 0.4 0.6 0.8 1
1/re
v C
CB
M x
105
r/R(b) 1/rev magnitude
0
2
4
0 0.2 0.4 0.6 0.8 1
2/re
v C
CB
M x
105
r/R(c) 2/rev magnitude
0
2
4
0 0.2 0.4 0.6 0.8 1
3/re
v C
CB
M x
105
r/R(d) 3/rev magnitude
0
2
4
0 0.2 0.4 0.6 0.8 1
4/re
v C
CB
M x
105
r/R(e) 4/rev magnitude
0
2
4
0 0.2 0.4 0.6 0.8 1
5/re
v C
CB
M x
105
r/R(f) 5/rev magnitude
Fig. 8. Half peak-to-peak and harmonic magnitude of chord bending moments from Helios/RCAS,µ = 0.304,CT /σ =0.088 (Flight Test, C8424).
14
-2
-1
0
1
2
0 45 90 135 180 225 270 315 360
Flight test (C8424)
Damper loads calculatedDamper loads prescribed
CF
BM x
105
@ 1
1.3%
R
Azimuth, deg
(a) Flap bending moment @ 11.3%R
-0.8
-0.4
0
0.4
0.8
0 45 90 135 180 225 270 315 360
Flight test (C8424)
Damper loads calculated
Damper loads prescribed
CT
M x
105
@ 3
0%R
Azimuth, deg
(b) Torsion moment @ 30%R
-6
-3
0
3
6
0 45 90 135 180 225 270 315 360
Flight test (C8424)
Damper loads calculated
Damper loads prescribed
CC
BM x
105
@ 1
1.3%
R
Azimuth, deg
(c) Chord bending moment @11.3%R
-2
-1
0
1
2
0 45 90 135 180 225 270 315 360
CF
BM x
105
@ 3
0%R
Azimuth, deg
(d) Flap bending moment @ 30%R
-0.8
-0.4
0
0.4
0.8
0 45 90 135 180 225 270 315 360
CT
M x
105
@ 7
0%R
Azimuth, deg
(e) Torsion moment @ 70%R
-6
-3
0
3
6
0 45 90 135 180 225 270 315 360
CC
BM x
105
@ 3
0%R
Azimuth, deg
(f) Chord bending moment @ 30%R
-2
-1
0
1
2
0 45 90 135 180 225 270 315 360
CF
BM x
105
@ 6
0%R
Azimuth, deg
(g) Flap bending moment @ 60%R
-0.6
-0.3
0
0.3
0.6
0 45 90 135 180 225 270 315 360
CP
L x
103
Azimuth, deg
(h) Pitch link load
-6
-3
0
3
6
0 45 90 135 180 225 270 315 360
CC
BM x
105
@ 6
0%R
Azimuth, deg
(i) Chord bending moment @ 60%R
Fig. 9. Structural loads from prescribed measured airloads, µ = 0.304,CT /σ = 0.088 (Flight Test, C8424).
15
0
3
6
0 0.2 0.4 0.6 0.8 1
Flight test (C8424)
Damper loads calculated
Damper loads prescribedH
alf
pea
k-to
-pea
k C
CB
M x
105
r/R(a) Half peak-to-peak
0
2
4
0 0.2 0.4 0.6 0.8 1
1/re
v C
CB
M x
105
r/R(b) 1/rev magnitude
0
2
4
0 0.2 0.4 0.6 0.8 1
2/re
v C
CB
M x
105
r/R(c) 2/rev magnitude
0
2
4
0 0.2 0.4 0.6 0.8 1
3/re
v C
CB
M x
105
r/R(d) 3/rev magnitude
0
2
4
0 0.2 0.4 0.6 0.8 1
4/re
v C
CB
M x
105
r/R(e) 4/rev magnitude
0
2
4
0 0.2 0.4 0.6 0.8 1
5/re
v C
CB
M x
105
r/R(f) 5/rev magnitude
Fig. 10. Half peak-to-peak and harmonic magnitude of chord bending moments from prescribed measured airloads,µ= 0.304,CT /σ = 0.088 (Flight Test, C8424).
16
-0.1
0
0.1
0.2
0.3
0 45 90 135 180 225 270 315 360
Wind tunnel test (R47P21)Damper loads calculated
Damper loads prescribed
M2 c n
@ 7
7.5%
R
Azimuth, deg
(a) Normal force @ 77.5%R
-0.1
0
0.1
0.2
0.3
0 45 90 135 180 225 270 315 360
M2 c n
@ 9
6.5%
R
Azimuth, deg
(b) Normal force @ 96.5%R
-0.02
-0.01
0
0.01
0 45 90 135 180 225 270 315 360
Wind tunnel test (R47P21)
Damper loads calculated
Damper loads prescribed
M2 c m
@ 7
7.5%
R
Azimuth, deg
(c) Pitching moment @ 77.5%R (mean re-moved)
-0.02
-0.01
0
0.01
0 45 90 135 180 225 270 315 360
M2 c m
@ 9
6.5%
R
Azimuth, deg
(d) Pitching moment @ 96.5%R (mean re-moved)
Fig. 11. Blade section normal force and pitching moment fromHelios/RCAS,µ = 0.303,CT /σ = 0.087 (Wind tunnel test,R47P21).
-3
-2
-1
0
1
2
3
0 45 90 135 180 225 270 315 360
Wind tunnel test (R47P21)
Helios/RCAS
CL
D x
103
Azimuth, deg
(a) Helios/RCAS
-3
-2
-1
0
1
2
3
0 45 90 135 180 225 270 315 360
Wind tunnel test (R47P21)
Prescribed measured airloads
CL
D x
103
Azimuth, deg
(b) Prescribed measured airloads
Fig. 12. Comparison of time history of lag damper loads,µ = 0.303,CT /σ = 0.087 (Wind tunnel test, R47P21) .
17
-6
-3
0
3
6
0 45 90 135 180 225 270 315 360
Wind tunnel test (R47P21)
Damper loads calculated
Damper loads prescribed
CC
BM x
105
@ 1
1.3%
R
Azimuth, deg
(a) Chord bending moment @ 11.3%R
-6
-3
0
3
6
0 45 90 135 180 225 270 315 360
CC
BM x
105
@ 3
0%R
Azimuth, deg
(b) Chord bending moment @ 30%R
-6
-3
0
3
6
0 45 90 135 180 225 270 315 360
CC
BM x
105
@ 6
0%R
Azimuth, deg
(c) Chord bending moment @ 60%R
Fig. 13. Chord bending moments from Helios/RCAS,µ = 0.303,CT /σ = 0.087 (Wind tunnel test, R47P21).
18
0
3
6
0 0.2 0.4 0.6 0.8 1
Wind tunnel test (R47P21)
Damper loads calculated
Damper loads prescribedH
alf
pea
k-to
-pea
k C
CB
M x
105
r/R(a) Half peak-to-peak
0
2
4
0 0.2 0.4 0.6 0.8 1
1/re
v C
CB
M x
105
r/R(b) 1/rev magnitude
0
2
4
0 0.2 0.4 0.6 0.8 1
2/re
v C
CB
M x
105
r/R(c) 2/rev magnitude
0
2
4
0 0.2 0.4 0.6 0.8 1
3/re
v C
CB
M x
105
r/R(d) 3/rev magnitude
0
2
4
0 0.2 0.4 0.6 0.8 1
4/re
v C
CB
M x
105
r/R(e) 4/rev magnitude
0
2
4
0 0.2 0.4 0.6 0.8 1
5/re
v C
CB
M x
105
r/R(f) 5/rev magnitude
Fig. 14. Half peak-to-peak and harmonic magnitude of chord bending moments from Helios/RCAS,µ = 0.303,CT /σ =0.087 (Wind tunnel test, R47P21).
19
-6
-3
0
3
6
0 45 90 135 180 225 270 315 360
Wind tunnel test (R47P21)
Damper loads calculated
Damper loads prescribed
CC
BM x
105
@ 1
1.3%
R
Azimuth, deg
(a) Chord bending moment @ 11.3%R
-6
-3
0
3
6
0 45 90 135 180 225 270 315 360
CC
BM x
105
@ 3
0%R
Azimuth, deg
(b) Chord bending moment @ 30%R
-6
-3
0
3
6
0 45 90 135 180 225 270 315 360
CC
BM x
105
@ 6
0%R
Azimuth, deg
(c) Chord bending moment @ 60%R
Fig. 15. Chord bending moments from prescribed measured airloads, µ = 0.303,CT /σ = 0.087 (Wind tunnel test,R47P21).
20
0
3
6
0 0.2 0.4 0.6 0.8 1
Wind tunnel test (R47P21)
Damper loads calculated
Damper loads prescribedH
alf
pea
k-to
-pea
k C
CB
M x
105
r/R(a) Half peak-to-peak
0
2
4
0 0.2 0.4 0.6 0.8 1
1/re
v C
CB
M x
105
r/R(b) 1/rev magnitude
0
2
4
0 0.2 0.4 0.6 0.8 1
2/re
v C
CB
M x
105
r/R(c) 2/rev magnitude
0
2
4
0 0.2 0.4 0.6 0.8 1
3/re
v C
CB
M x
105
r/R(d) 3/rev magnitude
0
2
4
0 0.2 0.4 0.6 0.8 1
4/re
v C
CB
M x
105
r/R(e) 4/rev magnitude
0
2
4
0 0.2 0.4 0.6 0.8 1
5/re
v C
CB
M x
105
r/R(f) 5/rev magnitude
Fig. 16. Half peak-to-peak and harmonic magnitude of chord bending moments from prescribed measured airloads,µ= 0.303,CT /σ = 0.087 (Wind tunnel test, R47P21).
21