INVESTIGATION OF THE PYHSICAL AND CHEMICAL … · INVESTIGATION OF THE PYHSICAL AND CHEMICAL...
136
INVESTIGATION OF THE PYHSICAL AND CHEMICAL PROPERTIES OF MILK CONTAINING ANTIBIOTICS A Thesis Submitted to the Graduate School of Engineering and Sciences of İzmir Institute of Technology in Partial Fulfillment of the Requirements for the Degree of MASTER OF SCIENCE in Food Engineering by Özge YILDIZ December 2008 İZMİR
Transcript of INVESTIGATION OF THE PYHSICAL AND CHEMICAL … · INVESTIGATION OF THE PYHSICAL AND CHEMICAL...

INVESTIGATION OF THE PYHSICAL AND CHEMICAL PROPERTIES OF MILK
CONTAINING ANTIBIOTICS
A Thesis Submitted to the Graduate School of Engineering and Sciences of
İzmir Institute of Technology in Partial Fulfillment of the Requirements for the Degree of
MASTER OF SCIENCE
in Food Engineering
by Özge YILDIZ
December 2008 İZMİR
We approve the thesis of Özge YILDIZ
Assist. Prof. Dr. Sevcan ÜNLÜTÜRK Supervisor
Assoc. Prof. Dr. Canan TARI Co-Supervisor
Prof. Dr. Şebnem HARSA Committee Member
Assoc. Prof. Dr. Figen TOKATLI Committee Member
Assist. Prof. Dr. Mehmet Süleyman ÜNLÜTÜRK Committee Member
1 December 2008
Prof. Dr. Şebnem HARSA Prof. Dr. Hasan BÖKE Head of Department of Food Engineering Dean of the Graduate School of Engineering and Sciences

ACKNOWLEDGMENTS
I would like to express my gratitude to all those who gave me the possibility to
complete this thesis. I want to thank the Department of Food Engineering of Izmir
Institute of Technology. I have furthermore to thank Department of Toxicology of
Bornova Veterinary Control and Research Institute, especially A. Turan ERDOĞDU,
Bilal ÖZ and Güven ÖZDEMİR, Yasemin KOÇYİĞİT who support me to go ahead
with my thesis.
I am deeply indebted to my supervisor Assist. Prof. Dr. Sevcan ÜNLÜTÜRK
whose helps, stimulating suggestions and encouragement helped me in all the time of
research for and writing of this thesis. I would like to thank my co-advisor Assoc. Prof.
Dr. Canan TARI. She has been actively interested in my work and has always been
available to advise me. Also I would like to express my warm and sincere thanks to
Assist. Prof. Dr. Mehmet Süleyman ÜNLÜTÜRK from Izmir University of Economics,
Department of Computer Engineering for his important support.
My colleagues supported me in my research work. I want to thank them for all
their help, support, interest and valuable hints. Especially I am obliged to Fatih Y. G.
YENER, Işık ÜSTOK, Mehmet Reşat ATILGAN, Burcu ÇABUK, Elçin Dilek KAYA
and A. Tuğrul SEYHAN. I also want to thank my housemate İlke UYSAL for sharing
house and interest in what I do.
Especially, I would like to give my special thanks to my friend Osman
ÖZELGÖRÜ whose patient love enabled me to complete this work.
Finally, I would like to thank my mother Nejla YILDIZ whose love is boundless
and for my father Binali YILDIZ who is my role model. I thank my sisters Müge
YILDIZ and Simge Nur YILDIZ for giving me happiness and joy.

iv
ABSTRACT
INVESTIGATION OF THE PHYSICAL AND CHEMICAL
PROPERTIES OF MILK CONTAINING ANTIBIOTICS
This work aimed to find a basic and rapid screening method for antibiotic
residues in UHT whole cow’s milk. For this purpose an investigation was conducted to
screen some physical (e.g. acidity, pH, density, freezing point and electrical
conductivity), thermo-physical (e.g. melting temperature, heat of fusion, evaporation
temperature and heat of evaporation) and chemical properties (e.g. fat%, protein%,
lactose%, minerals%, SNF%) of antibiotic free milk and milk fortified by Penicillin G,
Ampicillin, Tetracycline. We can able determine whether residue of antibiotics making
any difference on these selected properties. Thermo-physical properties were measured
by differential scanning calorimeter (DSC), (TA Instruments, USA) and chemical
properties were determined by using Lactostar (Funke Gerber Inc., Berlin, Germany).
Antibiotic residues were detected by Copan Milk Test, Penzyme Test and ROSA
Test and by high performance liquid chromatography (HPLC) method for confirmation
of screening tests. Due to some drawbacks of screening tests, liquid chromatography
was required for confirmation of antibiotic residues in milk. HPLC method showed that
average recoveries of spiked Penicillin G at 2, 4, 8 ppb, spiked Ampicillin at 2, 4, 8 ppb
and spiked Tetracycline at 100, 250, 500 ppb were ranged from 44.67% to 66.00%,
from 62.50% to 87.52% and from 92.86% to 94.35%, respectively.
We found that the acidity, pH and density of milk were independent of Penicillin
G, Ampicillin and Tetracycline concentrations. Electrical conductivity (EC) were
evaluated by applying ANOVA with Fisher’s test and Probabilistic neural network
(PNN) method. ANOVA was also performed for DSC and Lactostar measurement
results. This evaluation suggested that EC measurement can be a great promising
technique for detection of antibiotic residues in milk, DSC is a good characterization
tool for understanding of thermal events and the presence of antibiotic residues in milk
influencing freezing point and minerals (EMC)%.

v
ÖZET
ANTİBİYOTİKLİ SÜTLERİN FİZİKSEL VE KİMYASAL
ÖZELLİKLERİNİN İNCELENMESİ
Bu çalışmada, UHT yağlı inek sütündeki antibiyotik kalıntılarının tespiti için
basit ve hızlı bir metodun bulunması amaçlanmıştır. Bu amaçla, antibiyotik içermeyen
ve Penisilin G, Ampisilin, Tetrasiklin içeren süt örneklerinin bazı fiziksel özelliklerinin
(asitlik, pH, yoğunluk, donma noktası ve elektriksel iletkenlik), ısısal davranışlarının
(erime sıcaklığı, erime ısısı, buharlaşma sıcaklığı ve buharlaşma ısısı) ve kimyasal (%
yağ, % protein, % laktoz, % mineral, % yağsız kuru madde) özelliklerinin belirlenmesi
için bir araştırma yürütülmüştür. Antibiyotik kalıntılarının seçilmiş bu özellikler üzerine
herhangi bir etkisinin olup olmadığı tespit edilmiştir. Termal özellikler difransiyel
taramalı kalorimetresi (DSC), (TA Instruments, Amerika Birleşik Devletleri), kimyasal
özellikler ise Lactostar cihazı (Funke Gerber, Berlin, Almanya). kullanılarak
ölçülmüştür.
Antibiyotik kalıntıları Copan, Penzyme, ROSA süt testleri ve bu hızlı testlerin
doğrulaması için HPLC kullanılarak tespit edilmiştir. Hızlı testlerin bazı dezavantajları
nedeniyle, sıvı kromatografisine sütteki antibiyotik kalıntılarının doğrulaması için gerek
duyulmuştur. Doğrulama için HPLC ile elde edilen geri kazanım sonuçları Penisilin G
için %44.67 - %66.00, Ampisilin için %62.50 - %87.52, Tetrasiklin için %92.86 -
%94.35 değerleri arasında bulunmuştur.
Sütün asitliği, pHsı ve yoğunluğunun Penisilin G, Ampisilin ve Tetrasiklin
konsantrasyonlarından bağımsız olduğu tespit edilmiştir. Elektriksel iletkenlik varyans
analizi ve PNN methodu uygulanarak değerlendirilmiştir. DSC ve lactostar ölçüm
sonuçlarına da varyans analizi uygulanmıştır. Değerlendirmeler, elektriksel iletkenlik
ölçümünün sütte antibiyotik kalıntılarının tespiti için kullanılabileceğini, DSC’nin sütün
ısısal davranışlarının daha iyi anlaşılması için iyi bir karakterizasyon aracı olabileceğini
ve sütteki antibiyotik kalıntılarının varlığının sütün donma noktasını ve % mineral
miktarını etkilediğini göstermiştir.
vi
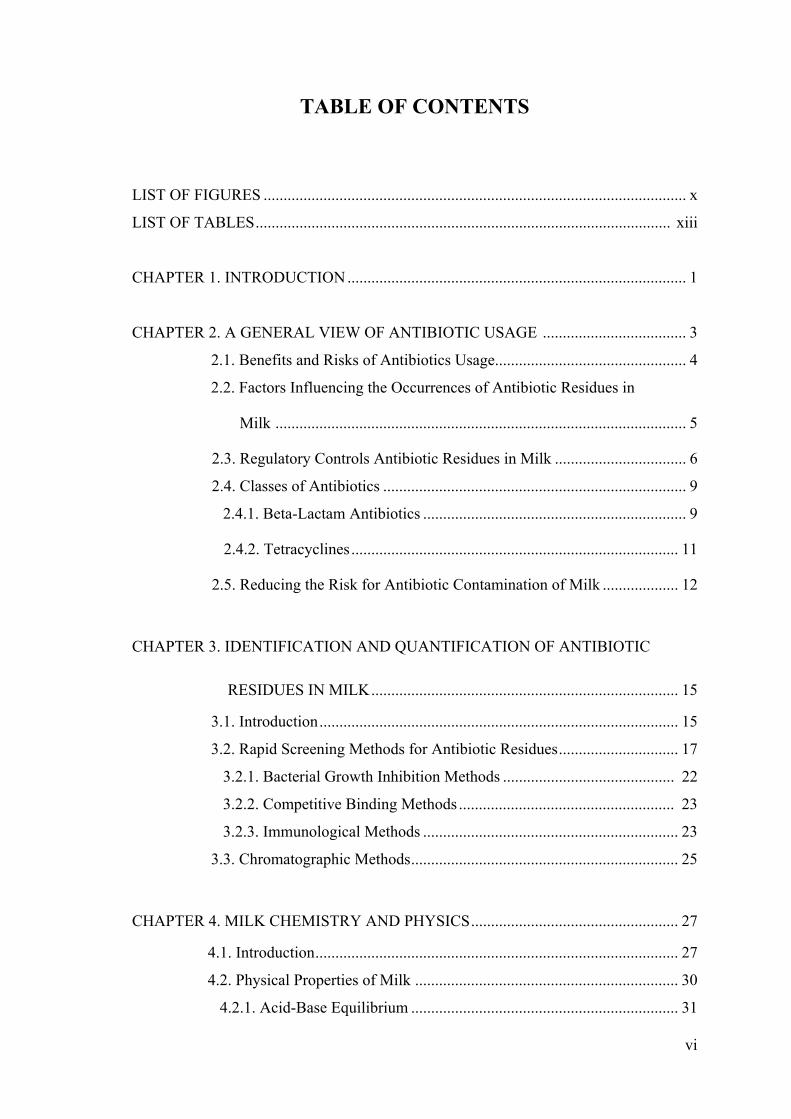
TABLE OF CONTENTS LIST OF FIGURES .......................................................................................................... x
LIST OF TABLES ........................................................................................................ xiii
CHAPTER 1. INTRODUCTION ..................................................................................... 1
CHAPTER 2. A GENERAL VIEW OF ANTIBIOTIC USAGE .................................... 3
2.1. Benefits and Risks of Antibiotics Usage................................................ 4
2.2. Factors Influencing the Occurrences of Antibiotic Residues in
Milk ....................................................................................................... 5
2.3. Regulatory Controls Antibiotic Residues in Milk ................................. 6
2.4. Classes of Antibiotics ............................................................................ 9
2.4.1. Beta-Lactam Antibiotics .................................................................. 9
2.4.2. Tetracyclines .................................................................................. 11
2.5. Reducing the Risk for Antibiotic Contamination of Milk ................... 12
CHAPTER 3. IDENTIFICATION AND QUANTIFICATION OF ANTIBIOTIC
RESIDUES IN MILK ............................................................................. 15
3.1. Introduction .......................................................................................... 15
3.2. Rapid Screening Methods for Antibiotic Residues .............................. 17
3.2.1. Bacterial Growth Inhibition Methods ........................................... 22
3.2.2. Competitive Binding Methods ...................................................... 23
3.2.3. Immunological Methods ................................................................ 23
3.3. Chromatographic Methods ................................................................... 25
CHAPTER 4. MILK CHEMISTRY AND PHYSICS .................................................... 27
4.1. Introduction ........................................................................................... 27
4.2. Physical Properties of Milk .................................................................. 30
4.2.1. Acid-Base Equilibrium ................................................................... 31

vii
4.2.2. Specific Gravity .............................................................................. 33
4.2.3. Electrical Conductivity ................................................................... 34
4.3. Thermo-Physical Properties of Milk ...................................................... 37
4.3.1. Specific Heat .................................................................................... 37
4.4. Chemical Properties of Milk .................................................................. 38
4.4.1. Milk Fat ............................................................................................ 39
4.4.2. Proteins of Milk .............................................................................. 40
4.4.3. Lactose ............................................................................................ 40
4.4.4. Minor Components of Milk ............................................................. 41
4.4.4.1. Vitamins .................................................................................. 41
4.4.4.2. Minerals .................................................................................. 41
4.4.4.3. Enzymes .................................................................................. 41
4.4.4.4. Non-protein Nitrogenous Substances..................................... 42
CHAPTER 5. MATERIALS AND METHODS ............................................................ 43
5.1. Materials ............................................................................................... 43
5.2. Methods ................................................................................................ 44
5.2.1. Copan Milk Test Procedure ............................................................ 44
5.2.2. Penzyme Milk Test Kit Procedure ................................................. 45
5.2.3. ROSA (Rapid One Step Assay): MRL Test Procedure ................. 46
5.2.4. Preparation of Antibiotic Standard Solution ................................... 48
5.2.5. The Acidity Test............................................................................. 48
5.2.6. Determination of pH ...................................................................... 50
5.2.7. Determination of Density ................................................................ 50
5.2.8. Determination of Electrical Conductivity ...................................... 50
5.2.9. DSC Analysis ................................................................................. 51
5.2.10. Yogurt Culture Test ...................................................................... 52
5.2.11. Determination of Fat, Lactose, Minerals, SNF (Fat Free Dry
Matter) and Freezing Point .......................................................... 52
5.2.12. Confirmatory Methods ................................................................. 53
5.2.12.1. Liquid Chromatography Detection of Penicillin G in
Milk .................................................................................... .54
5.2.12.1.1. Reagents, Standards and Apparatus for LC

viii
Analysis ............................................................... 54
5.2.12.1.2. LC Procedure ....................................................... 56
5.2.12.2. Liquid Chromatography Detection of Ampicillin in Milk . 57
5.2.12.2.1. Reagents and Instrumentation for LC Analysis ... 57
5.2.12.2.2. LC Procedure ....................................................... 58
5.2.12.3. Liquid Chromatography Detection of Tetracycline in
Milk .................................................................................... 58
5.2.12.3.1. Chemicals and Apparatus for LC Analysis .......... 58
5.2.12.3.2. LC Procedure ....................................................... 59
5.3. Data Analysis ....................................................................................... 60
5.3.1. Statistical Analysis ......................................................................... 60
5.3.2. The Probabilistic Neural Network (PNN) Method ........................ 60
CHAPTER 6. RESULTS AND DISCUSSIONS ........................................................... 63
6.1. Introduction ........................................................................................... 63
6.2. Initial Screening of Milk Samples ........................................................ 64
6.3. The Acidity, pH and Density of Milk Samples .................................... 65
6.4. The Electrical Conductivity of Milk Samples ..................................... 71
6.5. The DSC Results of Milk Samples ....................................................... 79
6.6. Fat, Protein, Lactose, Minerals, SNF and Freezing Point Results
of Milk Samples ................................................................................... 87
6.7. Confirmation of Target Antibiotics in Milk ......................................... 89
6.7.1. Confirmation of Penicillin G in Milk ............................................. 89
6.7.2. Confirmation of Ampicillin in Milk ............................................... 92
6.7.3. Confirmation of Tetracycline in Milk ............................................. 95
CHAPTER 7. CONCLUSION ....................................................................................... 99
REFERENCES ........................................................................................................ 101
APPENDICES

ix
APPENDIX A. DSC RESULTS OF PENICILLIN G, AMPICILLIN AND
TETRACYCLINE RESIDUES..........................................................109
APPENDIX B. INSIGNIFICANT LACTOSTAR RESULTS......................................114
APPENDIX C. CALIBRATIONS CURVES FOR AMPICILLIN AND
TETRACYCLINE .............................................................................. 115

x
LIST OF FIGURES Figure Page
Figure 2.1. Antibiotic residues detected in milk 1997-2003 by percentage ................... 9
Figure 2.2. Structure of some beta-lactams, Penicillin G and Ampicillin .................... 11
Figure 2.3. Structure of tetracycline ............................................................................. 12
Figure 5.1. Copan milk test results ............................................................................... 45
Figure 5.2. ROSA test design ....................................................................................... 47
Figure 5.3. Visual interpretation of ROSA test ............................................................ 48
Figure 5.4. Titration mechanism ................................................................................... 49
Figure 5.5. DSC mechanism ......................................................................................... 51
Figure 5.6. Lactostar mechanism .................................................................................. 53
Figure 5.7. A typical HPLC system .............................................................................. 54
Figure 5.8. EC data by using PNN method ................................................................... 62
Figure 6.1. Visual interpretation of Copan Milk Test result ......................................... 64
Figure 6.2. Density change vs temperature for antibiotic free milk sample
1 and spiked milk sample 1 ......................................................................... 67
Figure 6.3. Density change vs temperature for antibiotic free milk sample
2 and spiked milk sample 2 ........................................................................ 68
Figure 6.4. Density change vs temperature for antibiotic free milk sample
3 and milk sample 3 containing antibiotic ................................................. 69
Figure 6.5. Density change vs temperature for antibiotic free milk sample
4 and milk sample 4 containing antibiotic .................................................. 70
Figure 6.6. Visual interpretation of Copan Milk Test, Penzyme and ROSA
Test results . ………………………………………………………………71
Figure 6.7. EC of milk samples containing selected concentrations of
Penicillin G, Ampicillin and Tetracycline (samples collected
at different periods of the year) ................................................................... 75
Figure 6.8. Effects of Penicillin G concentration on the thermal parameters
(a) melting temperature, (b) heat of fusion, (c) evaporation
(b) temperature, (d) heat of evaporation of milk samples ........................... 81
Figure 6.9. Effects of Ampicillin concentration on the thermal parameters
(a) melting temperature, (b) heat of fusion, (c) evaporation

xi
(b) temperature, (d) heat of evaporation of milk samples .......................... 82
Figure 6.10. Effects of Tetracycline concentration on the thermal
parameters (a) melting temperature, (b) heat of fusion,
(c) evaporation temperature, (d) heat of evaporation of milk samples ...... 83
Figure 6.11. DSC curves of milk samples containing 0, 2, 4, 8 ppb Penicillin G ......... 84
Figure 6.12. DSC curves of milk samples containing 0, 2, 4, 8 ppb Ampicillin ........... 84
Figure 6.13. DSC curves of milk samples containing 0, 100, 250, 500 ppb
Tetracycline… ........................................................................................... 85
Figure 6.14. Chromatograms of milk sample blank for Penicillin G.............................90
Figure 6.15. Chromatograms of milk sample fortified with Penicillin G at 2 ppb….....90
Figure 6.16. Chromatograms of milk sample fortified with Penicillin G at 4 ppb ........ 91
Figure 6.17. Chromatograms of milk sample fortified with Penicillin G at 8 ppb….....91
Figure 6.18. Chromatograms of milk sample blank for Ampicillin ...............................93
Figure 6.19. Chromatograms of milk sample fortified with Ampicillin at 2 ppb……...93
Figure 6.20. Chromatograms of milk sample fortified with Ampicillin at 4 ppb .......... 94
Figure 6.21. Chromatograms of milk sample fortified with Ampicillin at 8 ppb……...94
Figure 6.22. Chromatograms of milk sample blank for Tetracycline……………........96
Figure 6.23. Chromatograms of milk samples fortified with Tetracycline
at 100 ppb…………………………..………………………...………….96
Figure 6.24. Chromatograms of milk samples fortified with Tetracycline
at 250 ppb ………………………………………………………...….....97
Figure 6.25. Chromatograms of milk samples fortified with Tetracycline
at 500 ppb……………………………………………………………......97
Figure A.1. DSC results of antibiotic free milk sample .............................................. 109
Figure A.2. DSC results of milk sample containing 2 ppb Penicillin G ..................... 109
Figure A.3. DSC results of milk sample containing 4 ppb Penicillin G ..................... 110
Figure A.4. DSC results of milk sample containing 8 ppb Penicillin G ..................... 110
Figure A.5. DSC results of milk sample containing 2 ppb Ampicillin ....................... 111
Figure A.6. DSC results of milk sample containing 4 ppb Ampicillin ....................... 111
Figure A.7. DSC results of milk sample containing 8 ppb Ampicillin ....................... 112
Figure A.8. DSC results of milk sample containing 100 ppb Tetracycline ................ 112
Figure A.9. DSC results of milk sample containing 250 ppb Tetracycline ................ 113
Figure A.10. DSC results of milk sample containing 500 ppb Tetracycline ................ 113
Figure C.1. Calibration plot for Penicillin G for concentration range of

xii
2 ppb - 16 ppb...........................................................................................115
Figure C.2. Plot for 40 ppb Penicillin G standard ...................................................... 115
Figure C.3. Plot for 80 ppb Penicillin G standard ...................................................... 116
Figure C.4. Plot for 160 ppb Penicillin G standard .................................................... 116
Figure C.5. Plot for 320 ppb Penicillin G standard .................................................... 117
Figure C.6. Calibration plot for Ampicillin for concentration range of
2 ppb - 16 ppb..........................................................................................117
Figure C.7. Plot for 2 ppb Ampicillin standard ......................................................... 118
Figure C.8. Plot for 4 ppb Ampicillin standard ......................................................... 118
Figure C.9. Plot for 8 ppb Ampicillin standard ......................................................... 119
Figure C.10. Plot for 16 ppb Ampicillin standard ....................................................... 119
Figure C.11. Calibration plot for Tetracycline for concentration range of
250 ppb-1000ppb ………………………………………………………120
Figure C.12. Plot for 250 ppb Tetracycline standard .................................................. 120
Figure C.13. Plot for 500 ppb Tetracycline standard .................................................. 121
Figure C.14. Plot for 750 ppb Tetracycline standard .................................................. 121
Figure C.15. Plot for 1000 ppb Tetracycline standard ................................................ 122

xiii
LIST OF TABLES Table Page
Table 2.1. MRLs at EU Codex and at Turkish Food Codex. ........................................ 7
Table 3.1. Main requirements for screening methods ................................................ 16
Table 3.2. List of main methods available for screening ............................................ 17
Table 3.3. Milk tests for determining for antibiotic residues ...................................... 19
Table 3.4. Comparison of different tests according to usage ...................................... 21
Table 3.5. Major advantages and disadvantages of ELISA test kits ........................... 24
Table 3.6. Main advantages and disadvantages of HPLC .......................................... 26
Table 4.1. Chemical composition of bovine milk ....................................................... 28
Table 4.2. General physical properties of milk ........................................................... 30
Table 4.3. Degrees of acidity and properties of milk .................................................. 32
Table 4.4. EC of milk, milk fractions and constitutes ................................................ 36
Table 4.5. Chemical composition of milk ................................................................... 38
Table 5.1. Detection limits and MRL’s for Copan Milk Test ..................................... 44
Table 5.2. The colors at the seconding reading .......................................................... 46
Table 5.3. Detection levels in cow’s milk .................................................................. 47
Table 6.1. Copan milk test and yogurt culture test results for milk samples .............. 65
Table 6.2. Acidity and pH results of milk samples ..................................................... 66
Table 6.3. Density results for milk sample 1 .............................................................. 67
Table 6.4. Density results for milk sample 2 .............................................................. 68
Table 6.5. Density results for milk sample 3 .............................................................. 69
Table 6.6. Density results for milk sample 4 .............................................................. 70
Table 6.7. Limits of detection with Copan Milk Test and ROSA Test ...................... 72
Table 6.8. Consistency and pH of milk samples containing selected
concentrations of Penicillin G, Ampicillin, Tetracycline………..........….73
Table 6.9. ANOVA results of EC for milk containing Penicillin G ........................... 76
Table 6.10. ANOVA results of EC for milk containing Ampicillin ............................. 77
Table 6.11. ANOVA results of EC for milk containing Tetracycline .......................... 78
Table 6.12. Influence of antibiotic concentration on the DSC curves of milk
samples with results of Fisher’s, individual error rate, test ....................... 86
Table 6.13. Effect of Pencillin G concentration on the Lactostar result of

xiv
milk samples with using Fisher’s test ........................................................ 88
Table 6.14. Effect of Ampicillin concentration on the Lactostar result of
milk samples with using Fisher’s test ........................................................ 88
Table 6.15. Effect of Tetracycline concentration on the Lactostar result of
milk samples with using Fisher’s test ........................................................ 89
Table 6.16. Recoveries of Penicillin G from fortified milk samples ............................ 92
Table 6.17. Recoveries of Ampicillin from fortified milk samples .............................. 95
Table 6.18. Recoveries of Tetracycline from fortified milk samples ........................... 98
Table B.1. Insignificant Lactostar results .................................................................. 114

1
CHAPTER 1
INTRODUCTION
Antibiotics are widely used in dairy cattle management for the treatment and the
control of diseases, including mastitis, and also used as dietary supplements. The
inadequate usage of antibiotics may results in drug residues passing into milk (Santos,
et al. 2006). Antibiotic residues are undesirable in milk and milk products for a number
of reasons. They can create a negative image of dairy and dairy products (McEwen, et
al. 1991). They may cause allergic reactions in sensitive individuals and their exposure
may lead to an increase in the numbers of resistant to antibiotics individuals. In
addition, antibiotics interference with starter cultures for dairy products and influence
negatively coagulation process (Rinken and Riik 2006).
The withholding period following treatment should not be forgotten to avoid
antibiotic residue in milk by farmers. However, sometimes antibiotic residues can be
contained in milk over withdrawal times, causing positive test results for antibiotic
residues (Kang, et al. 2005). Antibiotic residues in milk are an increased risk. The
frequent use of part-time employees, use of medicated feeds, failure to use separate
equipment to milk treated cows and use of parlor milking systems are farm management
factors that have been associated with this risk (McEwen, et al. 1991). To protect the
consumer, the EU Maximum Residue Limits (MRLs) for veterinary medicinal products
in milk have been established by the EU Council Regulation (EEC) No: 2377/90
(Zvirdauskiene and Salomsskiene 2007) and the residue levels of veterinary drugs in the
raw and drinking milk must not exceed the limits stated in the 6th part of Turkish Food
Codex Regulation No: 2002/30 (KKGM 2008).
Residue analysis includes both screening and confirmatory methods. Present
methods for the detection of antibiotic residues involve microbial like microbial growth
inhibitor tests, microbial receptor assays, enzymatic assays, immunologic assays or
receptor-based methods and chemical-physical methods such as spectrophotometric,
chromatographic, and fluorimetric methods (Le Breton, et al. 2007). The available
microbiological tests are relatively slow and nonspecific for a one antibiotic,
considering immunoassays that are usually quite expensive. Some of the screening
methods are characterized as being rapid, with high throughput, being rugged,

2
inexpensive and sensitive but sometimes they give false negative or false positive
results (Teagasc 2004). Disadvantage of the chemical-physical methods such as HPLC
and mass spectroscopy contain complex steps, small amount of samples analyzed per
time unit, and the need for trained personnel with high expertise (Rinken and Riik
2006). The best in residue analysis is for methods that have all the necessary quality
attributes which can measure a wide range of veterinary drug residues directly in the
food and which can produce results immediately and for a definitive nature. Therefore,
a simple, fast, inexpensive and sensitive analytical procedure to detect antibiotic
residues in milk is needed (Teagasc 2004). The development of biosensors has a
significance potential to provide this demand. Biosensor gives results in less time. The
preliminary preparation of the samples is not required. They have high selectivity and
sensitivity properties (Rinken and Riik 2006).
The origin of idea of this work is based on an interest to find a basic and rapid
method which is going to be a basis for development of a biosensor for detection of
antibiotic residues in milk and milk products. For this purpose an investigation was
conducted to screen some of the physical (e.g. acidity, pH, density, freezing point and
electrical conductivity), thermo-physical (e.g. melting temperature, heat of fusion,
evaporation temperature and heat of evaporation) and chemical properties (e.g. fat%,
protein%, lactose%, minerals%, SNF%) of milk containing antibiotics in UHT whole
cow’s milk. This study also includes comparison of available methods for detection of
antibiotic residues in milk and assessment of advantages and disadvantages of each
method. For this purpose, Penicillin G (at concentrations of 2, 4, 8 ppb), Ampicillin (at
concentrations of 2, 4, 8 ppb) and Tetracycline (at concentrations of 100, 250, 500 ppb)
were chosen as a target antibiotics in this study. All of the measurements were
conducted both on the whole milk containing these antibiotics and on whole milk free
from antibiotics used as a control.

3
CHAPTER 2
A GENERAL VIEW OF ANTIBIOTIC USAGE
All of the health programs on television and newspapers have made the general
public much more aware of food safety issues. Chemical and bacterial contamination of
foods may happen at any phase of food production and may have harmful consequences
for consumers. In other words, a trader can suffer great financial losses or maybe
remove if his products are found to be contaminated (Hall, et al. 2003).
The development of an extent of agrochemical and veterinary drugs, drawing
attention of agricultural production and increase in industrialization are considered
environmental contamination points with respect to an increased exposure of the
consumer to chemical residues from food and other sources (O’Keeffe and Kennedy
1998). The consumer looks increasingly for “pure” food. In regard to residues in food,
the attention is increasingly towards natural or “organic” systems for food production
(O’Keeffe and Kennedy 1998).
Antibiotics are molecules that stop microbes (both bacteria and fungi) from
growing or killing them (Al-Jabri 2005). Generally, antibiotics have been used by
farmers and veterinarians to control and treat of infectious diseases of dairy cattle
(Albright, et al. 1961), by aiding in prevention of diseases and by enhancing the
performance of animals maintained in production agriculture. The major benefits
resulting from the use of low levels of antibiotics in animal production are economic.
Antibiotics are used in this way to increase the rate of weight gain and/or improve feed
efficiency in cattle breeding (Gustafson and Bowen 1997).
Mastitis was the first disease of dairy cattle to be treated with antibiotics (Ruegg
2005, Milner, et al. 1997). Antibiotics are implemented to dairy cattle by the way of
several routes: (1) infusion into the udder for the treatment of mastitis, (2) injection for
the treatment of numerous diseases and (3) orally for treatment or prevention of diseases
or as a dietary supplement. Antibiotics in milk are mainly the result of improper use of
mastitis infusion preparations, or of failure to confirm to the instructions on label, to the
effect that milk from treated quarters be discarded or used for purposes other than
human consumption (Albright, et al. 1961).

4
2.1. Benefits and Risks of Antibiotics Usage
Antibiotic residues are undesirable in milk and milk products for public health
reasons and because of their potential impact on manufacturing process (Ruegg and
Tabone 2000, Yamaki, et al. 2004). They can create a negative image of dairy and dairy
products in the eyes of the public (McEwen, et al. 1991, Ruegg and Tabone 2000). The
presence of antibiotic residues in milk was considered primarily a manufacturing
problem related to inhibition of dairy starter microorganisms and cause economic losses
to the cheese and fermented milk industries (Al-Jabri 2005, Kang’ethe, et al. 2005).
Hence, it would be regarded in many countries as ‘adulterated’ and a public health risk,
if the milk is to be processed for direct retail sale or into milk powder or some other
product (Yamani, et al. 1999).
The presence of antibiotics in milk has been prohibited, due to the fact that they
are sometimes associated with adverse effects on host which comprise hypersensitivity,
depletion of beneficial gut and mucosal microorganisms, immunosuppression and
allergic reactions (Al-Jabri 2005). Penicillin in very small concentrations found in milk
may cause allergic reactions in highly sensitive individuals (Albright, et al. 1961, Chenh
Chen and Chain Chang 1994) after ingestion, including skin rashes, asthma,
anaphylactic shock and even death (Yamani, et al. 1999). Minute amounts of drug
residues can be carcinogenic, teratogenic, mutagenic cause enzyme induction and
inhibition and interact with other environmental chemicals (Seymour, et al. 1988).
Beforehand, certain antibiotics used in animal farming are now prohibited for use in
food-producing animals; chloramphenicol, because of its potential toxicity for sensitive
humans, and the nitrofurans, because of their mutagenic, carcinogenic and bound-
residue characteristics (O’Keeffe and Kennedy 1998).
Furthermore, any exposure of the intestinal micro flora of humans to antibiotics
may lead to an increase in the numbers of antibiotic-resistant species present (Yamani,
et al. 1999, Adesiyun and Webb 1997). If some of these are pathogenic, they could have
dreadful consequences (Yamani, et al. 1999). Fermented milk products use lactic starter
cultures, and these bacteria enter into our intestines in large numbers where they interact
with the intestinal micro flora. Commercial introduction of probiotics including
antibiotic resistance strains may also have negative consequences, for example, when
resistance is transferred to intestinal pathogens (Mathur and Singh 2005). Some

5
antibiotics are directly toxic, e.g. chroramphenicol which destroys blood-forming tissue.
Allergic reactions and toxic side effects may have fatal results (Hall, et al. 2003).
Dairy manufacturing companies which are more directly affected than others by
the presence of antibiotics in milk are those that produce fermented milk products.
Cheese production is depending on lactate fermentation. All bacterial organisms which
are included in the production of fermented milk products show varying degrees of
inhibition of growth in the presence of the different antibiotics. Cheese manufacture is
dependent on the rate of acid development as well as the total amount produced. If
either rate or total quantity of acid is reduced from the optimum, the quality of cheese
suffers. Active starter cultures are the key to successful manufacture of fermented dairy
products. If they are inoculated into milk which contains traces of antibiotic residues,
suitable or active cultures can not be maintained. Such contaminated milk constitutes a
great economic risk. Producer would be required to withhold when following
withholding recommendations. If it is used in their manufacture, milk which contains
antibiotic residues will contaminate other dairy products. If the milk is dried,
evaporated, or made into ice cream, the antibiotics is concentrated in these products.
Despite the fact that no manufacturing problems result from the presence of antibiotics
in the above-mentioned products, a consumption or use problem is obvious (Albright, et
al. 1961).
2.2. Factors Influencing the Occurrences of Antibiotic Residues in Milk
Antibiotic residues pass into the milk supply at the farm level and milk
producers themselves bear the final responsibility for selling antibiotic residue free
milk. It is important that producers understand the factors that lead to antibiotic residues
in milk and how these residues can be prevented. A survey of farms in the United
Kingdom was conducted by Booth and Harding, the three most common reasons for
residue occurrences suggest by farmers were failure to withhold milk for the proper
length of time, accidental transfer of milk from treated cows to bulk tanks, and
prolonged excretion of drug from treated cows. A mail survey of Michigan farmers with
positive and with negative bulk milk antibiotic residue tests was conducted by Kaneene
and Ahl. Milk residues were associated with each of the following: increasing frequency
of use of medicated feed, herd size, and numbers of hired persons. Farmers in the

6
Michigan study thought that the most important management factors leading to drug
residues were insufficient knowledge about drug withdrawal periods, errors due to hired
help, insufficient records of treatment and identification of animals (McEwen, et al.
1991, Jones 1999).
Researches have indicated that farmers sometimes forget to withhold milk from
treated cows for the proper time, but other mistakes, such as withholding of milk only
from treated quarters while placing milk from untreated quarters into the bulk tank,
have also been described. Farm management factors that have been associated with an
increased risk of residues in milk involve the frequent use of part-time employees, use
of medicated feeds, use of parlor milking systems, and failure to use separate equipment
to milk treated cows (McEwen, et al. 1991, Gustafson 1991).
2.3. Regulatory Controls Antibiotic Residues in Milk
Milk producers must guarantee their milk. It must not contaminated by any
veterinary drugs from the list of prohibited antimicrobials or the levels of these
materials are lower than the Maximum Residue Limits (MRLs) (Zvirdauskiene and
Salomsskiene 2006). MRLs are considered that the drug may be safely used without
harming the consumer (Hall, et al. 2003).
There are two interpretations of residues in food. These are Maximum Residue
Limits (MRLs) and Acceptable Daily Intake (ADI) values. The MRL is the maximum
concentration of a residue. It was expressed as mg per kg food, legally permitted in or
on food commodities and animal feeds. MRL values for a residue are particular to each
food or food type. The Acceptable Daily Intake (ADI) value is an estimate of the
amount of residue. It was expressed as mg per kg body weight that can be ingested daily
over a lifetime without appreciable health risk. The ADI is based on a toxicological
evaluation, under a range criteria, of the chemical and is based on the no-adverse-effect
level in test animals and contains safety factors to account for inter-species differences
(normally x 10) and differences between humans (normally x 10), such as vulnerable
(sick) individuals, infants, elderly, etc (O’Keeffe and Kennedy 1998).
The Codex Alimentarius Commission of the Food and Agriculture Organization
(FAO) and World Health Organization (WHO) of the United Nations stated in 2001 that
the scientific literature for effects of processing on drug residues in milk is insufficient

7
to permit clear determination of the effect, if only, that processing may have on the level
of most drug residues that could occur in milk and that additional studies are needed in
this area (Grunwald and Petz 2003).
The EU Maximum Residue Limits (MRLs) for veterinary medicinal products in
milk were established by Council Regulation (EEC) No.2377/90 (Zvirdauskiene and
Salomsskiene 2006). The residue levels of veterinary drugs in the raw and drinking milk
must not exceed the limits stated in the 6th part of Turkish Food Codex Regulation
No:2000/6 (ABGS 2008), (Table 2.1).
Table 2.1. MRLs at EU Codex and at Turkish Food Codex
(Source: Copan Sciences Literature 2008)
Antimicrobial Agents
EU / Codex
MRL[1]
(ppb)
Turkish Food
Codex MRL
(ppb)
Beta-lactams
Penicilin G 4 4
Ampicillin 4 4
Amoxicillin 4 4
Cloxacillin 30 30
Dicloxacillin 30 30
Oxacillin 30 30
Naficillin 30 30
Ceftiofur[2] 100[3] 100
Cefquinom[7] 20 20
Cefapirin 10 10
Cefoperazon 50 50
Cefalexin 100 100
Cefazolin 50 50
Tetracyclines
Chlortetracycline[2] 100[4] 100
Oxytetracycline[2] 100[4] 100
(Cont. on next page)

8
Table 2.1 (cont.). MRLs at EU Codex and at Turkish Food Codex
(Source: Copan Sciences Literature 2008)
Tetracycline[2] 100[4] 100
Doxycycline[2] 100[4] 100
Sulphonamides
Sulfathiazol 100[6] 100
Sulfamethazine[5] 100[6] 100
Sulfadioxine 100[6] 100
Sulfadimethoxin 100[6] 100
Sulfadiazin 100[6] 100
Sulfamethoxazole 100[6] 100
Sulfamonometossina 100[6] 100
Aminoglycosides
DH-Streptomycin 200 200
Streptomycin 200 200
Neomycin 500 500
Gentamicin 100 100
Spectinomycin 200 200
Macrolides
Erythromycin 40 40
Spiramycin 200 200
Tylosin 50 50
Tylmicosin 50 50
Other antibiotics
Dapson 0[7] 0
Trimethoprim 50 50
Tiamfenicol 50 50
Chloramphenicol 0[7] 0
1. Regulation 2377/90 ff EEC 5. Sulfadimidine
2. Mother compound 6. Sum of all substances of this group
3. Mother compound and metabolites 7. Not allowed
4. Mother compound and 4-epimer

9
2.4. Classes of Antibiotics
Some of the more important classes of veterinary drugs are sulphonamides, β-
lactams (e.g. penicillin), tetracyclines, aminoglycosides (e.g. streptomycin), macrolids
(e.g. erythromycin), peptide antibiotics (e.g.virginiamycin) and ionophores (e.g.
monensin) (O’Keeffe and Kennedy 1998).
Beta-lactams (combined total beta-lactams and cloxacillin, 70), followed by
tetracyclines (40) and gentamycin/neomycin-type aminoglycosides (40) were recorded
by means of analysis, in other words, positive results (Figure 2.1).
Figure 2.1. Antibiotic residues detected in milk 1997-2003 by percentage
(Source: Hall, et al. 2003)
2.4.1. Beta-Lactam Antibiotics
Antibiotics of the beta-lactam group are extensively used for treatment of
bacterial infections. They are the preferred drugs for the treatment of clinical mastitis in
dairy cows. In a corresponding manner, beta-lactams comprise the major source of
antibiotic residues in milk (Lamar and Petz 2007).
The beta-lactam antibiotics (namely Penicillin-G, Amoxicillin, Ampicillin and
Cloxacillin), also known as penicillin, are widely used in veterinary medicine. The

10
presence of beta-lactam residues in food may be responsible for allergic reactions in
sensitive individuals. The beta-lactam ring system, a highly strained and reactive cyclic
amide featured by these antibiotics. The beta-lactam ring system makes them
susceptible to a variety of degradative processes. Reaction with hydroxide ion opens up
the beta-lactam ring to produce an inactive compound. Also, beta-lactams are acid
sensitive, and degrade at low pH by a more complex mechanism. Alcoholic solutions of
these antibiotics are therefore unstable due to the acidic character of alcohols. Polarity is
highly dependent on the nature of the group attached to the ring (Santos, et al. 2006).
Penicillins are a class of beta-lactam antibiotics and also a group of antibacterial
compounds inhibiting bacterial cell wall synthesis. They are highly sensitive to heat,
acids and penicillinases. The degradation of penicillins is affected by different factors
like temperature, pH, ionic strength, metal ions, degree of crystallinity, solvent
composition (Michnik, et al. 2004).
In addition, penicillins are one of the oldest groups of antibiotics. They still use
extensive clinical utility. One major area is the treatment of bovine mastitis which
causes in Germany a yearly economic damage of about € 1 billion per year according to
an estimation of the German Veterinary Society. Penicillins are not inherently very
toxic. However, they can produce strong allergic reaction in sensitized humans and
concentrations above the MRL inhibit bacteria used in the fermentation process
employed by the dairy industry. Little, however, is known about the effect food
technological processing on the destruction of penicillin residues in milk or other
matrices (Grunwald and Petz 2003).
The name “penicillin” can also be used in reference to a specific member of the
penicillin group. All penicillins possess the basic Penam Skeleton, which has the
molecular formula R-C9H11N2O4S, where R is a variable side chain (Figure 2.2),
(Ashnagar and Gharib 2007).
Ampicillin is a beta-lactam antibiotic that has been used widely for treatment of
bacterial infections since 1961. It can sometimes cause allergic reactions. Ampicillin,
belonging to the group of beta-lactam antibiotics, is able to penetrate gram-positive and
some gram-negative bacteria (Ashnagar and Gharib 2007).

11
Figure 2.2. Structure of some beta-lactams, Penicillin G and Ampicillin
(Source: Kennedy, et al. 1998)
2.4.2. Tetracyclines
Tetracyclines are broad-spectrum antibiotics, such as tetracycline (TC),
chlortetracycline (CTC), doxycycline (DTC), and oxytetracycline (OTC), (Charoenraks
T. 2005). Tetracyclines have been used for more than 50 years for the treatment of
mastitis and are added to cattle feeds to increase growth rates (Santos, et al. 2006).
These uses have the potential to result in the presence of tetracycline residues in
milk, if these antibiotics have been improperly administrated or if the withdrawal time
for the treated cows has not been observed. Tetracycline residues in milk may stimulate
harmful effects on humans, such as allergic symptoms, liver damage, yellowing of
teeth, and gastrointestinal disturbance because of the selective pressure of antibiotics on
human gut micro flora or may lead to financial losses in the dairy industry by inhibiting
starter cultures in food technological processes (Reid, et al. 2006). Moreover, trace

12
amounts of antibiotic residues in milk favor the development of antibiotic-resistant
bacteria (Fritz and Zuo 2007).
Figure 2.3 shows the chemical structures of tetracycline. However not only the
concentration of tetracycline residues but also their degradation products, in animal
fluids and tissues are significant in understanding the potential effects of tetracycline
antibiotics on human and animal health (Fritz and Zuo 2007).
Figure 2.3. Structure of tetracycline
(Source: Kennedy, et al. 1998)
2.5. Reducing the Risk for Antibiotic Contamination of Milk
It is significant for dairy producers and dairy veterinarians to understand the
terms and fundamentals concern related to antibiotic use in dairy cattle. Discussion of
these factors will help the dairy industry take a leading role in making responsible
antibiotic use decisions and laws for dairy cattle (Callan 2000).
Definite precautions, such as the use of residue test kits, using separate milking
equipment, taking special care when part-time employees must be used, and increasing
farmer knowledge of drug residues, can decrease the possibility of residues occurrence
(McEwen, et al. 1991).

13
The HACCP program for antibiotic avoidance, the Milk and Dairy Beef Quality
Assurance Program (MDBQAP), has been developed in cooperation by the American
Veterinary Medical Association and the National Milk Producers Federation. The
program defines 10 critical control points for preventing antibiotic residues. These 10
points concentrate initially on disease prevention and management of antibiotics and
treated cows, in spite of the fact that one point is to use screening tests for drug residues.
The producer manual for the MDBQAP suggests that simply following label
recommendations on milk withholding times ensures a safe product; yet, when
antibiotics are used in an extra label manner, screening tests for drug residues should be
used if such tests are available (Sischo 1996).
The use of antibiotic residue screening tests and implementation of good
management practices on dairy farms have been positively correlated with reductions in
the occurrence of antibiotic residues in milk. In recent times, for a reduction in the risk
of residue violations, antibiotics residue screening tests for evaluating individual cow’s
milk have been used. Additionally, the Milk and Dairy Beef Residue Prevention
Protocol of the Dairy Quality Assurance Program suggests that milk from individual
cows be tested for antibiotic residues following extra-label use of an antibiotic. Testing
milk from antibiotic-treated cows following an appropriate milk-withholding period
allows the dairy producer to make informed decisions about milk withholding and
reduces the risk of antibiotic contamination of commingled milk (Andrew 2000).
Several surveys have reported that false-positive results occurred on samples
containing no antibiotic residues in the tests. High levels of natural inhibitors are
present in mastitic milk and in colostrums. They can cause false-positive results in the
microbial growth inhibition assays. Drugs are widely used in the treatment of various
bacterial infections, including mastitis. The recommended withholding period following
treatment should be followed to avoid drug residue in milk. However, sometimes
antibiotic residues can be not only involved in milk over withdrawal times but also
resulting in positive test results for antibiotic residues. Besides, natural inhibitors in the
milk of cows with mastitis are increased and kept at high concentrations for several
days. The increased natural inhibitors can cause false-positive results in the use of
bioassays based on bacterial growth inhibition on the milk samples over withdrawal
times. Hence, it is important to evaluate that the positive results in milk over withdrawal
times are lead to by drug residues or natural inhibitors (Kang, et al. 2005).

14
If farmers and processors are educated about the potential hazards associated
with antibiotic residues in foods of animal origin, antibiotic residues can be prevented
from entering the food chain at the producer level. Processors and producers should also
be made aware of the financial losses. There are now several programs in the USA and
Europe which make use of HACCP principles in quality management systems for
farms, e.g. Milk & Dairy Beef Quality Assurance Program Milk and Dairy Beef
Residue Prevention Protocol. In this program, the farmer works closely with a
veterinarian and follows a 10-step process to minimize the risk of antibiotic residues
entering the food chain (Hall, et al. 2003).
The Food and Drug Administration has begun a three-phase educational program
to eliminate antibiotics from the milk supply: (1) education of the dairy farmer,
educational programs participated in by veterinarians, dairy inspectors and sanitarians,
dairy school, and government can be helpful, but especially dairymen (2) issuance of a
warning statement (3) reduction in concentration of antibiotic in treatment of mastitis
(Albright, et al. 1961).
Restricted sales of antibiotics for treatment and control of mastitis might reduce
antibiotic contamination of milk. In identification of this problem, English authorities
recently restricted antibiotics for animal use to veterinarians only. Penicillin,
chlortetracycline, oxytetracycline, streptomycin, and chloramphenicol in milk are
relatively stable to pasteurization temperatures and above. It would be desirous to know
the effects of ultra-high heat treatment of milk for relatively short periods of time on
antibiotics present in milk. When antibiotics were kept at low temperatures (0 to 10 ° F)
for periods up to 12 wk., the property of the antibiotic to prevent normal growth of
lactic starter culture was not changed. Milk from treated cows when added to the central
milk supply would be diluted to the extent that there would not be any difficulty for
consumption purposes or in the manufacture of cultured products. If whole milk
containing antibiotics is separated into cream and skim milk components,
concentrations of either penicillin or streptomycin are equal in the two fractions. Several
substances have been found to inactivate penicillin. One of these is hydroxylamine. It
was effective but could not be advised for practical purposes, because it is slight
toxicity. The taka-diastase and amylase, both derived from an Aspergillus strain, were
able to inhibit penicillin activity (Albright, et al. 1961).

15
CHAPTER 3
IDENTIFICATION AND QUANTIFICATION OF
ANTIBIOTIC RESIDUES IN MILK
3.1. Introduction
The objective of this chapter includes comparison of available methods for
detection of antibiotic residues in milk and assessment of advantages and disadvantages
of each method.
Antibiotic residues determination in the food is significant to be sure the quality
and safety of the foodstuff. There are a number of different techniques for detection of
antibiotic residues in milk (Molina, et al. 2003). Generally, antibiotic residue analysis
contains not only screening but also confirmatory methods. For screening, several
commercially available test kits are marketed for antibiotic residue detection in milk.
They neither are nor equal in terms of lowest detection limit, repeatability or specificity.
The screening methods are inhibitory tests, receptor assays or immunoassays and
confirmatory methods, such as chromatography with UV, fluorescence or mass
spectrometry detection (Le Breton, et al. 2006, Setford, et al. 1999). Rapid screening
tests are widely used to detect the presence of antibiotic residues in milk but more
accurate chromatographic methods are required by government regulatory agencies to
identify and confirm identity and quantity of antibiotic residue present. On the other
hand, in spite of the advantages, there are some drawbacks of screening tests. They can
not determine which antibiotics are present in the milk. The outcomes of many of these
tests are false-positive or false-negative. For instance, the presence of high somatic cell
counts results in false positives. In contrast to chromatographic methods, they may
detect antibiotic residues at levels far below the safe levels (Schenck and Callery 1998).
False-positive test kit results might lead to unjustified waste of milk and several
economic losses. The data on a rate of true false-positive tests or data on how much
milk was discarded because of false-positive test results was not been able to found.

16
This case can affect the dairy industry negatively. Since false-positive results create
negative image among consumers, producers, veterinarians and regulatory personnel
because of screening inadequately for safety (Coffman, et al. 1999).
For these reasons, more sensitive and specific analytical methods are required.
Most commonly, liquid chromatography (LC) and gas chromatography (GC) are the
techniques used (Schenck and Callery 1998). These methods are extremely sensitive
and validate the presence of antibiotic residue structure and also their concentrations
(Coffman, et al. 1999). Costly in time, equipments and chemicals are drawbacks of the
full procedure and the methodologies for confirmatory analysis. Besides, they require
trained personnel with high expertise. A large number of samples, with a variety of
analysts, to be analyzed in relatively short periods of time must be conducted by control
laboratories. Thus, there is a requirement for screening methods that allow the analysis
of such a large number of samples in short periods of time. In other words, high
through-put methods with low cost must be available. These methods must be able to
detect class of analysts at the level of interest (Van Peteghem, et al. 2001). The main
requirements for a screening method are displayed in Table 3.1.
Table 3.1. Main requirements for screening methods
(Source: Toldra and Reig 2006)
Requirements
Easy to use
Low set-up costs
High through-put
Reduced time and low running costs for results
Sensitivity (no positives are lost)
Specificity (minimum number of false positives)
Repeatability
Another screening method is the immunological methods involve in ELISA test
kits. There are several commercial kits available. Other immunological methods are
depended on radioimmunoassay. Moreover, biosensors associated with immunological
methods are available. There are two types of chromatographic methods. These are
17
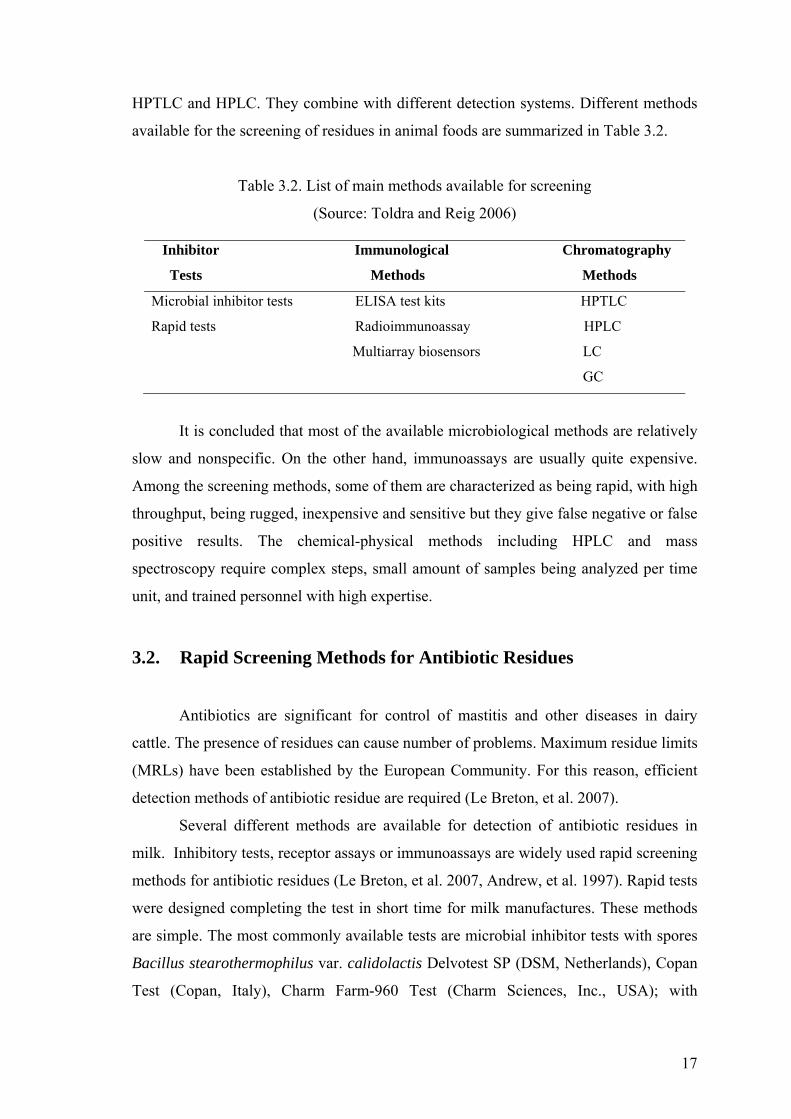
HPTLC and HPLC. They combine with different detection systems. Different methods
available for the screening of residues in animal foods are summarized in Table 3.2.
Table 3.2. List of main methods available for screening
(Source: Toldra and Reig 2006)
Inhibitor Immunological Chromatography
Tests Methods Methods
Microbial inhibitor tests ELISA test kits HPTLC
Rapid tests Radioimmunoassay HPLC
Multiarray biosensors LC
GC
It is concluded that most of the available microbiological methods are relatively
slow and nonspecific. On the other hand, immunoassays are usually quite expensive.
Among the screening methods, some of them are characterized as being rapid, with high
throughput, being rugged, inexpensive and sensitive but they give false negative or false
positive results. The chemical-physical methods including HPLC and mass
spectroscopy require complex steps, small amount of samples being analyzed per time
unit, and trained personnel with high expertise.
3.2. Rapid Screening Methods for Antibiotic Residues
Antibiotics are significant for control of mastitis and other diseases in dairy
cattle. The presence of residues can cause number of problems. Maximum residue limits
(MRLs) have been established by the European Community. For this reason, efficient
detection methods of antibiotic residue are required (Le Breton, et al. 2007).
Several different methods are available for detection of antibiotic residues in
milk. Inhibitory tests, receptor assays or immunoassays are widely used rapid screening
methods for antibiotic residues (Le Breton, et al. 2007, Andrew, et al. 1997). Rapid tests
were designed completing the test in short time for milk manufactures. These methods
are simple. The most commonly available tests are microbial inhibitor tests with spores
Bacillus stearothermophilus var. calidolactis Delvotest SP (DSM, Netherlands), Copan
Test (Copan, Italy), Charm Farm-960 Test (Charm Sciences, Inc., USA); with

18
Streptococcus thermophilus-Valio T 101-test, Valio T 102-test (Valio, Finland);
enzymatic tests- Penzyme, Penzyme S (UCB Bioproducts, Belgium); immunological
tests- Delvo-X-Press β-Lactam (DSM, Netherlands), β-STAR (USB Bioproducts,
Belgium), ROSA test (Charm Sciences, Inc.,USA). The brief scheme of the inhibitor
tests is presented in Table 3.3.

19
Table 3.3. Milk tests for determining for antibiotic residues
(Source: Zvirdauskiene and Salomskiene 2007)
Type of Test Producer Principle of Inhibitors detected and
Test Method sensitivity
Microbial inhibitor Delvotest SP DSM, Microbiological method with Penicillin G 0.003-0.004IU
tests Netherlands Bacillus stearothermophilus /ml, ampicillin 0.003-0.005
var. calidolactis C 953 spores ,sulfamethazine 0.1-0.2 µg/
ml and others
LPT State Laboratory Microbiological method with Penicillin G 0.004±0.001
For Milk Control B. stearothermophilus var. IU/ml, sulfamethazine not
Lithuania calidolactis C 953 spores < 1µg/ml, dapsone not <
0.003 µg/ml
MaI-1 KTU Food Inst. Microbiological method with Penicillin G 0.004±0.001
Lithuania B. stearothermophilus var. µg/ml, sulfamethazine not
calidolactis C 953 spores < 1µg/ml, dapsone not <
0.003 µg/ml
Copan Single Copan, Italy Microbiological method with Penicillin G 0.002±0.001
Test P&S 100 B. stearothermophilus var. µg/ml, sulfamethazine 0.15
calidolactis C 953 spores ±0.05µg/ml,dapsone 0.003
±0.001 µg/ml and others
Valio T 101 Valio, Microbiological method with Penicillin G 0.004+0.001
Test Finland Streptococcus thermophilus IU/ml, tetracyline-more
than 0.2+0.1 µg/ml,
sulfadimidine 1±0.5 µg/ml
and others
Rapid tests Delvo-X DSM, Receptor-ezyme assay Penicillin G 0.002 µg/ml;
-PREES Netherlands ampicillin 0.004 µg/ml,
β-II amoxicyllin 0.004 µg/ml
and others
SNAP test IDEXX Lab. Enzyme immunoassay Penicillin G 0.004 µg/ml;
Inc. USA ampicillin 0.004 µg/ml,
amoxicyllin 0.004 µg/ml
and others
ROSA test Charm Sci. Receptor assay Penicillin G 0.004 µg/ml
Inc., USA and others
Penzyme S UCB Enzymatic method Penicillin G 0.005-0.006
Bioproducts IU/ml
Belgium
β-STAR UCB Immuno/receptor assay Penicillin G 0.003-0.001

20
The tests were evaluated in terms of the test procedures, the shelf life of the test,
ability for use at laboratories and other features of the tests. These features of tests were
established by EN ISO 13969:2004 [(Milk and milk products-Guidelines for a
standardized description of microbial inhibitor tests (ISO 13969:2003)] and EN ISO
18330:2004 [(Milk and milk products-Guidelines for the description of immunoassays
or receptor assays for the detection of antimicrobial residues (ISO 18330:2003)]. The
short and brief evaluation of the test procedures is displayed on Table 3.4.

21
Table 3.4. Comparison of different tests according to usage
(Source: Zvirdauskiene and Salomskiene 2007)
Type of test Test Incubation temperature
Incubation time Notes
Microbial inhibitor Tests Rapid tests
LPT
MaI-1
Copan
Valio T 101
Penzym S
SNAP
ROSA
63.5 °C ± 0.5 °C 63.5 °C ± 0.5 °C 64.5 °C ± 0.5 °C
42 °C ± 1 °C
47 °C ± 0.5 °C
45 °C ± 5 °C
56 °C ± 1 °C
4 h 15 min- 4 h 30 min
4 h 15 min- 4 h 30 min
3 h
4 h 30 min
25 min
10 min
8 min
One multiple for 96 samples. Duration of test is long but test is sensitive for many groups of inhibitory substance. Short shelf life 5 days from the date of manufacture. Suitable for screening of milk in a big laboratory One test tube for 1 sample. Duration of test is long but test is sensitive for many groups of antibacterial substances. Shelf life 3 months from the date of manufacture. Suitable for single samples. Test is sensitive for some groups of antibacterial substance but for the smaller number of them than LPT and MaI-1. It is simple to use and read the result. Suitable for single samples. Shelf life 12 months. It is necessary to heat milk for 5 Min at 92°C ± 2 °C before testing. The heating takes an additional time. Reagent No.1 is colourless so after adding 10 µl of it into eppendorf type vial it is diffucult to catch sight of it in the vial. It takes time to divide the tablets of Reagent 2 into the vials. The reading of results should be performed quickly. This method is not suitable for testing a large number of samples (>10) at once. It is important to press the activator at the proper moment. The test is appropriate for a small number (2-4) of samples. It can be diffucult to read the results because of the similarity of the control and test sample spots. The use of ROSA reader is recommended because, without it, it can be diffucult to determine which strip (test or control) is more intense.

22
3.2.1. Bacterial Growth Inhibition Methods
Bacterial growth inhibition method is one of the detection methods for antibiotic
residue in milk. In the early 1940s, Bacillus subtilis was the target organism but
nowadays methods have been developed that based on Bacillus stearothermophilus
inhibition. Bacterial growth inhibition can be determined qualitatively and
quantitatively. Generally, these method have been used for beta-lactams especially
penicillin. For quantitative determinations of microbial inhibition methods; after
incubation for the appropriate time, zones are measured. Firstly, zone of definite amount
of penicillin is determined and then compared the sample zones. If the presence of
penicillin wants to be confirmed, penicillinase (beta-lactamase), is an enzyme that
inactivates penicillin specifically, is added to the sample (Hui 1993).
In the qualitative B. stearothermophilus var. calidolactis disc assay method,
there is reference plate. This reference gives a definite zone of inhibition. All of the
plates are incubated at appropriate temperature and time. According to the zone size, the
presence of penicillin is determined. No zone of inhibition around the sample means
beta-lactam negative (Hui 1993).
In addition, commercial methods are available. During growth, B.
stearothermophilus var. calidolactis produces acid. Indicator dye changes in the
absence of antibiotic residues. If the bacteria do not grow and produce acid, colour
change can not be observed. This means inhibitors are present (Hui 1993).
There are lots of microbial inhibitor tests produced by several companies. These
are the Brilliant Black Reduction Test, the Valio T101 test, the Copan microbial
inhibitor test, Delvotest SP-NT, MaI-1, the LPT, ROSA test, β-STAR, the Lumac rapid
antibiotic test, the Arla micro test and Biosys bioluminescence method. However, each
of these tests is not available in all of the countries. Countries are not interested in all of
them (Neaves 1999). Copan Milk Test and Delvotest SP-NT are new developed
inhibition assays. Delvotest SP-NT is related to Delvotest SP and Delvotest Milk
Control Stations (MCS) but with nutrients pre-incorporated in the agar. A nutrient table
is not required. The Copan Milk Test has also the nutrient pre-incorporated in the agar
(Le Breton, et al. 2007).

23
3.2.2. Competitive Binding Methods
Charm Sciences, Inc. (Malden, MA) has developed various test methods for
detection inhibitory substances in milk. In this test, 14C-labeled antibiotic and Bacillus
stearothermophilus cells are combined with the sample. It competes for binding sites on
the bacterial cell wall and more 14C-label is free in solution, if antibiotic is present in the
sample. The labeled antibiotic binds with the cell wall and is removed from the solution
with centrifugation. This indicates that no antibiotic is present in the sample. Positive
and negative controls are prepared. The results are compared to the controls (Hui 1993).
Charm II procedure has been widely used by many dairy laboratories. This
screening method is used for several families of antimicrobial drugs. In this procedure,
there are two different microorganisms. These microorganisms provide necessary
binding sites. Then the labeled compound is detected. Moreover, different tests are
designed for farm and small dairy plant by Charm Sciences, Inc. These tests can be
easily utilized (Hui 1993).
Other competitive binding techniques are Penzyme and Penzyme III methods.
The methods consist of the binding of DD-carboxypeptidase to beta-lactam antibiotics.
Enzyme and sample are incubated at appropriate temperature and time. The substrate is
added. The mixture is incubated at same temperature. A yellow color displays an
antibiotic residue is present. A pink color means negative result. An orange/yellow
color indicates the possibility of beta-lactam residues and so the sample should be
confirmed. Positive and negative controls should be conducted for all samples (Hui
1993).
3.2.3. Immunological Methods
The interaction antigen and antibody has been preferred for many years to detect
foodstuff adulterated and contaminated. Antigen-antibody reaction has specific role.
This method is suitable for detection of chemical residues and antibiotic residues in
animal foods. The enzyme-linked-immunosorbent assay (ELISA) is the most common
method used. It is the well-established assay. Its detection system is usually depended
on enzyme-labeled reagents. In ELISA test, color occurs during incubation. This color
is measured with a micro plate reader (Toldra and Reig 2006). A low intensity indicates

24
positive result due to competitive principle. The result occurs less than 10 min (Neaves
1999).
Radioimmunoassay (RIA) performes the measure of radioactivity of
immunological complex by using a counter. Other methods consist of
chemiluminiscence measurement with a luminometer. In this duration, a
chemiluminiscent compound is bound to the antibody or fluorescence with a fluorimeter
(Toldra and Reig 2006).
Immunological test kits have advantages and disadvantages. Table 3.5 displays
main advantages and disadvantages of these kits.
Table 3.5. Major advantages and disadvantages of ELISA test kits
(Source: Toldra and Reig 2006)
Advantages Disadvantages
Easy to use Increased costs since 2002 (more than
Available kits for a good number of specific €6.50 per kit)
Compounds Limited storage under refrigeration
Availability of kits for families of compunds Expensive in the case of RIA and
Large number of samples per kit for a single need for waste disposal
Analyte Interferences giving some false
Reduced time to obtain the results positives
High sensivity Only one kit per residue searched
High specificity
Possibility to use within the food-processing
facility
Another recent method is development of biosensors for screening antibiotic
residues in dairy products. They have several constitutes. The target analyte contacts the
biological receptor (antibody). The biochemical signal is converted by transducer into
an electronic signal. A microprocessor displays the final result by using these signals.
There are different types of biosensors. These are biochip array biosensors, enzymatic
biosensors and biosensors based on antibiotic sensor protein that are convenient to
specific classes of antibiotics. Biosensors have several advantages and disadvantages.
The advantages are such as easy to use, to analyze multiples residues in short time for a
large number of samples, full automatisation, computer controlled and high through-put

25
property. The disadvantages of biosensors are high initial equipment, high operative
costs (chips) and analysis limited to available chips (Toldra and Reig 2006).
3.3. Chromatographic Methods
High performance thin layer chromatography (HPTLC) has been used for
detection of multi-residues in food. However the usage of HPTLC has decreased.
Different residues like thyreostatic drugs, clenbuterol and other agonists and
sulfonamides have been determined by HPTLC in animal foods. Moreover the analysis
of corticosteroids and antibiotics in milk has been conducted by means of HPLTC.
Major advantages of HPTLC are as follows high number of samples for a single
analyte, reduced time to obtain the results, possibility of automatisation for higher
productivity, sensitive, specificity depending on the detection method, separated sample
can be recorved for further confirmatory analysis. The drawbacks of HPTLC are that
expertise required, need of sample preparation such as extraction and filtration, addition
of internal standard, high initial equipment, cost of column (Toldra and Reig 2006).
The high performance liquid chromatography (HPLC) has been widely used for
screening. HPLC is a separative method. It detects residues by means of detector. The
detection system must be selected carefully. This system is significant for selectivity
and sensitivity. The detection multi-residues are usually depended on a solid-phase
extraction clean up and then filtration and injection into reverse-phase HPLC with UV-
diode array detection. The main advantages and disadvantages of HPLC are shown in
Table 3.6. (Toldra and Reig 2006).

26
Table 3.6. Main advantages and disadvantages of HPLC
(Source: Toldra and Reig 2006)
Advantages Disadvantages
Short time to analyze Expertise required
Sensitive Need for sample preparation
Automatisation leading to higher (extraction and filtration etc.)
productivity (injection, elution, High initial equipment
washing of column, detection) Cost of column
Possibility to find more information from
spectra when using diode array detector
HPLC is first screening method. The next step is injection of positive samples in
a system combining HPLC with mass spectroscopy detection. HPLC with MS-MS can
obtain the results in shorter time. The combination with HPLC-electro spray ionization
(ESI) tandem mass spectrometry suggested as screening and confirmatory method.
Some researchers have used liquid chromatography-mass spectrometry with
atmospheric pressure chemical ionization (APCI) for the measurement. Another
screening method for the analysis of antibiotics formulations is 1H NMR (Toldra and
Reig 2006).
Liquid chromatography and gas chromatography are other confirmatory
methods. They coupled to mass spectrometry (LC/MS and GC/MS). They are highly
specific and need complex equipment and well-qualified laboratory personnel
(Okerman, et al. 2003). A clean-up is required before the chromatographic
determination of antibiotics in milk. Antibiotics are typically polar constitutes and so
are extracted into polar organic solvents. Precipitation of the milk proteins is required
for the determination methods of antibiotics in milk (Schenk and Callery 1998). The
principal drawback of the two methods is to use chemo-metrics analysis (Reid, et al.
2006).

27
CHAPTER 4
MILK CHEMISTRY AND PHYSICS
4.1. Introduction
Food safety issues and the potential for chemical and microbiological hazards in
foods are paid attention by public. Consumers buy milk to be natural and wholesome.
Severe financial difficulties on farmers are imposed by many countries. In some cases,
veterinarians allow bulk tank milk to become contaminated with detectable levels of
antibiotic residues (Hillerton, et al. 1999). Because financial losses result from
decreased milk production, treatment, and labor costs, no deliverable milk, veterinary
fees, reduced milk quality, reduced milk price, increased risk of subsequent mastitis,
and increased risk of culling or death of the cow and also allergic reactions in human
(Nielen, et al. 1992). For these reason, milk producers must preserve their milk. Milk
must not be contaminated by any veterinary drugs prohibited or the levels of antibiotic
residues were lower than the Maximum Residue Limits (MRLs) (Zvirdauskiene and
Salomskiene 2007). And so, researchers investigate antibiotic free milk and milk spiked
with antibiotic; and want to determine differences between them. Milk is a complex chemical composition of water, lactose, fat, protein (mostly
casein), minerals and vitamins distributed throughout colloidal and soluble phases (Fox
and McSweeney 1998). Composition of cow’s milk is so important for determining
physical properties of milk because physical properties of milk change, according to
composition. It is physical nature also is very complicated. It involves in three physical
phases: a dilute emulsion, a colloidal dispersion, and a solution. If the emulsion is
centrifuged, the milk separates into lipid and aqueous phases or compartments. These
are each with a characteristic composition. If colloidal dispersion is centrifuged, casein
micelles precipitate, bringing some other proteins, such as lactoferrin from milks of
animal species (Neville and Jensen 1995). The lactose, a portion of the mineral salts, and some of the lactalbumin are
constituents of milk in molecular dispersion or true solution. Generally, the proteins of
milk are dispersed colloidally through milk. Divided particles are casein, albumin and

28
globulin. Casein is the largest and albumin and globulin are the smallest. The calcium
phosphate is considered with the proteins. It is colloidally dispersed. The fat of milk
occurs in the form of a coarse dispersion or an emulsion. In milk, water is the
continuous phase and because of this the emulsion is said to be of the fat-in-water type
(Eckles, et al. 1951).
Table 4.1. Chemical composition of bovine milk
(Source: Otter 2003)
Component Concentration (gl-1)
Lactose 36-55
Fat
Triacyglcerols 36-38
Diacylglycerols 0.1-0.23
Monoacylglycerols 0.006-0.015
Sterols 0.09-0.16
Sterol esters Trace
Unesterified fatty acids
Hydrocarbons
Phospholipids
Protein
Caseins
αs1-Casein
αs2-Casein
β-Casein
κ-Casein
Whey
β-Lactoglobulin
α-Lactalbumin
Bovine serum albumin
Immunoglobulins
Potassium
0.04-0.17
Trace
0.08-0.39
30-35
24-28
12-15
3-4
9-11
2-4
5-7
2-4
0.6-1.7
0.2-0.4
0.5-1.8
(Cont. on next page)

29
Table 4.1. (cont.) Chemical composition of bovine milk
(Source: Otter 2003)
Casein fragments
γ-Casein 1-2
Proteose-peptones 0.6-1.8
Milk fat globule membrane 0.4
Salt 0.7-0.8
Calcium 1.1-1.3
Chloride 0.9-1.1
Iron 0.3-0.6
Magnesium 0.09-0.14
Phosphorus 0.9-1.0
Sodium 0.35-0.9
Potassium
1.1-1.7

30
4.2. Physical Properties of Milk
Some of the physical properties of milk are summarized in Table 4.2 and
explained in following sections.
Table 4.2. General physical properties of milk
(Source: National Dairy Council 2000)

31
4.2.1. Acid-Base Equilibrium
The acidity of solution is associated with the concentration of hydronium ions
[H+] in it. If the concentrations of [H+] and [OH-] (hydroxyl) ions are equal, the solution
is called neutral. Mathematically, the pH can be defined as the negative logarithm of the
hydronium ion [H+] concentration. Titratable acidity is pointed out the amount of alkali required to bring the pH to
neutrality (phenolphthalein). This property is used in several fields. These are to
determine bacterial growth during fermentations, such as during cheese making, as well
as compliance with cleanliness standards. Fresh bovine milk has no lactic acid. Mostly,
the titratable acidity is because of the casein and phosphates. Lactic acid can be
produced by bacterial contamination in uncommonly (Neville and Jensen 1995). Acidity, one of the most important parameters, controls the quality and
processing of milk. Milk acts as a buffer. This buffer is a chemical system. It resists
changes in the concentration of hydrogen ions under internal and external influences
(Rosenthal 1991). Most commonly, fresh milk and fermented products is tested analytically by
measuring the amount of alkali needed to bring the pH to 8.4 (the end point of
phenolphthalein which is used as indicator). The result is expressed by the equivalent
amount of lactic acid. The solids-not-fat in the milk contains the more phosphates,
proteins and other weak acids. pH value is largely a reflection of these. The more alkali
is required to overcome the buffering capacity of milk over the range from the pH 6.6
up to 8.4. The titratable acidity of fresh normal milk should be about 0.14% lactic acid.
If due to the microorganism’ activity the milk is soured and the acidity is raised an extra
amount of alkali is required. If the increase in titratable acidity is about 0.07% above the
normal value, milk begins to taste sour. In a contrary manner, mastitis milk which may
have an initial pH beyond 7, shows a titratable acidity of 0.1% lactic acid or less
(Rosenthal 1991). The titratable acidity of healthy cow milk milked newly 6.4-7.0 °SH or 0.14%-
0.16% in terms of milk acid (Metin 2001 and Rosenthal 1991). The pH of milk as generally measured outside the animal because it is higher
than milk within the mammary gland due to loss of CO2 to the ambient air. The
hydrogen-ion concentration of milk or dairy products may be determined different via
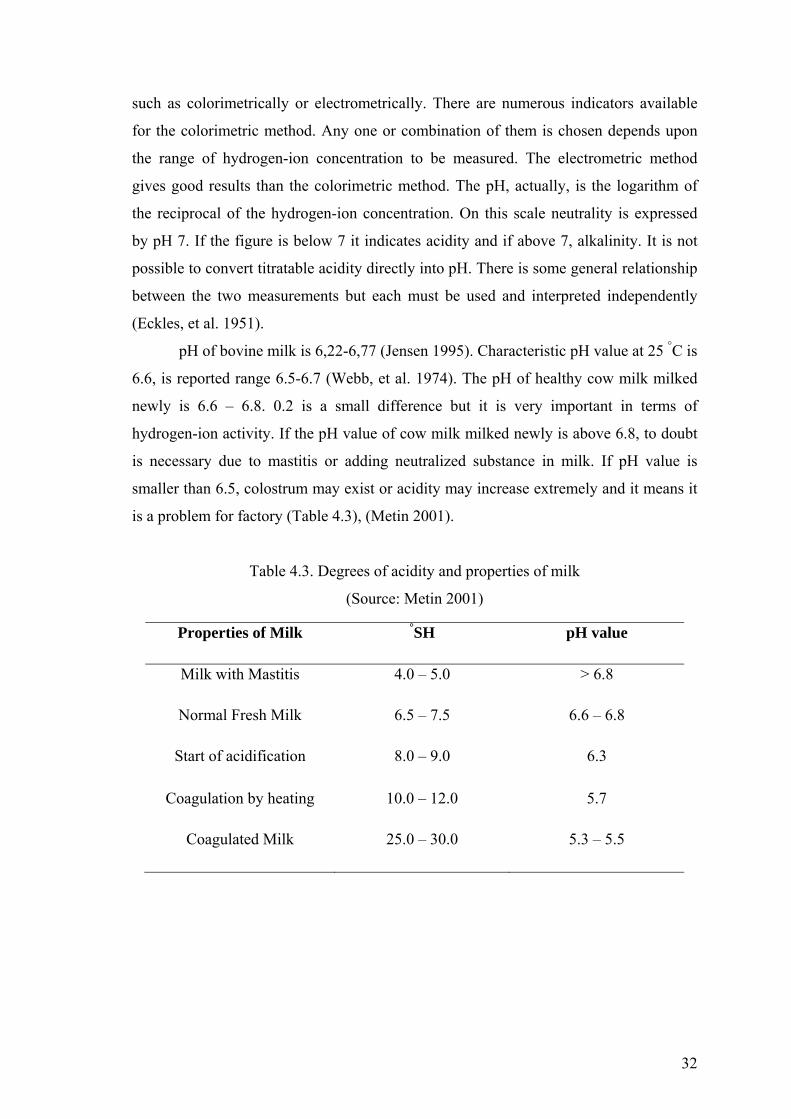
32
such as colorimetrically or electrometrically. There are numerous indicators available
for the colorimetric method. Any one or combination of them is chosen depends upon
the range of hydrogen-ion concentration to be measured. The electrometric method
gives good results than the colorimetric method. The pH, actually, is the logarithm of
the reciprocal of the hydrogen-ion concentration. On this scale neutrality is expressed
by pH 7. If the figure is below 7 it indicates acidity and if above 7, alkalinity. It is not
possible to convert titratable acidity directly into pH. There is some general relationship
between the two measurements but each must be used and interpreted independently
(Eckles, et al. 1951). pH of bovine milk is 6,22-6,77 (Jensen 1995). Characteristic pH value at 25 °C is
6.6, is reported range 6.5-6.7 (Webb, et al. 1974). The pH of healthy cow milk milked
newly is 6.6 – 6.8. 0.2 is a small difference but it is very important in terms of
hydrogen-ion activity. If the pH value of cow milk milked newly is above 6.8, to doubt
is necessary due to mastitis or adding neutralized substance in milk. If pH value is
smaller than 6.5, colostrum may exist or acidity may increase extremely and it means it
is a problem for factory (Table 4.3), (Metin 2001).
Table 4.3. Degrees of acidity and properties of milk
(Source: Metin 2001)
Properties of Milk °SH pH value
Milk with Mastitis 4.0 – 5.0 > 6.8
Normal Fresh Milk 6.5 – 7.5 6.6 – 6.8
Start of acidification 8.0 – 9.0 6.3
Coagulation by heating 10.0 – 12.0 5.7
Coagulated Milk 25.0 – 30.0 5.3 – 5.5

33
4.2.2. Specific Gravity
Milk is a complex colloidal system. The colloidal system involves in dispersion
medium, water, contains salts and sugar in solution. Therefore, it is heavier than water
(Eckles, et al. 1951). The density of milk is the weight of a unit volume at a defined
temperature. Specific gravity is the density of a substance divided by the density of
water at the same temperature. It is essentially 1.000 at 4 °C. Water, nonfat solids and
fat contents and also the degrees of fat crystallization or hydration of proteins are
determined by using specific gravity. The density of milk decreases when the
temperature is increased. Temperature controlling is important during the
measurements. Water has a lower specific gravity than milk. When water is added to
milk, the specific gravity decreases. However, a higher content of milk fat shows the
same effect. Specific gravity is one of the most practical measurements used for
controlling milk composition. Specific gravity of whole milk is 1.032, skim milk is
1.036, evaporated whole milk is 1.066 (Rosenthal 1991).
The specific gravity of milk usually is measured at 60 °F (15.5 °C) in the
laboratory. Composition of milk affects the specific gravity of milk. Constituents of
milk have different specific gravity, approximately: fat, 0.93; lactose, 1.666; proteins,
1.346; casein, 1.31; salts, 4.12 (Eckles, et al. 1951).
Density is so changeable because of all substances included in composition. The
density of milk is 1.027 g/ml – 1.035 g/ml at 20 °C due to its composition. The density
of milk decreases because of increasing fat content and it increases because of
decreasing fat content. The density of milk increases due to increasing quantity of
protein, lactose and mineral substance. Increasing temperature causes decreasing
density of milk (Metin 2001).
The specific gravity of milk is 1.021 – 1.037. The density of milk normally
varies between 1.028 and 1.034 depending on composition. Milk is thus very slightly
denser than water (Neville and Jensen 1995).

34
4.2.3. Electrical Conductivity
Electrical conductivity measurements have been used in the food industry for
many years to detect contaminates in water, to monitor microbial growth, metabolic
activity and to interference from inhibiting substances (Carcia-Golding and Giallorenzo
1995, Moreno and Chang 1995, Curda and Plockova 1995, Mitchell and Alwis 1989).
In addition, electrical conductivity measurement is widely used in dairy industry. For
instance, detection of mastitis for quality control of milk, to analyze fermentation
processes for production of cheese starters (Paquet, et al. 2000), to monitor the start-up
and prerinsing phases of milk pasteurization process (Henningsson, et al. 2005)
Electrical conductivity is a measure of the resistance of a particular material to
an electric current. The conductivity is the reciprocal of resistance. Resistance is
measured in ohms and is calculated by dividing voltage by amperes. Conductivity is
measured in Siemens and is calculated by dividing ampere by voltage (Nielen, et al.
1992).
Milk has conductive properties due to the existence of charged compounds,
especially mineral salts. The distribution of salt fractions between the soluble and
colloidal phases has an important effect on milk conductivity value. The electrical
conductivity of milk is determined primarily by not only sodium and chloride ions but
also by other ions (Mucchetti, et al. 1994, Mabrook, et al. 2006). There is very little
associated with the lactose as the conductance values of full fat milk. The salts in milk
contain mainly of chlorides, phosphates, citrates, carbonates and bicarbonates of
potassium, sodium, calcium, and magnesium, although the salt content of milk remains
constant at about 0.7% w/v. This composition is affected by factors such as animal
breed, season of the year, feed, and stage of lactation (Fox and McSweeney 1998).
These factors also influence the distribution of calcium, magnesium, and phosphate
between soluble and colloidal phases and thus the number of free conducting ions in the
milk. Despite casein, the main milk protein shows a very low conductance compared to
the milk salts. The insoluble salts in milk, especially calcium phosphate, are mainly
correlated with the casein micelles in the colloidal phase. Small rates of the sodium and
potassium ions are associated with the casein as counter-ions to the negatively charged
organic phosphate groups of the protein (Fox and McSweeney 1998). These salts act
like bridges between the subunits of the casein micelles. They keep the milk in a stable

35
condition. Under certain conditions, these salts can be released into solution in that
connection increasing the conductivity (Mabrook and Petty 2003).
Moreover, when acidity increases, conductance of milk increases. In an
experiment, freshly squeezed lemon juice was added slowly to full fat milk and at the
some time conductance and pH were monitored. The conductance increased, reaching a
saturation value of 5.8 mS at a pH of 4.9-5.0. This conductance value is similar to milk
gone off. At this situation, all the colloidal salts connected to the casein micelles are in a
soluble phase and free to contribute to the measured conductance. The addition of acid
decreases the pH of the milk. It results solubilisation of the colloidal salts connected to
the casein micelles gradually. When the pH of milk reaches a value of about 5.0, all the
colloidal calcium and phosphorus are in the soluble phase and the conductance saturates
(Mabrook and Petty 2003).
The presence of fat is another factor that has an influence on the electrical
conductance of milk (Lawton and Pethig 1993, Prentice 1962). The conductance of milk
decreases when the percentage of fat increases. Conductance of full fat milk [3.6 wt%] ,
semi-skimmed milk [1.6 wt%], skimmed milk [0.1 wt%] is 5.05 +/- 0.03 mS, 5.23 +/-
0.03 mS, 5.4 +/- 0.03 mS , respectively (Mabrook and Petty 2003).
Electrical conductivity of normal milk, with a temperature of 25 °C, is typically
between 4.0 and 5.0 mS/cm (Wong 1988). When measured in-line, EC will have some
higher level on account of the higher temperature in the milk (38°C). Numerous studies
show that EC of milk from cows affected by mastitis (both clinically and subclinically).
This EC of milk is higher than EC of milk from healthy cows (not affected by mastitis)
(Nielen, et al. 1992, Hamann and Zecconi 1998, Norberg, et al. 2004a, Biggadike, et al.
2000). The mean EC in mS (with standard errors in parentheses) for healty,
subclinically infected and clinically infected cows was 5.3 (+/-0.03), 5.75 (+/-0.04) and
6.73 (+/- 0.06), respectively. These numbers were significantly different (P<0.001)
(Norberg, et al. 2004a). Electrical conductivities of raw milk and skim mil k are stated
4680, 4920 µ S/cm, respectively (Mucchetti, et al. 1994).
Typical EC of normal milk appears to be between 4.0 and 5.5 mS/cm at 25 oC,
and the distribution of the measurements is log normal. The EC of milk has also been
expressed as a concentration of NaCl because of the same conductivity. Milk was
examined in milli moles. It reflects the total ionic concentration of the milk in
milliequivalents per liter (Nielen, et al. 1992). Table 4.4 indicates about the electrical
conductivity values of milk, each of the components and fractions of milk.

36
Table 4.4. EC of milk, milk fractions and constitutes
(Source: Mucchetti, et al. 1994)
Sample
(µS/cm)
Raw milk 4680
Skim milk 4920
Whey 5180
Diafiltered milk 278
Permeate UF 4762
Whey protein solution, 78% 214
Lactose solution, 5% 27
AA Solution, 6.25 mM
Glutamic acid 100
Arginine 124
Cysteine 8
Methionine 7
Urea solution, 50 mg/100 ml 4
Salt solution, 100 mg/100 ml
NaCl 1626
KCl 1585
Na lactate 516
CaCl2 1475
Na3 Citrate 869
K2HPO4 1270

37
4.3. Thermo-Physical Properties of Milk
The thermal analysis has been preferred for many years to characterize synthetic
polymers. However, there is a growing interest to use thermal analysis techniques to
characterize food systems. In food science, thermal analysis has already been used for
detection of water loss, uptake or migration, the denaturation of proteins and the
crystallization of starch, to design new processes like freeze-drying, spray-drying,
extrusion and hydro-thermal treatment and also for determination and improvement of
food quality, safety and storage stability. Differential scanning calorimetry (DSC) is one
of the most popular thermal analysis techniques in which the difference in the amount
of heat required to increase the temperature of a sample and reference are measured as a
function of temperature. Both the sample and reference are maintained at nearly the
same temperature throughout the experiment. However, there are some problems
regarding interpretation of DSC curves. These problems in most foods are the low
purity, high heterogeneity, polydispersity, water content and weak, broad transitions
(De Meuter, et al. 1999). The significant factors affecting thermal properties are
generally food composition and temperature (Tansakul and Chaisawang 2006). The
specific heat of foods depends strongly on the water content. Water has the highest
specific heat of all food components. Generally, specific heat measurements are made
by using calorimeter. It is a simple technique but it requires a correct calibration. The
best alternative technique is differential scanning calorimeter. DSC determines the
specific heat of foods experimentally. The disadvantage of DSC is being expensive
(Telis-Romero, et al. 1998).
4.3.1. Specific Heat
All substances have different chemical and physical nature. For these reasons,
the amount of heat required varies. The specific heat is the ratio between the amount of
heat necessary to raise a given weight of a substance to a specified temperature and the
amount of heat required to raise an equal amount of water to the same temperature.
Calorie is the unit of heat (Eckles, et al. 1951). The specific gravity of water is the
greatest at 3.9 °C. At this temperature, the specific heat of water is taken as the
standard. Other substances can be compared by using this (Eckles, et al. 1951).

38
The specific heat of milk is 0.938 kJ/kg K at 15 °C, 0.920 kJ/kg K at 0 °C, 0.930
kJ/kg K at 40 °C and 0.918 kJ/kg K at 60 °C. The specific heat of milk products is
various from each other because of their chemical composition. The heat capacity of
whole milk and cream with temperature is more complicated than skim milk due to the
milk fat effect (Hui 1993). It is significant in processing for determining the amount of
heat and cooling required changing the temperature of milk (Jensen 1995). Moreover,
engineers need the specific heat to calculate costs in the heating and cooling of milk and
milk products (Eckles, et al. 1951).
4.4. Chemical Properties of Milk
The principal compounds of milk are water, fat, proteins, lactose (milk sugar)
and minerals (salts). In addition, milk includes trace amounts of other substances such
as enzymes, pigments, vitamins, phospholipids (substances with fat like properties), and
gases. When gases and water are removed is called the dry matter or total solids content
of the milk, the residue left (Table 4.5) (Eckles, et al. 1951).
Table 4.5. Chemical composition of milk
(Source: Eckles, et al. 1951)
Percentage
Water 87.25
Dry matter 12.75
Fat 3.80
Protein 3.50
Sugar 4.80
Ash 0.65
Total 100.00

39
4.4.1. Milk Fat
Milk fat is the most valuable component of milk. Milk and milk products have
rich flavor because of the milk fat. Milk fat observes in milk in the form of minute
globules in a true emulsion of the oil-in-water type. The fat globules exist in the
dispersed phase. If the milk is examined under a high- power microscope, the numbers
of fat globules in various sizes will be seen. The breed is the most important factor that
affects the size of the globules. The fat globules are almost large during the first phase
of the lactation period. The size of the fat globule is of significance for separation of
milk, churning of cream, shipping of milk or cream and cheese making (Eckles, et al.
1951).
Milk fat has complex chemical composition. It is a variable mixture of several
different glycerides. The glycerides contain the union of glycerol and one or more
organic acids. Milk fat involves a larger number of the fatty acids. These are butyric,
caproic, caprylic, capric, lauric, myristic, palmitic, stearic and oleic acids. The oleic acid
is the greatest amount of total fatty acids in milk (Eckles, et al. 1951). The breed of
animal, stage of lactation, feed and plane of nutrition are responsible for this
composition of milk fat.
Milk fat is a triglyceride accounted for 98.3% (Hui 1993) that contains 1
molecule of glycerol combined with 3 molecules of the fatty acid. The fatty acids of
milk divide into two general groups. These are the volatile and the non-volatile. The
volatile acids involve butyric, caproic, caprylic, capric, lauric, and small amounts of
others. The non-volatiles are myristic, palmitic, oleic, stearic and small amounts of a
few others (Eckles, et al. 1951).
All of the fatty acids in milk fat have different melting points, boiling points and
specific gravity. In other words, the melting point, boiling points and specific gravity of
milk fat is influenced by its composition (Eckles, et al. 1951).
The physical properties of milk fat have been stated such as: density at 20 °C is
915 kgm-3; refractive index (589 nm) is 1.462 and decreases with increasing
temperature; solubility of water in fat is 0.14% (w/w) at 20 °C and increases with
increasing temperature; thermal conductivity is about 0.17 J m-1s-1K-1 at 20 °C; specific
heat at 40 °C is about 2.1 kJ kg-1K-1; electrical conductivity is <10-12 ohm-1 cm-1; and the
dielectric constant is about 3.1 (Hui 1993).

40
4.4.2. Proteins of Milk
Proteins are one of the complex organic substances (Eckles, et al. 1951).
Proteins consist of amino acids. Carbon, hydrogen, oxygen and nitrogen are the
elements of amino acids (Rosenthal 1991). Nitrogen distribution of milk is divided
among caseins, whey proteins and non-protein (NPN) (Hui 1993). The protein content
of milk is approximately 3% (Eckles, et al. 1951).
Casein is a yellowish-white granular substance. Pure casein is snow-white,
odorless and tasteless. It is observed in combination with calcium in milk. Casein is
found in colloidal form (Eckles, et al. 1951). The casein content of milk is about 80% of
milk protein (Hui 1993). Casein is widely used in industry including manufacturing of
plastics, sizing of high-grade paper, textile industry and food industry such as meat
sauce, baby foods (Eckles, et al. 1951).
The whey proteins fractions are β-lactoglobulins, α-lactalbumins, bovine serum
albumin and immunoglobulins (Hui 1993). Lactalbumin is one of the important
fractions of whey. Lactalbumin dried is a tasteless powder. It consists of carbon,
oxygen, hydrogen, nitrogen and a small quantity of sulfur (Eckles, et al. 1951). α-
Lactalbumin has a vital role in milk composition. β-lactoglobulin has been known as the
allergenicity of milk (Rosenthal 1991).
Milk proteins are essentially rich in essential amino acids. These are
phenylalanine, methionine, leucine, valine, lysine, isoleucine, threonine, tryptophan,
histidine. Lysine is one of the abundant essential amino acids in milk proteins
(Rosenthal 1991).
4.4.3. Lactose
Lactose is a milk sugar. It is a carbohydrate and one of the most common
disaccharides. It contains 1 molecule of galactose and 1 molecule of glucose. Lactose is
in the milk serum. Milk consists of about 4.8 percent of lactose. Dry milk involves a
great amount of percentage of lactose, about 38% (Eckles, et al. 1951).
Many other sugars are more soluble than lactose. Sucrose is sweeter than
lactose. The sweetness of α-lactose is not greater than that of β-lactose. Lactic acid is

41
the metabolite of lactose. It is produced microbiologically in milk and it is the main
source of energy for microbial metabolism (Rosenthal 1991).
4.4.4. Minor Components of Milk
In addition to the major components, protein, lactose, water, fat and ash, milk
involves some minor components of milk (Eckles, et al. 1951). Minor components of
milk are some vitamins, minerals, nonprotein nitrogenous substance, phosphoric esters,
ethanol, cholesterol, pigments, enzymes, gases and some acids (Hui 1993).
4.4.4.1. Vitamins
Milk contains both fat and water-soluble vitamins. Milk consists of vitamin A,
vitamin B2, vitamin B1 (thiamin), vitamin G (riboflavin), nicotinic acid (niacin), vitamin
B6 (pyridoxine), pantothenic acid, vitamin C (ascorbic acid), vitamin D, vitamin E
(alpha-tocopherol) and vitamin K. The feed affect the amount of some vitamins in milk
(Eckles, et al. 1951).
4.4.4.2. Minerals
22 minerals are considered to be essential to the human diet are present in milk.
Three families of salts are included in milk. The first one includes sodium (Na),
potassium (K) and chloride (Cl). A second includes colloidal calcium (Ca), magnesium
(Mg), inorganic phosphorus (Pi) and citrate. The third family includes diffusible salts of
Ca, Mg, citrate and phosphate (Hui 1993).
4.4.4.3. Enzymes
The enzyme in milk can occur from the mammary gland as native component or
may be resulted by contaminating bacteria. Milk involves lipase, alkaline phosphatese,
lactoperoxidase and catalase. Lipases catalyze the hydrolysis of milk fat to free fatty
acids and glycerol. Alkaline phosphatese catalyzes the cleavage of phosphoric acid ester
into phosphoric acid and hydroxylic constituents, alcohols or phenols. Lactoperoxidase

42
catalyses the transfer of oxygen from peroxides, particularly hydrogen peroxide, to
other oxidizable substances. Catalase affects the decomposition of hydrogen peroxide to
water and molecular oxygen (Rosenthal 1991).
4.4.4.4. Non-protein Nitrogenous Substances
In addition to the milk protein, milk consists of nitrogenous substances. These
substances are the rest in small size compounds. These are urea (2.5%), uric acid
(0.5%), amino acids (0.8%), amines, ammonia, creatinine, adenine and guanine. These
constitutes do not have biological value as proteins (Rosenthal 1991). These non-protein
nitrogenous substances are measured in parts per million (1.5 to 10) in milk (Eckles, et
al. 1951).

43
CHAPTER 5
MATERIALS AND METHODS
5.1. Materials
According to unofficial data, most of the antibiotic containing raw milk is
processed to UHT milk in Turkey. This may be due to the fact that at high temperature,
antibiotics are degraded and their level reduced under detection limits. That is why
UHT milk having 3.1% fat content was selected for analyzes.
UHT whole cow’s milks were obtained from the local market in Izmir, Turkey.
The production date, expiry date, serial number, energy and nutrition values of milk
were recorded. Milk samples were supplied between 2006 and 2008. The milk samples
were kept refrigerated before analysis. Prior to measurements, the samples were kept at
room temperature.
To investigate physical and chemical properties of whole antibiotic free milk
and whole milk spiked with antibiotics, Penicilline G potassium salt (46609, Lot
4016X), Ampicillin trihydrate (46061, Lot 2316X) and Tetracycline hydrochloride
(46935, Lot 3301X) (Vetranal analytical standard Sigma-Aldrich GmbH Quality
Assurance) were chosen as target antibiotics in this study. Penicillin G and Ampicillin
were prepared in the concentration of 2, 4, 8 ppb and whereas tetracycline was prepared
in the concentration of 100, 250 and 500 ppb.
The CMT Copan Milk Test (Copan, Italy), Penyzme Test Kit (UCB-
Bioproducts, Belgium) and ROSA Test Kit (Charm Science Inc., USA) were used to
screen milk samples for antibiotic residues using procedures recommended by the
manufacturer. HPLC, LC-MS and LC-MS/MS were used for confirmatory analysis of
milk samples carried out in Bornova Veterinary Control and Research Institute, Izmir,
Turkey.
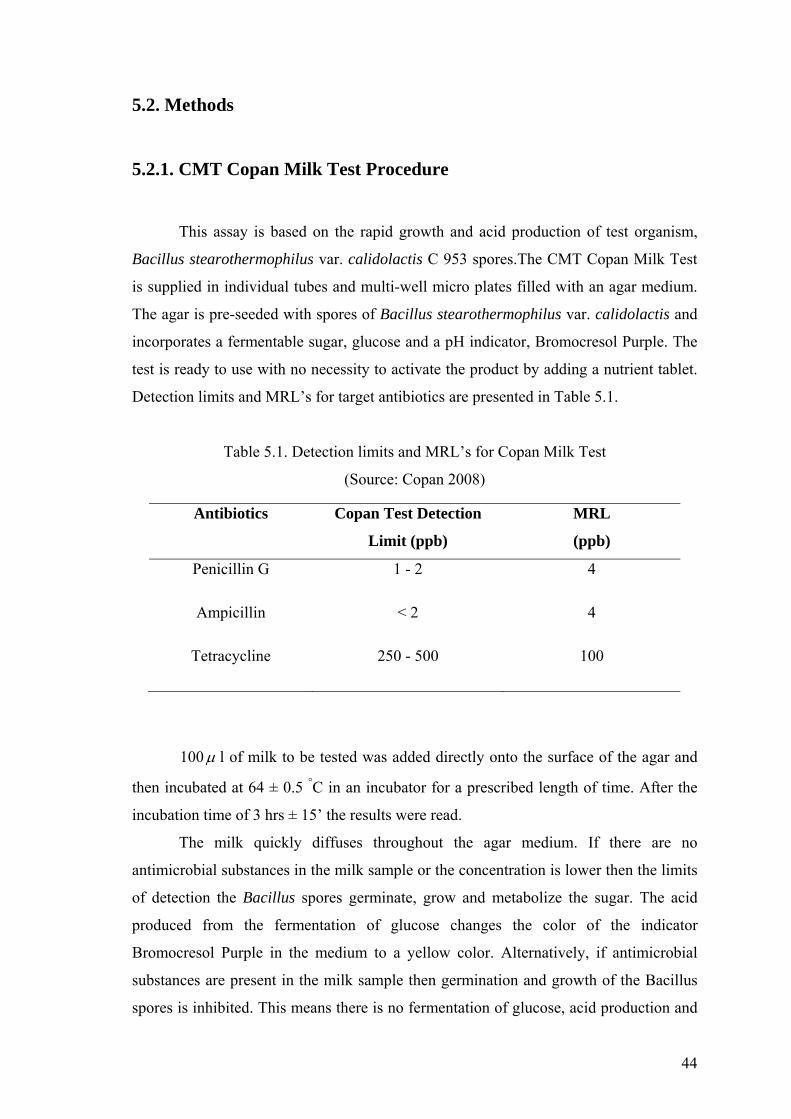
44
5.2. Methods
5.2.1. CMT Copan Milk Test Procedure
This assay is based on the rapid growth and acid production of test organism,
Bacillus stearothermophilus var. calidolactis C 953 spores.The CMT Copan Milk Test
is supplied in individual tubes and multi-well micro plates filled with an agar medium.
The agar is pre-seeded with spores of Bacillus stearothermophilus var. calidolactis and
incorporates a fermentable sugar, glucose and a pH indicator, Bromocresol Purple. The
test is ready to use with no necessity to activate the product by adding a nutrient tablet.
Detection limits and MRL’s for target antibiotics are presented in Table 5.1.
Table 5.1. Detection limits and MRL’s for Copan Milk Test
(Source: Copan 2008)
100µ l of milk to be tested was added directly onto the surface of the agar and
then incubated at 64 ± 0.5 °C in an incubator for a prescribed length of time. After the
incubation time of 3 hrs ± 15’ the results were read. The milk quickly diffuses throughout the agar medium. If there are no
antimicrobial substances in the milk sample or the concentration is lower then the limits
of detection the Bacillus spores germinate, grow and metabolize the sugar. The acid
produced from the fermentation of glucose changes the color of the indicator
Bromocresol Purple in the medium to a yellow color. Alternatively, if antimicrobial
substances are present in the milk sample then germination and growth of the Bacillus
spores is inhibited. This means there is no fermentation of glucose, acid production and
Antibiotics Copan Test Detection
Limit (ppb)
MRL
(ppb)
Penicillin G 1 - 2 4
Ampicillin < 2 4
Tetracycline 250 - 500 100

45
therefore the Bromocresol Purple indicator in the medium remains a purple color.
Yellow/Purple (Partially Positive) means that no inhibitors are present or that the
presence is lower than the limit detectable by the test (Figure 5.1.).
Figure 5.1. Copan milk test results
(Source: Copan 2008)
5.2.2. Penzyme Milk Test Kit Procedure
Penzyme is an enzyme colorimetric assay for rapid determination of beta-lactam
antibiotics. The test consists of an enzyme DD-carboxypeptidase. DD-carboxypeptidase
hydrolyzes synthetic substrate of type R-D-Ala-D-Ala and rapidly reacts with beta-
lactam antibiotics to form a stable, inactive complex. Five-minute incubation of a
specific amount of enzyme with milk sample involving antibiotic results in the
inactivation of a certain amount of the enzyme. Due to the inactivation of the enzyme,
no reaction occurs when the vial incubates for second reading. The vial is observed
yellow color. Yellow color indicates the presence of beta-lactam antibiotics. If no
antibiotic is present, the enzyme remains active form and reacts with the substrate. Pink
or orange color occurs (Seymour, et al. 1988).
10 µl of enzyme (DD-carboxypeptidase in its buffer) is added into 50 µl of milk
and then is mixed and incubated for 5 minutes at 47 °C. Secondly, one tablet with all the
other reagents needed in the assay is added and flick slowly the tube to bring the tablet
to the bottom. It is incubated at 47 °C again. The first reading is made after 8 minutes
incubation. If the tablet shows a color between pink orange and the peach, the sample is

46
considered as negative. On the other hand, if yellow color between the peach or yellow
color is obtained, the sample probably contains antibiotics. After the first reading, the
sample is placed in incubator for 7 additional minutes. The color of samples is read by
comparing it to the color chart. When the color is pink orange, it means the sample is
negative. This color is characteristic of samples with Penicillin G concentrations lower
than 0.005 IU per ml of milk. When the color of the sample is peach, the concentration
is about 0.008 IU Penicillin G per ml of milk. Such a sample is caution sample. When
the color of the sample is yellow, this sample is considered as positive. This means the
samples contains Penicillin G concentrations higher than 0.017 IU per ml of milk. Table
5.2 displays an interpretation of the colors at the second reading.
Table 5.2. The colors at the seconding reading
Colour Result
Pink orange Negative
Peach Caution
Between peach and yellow Positive
Yellow Positive
5.2.3. ROSA (Rapid One Step Assay): MRL Test Procedure
The Charm MRL test is a rapid assay conducting ROSA (Rapid One Step Assay)
technology. This test is developed to detect beta-lactam and tetracycline antibiotics at
the EU/Codex maximum residue limits (MRLs) in milk (Charm 2008). Table 5.3
indicates detection levels in cow’s milk.

47
Table 5.3. Detection levels in cow’s milk
(Source: Charm 2008)
Principle of ROSA as follows: 300 µl of milk sample is added to the sample
well. The milk is absorbed by the orange sponge and transferred to the porous paper. As
the test is incubated the milk travels up the paper and picks up the purple indicator
beads which are located just above the orange sponge. These beads are going to bind
either to the test line (will develop next to the T) or the control line (located further up
the strip next to the C), (Figure 5.2). If T line is same as or darker than C line, this
means negative sample. If T line is clearly lighter than C line, or T line is absent, or
partially or unevenly colored, this result indicates positive sample (Figure 5.3.), (Charm
2008).
Figure 5.2. ROSA test design
(Source: Charm 2008)
Antibiotics Detection Level Range
(ppb)
EU / Codex MRL
(ppb)
Penicillin G 2 - 3 4
Ampicillin 3 - 4 4
Tetracycline 30 - 90 100

48
Figure 5.3. Visual interpretation of ROSA test
(Source: Charm 2008)
5.2.4. Preparation of Antibiotic Standard Solution
Penicillin G potassium salt (C16H17KN2O4S, 99.4%, 372.48 g/mol), Ampicillin
trihydrate (C16H19N3O4S.3H2O, 98.1%, 403.45 g/mol) and Tetracycline hydrochloride
(C22H25ClN2O8, 97.3%, 480.90 g/mol) were used to prepare standard solution. Working
standard solutions of penicillin G (2, 4, 8 ppb), ampicillin (2, 4, 8 ppb) and tetracycline
(100, 250, 500 ppb) concentrations were prepared by diluting the stock standard
solution with water (Sivakesava and Irudayaraj 2002). The reason of selecting such
levels of antibiotic concentrations was that ‘one was under MRL level, one was at MRL
and one was above MRL limits’.
5.2.5. The Acidity Test
The acidity of milk is determined by titration with a tenth-normal solution of an
alkali, such as sodium hydroxide. Each milliliter of a tenth-normal solution of sodium
hydroxide neutralizes 1 milliliter of a tenth-normal solution of lactic acid. The
percentage of lactic acid of milk is calculated. 1 milliliter of a tenth-normal lactic acid
contains 0.009 gram of lactic acid. In other words, 1 ml N/10 NaOH neutralizes 0.009
gram of lactic acid. It is multiplied number of milliliters of a tenth-normal alkali
necessary to neutralize the lactic acid in the sample. It gives the number of grams of
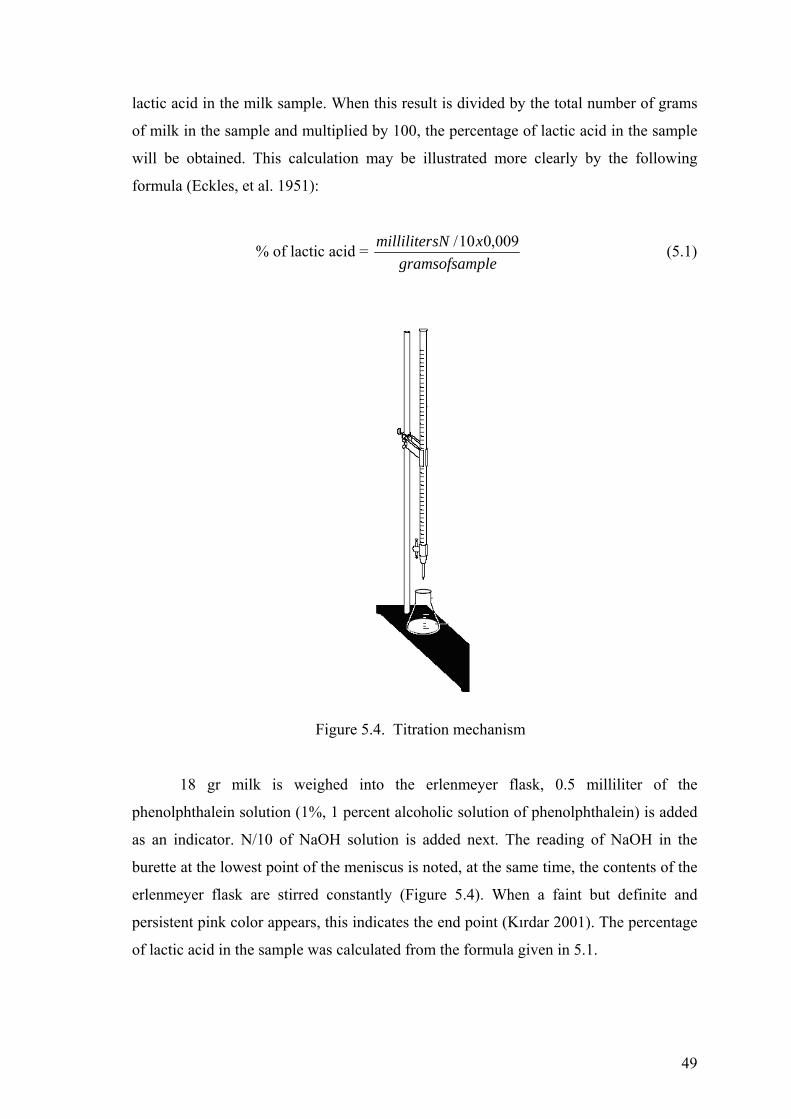
49
lactic acid in the milk sample. When this result is divided by the total number of grams
of milk in the sample and multiplied by 100, the percentage of lactic acid in the sample
will be obtained. This calculation may be illustrated more clearly by the following
formula (Eckles, et al. 1951):
% of lactic acid = plegramsofsamxsNmilliliter 009,010/ (5.1)
Figure 5.4. Titration mechanism
18 gr milk is weighed into the erlenmeyer flask, 0.5 milliliter of the
phenolphthalein solution (1%, 1 percent alcoholic solution of phenolphthalein) is added
as an indicator. N/10 of NaOH solution is added next. The reading of NaOH in the
burette at the lowest point of the meniscus is noted, at the same time, the contents of the
erlenmeyer flask are stirred constantly (Figure 5.4). When a faint but definite and
persistent pink color appears, this indicates the end point (Kırdar 2001). The percentage
of lactic acid in the sample was calculated from the formula given in 5.1.

50
5.2.6. Determination of pH
The hydrogen-ion concentration of milk can be determined calorimetrically or
electrometrically. In the electrometric method, a pH-meter is widely used. The
electrometric method gives greater precision than the colorimetric method (Eckles, et al.
1951).
For measurements, pH was measured by a Mettler Toledo SevenEasy pH-meter
(Mettler Toledo, USA). The reference temperature is accepted 25 oC. All measurements
were performed two times.
5.2.7. Determination of Density
The density of milk and milk products is used for converting volume into mass
and vice versa, estimating the solids content and calculating other physical properties
(e.g. kinematic viscosity). Density is depended on temperature at the time of
measurement, temperature history of the material, composition of the material
(especially the fat content) and inclusion of air (Guelph 2005).
All is considered, density of milk samples was measured by DA-130N KEM
Density / Specific Gravity Meter (Kyoto Electronics, Japan). All measurements were
performed in three replicates. The densities of milk samples were carried out at 15, 20,
25, 30, 35, 40, 45, 50 °C and were observed changes based on temperatures. Different
temperatures were regulated by water bath.
5.2.8. Determination of Electrical Conductivity
Electrical conductivity was measured by EC215 Bench Conductivity Meters
conductometer (Hanna Instruments, USA). EC meter was calibrated using HI 7031
Conductivity Calibration Solution (1413 µ S/cm 25 °C / 77 °F, Hanna Instrument,
Hungary). Antibiotic free milk and milk containing Penicillin G (2, 4, 8 ppb),
Ampicillin (2, 4, 8 ppb), Tetracycline (100, 250, 500 ppb) were prepared at sterile
medium. The milk samples were poured into 250 mL plastic flask. All measurements
were performed in five times. The reference temperature was accepted 25 °C (Zhuang,
et al. 1997).

51
5.2.9. DSC Analysis
Q10 DSC (TA Instruments, USA) was used to determine the thermal behavior of
milk samples. Prepared milk samples consist of Penicillin G (0, 2, 4, 8 ppb), Ampicillin
(0, 2, 4, 8 ppb), Tetracycline (0, 100, 250, 500 ppb). DSC was previously calibrated
using standard. The heating and cooling were made under a constant nitrogen flow. The
experimental conditions (temperature range, type of crucible, temperature
programming, heating rate (10 °C min-1), cooling rate (10 °C min-1), and weighed mass
of sample) was described in DSC software program (Cordella, et al. 2003).
Approximately 5-10 mg of the samples were weighed and hermetically sealed into an
aluminum pan by using a sealer. Then, DSC runs were performed to determine thermal
parameters of the samples. The samples were cooled with liquid nitrogen as a cooling
medium and scanned from – 30 °C to 250 °C (De Meuter, et al. 1999).
Figure 5.5. DSC mechanism
(Source: Collins 2008)
The basic principle of this technique involves the sample to undergo a physical
transformation such as phase transitions, more or less heat will require to flow to it than
the reference to maintain both at the same temperature. The temperature program for a
Metal 2 Metal
1
Sample Empty
Sample Temperature
Reference Temperature
Temperature Difference = Heat Flow

52
DSC analysis was designed that the sample holder temperature increases linearly as a
function of time (Figure 5.5).
5.2.10. Yogurt Culture Test
The milk samples were inoculated with a yogurt culture into NU-425-400E,
Class II biological safety cabinets (Nuaire, Inc., USA). Yogurt cultures involved equal
mixtures (2%) of Streptococcus thermophilus (St 95/1) and Lactobacillus delbrueckii
sup-sp. bulgaricus (Lb 54). They were isolated from traditional yogurt samples of Toros
mountain region of Turkey. Phenotypic and genotypic characterizations of the cultures
were performed by Molecular Food Biotechnology research group at Izmir Institute of
Technology (Erkus, et al. 2006). Milk samples were incubated at 43 °C for 6 h. Firstly,
pHs of all milk samples were determined at 0. hour. Then, antibiotic free milk samples
and milk containing Penicillin G (2, 4, 8 ppb), Ampicillin (2, 4, 8 ppb), Tetracycline
(100, 250, 500 ppb) were incubated for 6 hours. During the incubation, duplicate
measurements of pH were made immediately at 2., 4., 6. hour using Mettler Toledo
SevenEasy pH meter (Mettler Toledo, USA). The decrease of milk pH was observed
and compared with each other (Yamani, et al. 1999).
5.2.11. Determination of Fat, Protein, Lactose, Minerals, SNF (Fat-
Free Dry Matter) and Freezing Point
The percent of protein, lactose, minerals, SNF and freezing point of milk
samples are determined by using Funke Gerber 3510 Laktostar milk content analyzer
(Funke Gerber, Berlin, Germany). Lactostar has been newly developed for the routine
testing of milk. It makes fully automatic cleaning, flushing and fully automatic zero-
point calibration. It consists of four measurement cells. These measurement cells are
divided in two measurement units. The measurement is depended on a thermo-optical
procedure combination. The milk sample (12 to 20 ml) is pumped in two different
measuring cells. It is anayzed by means of these two measuring units. These are blue
box (opto-unit) and red box (thermal unit). This indicates that the milk samples are
analyzed by using to completely different measuring method. The blue box is a turbidity
measurement. In this measuring unit, the undissolved (visible) substances are analyzed.

53
For instance, it measures the sum of fat and protein. It involves in impedance or
conductance measurement. Red box contains two thermo analytical measurement cells.
In this cell, measurement occurs two different measurement temperatures (40.00 °C /
65.00 °C). The fat content and the fat-free dry matter are measured through thermal
effects at different measuring temperatures (Figure 5.6).
Blue Box Turbidity measuring
Impedance measuring
Red Box Thermal analysis at
40 °C/65 °C
Rinsing water (distilled)
Input
Milk sample
Outlet Waste water
Onput
Pump 1
(analysis)
Pump 2
(rinsing)
Pump 3
(cleaning) Cleaning agent
Figure 5.6. Lactostar mechanism
(Source: Bentleyczech 2008)
The content of antibiotic free milk samples and milk containing Penicillin G (2,
4, 8 ppb), Ampicillin (2, 4, 8 ppb), Tetracycline (100, 250, 500 ppb) was determined at
60 sec tempering time and 15 sec measurement time. All determinations were
performed five times.
5.2.12. Confirmatory Methods
According to The International Union of Pure and Applied Chemistry (IUPAC),
chromatography is a physical method of separation in which the components to be
separated are distributed between two phases, one of which is stationary phase, while
the mobile phase moves in a definite direction. Mobile phase means as “a fluid that
percolates through or along the stationary bed in a definite direction” such as liquid,

54
gas. The stationary phase may be a solid, a gel or a liquid. Chromatographic system
mainly consists of a device for sample introduction, a mobile phase, a stationary phase
and a detector.
There are two significant terms, the selectivity of a detector, and the limit of
detection. The selectivity of a detector is its ability to determine an analyte of interest
without interference from other materials present in the analytical system, i.e. the
sample matrix, solvent used. The limit of detection is the smallest amount of an analyte
that is required for reliable determination, identification or quantization. Figure 5.7
shows a block diagram of an HPLC system with its major components (Ardrey 2003).
Mobile phase
reservoir(s)
Pump Injector Column Detector
Figure 5.7. A typical HPLC system
(Source: Ardrey 2003)
5.2.12.1. Liquid Chromatography Detection of Penicillin G in Milk
5.2.12.1.1. Reagents, Standards and Apparatus for LC Analysis
Penicillin G potassium salt (99.4%) was obtained from Riedel-de-Haën (Sigma
Aldrich GmbH Quality Assurance, Germany). Methanol, acetonitrile and isooctane
were of analytical grade (Merck, Germany). Ultra pure water for LC analysis was
obtained with an ultrafiltration unit system (ELGA Labwater, UK). Disodium hydrogen
phosphate dihydrate, dibasic sodium phosphate dehydrate, sodium thiosulfate
pentahydrate, hydrogenosulfate tetrabutylammonium and mercuric chloride were
purchased from Merck. 1,2,4-triazole was purchased from Sigma.
A phosphate buffer (pH 6.5, 0.1 mol l-1) containing 0.015 mol l-1 thiosulfate and
0.02 mol l-1 tetrabutylammonium hydrogenosulfate was prepared by mixing and
dissolving 6.229 g disodium hydrogen phosphate dehydrate, 10.139 g dibasic sodium
55
phosphate dehydrate, 3.894 g sodium thiosulfate pentahydrate and 6.791 g
tetrabutylammonium hydrogenosulfate in 800 ml water. This solution was diluted to
volume in a 1 l volumetric flask, mixed thoroughly and filtered under vacuum through a
0.45 µm unit (Sartorius Minisart RC 15, Goettingen, Germany). It was stored at +4 °C
and used for no more than 5 days.
When mixed by the pump, the mobile phase contained 650 ml of the 0.1 mol/l
phosphate buffer pH 6.5 and 350 ml acetonitrile.
A phosphate buffer extraction solution (pH 8, 0.1 mol l-1) was prepared by
dissolving 14.196 g disodium dibasic sodium phosphate dehydrate in 1 l ultra-pure
water.
The elution solution (50:50) for the solid-phase extraction (SPE) step was
prepared each day by mixing 50 ml of water with 50 ml acetonitrile.
The derivatizing reagent (2 mol/l 1,2,4-triazole and 0.01 mol/l mercuric
chloride) was obtained by weighing 13.78 g 1,2,4-triazole in a 100 ml beaker, adding 60
ml water, stirring to dissolve. This solution was mixed with 10 ml 0.1 mol/l mercuric
chloride solution, adjusted to pH 9.0 ± 0.1 with 5 mol/l NaOH, transferred to a 100 ml
volumetric flask, and diluted to volume with water. When refrigerated at 4 °C and
protected from sunlight, the derivatizing reagent can be stored for up 2 months.
Stock solution of Penicillin G was prepared by dissolving pure reference
standard in water. Working standard solution was stored in cool place protected from
light. Stock solutions and working standard solutions were prepared fresh every 2 weeks
to prevent degradation. A calibration curve was constructed using standard solution by
diluting 100 µl of the working standard solution with 900 µl of the SPE (50:50) into 5
ml glass tubes to obtain 4 levels of Penicillin G concentration of 40, 80, 160 and 320
ppb. The standard solution was then derivatized as described for the fortified milk
samples hereafter.
UHT whole cow’s milk samples were obtained from a local market in Izmir;
Turkey. The milk samples were stored at – 70 °C until analyzed. Working standard
solution was used to fortify blank milk samples to obtained milk samples spiked at three
levels: 2, 4, 8 ppb.
Centrifugation was performed with refrigerated centrifuge (Hettich Rotina 35R,
Boeco, Germany). Strata C18-E (55 µm, 70 A) cartridges of 3 ml and 500 mg
(Phenomenex, USA) was used for SPE. Milk samples were analyzed using a Thermo-
Electron Corporation LC system (Thermo Scientific, USA). It equipped with Finnigan

56
Surveyor LC pump coupled with Finnigan Surveyor Photodiade Array UV Detector
(PAD) and Finnigan Surveyor Autosampler was used for all analyses. It consists of
Synergi 4µm Fusion-RP 80A (150 x 2.00 mm) (Phenomenex, USA). Mobile phases are
phosphate buffer, pH 6.5 (Mobil A) and acetonitrile (Mobile B). The gradient system
consisted of Mobil A (64%) and Mobil B (36%). The column flow rate was 0.250 ml
min-1, the column temperature was 30 °C and the sample injection volume was 100 µl.
UV absorbance was measured at 325 nm.
5.2.12.1.2. LC Procedure
The procedure for determination of Penicillin G residues in UHT cow’s milk
was basically the same as that reported by Verdon and Couder (1998). Spiked milk
samples of 5 ml were placed into 50 ml centrifuge glass tubes. 30 ml of phosphate
buffer extraction solution (pH 8) were added followed by 780 µl of sulfuric acid to
reach pH between 4.0 and 4.5 and the solutions were vortex-mixed for 30 s. These
solutions were centrifuged at 4000 rpm for 10 min (3 °C), and were then transferred to
clean glass tubes being careful to avoid cream pieces. 565 µl of sodium hydroxide were
added to reach pH 8. The aqueous phases were stirred by vortexing and centrifuged
again at 4000 rpm for 10 min (3 °C). Solvent reservoirs of 50 ml were mounted onto
the C18 cartridges and placed with adapters on the SPE vacuum manifold. The cartridges
were washed with 10 ml methanol followed by 10 ml water, 5 ml 2% sodium chloride
solution and finally with 5 ml phosphate buffer extraction solution pH 8. The flow-rate
was not allowed to exceed about 3 ml/min. After this stage, 1 ml volumes of the elution
solution (50:50) were poured into the cartridges and for 1 min were allowed to soak
homogeneously the C18 phase of the cartridges. The Penicillin G was eluted at a flow
rate of about 3 ml/min. 0.5 ml of derivatizing reagent were added to the eluate. The
glass tubes were stirred and placed into a 65 °C water bath to react about 10 min. The
tubes were removed from the water bath, quickly cooled to room temperature for 10
min. If it was protected from light, the derivatized penicillins were stable for 24 h at 4
°C and for more than 5 h at 30 °C. 100 µl of the derivatized sample was injected into
HPLC system.

57
5.2.12.2. Liquid Chromatography Detection of Ampicillin in Milk
5.2.12.2.1. Reagents and Instrumentation for LC Analysis
Ampicillin reference standard was purchased from Riedel-de-Haën (Sigma-
Aldrich GmbH Quality Assurance, Germany). Standard stock solution of ampicillin at
2000 ppm were prepared in water and stored at 4 °C for up to 1 month. Intermediate
standard solutions of 40 ppb were prepared by dilution of stock solutions with water.
Working standard solutions of different concentrations (2, 4, 8, 16 ppb) were prepared
daily by diluting with water.
Trichloroacetic acid (TCA), citric acid, formaldehyde, sodium
dihydrogenphosphate dihydrate, disodium hydrogenphosphate dihydrate, acetonitrile,
acetonitrile hipersolv and methanol hipersolv were purchased from Merck (Darmstadt,
Germany). Sodium thiosulfate pentahydrate was purchased from Carlo Erba (Milan,
Italy). All chemicals and reagents were of LC grade and analytical grade. Ultra pure
water for LC analysis was obtained with an ultra filtration unit system (ELGA
Labwater, UK).
The aqueous phosphate buffer for LC analysis was prepared. It involved in 3.4
mM Na2HPO4.2H2O, 6.5 mM NaH2PO4.2H2O and 15.7 mM Na2S203.5H2O. The
formaldehyde solution was formaldehyde (7%, v/v) in 0.4 M aqueous citric acid
solution.
To establish calibration curves (Figure C.1 in App. C), ampicillin standard
solution was diluted with water to prepare calibration standard solutions of different
concentration (2, 4, 8, 16 ppb). A 500 µl of TCA (20%, w/v, in water) solution and 500
µl aliquot of formaldehyde (7%, w/v, in water) solution were added to each tube. The
tubes were vortexed for 20 s and then heated in a water bath 95 °C for 30 min. After
cooling to room temperature, the content in each tube were bought to 2 ml with 20%
acetonitrile in water. A 25 µl aliquot of each standard solution was injected into LC for
analysis. The peak areas were used for construction of the calibration.
UHT whole cow’s milk samples were obtained from a local market in Izmir,
Turkey. The milk samples were stored at – 70 °C until analyzed.
Centrifuge was a GR 4.11 refrigerated centrifuge (Jouan, France). The LC
system consisted of a SP8800 LC pump and pump controller (Spectra Physics, USA),

58
RF-10 A XL scanning fluorescence detector (Shimadzu Scientific Instruments, USA)
with the excitation wavelenght set at 346 nm and the emission wavelength set at 425 nm
and 5µm Aqilent Hypersil C18 250 mmx4 mm column. The coloum temperature was
maintained at 30 °C. The LC eluents were: (A) phosphate buffer, (B) acetonitrile
(ACN). The isocratic system consisted of 0.05 M KH2PO4 at pH 3.0 (77%) and ACN
(23%). The flow rate was 0.7 ml min-1 and the sample injection volume was 25 µl.
5.2.12.2.2. LC Procedure
The procedure for determination of Ampicillin residues in UHT cow’s milk was
basically the same as that reported by Ang and Luo (1997). Each milk samples (blank
and fortified samples) were deproteinized with 0.5 ml of trichloroacetic acid solution
(20%) and 0.5 ml of acetonitrile. Ampicillin residues were extracted into the clear liquid
phase, after mixing and centrifugation. The extracts were reacted with trichloroacetic
acid and formaldehyde solutions at 95 °C for 30 min to form fluorescent derivatives,
which were then determined by LC with fluorescence detection.
5.2.12.3 Liquid Chromatography Detection of Tetracycline in Milk
5.2.12.3.1. Chemicals and Apparatus for LC Analysis
Tetracycline reference standard was obtained from Riedel-de-Haën (Sigma
Aldrich GmbH Quality Assurance, Germany). Methanol, acetonitrile, oxalic acid, citric
acid monohydrate, disodium hydrogenphosphate dihydrate were LC-grade and were
purchased from Merck. Trichloroacetic acid (TCA) and ethylendiaminetetraacetic acid
disodium salt (EDTA) were reagent-grade and obtained from Prolab. Ultra pure water
for LC analysis was obtained with an ultrafiltration unit system (ELGA Labwater, UK).
Solid-phase extraction (SPE) Strata C18-E, 55 µm; 70A (500 mg, 3 ml) were obtained
from Phenomenex, USA.
McIlvane buffer was used for the precipitation of protein and extraction of
tetracyclines from milk samples. A Na2EDTA-McIlvaine buffer solution (pH 4) consist
of 13.72 g of disodium hydrogen phosphate dihydrate, 11.8 g of citric acid monohydrate
and 33.62 g of ethylenediaminetetraacetic acid disodium salt diluted in 1 liter of water.

59
UHT whole cow’s milk samples were obtained from a local market in Izmir;
Turkey.The milk samples were stored at – 70 °C until analyzed.
Milk samples were analyzed using a Thermo-Electron Corporation LC system
(Thermo Scientific, USA). It equipped with Finnigan Surveyor LC pump coupled with
Finnigan Surveyor Photodiade Array Detector (PAD) and Finnigan Surveyor
Autosampler was used for all analyses. It consists of Phenomenex C18 Nucleosil
column (250 x 3.2 mm, 5 µm). Centrifugation was conducted with a GR 4.11
refrigerated centrifuge (Jouan, France). Mobile phases are 0.01 M oxalic acid (Mobil A)
and acetonitrile (Mobile B). The gradient system consisted of Mobil A (80%) and Mobil
B (20%). The column flow rate was 0.7 ml min-1, the column temperature was 35 °C
and the sample injection volume was 100 µL. UV absorbance was measured at 360 nm.
5.2.12.3.2. LC Procedure
Stock standard solution of tetracycline at 2000 ppm was prepared in water and
stored at 4 °C. These solutions were diluted to give a series of working solution (200
ppm, 20 ppm, 2 ppm, 200 ppb, and 10 ppb) that were prepared daily.
Linearity of the detector response was verified with tetracycline standard
solution over the range of 250, 500, 750 and 1000 ppb. Calibration curve was prepared
daily and estimates the amount of the analytes in milk samples was interpolated from
this graphs (Figure C.6 in App. C).
The procedure for determination of tetracycline residues in UHT cow’s milk was
basically the same as that reported by Cinquina, et al. (2003). 5 ml of milk was
homogenised, placed in centrifuge tube and 2 ml of 20% trichloroacetic acid (TCA)
added. The milk samples was shaken for 3 min, 20 ml of McIlvaine buffer (pH 4) added
and the mixture centrifuged at 4000 rpm for 30 min. The supernatant was then applied
to SPE Strata C18-E, previously activated with 3 ml of methanol and 3 ml of water.
After sample loading, the cartridge was washed with water and finally tetracycline was
eluted with 3 ml of acetonitrile. The solvent was removed under a nitrogen stream at 39-
40 °C and the tetracycline residue was dissolved in 2.5 ml of methanol and filtered with
0.45 µm PTFE filter. The sample volume injected in LC system was 100 µl.

60
5.3. Data Analysis
5.3.1. Statistical Analysis
The statistical analyses were performed using the statistical software Minitab
Statistical Software 14 Trial version (Minitab Inc., State College, PA, USA). EC results
of milk samples were expressed as the mean and standard deviation. All EC
measurements were done five times. One-way analysis of variance (ANOVA) with
Fisher’s, individual error rate, test was carried out in order to evaluate the effect of the
concentration of antibiotic in milk samples at the level of p < 0.05. In other words, these
tests were performed for all experimental runs to determine significance at 95 percent
confidence interval.
For DSC and Lactostar measurements, significant differences between mean
values were determined using Fisher’s, individual error rate, test following one-way
ANOVA. The effect of four selected concentration levels of antibiotics (Penicillin G,
Ampicillin, and Tetracycline) compared.
The p-value is the smallest level of significance. It would lead to rejection of the
null hypothesis H0. The ANOVA is a general and one of the most powerful statistical
methods that can be used to test the hypothesis that means among two or more groups
are equal under the assumption that sampled populations are normally distributed. The
reason for doing an ANOVA is to see if there is any difference between group on the
same variable. In one-way or one-factor ANOVA, there is only one factor, and the
analysis of variance is used to analyze the effect of one factor. The ANOVA table
includes the sum of squares, the mean square and an F distribution with degrees of
freedom. If the decision is to reject the null, then at least one of the means is different.
However, the ANOVA does not tell where the difference lies. For this, another test such
as Fisher’s test is needed (Montgomery 2001).
5.3.2. The Probabilistic Neural Network (PNN) Method
A design procedure for a novel application of neural networks has been
developed to confirm the EC results of this study. This method called the probabilistic
neural network (PNN). Probabilistic neural network (PNN) is a statistical algorithm.
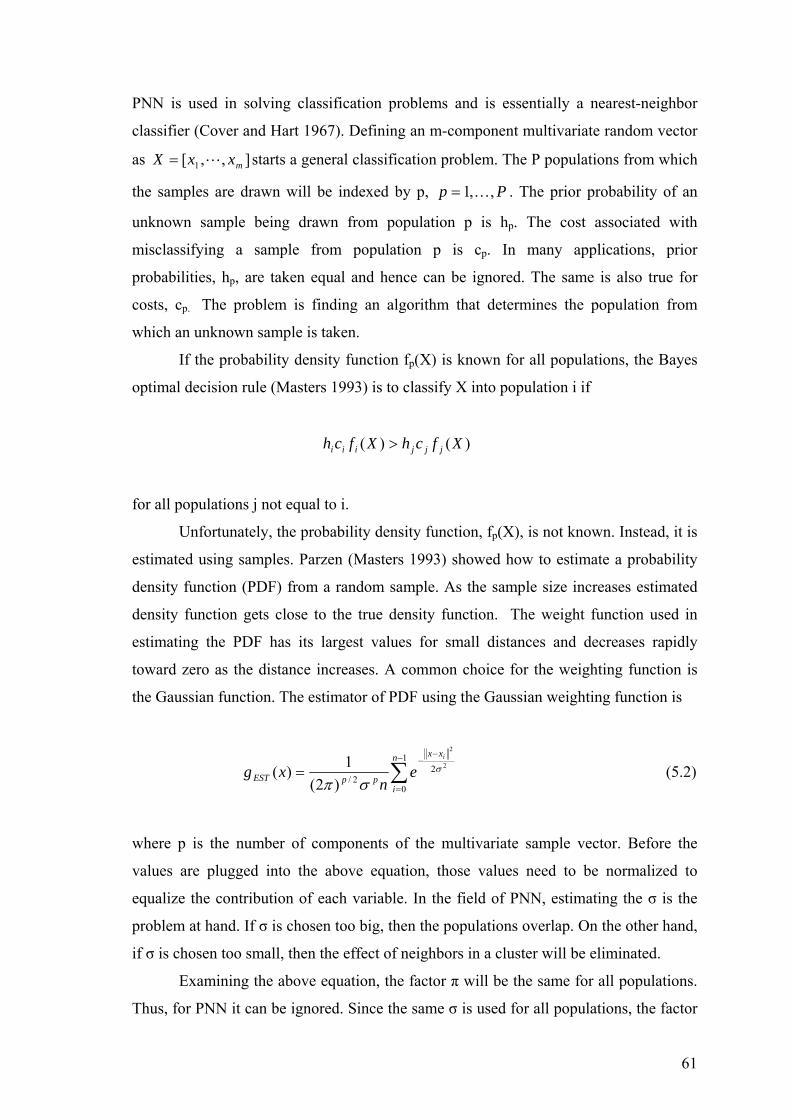
61
PNN is used in solving classification problems and is essentially a nearest-neighbor
classifier (Cover and Hart 1967). Defining an m-component multivariate random vector
as ],,[ 1 mxxX L= starts a general classification problem. The P populations from which
the samples are drawn will be indexed by p, Pp ,,1K= . The prior probability of an
unknown sample being drawn from population p is hp. The cost associated with
misclassifying a sample from population p is cp. In many applications, prior
probabilities, hp, are taken equal and hence can be ignored. The same is also true for
costs, cp. The problem is finding an algorithm that determines the population from
which an unknown sample is taken.
If the probability density function fp(X) is known for all populations, the Bayes
optimal decision rule (Masters 1993) is to classify X into population i if
)()( XfchXfch jjjiii >
for all populations j not equal to i.
Unfortunately, the probability density function, fp(X), is not known. Instead, it is
estimated using samples. Parzen (Masters 1993) showed how to estimate a probability
density function (PDF) from a random sample. As the sample size increases estimated
density function gets close to the true density function. The weight function used in
estimating the PDF has its largest values for small distances and decreases rapidly
toward zero as the distance increases. A common choice for the weighting function is
the Gaussian function. The estimator of PDF using the Gaussian weighting function is
∑−
=
−−
=1
0
22/
2
2
)2(1)(
n
i
xx
ppEST
i
en
xg σ
σπ (5.2)
where p is the number of components of the multivariate sample vector. Before the
values are plugged into the above equation, those values need to be normalized to
equalize the contribution of each variable. In the field of PNN, estimating the σ is the
problem at hand. If σ is chosen too big, then the populations overlap. On the other hand,
if σ is chosen too small, then the effect of neighbors in a cluster will be eliminated.
Examining the above equation, the factor π will be the same for all populations.
Thus, for PNN it can be ignored. Since the same σ is used for all populations, the factor
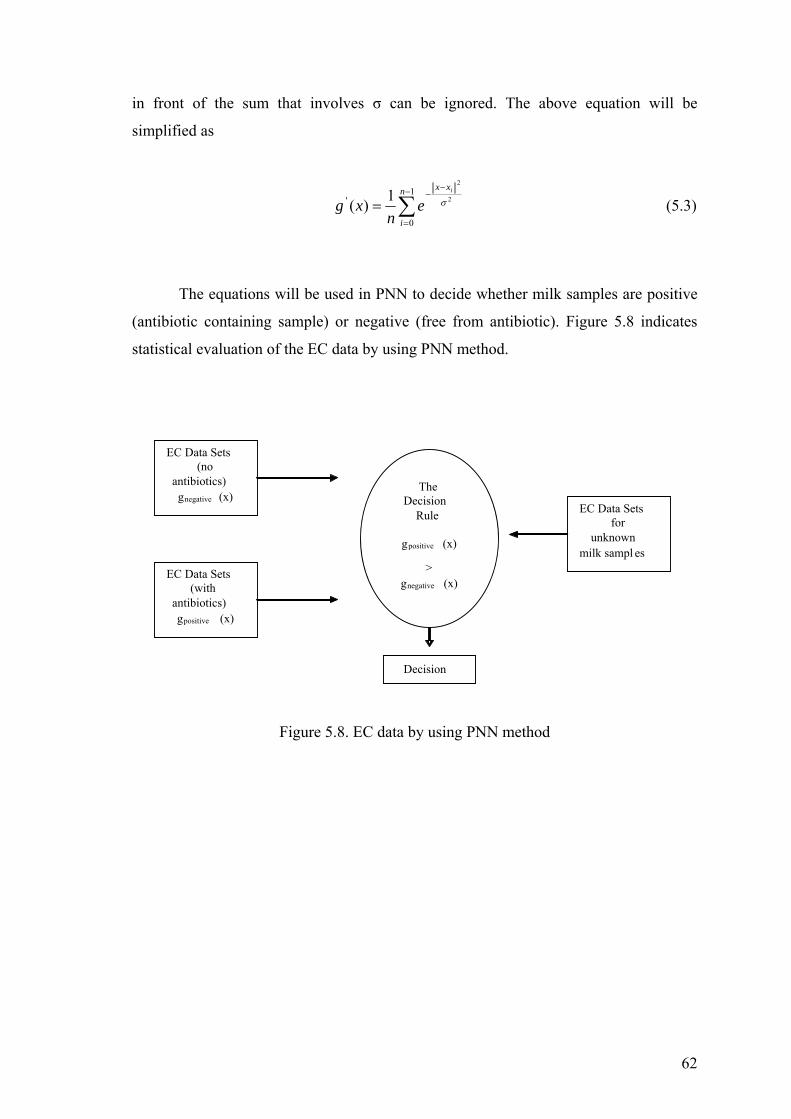
62
in front of the sum that involves σ can be ignored. The above equation will be
simplified as
∑−
=
−−
=1
0
' 2
2
1)(n
i
xx i
en
xg σ (5.3)
The equations will be used in PNN to decide whether milk samples are positive
(antibiotic containing sample) or negative (free from antibiotic). Figure 5.8 indicates
statistical evaluation of the EC data by using PNN method.
Figure 5.8. EC data by using PNN method
EC Data Sets
(no antibiotics) g negative (x)
EC Data Sets (with
antibiotics) gpositive (x)
The Decision
Rule
gpositive (x) >
gnegative (x)
Decision
EC Data Sets for
unknown milk sampl es

63
CHAPTER 6
RESULTS AND DISCUSSIONS
6.1. Introduction
UHT whole cow’s milk samples fortified with different antibiotics (Penicillin G,
Ampicillin and Tetracycline) were tested for determination of antibiotic residues. Milk
samples were collected from 2006 to 2008. Milk samples of the same brand were
purchased from the same source. It is important that there is no available adequate
published information on the status of antibiotic residues in milk and milk product in
Turkey. Moreover, there are no efficient antibiotic residue control programs, but there is
a requirement to determine management practices at dairy farms. If good management
practices are not implemented sufficiently, the health and financial risk involved in
antibiotic residues in milk will continue to exist in Turkey. There is also no any
satisfactory Residue Database or monitoring program, monitoring and controlling
residue to indicate risk to consumer, in Turkey. As before mentioned, antibiotic residue
analysis involves both screening and confirmatory methods. This study first focuses on
the evaluation of different tests for determining antibiotic residues in milk samples.
These tests are Copan Milk Test (microbial inhibitor test with spores of Bacillus
stearothermophilus var. calidolactis, ROSA Test (receptor assay) and Penzyme Milk
Test (enzymatic assay). In antibiotic residue screening of milk, the antibiotic residue
tests may be over-sensitive for the MRL values for certain antibiotic residues.
Therefore, samples may be determined as positive when antibiotic residues lower than
the MRL. This may be a problem result. It leads to a false positive or false negative,
especially at lower levels. These false results may cause enormous economic losses. In
order to overcome this problem associated with test kits, milk samples were artificially
contaminated with selected concentrations of Penicillin G, Ampicillin and Tetracycline.
The residue test kits and the selected concentration of target antibiotics were analyzed
by using confirmatory methods. These confirmatory methods are based on HPLC
analysis. In addition to these analyses, physical, thermo-physical and chemical
properties of milk samples were determined to reveal whether these measurements can

64
indicate any differences between antibiotic free milk (control) and milk containing
different levels of Penicillin G, Ampicillin and Tetracycline.
6.2. Initial Screening of Milk Samples
Before the all measurements, the initial screening of eight different UHT whole
cow’s milk samples was examined visually by using Copan Milk Test. After the
incubation time, color turned purple or yellow. A purple color indicates a positive result
(existence of antibiotics) whereas a color change to yellow indicates a negative result
(no antibiotic). These results are illustrated in Figure 6.1. The interpretation is in
accordance with the color card for Copan Milk Test. Copan Milk Test showed three of
them “positive”, three of them “negative” and one of them “partial negative”.
According to these results, milk samples were further analyzed in order to confirm the
existence of any antibiotic residue by yogurt culture test. In other words, yogurt culture
test was performed to confirm false-positive outcomes in milk samples. During the
yogurt culture test, yogurt formation was not observed at positive samples. Table 6.1
shows Copan Milk Test and yogurt culture test results for UHT whole cow’s milk
samples. After the Copan Milk Test and yogurt culture test, one negative milk sample
was chosen for the measurements and fortified with Penicillin G, Ampicillin and
Tetracycline at the selected concentrations.
Figure 6.1. Visual interpretation of Copan Milk Test result

65
Table 6.1. Copan milk test and yogurt culture test results for milk samples
Milk Samples
Copan Milk Test (reading at 3 h +/- 15’)
Yogurt Culture Test
Visual Reading
Color Card for Copan Milk Test
Yogurt Formation
Sample 1 Yellow Negative Yogurt Formation (+)
Sample 2 Yellow Negative Yogurt Formation (+)
Sample 3 Yellow Negative Yogurt Formation (+)
Sample 4 Yellow + Purple Partial Negative
Not a good characteristic curd for yogurt (+/-)
Sample 5 Purple Positive No yogurt Formation (-)
Sample 6 Purple Positive No yogurt Formation (-)
Sample 7 Purple Positive No yogurt Formation (-)
Sample 8 Purple Positive No yogurt Formation (-)
6.3. The Acidity, pH and Density of Milk Samples
Firstly, milk samples were tested by Copan Milk Test. This test results indicated
that milk samples did not contain antibiotic residue. Then milk samples were artifically
contaminated with MRL level of Penicillin G, Ampicillin and Tetracycline.
After that procedure, the acidity, pH and density of four antibiotic free milk
samples and spiked samples were measured at 25 °C. The acidity and pH results of milk
samples are presented in Table 6.2. The acidity and pH of antibiotic free milk samples
and spiked milk samples were determined similar value with each other. In addition, the
acidity and pH results of milk samples showed similar result with literature. The
titratable acidity of healthy cow milk is in the range of 0.14% - 0.16% in terms of milk
acid (Metin 2001 and Rosenthal 1991). pH of bovine milk is in the range of 6.22 - 6.77
(Jensen 1995). Characteristic pH value at 25 °C is measured as 6.6 and reported range is
6.5-6.7 (Webb, et al. 1974).

66
Table 6.2. Acidity and pH results of milk samples
Milk
Sample
Acidity
(% lactic acid)
pH
(25 °C)
Sample 1 0.1450±0 6.650±0
Sample 1 containing antibiotic 0.1425±0.0035 6.650±0
Sample 2 0.1475±0.0035 6.585±0.0071
Sample 2 containing antibiotic 0.1475±0.0035 6.600±0
Sample 3 0.1300±0 6.660±0
Sample 3 containing antibiotic 0.1300±0 6.665±0.0071
Sample 4 0.1550±0 6.545±0.0071
Sample 4 containing antibiotic 0.1500±0 6.520±0.0141
Literature 0.14 - 0.16 6.4 - 6.7
Table 6.3, Table 6.4, Table 6.5 and Table 6.6 indicated that there are no
differences between density values of control and spiked samples.
Figure 6.2, Figure 6.3, Figure 6.4 and Figure 6.5 show data obtained for milk
samples having at least 3.1% fat content at different temperatures (15, 20, 25, 30, 35,
40, 45, 50 °C, respectively). Similar behavior was obtained for both antibiotic free milk
samples and spiked milk samples. It was found that the density of milk samples
decreased with increasing temperature for all milk samples.
These results indicated that heat treatment had significant effect on the density
of milk samples. One of the aspects of the density of milk is the effects of temperature.
Mean density of milk samples ranges from 1.03463 at 0 °C to 1.02092 at 44 °C. The
mean density is 1.3071 at 18 °C (Rutz et al. 1955). Density is so changeable due to all
substances contributing to its composition. The density of milk is 1.027 g/ml – 1.035
g/ml at 20 °C based on its composition. It decreases because of increasing fat content
and increases because of decreasing fat content. The density of milk also increases
because of increasing quantity of protein, lactose and mineral substance. Increasing
temperature causes a decrease in density of milk (Metin 2001). According to Neville
and Jensen (1995), the specific gravity of milk is 1.021 – 1.037. The density of milk
normally ranges from 1.028 and 1.034 depending on composition. That is why the
results given here are specific to tested milk samples and show some variability based

67
on composition differences. Overall, milk is very slightly denser than water and
presence of antibiotics of MRL level did not affect the density values of UHT whole
milk samples.
Table 6.3. Density results for milk sample 1
Milk Sample 1 Temperature (°C) Density (g/cm3) Antibiotic free 15 1.0279±0.0002 Antibiotic free 20 1.0271±0 Antibiotic free 25 1.0253±0 Antibiotic free 30 1.0233±0 Antibiotic free 35 1.0211±0.0001 Antibiotic free 40 1.0189±0 Antibiotic free 45 1.0167±0 Antibiotic free 50 1.0141±0.0004
Fortified with antibiotic 15 1.0274±0 Fortified with antibiotic 20 1.0271±0 Fortified with antibiotic 25 1.0256±0 Fortified with antibiotic 30 1.0235±0.0002 Fortified with antibiotic 35 1.0212±0 Fortified with antibiotic 40 1.0189±0 Fortified with antibiotic 45 1.0172±0.0002 Fortified with antibiotic 50 1.0147±0.0002
1.0080
1.0140
1.0200
1.0260
1.0320
0 10 20 30 40 50 60
Temperature (oC)
Den
sity
(g/c
m3 )
Antibiotic free sample Spiked sample
Figure 6.2. Density change vs temperature for antibiotic free milk sample 1 and spiked
milk sample 1

68
Table 6.4. Density results for milk sample 2
Milk Sample 2 Temperature (°C) Density (g/cm3) Antibiotic free 15 1.0289±0.0001 Antibiotic free 20 1.0287±0 Antibiotic free 25 1.0272±0 Antibiotic free 30 1.0251±0 Antibiotic free 35 1.0230±0 Antibiotic free 40 1.0209±0 Antibiotic free 45 1.0188±0 Antibiotic free 50 1.0167±0
Fortified with antibiotic 15 1.0293±0 Fortified with antibiotic 20 1.0288±0 Fortified with antibiotic 25 1.0272±0.0001 Fortified with antibiotic 30 1.0253±0 Fortified with antibiotic 35 1.0232±0 Fortified with antibiotic 40 1.0208±0 Fortified with antibiotic 45 1.0188±0.0001 Fortified with antibiotic 50 1.0168±0
1.0160
1.0200
1.0240
1.0280
1.0320
0 10 20 30 40 50 60
Temperature (oC)
Den
sity
(g/c
m3 )
Antibiotic free sample Spiked sample
Figure 6.3. Density change vs temperature for antibiotic free milk sample 2 and spiked
milk sample 2

69
Table 6.5. Density results for milk sample 3
Milk Sample 3 Temperature (°C) Density (g/cm3) Antibiotic free 15 1.0256±0 Antibiotic free 20 1.0258±0 Antibiotic free 25 1.0248±0 Antibiotic free 30 1.0233±0 Antibiotic free 35 1.0218±0 Antibiotic free 40 1.0190±0 Antibiotic free 45 1.0163±0.0002 Antibiotic free 50 1.0136±0.0001
Fortified with antibiotic 15 1.0276±0 Fortified with antibiotic 20 1.0268±0 Fortified with antibiotic 25 1.0251±0 Fortified with antibiotic 30 1.0235±0 Fortified with antibiotic 35 1.0207±0 Fortified with antibiotic 40 1.0184±0.0001 Fortified with antibiotic 45 1.0162±0 Fortified with antibiotic 50 1.0137±0
1.0080
1.0140
1.0200
1.0260
1.0320
0 10 20 30 40 50 60
Temperature (oC)
Den
sity
(g/c
m3 )
Antibiotic free sample Spiked sample
Figure 6.4. Density change vs temperature for antibiotic free milk sample 3 and milk
sample 3 containing antibiotic

70
Table 6.6. Density results for milk sample 4
Milk Sample 4 Temperature (°C) Density (g/cm3) Antibiotic free 15 1.0264±0.0001 Antibiotic free 20 1.0267±0 Antibiotic free 25 1.0260±0 Antibiotic free 30 1.0235±0 Antibiotic free 35 1.0213±0 Antibiotic free 40 1.0189±0 Antibiotic free 45 1.0171±0 Antibiotic free 50 1.0147±0
Fortified with antibiotic 15 1.0267±0.0002 Fortified with antibiotic 20 1.0268±0 Fortified with antibiotic 25 1.0254±0.0002 Fortified with antibiotic 30 1.0239±0 Fortified with antibiotic 35 1.0217±0.0002 Fortified with antibiotic 40 1.0195±0 Fortified with antibiotic 45 1.0156±0.0002 Fortified with antibiotic 50 1.0146±0
1.0100
1.0150
1.0200
1.0250
1.0300
0 10 20 30 40 50 60
Temperature (oC)
Den
sity
(g/c
m3 )
Antibiotic free sample Spiked sample
Figure 6.5. Density change vs temperature for antibiotic free milk sample 4 and milk
sample 4 containing antibiotic

71
6.4. The Electrical Conductivity of Milk Samples
Prior to electrical conductivity (EC) measurements, The Copan Milk Test,
Penzyme and Rosa Test, having different principle of method were evaluated for
determining antibiotic residues in selected brand of UHT whole cow’s milk samples.
The results of test kits indicated that no antibiotic was present in these samples. The
Figure 6.6 shows these results visually. The visual results of the milk tests were also
confirmed yogurt culture test. After these results, electrical conductivity measurements
were performed to detect the antibiotics in these samples. For this purpose, Penicillin G,
Ampicillin and Tetracycline were chosen target antibiotic in this study. Milk samples
were artificially contaminated with selected concentrations of these antibiotics.
Electrical conductivity measurements were conducted both on the whole milk fortified
with Penicillin G, Ampicillin, Tetracycline and on whole cow’s milk free from
antibiotics (control). Conductivity data collected along one year interval period for each
seasons and for each antibiotics from 2006 to 2008.
Figure 6.6. Visual interpretation of Copan Milk Test, Penzyme and ROSA Test results

72
Following observations can be drawn out from the usage of different test kits:
The Copan Milk Test is new inhibition assay. It was developed more recently and
consists of the nutrient pre-corporated in the agar. Penzyme is an enzyme colorimetric
assay for rapid determination of beta-lactam antibiotics. ROSA Test is receptor assay.
The drawback of Penzyme tests is based on having a rather narrow antibiotic spectrum
including only beta-lactams as compared to two other tests. According to testing
procedures, the Copan milk test is simple to use, easy to read and having a long shelf
life. The ROSA test is a good immuno-receptor test because it is fast to run, simple to
use. Despite these advantages, ROSA reader device is required for testing milk samples,
because detection can be difficult without the reader. Table 6.7 shows that detection
limits of Copan Milk Test and ROSA Test. In contrast to these milk tests, Penyzme Test
was used only for detection of beta-lactams. It was not suitable for detection of other
antibiotic residues. In contrast to the detection limit of Copan Milk Test, ROSA test is
more sensitive for tetracycline residues. However, Copan milk test found more sensitive
for detection of beta-lactams.
Table 6.7. Limits of detection with Copan Milk Test and ROSA Test
Milk Test Antibiotics Test Detection Limit (ppb) MRL (ppb) Copan Milk Test
Penicillin G 1 – 2 4 Ampicillin < 2 4 Tetracycline 250 - 500 100
ROSA Test Penicillin G 2 - 3 4 Ampicillin 3 - 4 4 Tetracycline 30 - 90 100
Yogurt formation was observed at the end of 6 hours incubation time. Yogurt
culture test results for milk samples are given in Table 6.8. The change in the
consistency and pH during yogurt formation was also observed for milk samples
containing Penicillin G, Ampicillin, and Tetracycline at selected concentrations. pH of
milk samples was measured at 0., 2., 4., 6. hour of incubation time. The blank sample
(antibiotic free milk) reached the maximum curd firmless at about pH 4.6 due to the fact
that sufficient acidity was generated at the end of 6 h to form a coagulum. Different

73
concentrations of Penicillin G, Ampicillin and Tetracycline gave no curd formation
results. pH of the antibiotic positive milk samples was determined to have the highest
pH level in contrast to negative milk samples. Yogurt formation was not observed at
and above 2 ppb Penicillin G and Ampicillin concentration, and at and above 100 ppb
Tetracycline concentration.
Table 6.8. Consistency and pH of milk samples containing selected concentrations of
Penicillin G, Ampicillin, Tetracycline
Concentration
(ppb)
pH (at the end of incubation
time) Consistency
(visually) Penicillin G
0 4.487±0.1224 Custard-like curd
2 5.707±0.1490 No Yogurt Formation
4 5.766±0.1188 No Yogurt Formation
8 5.974±0.1203 No Yogurt Formation
Ampicillin
0 4.578±0.2079 Custard-like curd
2 6.428±0.1303 No Yogurt Formation
4 6.444±0.1165 No Yogurt Formation
8 6.465±0.1036 No Yogurt Formation
Tetracycline
0 4.470±0.2026 Custard-like curd
100 5.583±0.2042 No Yogurt Formation
250 5.854±0.1805 No Yogurt Formation
500 6.037±0.1203 No Yogurt Formation
Literature 0 ~ 4.600 The maximum curd
According to Grunwald and Petz (2002), coagulation was influenced negatively
by increasing concentrations of antibiotic residues. The precipitation of milk proteins
and the impact of living yoghurt cultures on penicillin residues result in the decreasing

74
pH. The polarity of the side chain of the penicillin (ampicillin < penicillin) decreased
with increasing the amount of bound penicillins. These might be indicated by preferred
binding to hydrophobic sites in the milk protein.
After the Copan, Penzyme, ROSA and yogurt culture tests, negative milk
samples were chosen for the electrical conductivity measurements and fortified with
Penicillin G, Ampicillin and Tetracycline at the selected concentrations.
Electrical conductivity of antibiotic free milk samples is changed from 5.285 to
5.341 mS/cm at 25 °C. The typical electrical conductivity of milk at 25 °C is reported as
4.0 - 5.5 mS/cm (Therdthai and Zhou 2001). It was observed that the electrical
conductivity of milk samples increased slightly with increasing antibiotic concentration,
as can be seen from Figure 6.7. According to Norberg (2005), EC of the milk samples
increases because of increasing concentration of Na+, K+ and Cl- in milk. The evaluating
conductivity at Penicillin G, Ampicillin and Tetracycline at selected concentrations
demonstrates that it is of significance for having knowledge of how concentrations of
antibiotics affect the electrical conductivity of milk.
According to Zhuang, et al. (1997) and Mucchetti, et al. (1994), the electrical
conductivity of milk is especially due to its mineral salt fraction and the protein content
is not of major importance. Lactose is an uncharged sugar thereby it does not conduct
current. Fat is a nonconductor. This means it hinders the conduction of electricity by
reducing volume and by impeding the mobility of ions. Because of the thin
nonconductive membrane that covers the fat globules, EC decreases with increasing fat
content in milk (Norberg 2005). Casein shows a very low conductivity in contrast to
milk salts. Hence, the conductivity of milk is determined primarily by H+ and Cl- and
also other ions. UHT whole milk has higher electrical conductivity than unprocessed
milk because of the reduction in size of the milk fat globules. In addition, EC of milk
affects by mastitis.
The electrical conductivity of milk samples changes in terms of mastitis, the
season, the age of milk, milking interval, the stage of lactation, the breed of cattle and
milk composition (Norberg 2005). It is indicated that these factors affect conducting
ions in milk. Therefore, UHT whole cow’s milk samples of the same brand were
purchased from the same source. The effect of seasonal differences on electrical
conductivity was also investigated Figure 6.7. The milk samples were collected and
tested at every month during the autumn, winter, spring and summer periods starting in
August 2006.

75
Figure 6.7. EC of milk samples containing selected concentrations of Penicillin G,
Ampicillin and Tetracycline (samples collected at different periods of the
year)
4.860
4.950
5.040
5.130
5.220
5.310
5.400
5.490
EC (m
S/cm
)
0 ppb 2 ppb 4 ppb 8 ppb
Penicillin G concentration (ppb)
Autumn
Winter
Spring
Summer
4.930
5.015
5.100
5.185
5.270
5.355
5.440
5.525
EC (m
S/cm
)
0 ppb 2 ppb 4 ppb 8 ppb
Ampicillin concentration (ppb)
Autumn
Winter
Spring
Summer
4.920
4.980
5.040
5.100
5.160
5.220
5.280
5.340
EC (m
S/cm
)
0 ppb 100 ppb 250 ppb 500 ppb
Tetracycline concentration (ppb)
Autumn
Winter
Spring
Summer

76
EC of milk has been commonly used for monitoring mastitis for many years.
Therefore, the differences in electrical conductivity of antibiotic free milk sample and
the milk samples containing Penicillin G, Ampicillin and Tetracycline at selected
concentrations were examined statistically in order to evaluate the EC measurement is
or is not a good detection tool for antibiotic residues in milk. One-way ANOVA with
Fisher’s test, individual error rate, were performed to evaluate the EC results (Table 6.9,
Table 6.10 and Table 6.11). The means of antibiotic free milk samples and milk samples
containing selected concentrations of Penicillin G, Ampicillin and Tetracycline were
assessed. The ANOVA results addressed that the means of milk samples were
statistically different at the significant level of 5 % and concluded that there was strong
evidence to indicate that the mean of electrical conductivity of milk samples differ from
each other (p<0.05). The selected concentrations of Penicillin G, Ampicillin and
Tetracycline significantly affected the mean of electrical conductivity.
Table 6.9. ANOVA results of EC for milk containing Penicillin G
Penicillin G Concentration
(ppb)
Electrical Conductivity
(mS/cm)
Autumn
0 5.2873 ± 0.0799a
2 5.3327 ± 0.0729ab
4 5.3600 ± 0.0713ab
8 5.3820 ± 0.0766b
Winter
0 5.1560 ± 0.0287a
2 5.1733 ± 0.0253ab
4 5.1907 ± 0.0237bc
8 5.2060 ± 0.0247c
Spring
0 5.1133 ± 0.0261a
2 5.1387 ± 0.0196b
4 5.1580 ± 0.0251b
8 5.1833 ± 0.0209c
(Cont. on next page)

77
Table 6.9 (cont.). ANOVA results of EC for milk containing Penicillin G
Summer
0 5.3887 ± 0.0245a
2 5.4067 ± 0.0168b
4 5.4247 ± 0.0052b
8 5.4567 ± 0.0140c
a-cvalues in a column with the same superscript are not significantly different by
Fisher’ s tests (p<0.05)
Table 6.10. ANOVA results of EC for milk containing Ampicillin
Ampicillin Concentration
(ppb)
Electrical Conductivity
(mS/cm)
Autumn
0 5.2513 ± 0.0476a
2 5.2740 ± 0.0503ab
4 5.2960 ± 0.0574ab
8 5.3187 ± 0.0061b
Winter
0 5.2347 ± 0.0508a
2 5.2847 ± 0.0168b
4 5.3193 ± 0.0276c
8 5.3447 ± 0.0250c
Spring
0 5.1167 ± 0.0403a
2 5.1380 ± 0.0399ab
4 5.1620 ± 0.0414bc
8 5.1933 ± 0.0497c
Summer
0 5.3600 ± 0.0196a
2 5.3880 ± 0.0211b
4 5.4153 ± 0.0177c
8 5.4427 ± 0.0167d

78
Table 6.11. ANOVA results of EC for milk containing Tetracycline
Tetracycline Concentration
(ppb)
Electrical Conductivity
(mS/cm)
Autumn
0 5.2340 ± 0.0600a
100 5.2660 ± 0.0680ab
250 5.2907 ± 0.0713ab
500 5.3200 ± 0.0721b
Winter
0 5.0893 ± 0.0183a
100 5.1120 ± 0.0197b
250 5.1353 ± 0.0151c
500 5.1580 ± 0.0170d
Spring
0 5.1060 ± 0.0253a
100 5.1293 ± 0.0183b
250 5.1507 ± 0.0202bc
500 5.1707 ± 0.0209c
Summer
0 5.2567 ± 0.0070a
100 5.27533 ± 0.0052b
250 5.29533 ± 0.0074c
500 5.32867 ± 0.0074d
a-dColumn means having a different letter are significantly different (p<0.05)
After the promising results obtained from electrical conductivity measurements,
PNN method was performed in order to classify unknown milk samples as positive or
negative. Electrical conductivity data of negative and positive milk samples spiked with
Penicillin G, Ampicillin and Tetracycline were used as input data to PNN and unknown
data sets were tested to be classified as whether they were antibiotic positive or
negative. Overall, the probabilistic neural network (PNN) achieved an average
recognition performance of 100%. This high level of recognition suggests that the PNN

79
is a promising method for detecting the divergence among the electrical conductivity of
different samples.
In other words, the results of this study showed that the electrical conductivity
measurement along with PNN method was proven to be used for detection of antibiotic
residues in milk but needs to be investigated more in terms of milk composition. It is
known that increasing protein concentration increases the EC whereas increasing the
lactose and fat concentration decreases the EC. This research is demonstrated that a
computer program can be developed by combining PNN method with interaction
between EC and milk constituents.
6.5. The DSC Results of Milk Samples
Thermo-physical properties of milk containing antibiotic residues have not been
published yet. In this study, melting and evaporation data were used to characterize
thermal behavior of antibiotic free milk samples and milk samples fortified with
Penicillin G (0, 2, 4, 8 ppb) Ampicillin (0, 2, 4, 8 ppb) and Tetracycline (0, 100, 250,
500 ppb). Melting and evaporation points were recorded at the maximum of
endothermic peaks.
Figure 6.8, 6.9 and 6.10 show effects of antibiotic concentration on melting
temperature, heat of fusion, evaporation temperature and heat of evaporation of
antibiotic free milk samples and milk samples containing Penicillin G, Ampicillin and
Tetracycline. Heat of fusion and heat of evaporation and evaporation temperature are
increased by increasing antibiotic concentrations. On the other hand, melting
temperature is increased at the same conditions.
Figure 6.11, 6.12 and 6.13 indicate DSC. DSC curves of target antibiotics at
selected concentrations show big endothermic peaks. As can be seen Figure 6.11, 6.12
and 6.13, there are differences in melting temperature, heat of fusion, evaporation
temperature, heat of evaporation and onset temperatures of transitions.
It was observed that the peak temperatures and areas increased with increasing
antibiotic concentration levels. Peaks appeared sharper and clearer with the increase of
endothermic enthalpy. These differences provide a basis for detection of antibiotic
residues in milk using DSC. The statistical testing showed that antibiotic concentration
had a significant effect on these thermal parameters (melting temperature, heat of

80
fusion, evaporation temperature and heat of evaporation) at a 95% confidence level. The
Fisher’s, individual error rate, test were clearly shown in Table 6.8 for antibiotic free
milk samples and milk samples fortified with Penicillin G, Ampicillin and Tetracycline
at selected concentrations.
In thermal behavior of antibiotic free milk samples and milk spiked with
Penicillin G, Ampicillin, Tetracycline, there are two endothermic peaks for each
sample. For Penicillin G residues, the DSC thermo-gram of milk samples shows two
endothermic signal around 3.6000 to 1.9850, 112.625 to 129.970 °C, respectively. It is
conclude that first thermal event is a melting endotherm and second one is an
evaporation endotherm. For Ampicillin residues, first endothermic peak is in the
temperature range of 2.9850 to 1.7050 °C. Second endothermic peak is a very wide and
intense endothermic peak in the temperature range of 113.380 to 123.565 °C. For
Tetracycline residues, the average values of first endothermic peak temperature of milk
samples at selected concentrations (0, 100, 250, 500 ppb) is changed from 3.5600 to
2.3050 °C. Second endothermic peak temperature is in between 192.60 to 218.30 °C.
All peaks appeared sharper and clearer with the increase of endothermic enthalpy.

81
1.0
1.8
2.6
3.4
4.2
0 2 4 6 8 10
Penicillin G concentration (ppb)
Mel
ting
tem
p. (0 C
)
203.0
210.0
217.0
224.0
231.0
0 2 4 6 8 10
Penicillin G concentration (ppb)
Hea
t of f
usio
n (J
/g)
(a) (b)
104.0
112.0
120.0
128.0
136.0
0 2 4 6 8 10
Penicillin G concentration (ppb)
Evap
orat
ion
tem
p. (0 C
)
1400.0
1420.0
1440.0
1460.0
1480.0
0 2 4 6 8 10
Penicillin G concentration (ppb)
Hea
t of e
vapo
ratio
n (J
/g)
(b) (d)
Figure 6.8. Effects of Penicillin G concentration on the thermal parameters (a) melting
temperature, (b) heat of fusion, (c) evaporation temperature, (d) heat of
evaporation of milk samples

82
1.0
1.6
2.2
2.8
3.4
0 2 4 6 8 10
Ampicillin concentration (ppb)
Mel
ting
tem
p. (o C
)
192.0
198.0
204.0
210.0
216.0
0 2 4 6 8 10
Ampicillin concentration (ppb)
Hea
t of F
usio
n (J
/g)
(a) (b)
112.0
116.0
120.0
124.0
128.0
0 2 4 6 8 10
Ampicillin concentration (ppb)
Evap
orat
ion
tem
p. (o C
)
1260.0
1320.0
1380.0
1440.0
1500.0
0 2 4 6 8 10
Ampicillin concentration (ppb)
Hea
t of e
vapo
ratio
n (J
/g)
(c) (d)
Figure 6.9. Effects of Ampicillin concentration on the thermal parameters (a) melting
temperature, (b) heat of fusion, (c) evaporation temperature, (d) heat of
evaporation of milk samples
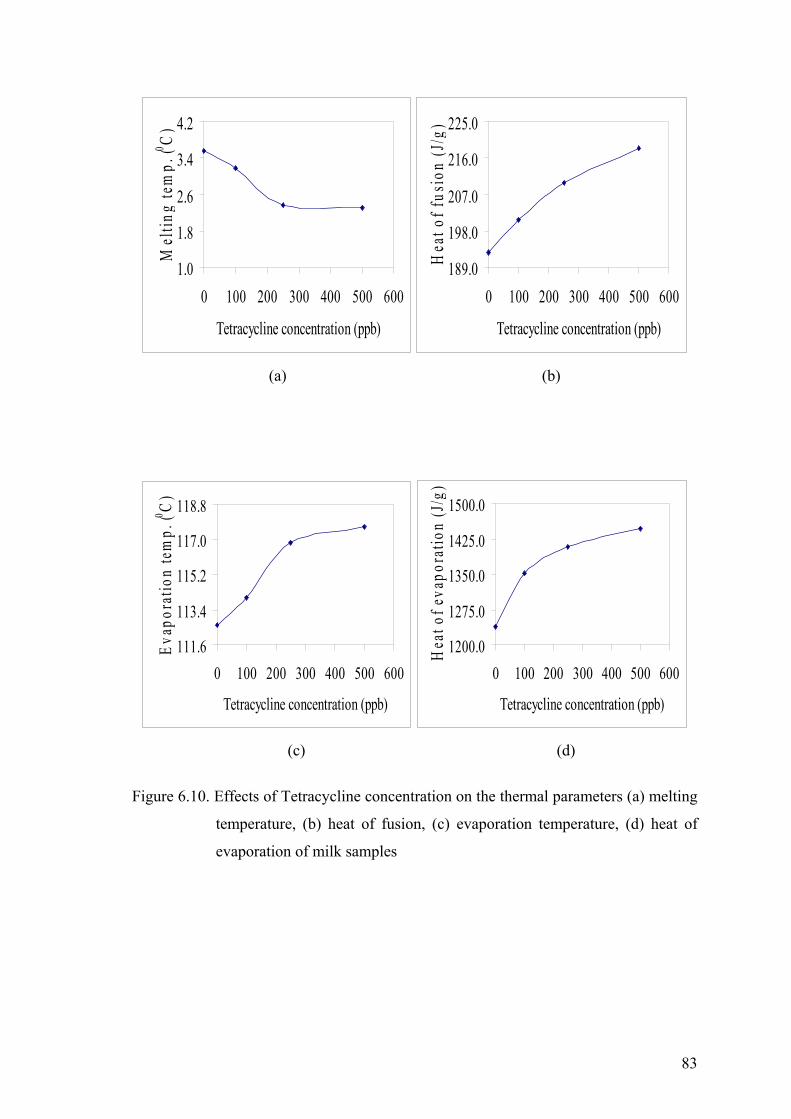
83
1.0
1.8
2.6
3.4
4.2
0 100 200 300 400 500 600
Tetracycline concentration (ppb)
Mel
ting
tem
p. (0 C
)
189.0
198.0
207.0
216.0
225.0
0 100 200 300 400 500 600
Tetracycline concentration (ppb)
Hea
t of f
usio
n (J
/g)
(a) (b)
111.6
113.4
115.2
117.0
118.8
0 100 200 300 400 500 600
Tetracycline concentration (ppb)
Evap
orat
ion
tem
p. (0 C
)
1200.0
1275.0
1350.0
1425.0
1500.0
0 100 200 300 400 500 600
Tetracycline concentration (ppb)
Hea
t of e
vapo
ratio
n (J
/g)
(c) (d)
Figure 6.10. Effects of Tetracycline concentration on the thermal parameters (a) melting
temperature, (b) heat of fusion, (c) evaporation temperature, (d) heat of
evaporation of milk samples

84
Figure 6.11. DSC curves of milk samples containing 0, 2, 4, 8 ppb Penicillin G
Figure 6.12. DSC curves of milk samples containing 0, 2, 4, 8 ppb Ampicillin

85
Figure 6.13. DSC curves of milk samples containing 0, 100, 250, 500 ppb Tetracycline

86
Table 6.12. Influence of antibiotic concentration on the DSC curves of milk samples
with results of Fisher’s, individual error rate, test
Peak
Temperature (°C)
Peak
Area (J g-1)
Type of
antibiotic
Concentration
(ppb) 1. peak 2. peak 1. peak 2. peak
Penicillin G
0
3.6000
± 0.0707a
112.625
± 0.035a
209.80
± 2.40a
1404.00
± 18.38a
2
2.8950
± 0.0495b
113.770
± 0.042a
215.10
± 0.42b
1427.50
± 0.71ab
4
2.4500
± 0.0849c
114.940
± 0.014a
220.20
± 0.42c
1441.50
± 6.36bc
8
1.9850
± 0.1061d
129.970
± 1.513b
228.45
± 0.64d
1473.50
± 0.71c
Ampicillin
0
2.9850
± 0.0212a
195.75
± 0.92a
113.380
± 0.792a
1276.0
± 33.9a
2
2.5800
± 0.2263ab
200.90
± 1.41b
117.415
± 0.035b
1296.0
± 52.3a
4
2.2000
± 0.0990b
212.20
± 1.27c
119.775
± 0.474c
1386.5
± 2.1ab
8
1.7050
± 0.0919c
214.30
± 0.57c
123.565
± 0.389d
1436.5
± 17.7b
Tetracycline
0
3.5600
± 0.0141a
192.60
± 5.66a
112.605
± 0.064a
1238.5
± 7.8a
100
3.1850
± 0.0495b
200.65
± 3.61ab
114.010
± 0.127b
1351.5
± 14.8b
250
2.3700
± 0.0283c
209.80
± 2.40bc
116.835
± 0.021c
1407.5
± 9.2bc
500
2.3050
± 0.0071c
218.30
± 0.00c
117.645
± 0.120d
1447.0
± 35.4c
±: standard deviation for milk samples containing target antibiotics at selected
concentrations
a-dvalues in a column with the same superscript are not significantly different by
Fisher’s test (p<0.05)

87
6.6. Fat, Protein, Lactose, Minerals, SNF and Freezing Point Results of
Milk Samples
Lactostar is a new developed machine for the routine testing of milk. The
measurement is based on a thermo-optical procedure combination. In opto-unit, the
undissolved (visible) substances are analyzed such as the sum of fat and protein. It also
contains impedance or conductance measurement. In thermal unit, the fat content and
the fat-free dry matter are measured.
The fat content of milk and milk products is of significance for the quality.
Spectrometric methods are often used to determine fat content. Due to being high cost
method, acid butyrometrie is preferred. This method is simple to apply, low-cost.
However, there are several drawbacks. It requires practical handling skills (Badertscher,
et al. 2007). The Kjeldahl method and dye-binding methods are used for protein
determination. The kjeldahl method has long time to analyze and skill required to
conduct. Dye-binding method is more rapid method than the Kjeldahl method. Lactose
is determined by polarimetric method, gravimetric method, enzymatic method and
HPLC method. The ash of milk includes exposing to very high heat. HPLC is preferred
for determination of vitamins. HPLC is more complex. The ash content of milk means
the total mineral content of milk. For determination of each mineral in milk, atomic
absorption spectrophotometry is chosen (Hui 1993). Because of these disadvantages of
each method, lactostar usage became a good measurement unit in terms of
automatisation such as low-cost, less time.
Milk composition affects on rheological and chemical behavior markedly. Fat,
protein, lactose, minerals and solid not fat content of antibiotic free milk samples and
milk samples spiked with antibiotics is an important indication of these properties. In
addition, increasing false-positive results of several screening test is associated with
increasing concentrations of fat, protein, somatic cells, free fatty acids and lactoferrin in
milk. For instance, increasing milk protein content caused an increase in false-positive
results for the Penzyme screening test (Andrew 2000).
Therefore, this experiment was aimed to investigate the effects of antibiotic
concentrations (Penicillin G, Ampicillin, and Tetracycline) on composition of milk
samples. The experimental data obtained for milk samples as fat%, protein%, lactose%,
SnF%, EMC% and Fpp (°C). By using Minitab 14 trial version, the data were evaluated

88
statistically. The statistical testing showed that Penicillin G, Ampicillin and
Tetracycline concentration had a significant effect on EMC% and conductivity of milk
samples at 95% confidence level. In addition, Penicillin G concentration had also a
significant effect on Fpp (°C) of milk samples. The freezing point of milk is ranged
from -0.53 to 0.59 °C. After high-temperature processing, e.g., ultra heat treatment,
sterilization, the freezing point rises because of precipitation of some phosphates (Otter
2003). However, at similar level of the antibiotic concentration, the statistical testing
showed no significant difference among the values of fat%, protein%, lactose%, SnF%,
at a 95% confidence level. An increase in antibiotic concentration means an increase in
EMC% and conductivity but decrease in Fpp (Table 6.13, 6.14. and 6.15).
Table 6.13. Effect of Pencillin G concentration on the Lactostar result of milk samples
with using Fisher’s test
Penicillin G
Concentration (ppb)
Fpp
(°C)
EMC%
(Minerals)
Conductance
(mS)
0 -0.49440 ± 0.00184a 0.50533 ± 0.03642a 19.615 ± 1.416a
2 -0.49573 ± 0.00046a 0.53267 ± 0.02219ab 20.704 ± 0.747ab
4 -0.49107 ± 0.00585ab 0.55200 ± 0.02513bc 21.370 ± 1.019bc
8 -0.48933 ± 0.00690b 0.56333 ± 0.03579c 21.868 ± 1.367c
Table 6.14. Effect of Ampicillin concentration on the Lactostar result of milk samples
with using Fisher’s test
Ampicillin
Concentration (ppb)
EMC%
Conductance
(mS)
0 0.50533 ± 0.03642a 19.615 ± 1.416a
2 0.57667 ± 0.03677b 22.299 ± 1.441b
4 0.58267 ± 0.04367b 22.682 ± 1.641b
8 0.59000 ± 0.04472b 22.682 ± 1.763b

89
Table 6.15. Effect of Tetracycline concentration on the Lactostar result of milk samples
with using Fisher’s test
Tetracycline
Concentration (ppb)
EMC %
Conductance
(mS)
0 0.50533 ± 0.03642a 19.615 ± 1.416a
100 0.59467 ± 0.04941b 23.117 ± 1.791b
250 0.60000 ± 0.04472b 23.301 ± 1.796b
500 0.60600 ± 0.04837b 23.448 ± 1.855b
a-cvalues in a column with the same superscript are not significantly different by
Fisher’s test (p<0.05)
6.7. Confirmation of Target Antibiotics in Milk
The analytical method for the determination of Penicillin G, Ampicillin and
Tetracycline residues in milk was conducted. The recovery and precision of the methods
were evaluated by analyzing milk samples fortified with Penicillin G at levels of 2, 4
and 8 ppb, Ampicillin at levels of 2, 4 and 8 ppb and Tetracycline at levels of 100, 250
and 500 ppb. Three replicates of samples at each level were analyzed.
6.7.1. Confirmation of Penicillin G in Milk
The retention time of the Penicillin G under UV detection was 5.75 min. Fig.
6.14, Fig. 6.15, Fig. 6.16, and Fig. 6.17 illustrate the chromatograms of milk sample
blank, milk samples fortified with Penicillin G (2, 4, 8 ppb) at 325 nm, respectively.
The chromatogram of blank milk sample showed no peak interfering with Penicillin G.

90
Figure 6.14. Chromatograms of milk sample blank for Penicillin G
Figure 6.15. Chromatograms of milk sample fortified with Penicillin G at 2 ppb

91
Figure 6.16. Chromatograms of milk sample fortified with Penicillin G at 4 ppb
Figure 6.17. Chromatograms of milk sample fortified with Penicillin G at 8 ppb

92
The linearity of the calibration curve for Penicillin G was good (R2= 0.997166
) for a range of concentrations 40, 80, 160, 320 ppb of Penicillin G in the milk samples
(Appendix C). The linear regression equation was y=ax+b; (a) 2461.89, (b) 0.000000.
Milk samples were spiked with Penicillin G at 2, 4, 8 ppb. Three replicates of
milk samples at each level were analyzed. Recoveries are shown in Table 6.16. The
recoveries were obtained by spiking milk samples at three different concentrations (2, 4,
8 ppb). Recoveries ranged from 44.667 to 66.000%.
Table 6.16. Recoveries of penicillin G from fortified milk samples
Spiked (ppb) Recovery %
2 44.667 ± 12.662
4 59.333 ± 1.528
8 66.000 ± 3.606
6.7.2. Confirmation of Ampicillin in Milk
Several experiments were made to develop an HPLC method for determination
of ampicillin in ppb level concentrations in milk samples. HPLC with fluorescence
detection was prefered. The method of Gamba and Dusi (2003) was followed for the
determination of ampicillin residues in milk samples. A HPLC chromatogram of
ampicillin residues at 0, 2, 4, 8 ppb concentrations in UHT cow’s milk is demonstrated
in Figure 6.18, 6.19, 6.20 and 6.21. The retention time for milk containing ampicillin at
0, 2, 4, 8 ppb levels were 7.75 min. Blank milk had no interfering peaks.

93
Figure 6.18. Chromatograms of milk sample blank for Ampicillin
Figure 6.19. Chromatograms of milk sample fortified with Ampicillin at 2 ppb

94
Figure 6.20. Chromatograms of milk sample fortified with Ampicillin at 4 ppb
Figure 6.21. Chromatograms of milk sample fortified with Ampicillin at 8 ppb

95
Quantification was performed by comparison of the analyte peak areas versus an
externally generated calibration curve. Calibration curve was produced at detection the
excitation wavelenght of 346 nm and the emission wavelenght of 425 nm for the
ampicillin in the concentration range of 2-16 ppb (Appendix C). The calibration curve
was linear over the the concentration range tested with goodness of fit (R2) 0.998702.
Its linear fit was y=ax+b; (a) 1.06572e-005, (b) 0.
The recoveries of ampicillin from milk samples spiked at concentrations of 2, 4,
8 ppb were determined. The mean percentage recoveries with standard deviation were
presented in Table 6.17.
Table 6.17. Recoveries of ampicillin from fortified milk samples
Spiked (ppb) Recovery %
2 87.520 ± 8.660
4 73.740 ± 4.330
8 62.503 ± 10.984
6.7.3. Confirmation of Tetracycline in Milk
Typical chromatogram of tetracycline standard at 250, 500, 750, 1000 ppb
monitored at 360 nm were shown in Figure C.6, C.7, C.8 and C.9 (Appendix C). The
method of Cinquina, et al. (2003) was followed for the determination of tetracycline
residues in milk samples. The chromatograms of blank milk sample and of milk
samples spiked with 100, 250 and 500 ppb of tetracycline were reported in Figure 6.22,
6.23, 6.24 and 6.25. No interference was observed in the blank milk sample
chromatograms (Figure 6.22). The retention time of milk samples containing
tetracycline was 4.51 min.
The linearity of the calibration curve for tetracycline was good (R2=0.995229)
for 250, 500, 750, 1000 ppb of tetracycline in the milk samples. The linear regression
equation was y=ax+b. The coefficients (a and b) were 0.000609639 and 0.00000,
respectively.

96
Figure 6.22. Chromatograms of milk sample blank for Tetracycline
Figure 6.23. Chromatograms of milk samples fortified with Tetracycline at 100 ppb

97
Figure 6.24. Chromatograms of milk samples fortified with Tetracycline at 250 ppb
Figure 6.25. Chromatograms of milk samples fortified with Tetracycline at 500 ppb

98
Milk samples were fortified with tetracycline at 100, 250 and 500 ppb levels.
Three replicates of milk samples at each level were analyzed. Recoveries are shown in
Table 6.18. The recoveries were obtained by spiking milk samples at three different
concentrations (100, 250, 500 ppb).
Table 6.18. Recoveries of tetracycline from fortified milk samples
Spiked (ppb) Recovery %
100 93.10 ± 18.04
250 94.35 ± 4.29
500 92.86 ± 5.87

99
CHAPTER 7
CONCLUSION There are several screening and confirmatory methods for detecting antibiotic
residues in milk and milk products. The major interest in future trend is development of
more sensitive, more rapid, simple, specific and easily automatable test.
In this study, firstly different test kits such as Copan Milk Test, Penzyme and
ROSA Test were evaluated according to usage, cost and storage time. Comparison of
the tests, Copan Milk Test was easy to use, easy to interperate visually and had a long
shelf life. The ROSA test is a good immuno-receptor test because it is fast to run,
simple to use but needs to have a ROSA Reader device and different strips for different
antibiotics. Penzyme Milk Test had very short shelf life and the test is based on having a
rather narrow antibiotic spectrum including only beta-lactams as compared to two other
tests.
These screening milk tests were confirmed by HPLC for Penicillin G,
Ampicillin and Tetracycline residues in UHT cow’s milk samples, by using analytical
confirmatory method such as a HPLC method. Average recoveries for Ampicillin and
Tetracycline ranged, respectively, from 44.67% to 66.00%, from 62.50% to 87.52% and
from 92.86% to 94.35%.
Secondly, the effect of antibiotic concentration (Penicillin G, Ampicillin,
Tetracycline) on some physical properties (acidity, pH and density) of UHT whole
cow’s milk (at least 3.1% fat) were examined as well as EC of milk was measured using
conductivity meter. The acidity, pH and density of milk were found to be independent
of antibiotic concentration level.
Experimental data of EC were evaluated by applying the statistical methods
(ANOVA with Fisher’s test and PNN method). Based on the results, EC of milk seems
to be proper detector for antibiotic residues. This evaluation indicates that EC
measurement can be a great promising technique as a rapid, inexpensive, easy-use tool
for detection of antibiotic residues in milk. Further development can include developing
a computer program that will increase the speed, sensitivity, accuracy of measurement
and calculation. On-line EC data may be combined with other significant on-line data,

100
such as milk composition. These data can be used to detect the any milk samples
containing antibiotic in the EC database of dairy farms. In addition, it can be a step in
order to develop a sensor for antibiotic residue detection of milk.
The thermal behavior of antibiotic free milk samples and milk samples fortified
with antibiotics can be characterized by transition temperatures in DSC curves. An
increase in antibiotic concentration resulted in an increase in values of thermal
properties, i.e., melting temperature, heat of fusion, evaporation temperature and heat of
evaporation of milk samples. It can be concluded that DSC is a good characterization
tool for better understanding of thermal events in antibiotic free milk samples and milk
samples spiked with antibiotic residues and it can be evaluated as a detection method.
Milk is a very complex because of having different components, such as lipids,
proteins, vitamins, minerals and also somatic cells and bacteria. This composition of
milk may have a significant effect on the detection of antibiotic residues in milk.
Furthermore, it could be demonstrated by Lactostar measurements that the presence of
antibiotic residues in milk influenced freezing point (Fpp, °C) and EMC%.
Thus, this study can be subject to further research to evaluate its broad
application in other antibiotic residues to detect in milk matrix. However, the further
research needs to be confirmed with naturally contaminated milk samples from treated
cows with other significant antibiotic residues. Moreover, there is not any efficient
antibiotic residue database and antibiotic residue prevention program in Turkey. It is
considered that such programs may have benefits for reducing the risk of antibiotic
residue violations. Therefore, this work may lead further studies in this area.

101
REFERENCES
Adesiyun, A.A. and Webb, L.A. 1997. Prevalence of antimicrobial residues in preprocessed and processed cows’ milk in Trinidad. Journal of Food Safety 16:301-310.
Albright, J.L., Tuckey, S.L. and Woods, G.T. 1961. Antibiotics in milk. Journal of
Dairy Science 44:779-807. Al-Jabri, A. 2005. Honey, milk and antibiotics. African Journal of Biotechnology
4(13):1580-1587. Andrew, S.M. 2000. Effect of fat and protein content of milk from individual cows on
the specificity rates of antibiotic residue screening tests. J. Dairy Sci. 83:2992-2997.
Andrew, S.M., Frobish, R.A., Paape, M.J. and Maturin, L.J. 1997. Evaluation of
selected antibiotic residue screening tests for milk from individual cows and examination of factors that affect the probability of false-positive outcomes. J. Dairy Sci. 80:3050-3057.
Ang, C.Y.W., Luo, W., Call, V.L. and Righter, H.F. 1997. Comparison of liquid
chromatography with microbial inhibition assay for determination of incurred Amoxicillin and Ampicillin residues in milk. Journal Agric. Food Chem.. 45:4351-4356.
Ashnagar, A. and Naseri, N.G. 2007. Analysis of three penicillin antibiotics (ampicillin,
amoxicillin and cloxacillin) of several Iranian pharmaceutical companies by HPLC. E-Journal of Chemistry 4(4):536-545.
Badertscher, R., Berger, T. and Kuhn, R. 2007. Densitometric determination of the fat
content of milk and milk products. International Dairy Journal 17:20-23. Biggadike, H., Ohnstad, I. And Hillerton, E. 2000. A practical evaluation of milk
conductivity measurements. Proc. British Mastitis Conf. 56-61. Bob Ardrey. 2003. Liquid chromatography-mass spectrometry: An introduction. John
Wiley & Sons. Inc. England. Byron H. Webb. 1974. The composition of milk. In: Fundamentals of Dairy Chemistry.
The Avi Publishing Company, Inc. Westport:Connecticut. Callan, R.J. 2000. Antibiotic use. Food Safety and Quality Assurance DWM PhD
ACVIM ILM, Colorado State University. Carcia-Golding, F., Giallorenzo, M., Moreno, N. and Chang, V. 1995. Sensor for
determining the water content of oil-in-water emulsion by specific adminttance measurement. Sensors and Actuators A 46-47:337-341.

102
Charm Sciences Literature. 2008. ROSA Test. htpp://www.charm.com (accessed October 3, 2007).
Charoenraks, T., Chuanuwatanakul, S., Honda, Yamaguchi, Y. and Chailapakul, O.
2005. Analysis of tetracycline antibiotics using HPLC with pulsed amperometric detection. The Japan Society for Analytical Chemistry 21:241-245.
Cheng Chen, H. and Chain Chang, T. 1994. Detection of Penicillin G in milk using a
conductimetric method. J. Dairy Sci. 77:1515-1520. Cinquina, A.L., Longo, F., Anastasi, G., Giannetti, L. and Cozzani, R. 2003. Validation
of a high-performance liquid chromatography method for the determination of oxytetracycline, tetracycline, chlortetracycline and doxycycline in bovine milk and muscle. Journal of Chromatography A 987:227-233.
Coffman, J. R., Beran, G.W., Colten, H. R., Greig, C., Halloran, J., Hayes, D., Kaneene,
J. B., McNutt, K., Meeker, D., Nickerson, S.C., Seay, T. and Stewart, R.G. 1999. The Use of Drugs in Food Animals: Benefits and Risks. The National Academics Press. http://www.search.nap.edu (accessed November 14, 2006).
Collins, Stephen. 2008. Differential scanning calorimetry. http://www.dur.ac.uk
(accesses May 30, 2008) Copan. 2008. CMT Copan Milk Test. http://www.copanusa.com (accessed April 25,
2008). Cordella, C., Faucon, J.P., Cabrol-Bass, D. and Sbirrazzuoli, N. 2003. Application of
DSC as a tool for honey floral species characterization and adulteration detection. Journal of Thermal Analysis and Calorimetry 71:279-290.
Cover, T.M. and Hart, P.E. 1967. Nearest neighbor pattern classification. IEEE
Transactions on Information Theory IT-13, 1:21-27. Curda, L. and Plockova, M. 1995. Impedance measurement of growth of lactic acid
bacteria in dairy cultures with honey addition. International Dairy Journal 5:727-733.
De Meuter, P., Rahier, H. and Van Mele, B. 1999. The use of modulated temperature
differential scanning calorimetry for the characterization of food systems. International Journal of Pharmaceutics 192:77-84.
Douglas C. Montgomery. 2001. Experiments with a Single Factor: The Analysis of
Variance. In: Design and Analysis of Experiments. John Wiley & Sons, Inc. Eckles, C. H., Willes Barnes Combs and Harold Macy. 1951. The Constituents of Milk;
Properties of Milk; Miscellaneous Tests. Milk and Milk Products. McGraw-Hill Book Company, Inc.

103
Erkuş, O., Celik, E.S., Yavuzdurmaz, H., Okuklu, B. and Harsa, S. 2006. Isolation and molecular characterization of artisanal yoghurt starter bacteria. The 20th International ICFMH Symposium on Food Safety and Food Biotechnology. Diversity and Global Impact Bologna, Italy. Preprints.
Fox, P.F. and McSweeney, P.L.H. 1998. Dairy Chemistry and Biochemistry. London:
Blackie. Fritz, J.W. and Zuo, Y. 2007. Simultaneous determination of tetracycline,
oxytetracycline, and 4-epitetracycline in milk by high-performance liquid chromatography. Food Chemistry 105:1297-1301.
Funke Gerber. 2008. How works Lactostar. http://www.bentleyczech.cz/docs/funke
(accessed May 2, 2008). Gamba, V. and Dusi, G. 2003. Liquid chromatography with fluorescence detection of
amoxicillin and ampicillin in feeds using pre-column derivazition. Analytica Chimica Acta 483:69-72.
Goff, H.D. and Hill A.R. 1993a. Chemistry and Physics; Analyses. In: Dairy Science
and Technology Handbook, Principles and Properties, edited by Hui, Y.H. Application Science, Technology and Engineering. New York: VCH Publishers.
Grunwald, L. and Petz, M. 2003. Food processing effects on residues: penicillins in
milk and yoghurt. Analytica Chimica Acta 483:73-79 Gustafson, R.H. 1991. Use of antibiotics in livestock and human health concerns.
Symposium: Antibiotic Residues in Meat and Milk. J. Dairy Sci. 74:1428-1432. Gustafson, R.H. and Bowen, R.E. 1997. Antibiotics use in animal agriculture. Journal
of Applied Microbiology 83:531-541. Hall, H.C., St. John, V.S., Watson, R.S. and Padmore, L.J., Paris, S.M. 2003. Antibiotic
residue surveillance at the veterinary services laboratory. The Pine, St Micheal, Barbados. Ministry of Agriculture & Rural Development, Veterinary Services Laboratory. http://www.agriculture.gov.bb (accessed June 10, 2007).
Hamann, J. and Zecconi, A. 1998. Evaluation of the electrical conductivity of milk as a
mastitis indicator. Int. Dairy Fed. Bull. 334:5-22. Henningsson, M., Östergren, K. and Dejmek, P. 2005. The electrical conductivity of
milk- the effect of dilution and temperature. International Journal of Food Properties 8:15-22.
Hillerton, J.E., Halley, B.I., Neaves, P. and Rose, M.D. 1999. Detection of antimicrobial
substances in individual cow and quarter milk samples using Delvotest microbial inhibitor tests. J. Dairy Sci. 82:704-711.

104
Ionel Rosenthal. 1991. Chemistry of Milk Components; Production of Milk; Miscellaneous. Milk and Dairy Products Properties and Processing. Weinheim: VCH Publishers.
Jones, G.M. 1999. Preventing drug residues in milk and cull dairy cows. Milk Quality &
Milking Management, Virginia Tech. Kang, J. H., Jin, J. H. and Kondo, F. 2005. False –positive outcome and drug residue in
milk samples over withdrawal times. J. Dairy Sci. 88:908-913. Kang’ethe, E.K., Aboge, G.O., Arimi, S.M., Kannja, L.W., Omore, A.O. and
McDermott, J.J. 2005. Investigation of the risk of consuming marketed milk with antimicrobial residues in Kenya. Food Control 16:349-355.
Kennedy, D.G., McCracken, R.J., Cannavan, A. and Hewitt, S.A. 1998. Use of liquid
chromatography-mass spectrometry in the analysis of residues of antibiotics in meat and milk. Journal of Chromatography 812:77-98.
Lamar, J. and Petz, M. 2007. Development of a receptor-based microplate assay for the
detection of beta-lactam antibiotics in different food matrices. Analytica Chimica Acta 586:296-303.
Lawton, B. A. and Pethig, R. 1993. Determining the fat content of milk and cream using
AC conductivity measurements. Measurement Science & Technology 4:38-41. Le Breton, M.H., Savoy-Perroud M.C. and Diserens, J.M. 2007. Validation and
comparison of the Copan Milk Test and Delvotest SP-NT for the detection of antimicrobials in milk. Analytica Chimica Acta 586:280-283.
Leo M.L. Nollet. 2001. Residues of growth promoters. In: Food Analysis by HPLC
edited by L.M.L. Nollet. New York: Marcel Dekker. Mabrook, M.F., Darbyshire, A.M. and Petty, M.C. 2006. Quality control of dairy
products using single frequency adminttance measurements. Meas. Sci. Technol. 17:275-280.
Mabrook, M.F. and Petty M.C. 2003. Effect of composition on the electrical
conductance of milk. Journal of Food Engineering 60:321-325. Mathur, S. and Singh, R. 2005. Antibiotic resistance in food lactic acid bacteria.
International Journal of Food Microbiology 105:281-295. McEwen, S.A., Black, W.D. and Meek, A.H. 1991. Antibiotic residue prevention
methods, farm management, and occurrence of antibiotic residues in milk. J. Dairy Sci. 74:2128-2137.
Michnik, A., Michalik, K. and Marcoin, W. 2004. Influence of magnesium glutamate on
stability of penicillin G aqueous solution. International Journal of Pharmaceutics 273:149-158.

105
Milner, P., Page, K.L. and Hillerton, J.E. 1997. The effects of early antibiotics treatment following diagnosis of mastitis detected by a change in the electrical conductivity of milk. J. Dairy Sci. 80:859-863.
Mitchell, F. R. G. and De Alwis, A. A. P. 1989. Electrical conductivity meter for food
samples. J. Phys. E: Sci. Instrum 22:554-556. Molina, M.P., Althaus, R.L., Molina, A. and Fernandez, N. 2003. Antimicrobial agent
detection in ewes’ milk by the microbial inhibitor test brilliant black reduction test-BRT AİM®. International Dairy Journal 13:821-826.
Mustafa Metin. 2001. Sütün Bileşimi ve İşlenmesi. In: Süt Teknolojisi. E.Ü.
Mühendislik Fakültesi Yayınları No:33, Bornova :İzmir. Mucchetti, G., Gatti, M. and Neviani, E. 1994. Electrical conductivity changes in milk
caused by acidification: determining factor. J. Dairy Sci. 77:940-944. National Dairy Council. 2000. General physical properties of milk. Newer Knowledge
of Dairy Foods/Appendix. http://www.nationaldairycouncil.org (accessed May 15, 2006).
Neaves, P. 1999. Monitoring antibiotics in milk- The changing world of test methods.
The Food Microbiologists, Moleview 28, Randalls Road, Leatherland, Surrey, KT22 7TQ http:www.iah.bbsrc.ac.uk/ (accessed March 6, 2006).
Neville, Margaret C., Robert G. Jensen and David S. Newburg 1995. The Physical
Properties of Human and Bovine Milks; Bovine Milk Lipids; Contaminants in Bovine Milk. In: Handbook of Milk Composition, edited by Jensen, Robert G. Academic Press, Inc.
Nielen, M., Deluyker, H., Schukken, Y.H. and Brand, A. 1992. Electrical conductivity
of milk: measurements, modifiers, and meta analysis of mastitis detection performance. J. Dairy Sci. 75:606-614.
Norberg, E. 2005. Electrical conductivity of milk as a phenotypic and genetic indicator
of bovine mastitis. Livestock Production Science 96:129-139. Norberg, E., Hogeveen, H., Korsgoard, I. R., Friggens, N. C., Sloth, K. H. M. N. and
Lovendahl, P. 2004. Electrical conductivity of milk: ability to predict mastitis status. J. Dairy Sci. 87:1099-1107.
O’Keeffe, M. and Kennedy, O. 1998. Residues- a food safety problem?. Journal of
Food Safety 18:297-319. Okerman, L., De Wasch, K. and Van Hoof, J. 2003. Simultaneous determination of
different antibiotic residues in bovine and in porcine kidneys by solid-phase fluorescence immunoassay. Journal of AOAC International 86(2):236-240.
Otter, D. 2003. Physical and chemical properties. Elsevier Sci. 3957-3963.

106
Paquet, J., Lacroix, C., Audet, P. and Thibault, J. 2000. Electrical conductivity as a tool fpr analysing fermentation processes for production of cheese starters. International Dairy Journal 10:391-399.
Prentice, J. H. 1962. The conductivity of milk- the effect of the volume and degree of
dispersion of the fat. Journal of Dairy Research 29:131-139. Reid, L.M., O’Donnell, C. P. and Downey G. 2006. Recent technological advances for
the determination of food authenticity. Food Science and Technology 17:344-353.
Rinken, T. and Riik, H. 2006. Determination of antibiotic residue and their interaction
in milk with lactate biosensor. Journal of Biochemical and Biophysical Methods 66:13-21.
Ruegg, P.L. 2005. Relationship between bulk tank milk somatic cell count and
antibiotic residues. NMC Annual Meeting Proceedings 28-35. Ruegg, P.L. and Tabone, T. J. 2000. The relationship between antibiotic residue
violations and somatic cell counts in Wisconsin dairy herds. J. Dairy Sci. 83:2805-2809
Rutz, W.D., Whitnah, C.H. and Baetz, G.D. 1955. Some physical properties of milk. I.
Density. J. Dairy Sci. 38:1312-1318. Santos, M.S., Henriques, M., Duarte, C.A. and Esteves, I.V. 2007. Development and
aplication of a capillary electrophoresis based method for the simultaneous screening of six antibiotics in spiked milk samples. Journal of Chromatography A 1140:63-70.
Schenk, F.J. 1998. Chromatographic methods of analysis of antibiotics in milk. Journal
of Chromatography A 812:99-109. Setford, S.J., Van Es, R.M., Blankwater, Y.J. and Kröger, S. 1999. Receptor binding
protein amperometric affinity sensor for rapid β-lactam quantification in milk. Analytica Chimica Acta 398:13-22.
Seval S. Kırdar. 2001. Fiziksel ve Kimyasal Analizler. In: Süt ve Ürünlerinde Analiz
Metodları Uygulama Kılavuzu. Süleyman Demirel Üniversitesi Yayın No:18, 1. Baskı, SDÜ Basımevi, Isparta.
Seymour, E.H., Jones, G.M. and McGilliard, M.L. 1988. Comparisons of on-farm
screening tests for detection of antibiotic residues. J. Dairy Sci. 71:539-544. Sischo, W.M. 1996. Quality milk and tests for antibiotic residues. J. Dairy Sci. 79:1065-
1073. Sivakesava, S. and Irudayaraj, J. 2002. Rapid determination of determination of
Tetracycline in milk by FT-MIR and FT-NIR spectroscopy. J. Dairy Sci. 85:487-493.

107
Tansakul, A. and Chaisawang, P. 2006. Thermophysical properties of coconut milk. Journal of Food Engineering 73:276-280.
T. C. Tarım ve Köyişleri Bakanlığı. Koruma ve Kontrol Genel Müdürlüğü. 2007.
Turkish Food Codex. Hayvansal kökenli gıdalarda veteriner ilaçları maksimum kalıntı limitleri tebliği 2005-28 http://www.kkgm.gov.tr (accessed January 7, 2007).
Teagasc, M. 2004. Monitoring of veterinary drug residues in food. The Society of Food
Hygiene Technology 1-5. Telis-Romero, J., Telis, V.R.N., Gabas, A.L. and Yamashita, F. 1998. Thermophysical
properties of Brazilian orange juice as affected by temperature and water content. Journal of Food Engineering 38:27-40.
Therdthai, N. and Zhou, W. 2002. Hybrid neural modeling of the electrical conductivity
property of recombined milk. International Journal of Food Properties 5(1):49-61.
Therdthai, N. and Zhou, W. 2001. Artificial neural network modeling of the electrical
conductivity property of recombined milk. Journal of Food Engineering 50:107-111.
Timothy Masters. 1993. Practical neural network recipes in C++. Academic Press
Inc.:USA Toldra, F. and Reig, M. 2006. Methods for rapid detection of chemical and veterinary
drug residues in animal foods. Trends In Food Science & Technology 17:482-489.
University of Guelph. 2005. Dairy Chemistry and Physics. Dairy Science and
Technology. http://www.food.sci.uoguelph.ca/dairyedu/chem.html (accessed November 16, 2005).
Verdon, E. and Couedor, P. 1999. Multiresidue analytical method for the determination
of eight Penicillin antibiotics in muscle tissue by ion-pair reversed-phase HPLC after precolumn derivatization. Journal of AOAC International 82, 5:1083-1095.
Wong, Noble P. 1988. Physical Properties of Milk. In: Fundamentals of Dairy
Chemistry. Van Nostrand Reinhold Co., New York: NY. Yamaki, M., Berruga, M.I., Althaus, R.L., Molina, M.P. and Molina, A. 2004.
Occurrence of antibiotic residues in milk from Manchega Ewe dairy farms. J. Dairy Sci. 87:3132-3137.
Yamani, M.I., Al-Kurdi, L.M.A., Haddadin, M.S.Y. and Robinson, R.K. 1999. A simple
test for the detection of antibiotics and other chemical residues in ex-farm milk. Food Control 10:35-39.

108
Zhuang, Y., Zhou, W., Nguyen, M.H. and Hourigan, J. A. 1997. Determination of protein content of whey powder using electrical conductivity measurement. Int. Dairy Journal 7:647-653.
Zvirdauskiene, R. and Salomskiene, J. 2007. An evaluation of different microbial and
rapid tests for determining inhibitors in milk. Food Control 18:541-547.

109
APPENDICES
APPENDIX A
DSC RESULTS OF PENICILLIN G RESIDUES
Figure A.1. DSC results of antibiotic free milk sample
Figure A.2. DSC results of milk sample containing 2 ppb Penicillin G

110
Figure A.3. DSC results of milk sample containing 4 ppb Penicillin G
Figure A.4. DSC results of milk sample containing 8 ppb Penicillin G

111
DSC RESULTS OF AMPICILLIN RESIDUES
Figure A.5. DSC results of milk sample containing 2 ppb Ampicillin
Figure A.6. DSC results of milk sample containing 4 ppb Ampicillin

112
Figure A.7. DSC results of milk sample containing 8 ppb Ampicillin
DSC RESULTS OF TETRACYCLINE RESIDUES
Figure A.8. DSC results of milk sample containing 100 ppb Tetracycline

113
Figure A.9. DSC results of milk sample containing 250 ppb Tetracycline
Figure A.10. DSC results of milk sample containing 500 ppb Tetracycline

114
APPENDIX B
Table B.1. Insignificant Lactostar results
Antibiotic
Concentration (ppb) Fat %
Protein %
Lactose %
Penicillin G
0 ppb 3.2193
± 0.1207 3.2447
± 0.0155 4.7147
± 0.0229
2 ppb 3.2227
± 0.1166 3.2327
± 0.0291 4.6967
± 0.0412
4 ppb 3.1513
± 0.1770 3.2320
± 0.0300 4.6993
± 0.0388
8 ppb 3.1673
± 0.1230 3.2193
± 0.0383 4.6827
± 0.0512 Ampicillin
0 ppb 3.2193
± 0.1207 3.2447
± 0.0155 4.7147
± 0.0229
2 ppb 3.1393
± 0.1825 3.2220
± 0.0384 4.6860
± 0.0507
4 ppb 3.1667
± 0.1387 3.2153
± 0.0494 4.6767
± 0.0666
8 ppb 3.1387
± 0.1927 3.2187
± 0.0449 4.6800
± 0.0602 Tetracycline
0 ppb 3.2193
± 0.1207 3.2447
± 0.0155 4.1747
± 0.0229
100 ppb 3.1680
± 0.1323 3.2160
± 0.0484 4.6773
± 0.0656
250 ppb 3.1247
± 0.2004 3.2220
± 0.0446 4.6873
± 0.0570
500 ppb 3.1767
± 0.1356 3.2180
± 0.0490 4.6807
± 0.0653 Used milk at experiment (at least 3.1% fat, 100ml) 3.1 g 3.1 g 4.7 g
Literature (Fox and McSweeney 1998)
3.4 - 5.1 % [w/v]
3.3 - 3.9 % [w/v]
4.9 - 5.1 % [w/v]

115
APPENDIX C
CALIBRATION CURVES FOR PENICILLIN G
AMPICILLIN AND TETRACYCLINE
Figure C.1. Calibration plot for Ampicillin for concentration range of 2 ppb-16 ppb
Figure C.2. Plot for 40 ppb Penicillin G standard

116
Figure C.3. Plot for 80 ppb Penicillin G standard
Figure C.4 Plot for 160 ppb Penicillin G standard

117
Figure C.5. Plot for 320 ppb Penicillin G standard
Figure C.6. Calibration plot for Ampicillin for concentration range of 2 ppb-16 ppb

118
Figure C.7. Plot for 2 ppb Ampicillin standard
Figure C.8. Plot for 4 ppb Ampicillin standard

119
Figure C.9. Plot for 8 ppb Ampicillin standard
Figure C.10. Plot for 16 ppb Ampicillin standard

120
Figure C.11. Calibration plot for Tetracycline for concentration range of 250 ppb-1000
ppb
Figure C.12. Plot for 250 ppb Tetracycline standard

121
Figure C.13. Plot for 500 ppb Tetracycline standard
Figure C.14. Plot for 750 ppb Tetracycline standard

122
Figure C.15. Plot for 1000 ppb Tetracycline standard