Investigation of the Mechanism of Binding of ...
68
Union College Union | Digital Works Honors eses Student Work 6-2014 Investigation of the Mechanism of Binding of Perfluoroalkyl Acids with Human Serum Albumin Using an Improved Approach to Equilibrium Dialysis Michael Morris Union College - Schenectady, NY Follow this and additional works at: hps://digitalworks.union.edu/theses Part of the Biochemistry Commons is Open Access is brought to you for free and open access by the Student Work at Union | Digital Works. It has been accepted for inclusion in Honors eses by an authorized administrator of Union | Digital Works. For more information, please contact [email protected]. Recommended Citation Morris, Michael, "Investigation of the Mechanism of Binding of Perfluoroalkyl Acids with Human Serum Albumin Using an Improved Approach to Equilibrium Dialysis" (2014). Honors eses. 562. hps://digitalworks.union.edu/theses/562
Transcript of Investigation of the Mechanism of Binding of ...

Union CollegeUnion | Digital Works
Honors Theses Student Work
6-2014
Investigation of the Mechanism of Binding ofPerfluoroalkyl Acids with Human Serum AlbuminUsing an Improved Approach to EquilibriumDialysisMichael MorrisUnion College - Schenectady, NY
Follow this and additional works at: https://digitalworks.union.edu/theses
Part of the Biochemistry Commons
This Open Access is brought to you for free and open access by the Student Work at Union | Digital Works. It has been accepted for inclusion in HonorsTheses by an authorized administrator of Union | Digital Works. For more information, please contact [email protected].
Recommended CitationMorris, Michael, "Investigation of the Mechanism of Binding of Perfluoroalkyl Acids with Human Serum Albumin Using an ImprovedApproach to Equilibrium Dialysis" (2014). Honors Theses. 562.https://digitalworks.union.edu/theses/562

Investigation of the Mechanism of Binding of Perfluoroalkyl Acids with Human Serum Albumin Using an Improved Approach to Equilibrium Dialysis
By
Michael Anthony Morris
****************
Submitted in partial fulfillment of the requirements for
Honors in the Department of Chemistry
UNION COLLEGE
June, 2014
i
ABSTRACT
MORRIS, MICHAEL A Investigation of the mechanism of binding of perfluoroalkyl acids with human serum albumin using an improved approach to equilibrium dialysis. Department of Chemistry, June 2014.
ADVISOR: Laura A. MacManus-Spencer
Perfluoroalkyl acids (PFAAs) are used to produce many consumer products, but their
bioaccumulative and toxic properties and their global persistence in the environment are
major concerns. In particular, PFAAs have been shown to accumulate in the blood, liver,
and kidneys of organisms. As such, it is important to elucidate the toxicokinetics of
PFAAs by quantitatively and qualitatively characterizing the binding mechanism of
PFAAs to human serum albumin (HSA). In this study, the binding of PFAAs to HSA are
studied via a high-throughput equilibrium dialysis method that utilizes the 96-well
Equilibrium Dialyzer coupled with sample quantitation using liquid chromatography
tandem-mass spectrometry (LC-MS/MS). This equilibrium dialysis method provides an
efficient and direct way to measure protein-ligand binding constants. Using the described
methods, it was determined that HSA has approximately two binding sites associated
with a high affinity (105 M–1) as well as approximately fifteen binding sites associated
with a lower affinity (103 M-1) for perfluorooctanoic acid (PFOA). These binding
constants indicate that PFOA binds to HSA with the same affinity as some endogenous
ligands, which illuminates the toxicity concerns of these chemicals. Future applications
of this method could include measuring the binding constants of other PFAAs to HSA,
characterizing the binding mechanism of PFAAs to HSA by examining the effect of
various pH and ionic strength values with respect to binding strength, and measuring
binding constants of PFAAs to myoglobin and hemoglobin.

ii
Acknowledgements
This project would not be possible without the help and support from several
people. I am indebted to Professor Laura MacManus-Spencer for providing the
opportunity to do research in her lab; for her continuous help, dedication, and patience
throughout the progress of this project; and for being a wonderful educator, mentor, and
chemist at Union College. Words cannot express how grateful I am for all of the help
Professor MacManus-Spencer has given me during my time at Union College. I would
like to thank previous LAMS lab thesis students, Paul Hebert and Megan O’Connor, for
their prior work and research on this project. I also would like to thank my fellow lab
mate, Taera Kim, for being a great friend and for her incessant support throughout senior
year while we were doing research in the LAMS lab, applying to graduate school, and
surviving quantum chemistry.
Lastly, I would like to thank the following resources for financially supporting
this project:
• Professor MacManus-Spencer
• The Lee Davenport '37 Summer Research Fellowship
• The Union College Student Research Grant Program
• The Union College Presidential Green Grant Program

iii
Table of Contents
1. Introduction………………………………………………………………………. 1
i. Relevance of perfluoroalkyl acids 1
ii. Chemistry of PFAAs 2
iii. Bioaccumulation patterns and toxicokinetics of PFAAs 5
iv. Human serum albumin (HSA) 6
v. Prior studies of PFAA-serum albumin binding 8
vi. Protein-ligand binding kinetics and quantitation 9
vii. Equilibrium dialysis 11
viii. Liquid chromatography-tandem mass spectrometry (LC-MS/MS) 15
ix. Experimental goals 18
2. Materials and Methods………………………………………………………….. 20
A. Materials 20
B. Methods 21
i. Sample preparation 21
ii. Equilibrium dialysis 21
iii. LC-MS/MS quantitative analysis of PFAAs 22
iv. Equilibration time determination 26
v. HSA-PFOA binding experiments to measure protein-ligand
affinity 27
vi. Curve-fitting the binding isotherm via binding class models 27
3. Results and Discussion…………………………………………………………. 28
iv
i. Development of a quantitative LC-MS/MS method for the analysis of
PFAAs 28
ii. Equilibration time determination 34
iii. HSA-PFOA binding experiments to measure protein-ligand affinity 36
4. Conclusions……………………………………………………………………... 44
5. Future Work…………………………………………………………………….. 45
6. References………………………………………………………………………. 46
7. Appendix………………………………………………………………………... 53

v
List of Figures
Figure Number
Figure Description Page Number
1 General structures of perfluoroalkyl acids. 3 2 Structural comparisons of hexanoic acid, a short-chain fatty
acid, and perfluorohexanoic acid (PFHxA). 4
3 The three-dimensional crystal structure of HSA solved at 2.5 Å by Sugio et al.
7
4 A diagram of equilibrium dialysis. 13 5 A binding isotherm plot. 14 6 A schematic of multiple reaction monitoring (MRM) in LC-
MS/MS. 18
7 The TIC MRM chromatogram of 6 µM PFOA obtained using method 1.
29
8 The nested calibration curve obtained using method 1. 30 9 The TIC MRM chromatogram of 6 µM PFOA obtained
using method 2. 31
10 The nested calibration curve obtained using method 2. 32 11 The TIC MRM chromatogram of 6 µM PFOA obtained
using method 3. 33
12 The nested calibration curve obtained using method 3. 34 13 The equilibration time plot for PFOA and HSA. 35 14 The binding isotherm plot of PFOA and HSA fitted using
the one-binding class model. 37
15 The binding isotherm plot of PFOA and HSA fitted using the two-binding class model.
39

vi
List of Tables
Table Number
Table Description Page Number
1 Serum albumin-PFOA binding constants (Ka values) from various published studies.
9
2 The HPLC gradient used to separate a mixture of PFAAs studied using method 1.
23
3 The isocratic mobile phases used to separate analytes for methods 2 and 3.
24
4 The MRM parameters for PFOA in this study. 25 5 The percent bound to HSA, at various timepoints, for PFBA,
PFOA, and PFDoA, determined by equilibrium dialysis and LC-MS/MS.
36
6 The Ka, n, and R2 values for the HSA-PFOA binding isotherm plots that were fitted using the one- and two-binding class models.
40

1
1. Introduction
i. Relevance of perfluoroalkyl acids
Perfluoroalkyl acids (PFAAs) are perfluorinated chemicals that are used to
produce various industrial and consumer products, such as non-stick cookware; liquid
repellants for paper, packaging, textile, leather, and carpet goods; and industrial
surfactants, additives and coatings.1 The unique physical and chemical properties of
PFAAs, such as their stability and resistance to water and oil, make them attractive for
industrial and commercial use.1,2 However, due to the stability of PFAAs, they are
effectively non-degradable by most physical and metabolic processes, which allows these
chemicals to persist and accumulate in the environment and in organisms.1-3 Although
PFAAs are valuable for industrial and commercial applications, they pose serious
environmental and biological threats. In fact, in recent decades, these chemicals have
been confirmed as persistent, bioaccumulative, and toxic contaminants, and their global
distribution in the environment is worrisome.1-3
Due to increased environmental and toxicological concerns about PFAAs in
recent years, U.S. industries that use PFAAs for industrial purposes, such as Dupont and
the 3M Company, have phased out the use of long-chain PFAAs (seven or more
fluorinated carbons) and have replaced them with shorter-chain PFAAs (up to six or
fewer fluorinated carbons).4 Despite this effort, long-chain PFAAs that have been
introduced to the environment will endure globally for decades. In addition, the continued
use of PFAAs industrially, despite having shorter fluorocarbon chains, still poses
environmental and health concerns. As such, it is imperative to study the fate of PFAAs

2
in the environment and in organisms in order to elucidate their environmental behavior
and biological hazards.
ii. Chemistry of PFAAs
PFAAs are synthetic compounds that are derived from alkyl carboxylates and
sulfonates in which their hydrogen atoms are substituted with fluorine and have carbon
chain lengths between 1-14 carbons.1,2 The skeletal formulae of typical
perfluorocarboxylates (PFCAs) and perfluorosulfonates (PFSAs) of varying chain length
are displayed in Figure 1. Due to the strength of the carbon-fluorine bond (>461 kJ/mol),5
the presence of three lone pairs of electrons surrounding each fluorine atom, and the
effective shielding of the carbon backbone by the fluorine atoms,1 PFAAs are able to
resist degradation by strong acids and bases, oxidizing agents, reductants, photolytic
processes, physical processes, and metabolic processes, which allows these chemicals to
endure in the environment and in organisms for an extended period of time.1,2 Moreover,
the extensive fluorination of PFAAs gives rise to their unique and industrially attractive
physical and chemical properties, such as their high chemical stability, non-flammability,
low surface tension, hydrophobicity, and lipophobicity.1,2 In addition, the high
electronegativity of the fluorine atoms makes PFAAs strongly acidic molecules. In fact,
PFAAs have estimated pKa values ranging from -0.2 to 06 and consequently exist almost
exclusively as anions under environmental and physiological conditions.1,7 As expected
from their stability and resistance to degradation, PFAAs have long elimination half-lives
in humans; for instance, perfluorooctanoic acid (PFOA) has an estimated elimination
half-life of 3.8 years in human females.8 Interestingly enough, the elimination half-lives
of various PFAAs differ among species and between genders.2 For instance, the

3
elimination half-life of perfluorooctanesulfonic acid (PFOS) ranges from 100 days in
adult rats to 5.4 years in humans.9 Furthermore, the elimination half-life of PFOA in adult
female rats is 2-4 hours, but in adult male rats, it is 4-6 days.10
Figure 1. The general structures of perfluorocarboxylates (PFCAs, left) and
perfluorosulfonates (PFSAs, right) with the chain lengths indicated. Structures are shown
in the deprotonated form since PFAAs exist as anions under most biological and
environmental conditions.1,7

4
It is important to mention, from a biochemical standpoint, that PFAAs are
structurally similar to some endogenous ligands that bind to vital proteins in organisms.
For example, short-chain fatty acids are structurally analogous to PFCAs in that both
contain a hydrophilic carboxylate head group and a hydrophobic tail. The structural
similarities among PFCAs and short-chain fatty acids are demonstrated in Figure 2.
Because of this structural resemblance, PFAAs have the potential to compete with short-
chain fatty acids for binding to specific proteins and enzymes. If a PFAA successfully
binds to a protein, it could potentially inhibit the protein’s intended functions; thus,
PFAAs have the potential to adversely affect organisms, and the long elimination half-
lives of PFAAs in humans magnify this toxicity concern. However, despite their
structural similarity, PFAAs behave chemically different than fatty acids in some ways.
For example, PFAAs are lipophobic,1,2 due to their rigid fluorocarbon tails and the low
surface energy brought by the strongly-polarized carbon-fluorine bond,11 whereas fatty
acids are lipophilic.
Figure 2. Structural comparisons of hexanoic acid (common name, caproic acid), a short-
chain fatty acid, left, and perfluorohexanoic acid (PFHxA), right. The two compounds are
shown in their anionic forms for comparison.

5
iii. Bioaccumulation patterns and toxicokinetics of PFAAs
Because of their unique physical properties, PFAAs exhibit unusual
bioaccumulation patterns and toxicokinetics compared to typical hydrophobic organic
contaminants. For example, PFAAs do not accumulate in adipose tissue, where
hydrophobic contaminants tend to accrue, but rather in body compartments that are
abundant in highly-charged chemical species, such as proteins. Consequently, PFAAs
often aggregate in the blood,12-16 liver, and kidneys2,3,17-22 of organisms. The
bioaccumulation of PFAAs in these areas is concerning since these biological
components have vital functions in vertebrate animals, whereas bioaccumulation in
adipose tissue is less important toxicologically since its main function is to provide
energy storage and insulation.
The toxicokinetics of PFAAs in mammals have been well studied, and three key
features of their distribution and protein interactions have been characterized. First,
PFAAs accumulate in the blood plasma12-16 and exhibit high binding affinities to serum
albumin.23-28 Second, PFAA transport into cells is postulated to be mediated by passive
diffusion and by active transport via organic anion transporter (OAT) proteins.29,30 Some
OAT proteins, like the human OAT4 and URAT-1 proteins, are renal transport proteins
that control the reabsorption of organic anions from the urine to the blood, and are
hypothesized to be responsible for the extended elimination half-lives of several
PFAAs.30 Third, PFAAs exhibit binding interactions with fatty acid binding proteins
(FABPs), which are expressed in many different cell types, and consequently act as
relevant PFAA sinks in tissues.31-33 Among these protein interactions, PFAA binding to
serum albumin is considered to be more toxicologically pertinent because serum albumin

6
is the most abundant protein in mammalian blood34 and since the blood frequently
contains the highest concentrations of PFAAs. As such, serum albumin, including its
human, bovine, and rat homologs, is often used to study PFAA-protein interactions. In
addition, serum albumin can reversibly bind to a variety of ligands, making it an excellent
model to study both the physiological fate of PFAAs and the ability of PFAAs to
compete with endogenous ligands.
iv. Human serum albumin
Since the 19th century, human serum albumin (HSA) has been established as the
most abundant protein in the circulatory system, typically found at a concentration of
approximately 5 g per 100 mL; it is found in every tissue in the body.34 This protein is
produced in the liver and has a half-life of 19 days in circulation in the human body.34
HSA has a molecular weight of 66,245 Da and consists of a single polypeptide composed
of 585 amino acid residues.35 The monomeric protein contains three homologous
domains (I, II, and III), each with its own sub-domains, and these domains are most likely
derived from gene multiplication.36 The three-dimensional crystal structure of HSA has
been solved at a 2.5 Å resolution and is displayed in Figure 3.37

7
Figure 3. The three-dimensional crystal structure of HSA solved at 2.5 Å. The
monomeric protein has three domains and contains a variety of binding sites for ligands.36
This image was obtained from Protein Data Bank using the Protein Workshop software
(PDB ID 1AO6).37
In addition, HSA has a variety of critical functions in the circulatory system,
including maintaining blood pH and pressure, transporting fatty acids, removing oxygen
free radicals, and reversibly binding to a variety of endogenous and exogenous ligands.35
Such endogenous and exogenous ligands include transition metals like Cu2+ and Zn2+,
short-chain fatty acids, amino acids, proteins, metabolites, and drugs.35, 38-40 The ability of
HSA to reversibly bind to numerous ligands makes it an excellent model to examine the
binding of PFAAs to serum proteins, both to understand the physiological fate of PFAAs
and to investigate the potential of PFAAs to compete with endogenous ligands.

8
v. Prior studies of PFAA-serum albumin binding
Previous studies of PFAA-serum albumin binding have employed direct methods,
such as equilibrium dialysis, and indirect methods, such as spectroscopic techniques, and
established that PFAAs bind with relatively high affinity to serum albumin (see Table 1).
For example, Bischel et al. extensively studied the binding interactions between PFAAs
and bovine serum albumin (BSA, the homolog to HSA in cows) using a traditional
equilibrium dialysis method and determined that the binding constants are on the order of
106 M-1, varying with fluorocarbon chain length and ionic head group.24, 27 In addition,
Hebert and MacManus-Spencer developed a fluorescence model to probe the binding of
medium- to long-chain PFAAs to HSA and estimated that the binding affinities are on the
order of 104 M-1.25 Agreeing with the data obtained from Hebert et al., O’Connor and
MacManus-Spencer have used fluorescence and also estimated HSA-PFAA binding
constants to be on the order of 104 M-1, varying with fluorocarbon chain length and ionic
head group.28
Additional published studies, which employed various experimental techniques to
measure serum albumin-PFOA binding affinities, also reported similar binding constants,
reported in Table 1. These binding affinities range from 103 to 106 M-1, which highlights
some method disagreement among the experimental techniques utilized in these studies.

9
Table 1. Serum albumin-PFOA binding affinities (quantified as the association constant,
Ka) from published studies that utilized different experimental techniques.
Protein-ligand system
Ka (M-1)
Experimental Technique Source
HSA-PFOA 105 Fluorescence spectroscopy Chen et al. (2009)23 HSA-PFOA 104 Equilibrium dialysis Wu et al. (2009)41 HSA-PFOA 103 19F NMR and micro-desalting
separation Han et al. (2003)42
HSA-PFOA 105 Potentiometric methods Messina et al. (2005)43 BSA-PFOA 106 Equilibrium dialysis Bischel et al. (2010)24 and
(2011)27 BSA-PFOA 105 Fluorescence spectroscopy MacManus-Spencer et al.
(2010)26 HSA-PFOA 104 Fluorescence spectroscopy Hebert et al. (2010)25 HSA-PFOA 104 Fluorescence spectroscopy
and 19F NMR O’Connor et al.
(unpublished work)28 vi. Protein-ligand binding kinetics and quantitation
The binding interactions between a protein and a ligand, such as a drug or a
molecule of interest, can be characterized by measuring the binding affinity between the
two molecules using chemical kinetics. Biochemists quantify protein-ligand affinity by
measuring the dissociation constant, Kd, for a particular protein-ligand system. The
dissociation constant, Kd, is defined as the ratio of the products of the concentrations of
the dissociated species to the concentration of the complex at equilibrium.44 Specifically,
in the case of protein-ligand binding, the dissociation constant is defined as the products
of the concentrations of free protein and ligand divided by the concentration of the
protein-ligand complex (Equation 4).44
A protein binds to its corresponding ligand according to the laws of mass action,
which assumes reversible binding:44

10
The association rate constant, kon, is a second-order rate constant, and thus has
units of M-1s-1, because the association rate it expresses depends both on the
concentration of free ligand and the concentration of available binding sites in the
protein.45,46 The association rate constant (kon) is proportional to the forward rate of the
reaction:
The dissociation rate constant, koff, is a first-order rate constant, and thus has units
of s-1, because the dissociation rate depends only on the concentration of protein binding
sites occupied with bound ligand.45,46 The dissociation rate constant (koff) is proportional
to the reverse rate of the reaction:
The reaction reaches equilibrium when the forward and reverse reaction rates are
equal; that is, when the rate at which protein-ligand complexes are formed is equal to the
rate at which protein-ligand complexes dissociate into their constituent components.
Therefore, at equilibrium, Equations 1 and 2 are equal:
If Equation 3 is rearranged such that the ratio of the dissociation rate constant and
the association rate constant is isolated on one side of the equation, we obtain the
dissociation constant, Kd:
(1)
(2)
(3)

11
Thus, the dissociation constant, Kd, can also be defined as the ratio of the
dissociation rate constant (koff) to the association rate constant (kon) for a protein-ligand
system at equilibrium. From Equation 4, the units of Kd can be derived as M, which
makes this quantity mathematically convenient for further calculations. In addition, the
dissociation constant is inversely proportional to protein-ligand binding affinity, so a
smaller Kd value signifies stronger protein-ligand binding. The Kd is the inverse of the
association constant (Ka), which has units of M-1 and is colloquially referred to as the
binding constant for a protein-ligand system (Equation 5). Lastly, the association constant
is proportional to protein-ligand binding affinity; thus, a larger Ka value indicates stronger
protein-ligand binding.
vii. Equilibrium dialysis
As mentioned, there are many techniques that can be used to measure the binding
affinity between a protein and a ligand (i.e., the Ka value of the protein-ligand system),
including spectroscopic approaches as well as more direct methods, such as equilibrium
dialysis. Equilibrium dialysis is the preferred method because it can be used to directly
and accurately measure the relationship between ligand binding (Ka) and bound ligand
concentration for protein-ligand systems, a benefit that spectroscopic methods cannot
exploit.47 Moreover, since protein-ligand binding is examined at kinetic equilibrium in
(4)
(5)

12
equilibrium dialysis, the method reduces the possibility of non-specific binding and
therefore provides more accurate measurements of Ka values.47
In equilibrium dialysis, a dialysis membrane with a specific molecular weight cut
off (MWCO) separates two chambers: one containing protein and the other containing
ligand (in this case, PFAAs). The dialysis membrane prevents the protein molecules from
diffusing across to the other chamber containing ligand, while the ligand can freely
diffuse across the membrane and bind to the protein. Once equilibrium has been reached,
the concentration of free ligand is measured, from which the bound concentration is
calculated.48 A schematic summary of the equilibrium dialysis method is shown in
Figure 4.

13
Figure 4. A schematic diagram of an equilibrium dialysis method to measure protein-
ligand binding affinities. Adapted from Harvard Appartus.49
Upon studying several ligand:protein mole ratios, the relationship between
binding and ligand concentration can be determined, which can then be used to calculate
the number of binding sites (n) and the ligand affinity (Ka) through the construction and
curve-fitting of a binding isotherm plot.48 A sample binding isotherm plot is shown in
Figure 5. In a binding isotherm, the binding coefficient (𝜐) or fractional saturation,
defined as the ratio of bound ligand concentration to protein concentration, is plotted as a
function of free ligand concentration; the shape of the plot typically resembles a
hyperbolic curve. Lastly, it is important to note that when half of the available binding
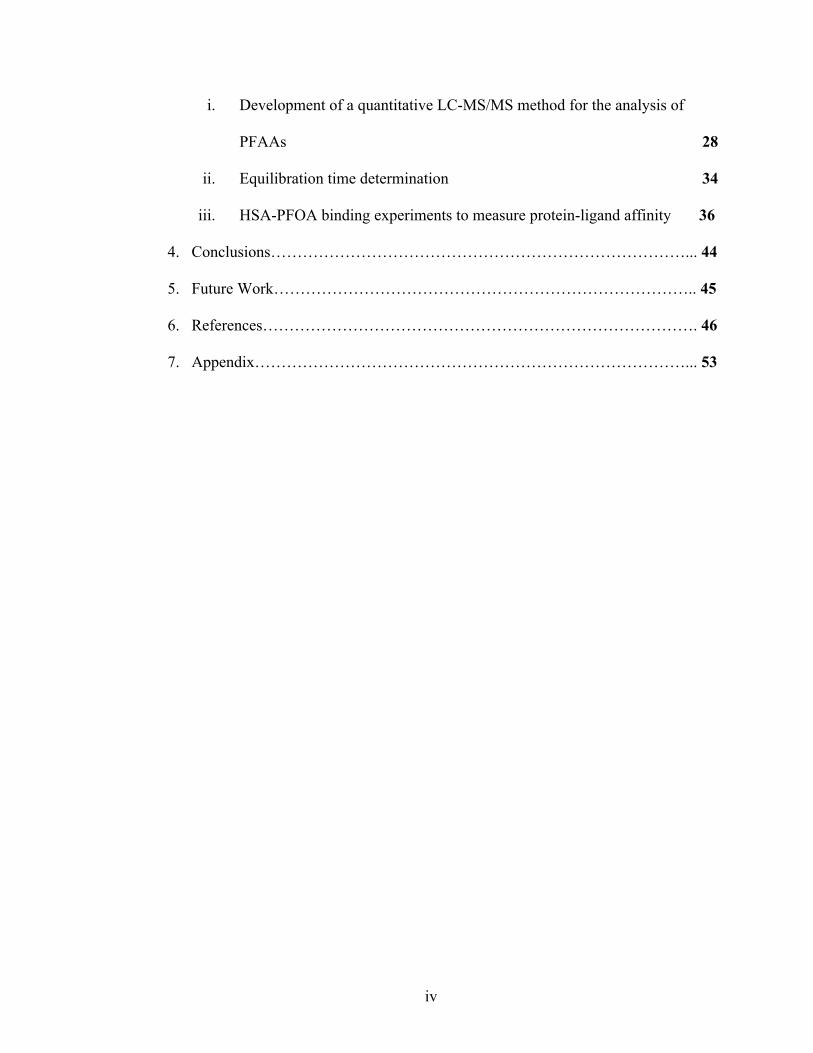
14
sites in a protein are occupied, the binding coefficient is equal to 0.5 (the half-maximal
saturation), and the free ligand concentration is equivalent to Kd.
Figure 5. A binding isotherm plots the binding coefficient (𝜐) as a function of free ligand
concentration, which typically generates a hyperbolic curve. This image was adapted
from Kuriyan et al.50
Although equilibrium dialysis provides an accurate and direct way to measure
binding constants, the traditional method has been shown to be cumbersome and slow.
The traditional method of equilibrium dialysis consists of inserting a dialysis bag
containing the protein and ligand of interest into a beaker filled with buffered solution,
waiting for equilibration, and measuring unbound ligand concentration. However, this
method is slow and cumbersome because only one mole ratio and one solution condition
can be tested at one time, it requires large sample volumes, and the experimental setup is

15
time-consuming. Fortunately, these shortcomings of equilibrium dialysis have been
addressed through the introduction of 96-well dialysis plates, which are commercially
available through a variety of companies. For example, the 96-well equilibrium dialyzer
(Harvard Apparatus) contains 96 individual wells, each with its own MWCO dialysis
membrane. This allows one to conduct up to 96 individual binding experiments at one
time, in which the PFAA:protein mole ratios and the solution conditions can be varied.
Furthermore, the 96-well equilibrium dialyzer uses small volumes (up to 300 µL) of
protein and ligand solutions; thus, it is less wasteful when it comes to solution
preparation compared to the traditional methods of equilibrium dialysis.
In these equilibrium dialysis assays, the concentrations of free and bound ligand
can be determined using liquid chromatography-tandem mass spectrometry (LC-
MS/MS), a highly sensitive and selective method for the quantitation of organic
chemicals, such as PFAAs.
viii. Liquid chromatography-tandem mass spectrometry (LC-MS/MS)
Liquid chromatography-tandem mass spectrometry (LC-MS/MS) is a powerful
analytical instrument that couples high performance liquid chromatography (HPLC) and
mass spectrometry to analyze small organic molecules and biomolecules. In LC-MS/MS,
the HPLC is used to physically separate a mixture of chemical species due to their
differential interactions with the stationary phase, and the mass spectrometer provides
further chemical separation via mass-to-charge (m/z) selectivity as well as quantitation by
measuring the ion abundance for each chemical species.51
In HPLC, high pressure is applied to force solvent (the mobile phase) through a
packed column, containing a layer of densely-packed, microporous silica beads, which
16
act as a support for the stationary phase (e.g., an octadecyl carbon chain, C18, in the case
of reverse phase chromatography). The mixture of analytes is then mixed with the mobile
phase and loaded onto the column via an autosampler. In the column, the analytes are
separated due to their differential interactions with the stationary phase, which results in
each analyte eluting from the column at a different time; thus, each analyte has a unique
retention time in the column. Therefore, HPLC yields a separation of a mixture of
chemical species due to their differences in retention time in the column. A detector, such
as a UV/Vis spectrophotometer, is used to visualize the separation and quantify separated
analytes. Computer software is used to generate a chromatogram, which is a plot of
detector response (e.g., absorbance signal) as a function of time.51
The most commonly used type of HPLC is reverse phase liquid chromatography,
in which the stationary phase is nonpolar and the mobile phase is more polar. In reverse
phase HPLC, a mixture of compounds is separated based on differences in analyte
polarity and their differential interactions with the stationary and mobile phases. In this
scheme, a polar compound will preferentially interact with the mobile phase and thus
spends less time interacting with the nonpolar stationary phase, which results in a fast
elution from the column and a short retention time. However, a nonpolar compound will
exhibit thermodynamically-favorable interactions with the nonpolar stationary phase and
thus spend more time in the column, which results in a slower elution from the column
and a longer retention time.51
In addition to UV/Vis absorption detectors, other types of detectors may be
coupled to an HPLC. In LC-MS/MS, a triple quadrupole mass analyzer with an electron
multiplier serves as the detector. After a mixture of compounds is separated by reverse-
17
phase HPLC, they are transferred to the coupled triple quadrupole mass spectrometer for
mass analysis via an ion source, such as electrospray ionization (ESI). ESI is a soft
ionization technique that serves as the “connector” between liquid chromatography and
mass spectrometry in LC-MS. In ESI, a voltage is applied to the liquid sample after it
leaves the column, and the combination of a strong electric field at the nebulizer outlet
and the coaxial flow of N2 gas creates an aerosol of gaseous ions. It is important to note
that the gas phase ions consist of the same ions found in the original liquid sample. Once
the analyte’s ions enter the mass spectrometer, its ions are filtered through a series of
mass analyzers based on their m/z values. A common mode of mass analysis in a triple
quadrupole mass spectrometer is multiple reaction monitoring (MRM). In MRM analysis,
the precursor ion is selected in the first mass analyzer (first quadrupole). The quadrupole
mass analyzer selects the ion of interest, the precursor ion, by filtering ions according to
their m/z values. Specifically, a quadrupole consists of four poles, such that the adjacent
poles have a voltage of opposite polarity applied to them. In order to filter an ion of
interest, a coupled AC and DC voltage ramp is applied to the four poles, which affects the
trajectories of ions as they travel through the center of the quadrupole. At a particular
AC/DC voltage ratio, only ions with a specific m/z have a successful trajectory through
the quadrupole and into the next chamber, whereas all other ions collide with the poles
and are therefore lost before they enter the collision chamber. In the collision chamber (a
hexapole), an inert gas fragments the precursor ion via a process called collision-induced
dissociation. Next, the fragment ions enter the second mass analyzer (another
quadrupole), which separates the fragment ions based on their m/z values; the ions are
then detected by an electron multiplier detector. Computer software is used to generate a

18
mass spectrum, which is a plot of signal intensity as a function of m/z, for an analyte’s
precursor and fragment ions. 51,52 The various steps of MRM are summarized in Figure 6.
MRM analysis is useful for analytical studies for it provides high sensitivity and
selectivity through the reduction of chemical noise and the correlation of specific
fragment ions with their respective precursor ions. In addition, the selection and collision
processes are fast, which allows for the analysis of multiple analytes in a single run. In
fact, the analytes do not necessarily need to be chromatographically separated for MRM
analysis to work since mass analyzers can select ions based on their m/z values. The mass
analysis provided by MRM makes it possible to selectively and sensitively measure the
concentration of unbound PFAAs from equilibrium dialysis assays.
Figure 6. A schematic diagram that summarizes the steps involved in MRM in an LC-
MS/MS. Image adapted from Last et al.53
ix. Experimental goals
Interactions between PFAAs and serum proteins have been studied previously
using equilibrium dialysis and spectroscopic approaches; however, many of these studies
are deficient in experimental parameters that allow a greater understanding of the

19
bioaccumulation patterns, toxicokinetics, and binding mechanisms between PFAAs and
serum proteins. For example, some studies only focused on one or two PFAAs,41-43 and
those that did examine PFAAs with varying chain lengths did not take into account
solution conditions (i.e., pH and ionic strength),24-26 except for two previous studies27,54
and O’Connor and MacManus-Spencer.28 Furthermore, some spectroscopic methods,
such as fluorescence, cannot be used to study the binding interactions between short-
chain PFAAs and HSA, since short-chain PFAAs fail to cause a conformational change
in HSA.25,28 The improved equilibrium dialysis method, described and implemented in
this study, can solve these issues since (1) this method is high-throughput and can
accommodate the probing of various experimental parameters, such as varying PFAA
chain length as well as solution conditions, and (2) our method allows one to measure
directly the relationship between ligand binding (Ka) and ligand concentration.
The main goal of this study is to implement a more efficient and improved
approach to the use of equilibrium dialysis to study PFAA-protein binding. Using our
improved equilibrium dialysis method, we obtained PFAA-HSA binding affinities that
can be compared to: (1) PFAA-BSA binding affinities determined by a traditional method
of equilibrium dialysis in studies by Bischel et al.27 (2010) and (2) PFAA-HSA binding
affinities determined through fluorescence studies executed by O’Connor and
MacManus-Spencer28 as well as the other prior studies.25 By obtaining binding affinities
that agree with those obtained using the traditional equilibrium dialysis method, we can
establish our improved equilibrium dialysis method as a valid method to characterize
PFAA-protein binding. We also seek to compare our results to those obtained using

20
fluorescence spectroscopy in order to investigate the apparent discrepancy in binding
affinities.
II. Materials and Methods
A. Materials
96-well Equilibrium Dialyzer plates and a plate rotator were obtained from
Harvard Apparatus (Holliston, MA). Human serum albumin (HSA; ≥ 99%, essentially
fatty acid and γ-globulin free) was obtained from Sigma-Aldrich (St. Louis, MO), and
66,245 Da was used as the molecular weight.35 Pentafluoropropionic acid (PFPrA; 97%),
perfluorobutanesulfonic acid potassium salt (PFBS-K+; 98%), perfluoropentanoic acid
(PFPnA; 97%), perfluorohexanoic acid (PFHxA; 97%), perfluorohexanesulfonic acid
potassium salt (PFHxS-K+; 98%), perfluoroheptanoic acid (PFHpA; 99%),
perfluorooctanoic acid (PFOA; 96%), perfluorooctanesulfonic acid potassium salt
(PFOS-K+; 98%), perfluorononanoic acid (PFNA; 97%), perfluoroundecanoic acid
(PFUnA; 95%), and perfluorododecanoic acid (PFDoA; 95%) were also obtained from
Sigma-Aldrich. Perfluorobutanoic acid (PFBA; 99%), perfluorooctanoic acid (PFOA;
96%), and perfluorodecanoic acid (PFDA; 96%) were obtained from Acros Organics
(Morris Plains, NJ) through Fisher Scientific USA (Pittsburgh, PA). Sodium phosphate
monobasic (99.3%, monohydrate), sodium phosphate dibasic (99.3%, anhydrous),
ammonium hydroxide (certified ACS Plus), methanol (Optima LC-MS grade, 0.1-micron
filtered), water (Optima LC-MS grade, 0.03-micron filtered), ammonium acetate, and
polypropylene microcentrifuge tubes (2 mL) were obtained from Fisher Scientific.
Polypropylene centrifuge tubes (15- and 50-mL) were obtained from Corning

21
Incorporated (Corning, NY). HPLC autosampler vials and caps were obtained from
Kinesis, Inc. (Malta, NY). A C18 Gemini column (50 x 2.0 mm x 5 µm) was obtained
from Phenomenex, Inc. (Torrance, CA). A C18 Targa Sprite column (40 x 2.1 mm x
5 µm) was obtained from Higgins Analytical (Mountain View, CA). A C18 Eclipse
column (4.6 x 150 x 5 µm) was obtained from Agilent Technologies (Santa Clara, CA). A
mass-labeled (13C4) PFOA internal standard (50 µg/mL) was obtained from Wellington
Laboratories, Inc. (Ontario, Canada).
B. Methods
i. Sample preparation
Sodium phosphate buffers (50 mM total phosphate concentration; at pH 7) were
prepared from sodium phosphate monobasic and sodium phosphate dibasic in LC-MS
grade water. Stock solutions of PFAAs were prepared either in pure LC-MS grade
methanol, a 70:30 mixture of LC-MS grade methanol and 0.01% ammonium hydroxide,
or 50 mM sodium phosphate buffer (at pH 7) in 10- or 50-mL polypropylene centrifuge
tubes, as needed. If the PFAA was not soluble in the stock solution, the solution was
sonicated in a water bath at about 40 °C until dissolved using the Bransonic Tabletop
Ultrasonic Cleaner 3510 (Branson Ultrasonic Corporation; Danbury, CT). A purity-
corrected stock solution of 500 µM HSA in 50 mM sodium phosphate buffer (at pH 7)
was prepared in a 50-mL glass volumetric flask. This solution was prepared fresh for
every experiment.
ii. Equilibrium dialysis
The 96-well Equilibrium Dialyzer is a two-sided dialysis plate, containing 12
columns by 8 rows of 96 individual wells. Using this dialysis plate, a column of eight
22
wells on the “ligand” side of the plate was sealed with caps (from Harvard Apparatus).
The plate was inverted to the “protein” side of the plate, in which 200 µL of 500 µM
HSA in 50 mM sodium phosphate buffer (at pH 7) were pipetted into the appropriate
wells; after, these wells containing protein were sealed with caps. Then, the plate was
inverted to the “ligand” side and the caps covering the appropriate wells were removed.
Using a micropipette, 200 µL of PFAA (of known concentration) in 50 mM sodium
phosphate buffer (at appropriate pH) was pipetted into the appropriate wells and then
sealed with caps. The plate was then secured onto a plate rotator and rotated (using the
fastest rotation speed) at room temperature until equilibrium was achieved. Upon
equilibration, samples from both sides of the plate were collected and stored in either
HPLC autosampler vials or in 2 mL microcentrifuge tubes at 4 °C until analysis by LC-
MS/MS, when the concentration of unbound PFAAs was measured in the “ligand” side
samples. Equilibrium dialysis experiments were performed either in singlicate, duplicate,
or triplicate, depending on the experiment.
iii. LC-MS/MS quantitative analysis of PFAAs
Samples analyzed by LC-MS/MS were pipetted into HPLC autosampler vials and
diluted with a combination of the following solutions: mass-labeled [13C4]-PFOA internal
standard in LC-MS grade water (10 nM final concentration), 50 mM sodium phosphate
buffer (at pH 7), and 70:30 mixture of LC-MS grade methanol and 0.01% ammonium
hydroxide. The volumes of each solution were in a 1:2:2 proportion, respectively. For all
LC-MS/MS experiments, a blank (which contained the mass-labeled internal standard in
water, 70:30 mixture of LC-MS grade methanol and 0.01% ammonium hydroxide, and
50 mM sodium phosphate buffer at appropriate pH) and a double blank (which contained

23
LC-MS grade water, 70:30 mixture of LC-MS grade methanol and 0.01% ammonium
hydroxide, and 50 mM sodium phosphate buffer (at pH 7) were included for analysis. An
Agilent 1200 series HPLC and Agilent 6410B triple quadrupole mass spectrometer were
used to analyze the samples. Separation of analytes was achieved by reverse-phase HPLC
using three different columns and methods: Gemini C18 column (Phenomenex), Sprite C18
column (Higgins Analytical), and Eclipse C18 (Agilent Technologies). In method 1, the
Gemini C18 column was utilized, and the mobile phase was a gradient mixture consisting
of different percentages of 2 mM ammonium acetate in LC-MS grade water and pure LC-
MS grade methanol over time. The gradient used to separate a mixture of PFAAs,
including PFPrA, PFBA, PFBS, PFPnA, PFHxA, PFHxS, PFHpA, PFOA, PFOS, PFNA,
PFDA, PFUnA, and PFDoA, using the Gemini C18 column is displayed in Table 2.
Table 2. The HPLC gradient used to separate a mixture of PFAAs studied using
method 1.
Time (min) Percentage of LC-MS grade methanol 0 30% 2 30% 3 70% 4 70% 5 50% 6 50% 7 70% 8 70% 9 90%

24
Later studies utilized two other methods since the Gemini C18 column is no longer
functional. In method 2, the Targa Sprite C18 column was used with an isocratic mobile
phase to separate a single PFAA per experiment; information pertaining to method 2 is
displayed in Table 3. In method 3, the Eclipse C18 column was utilized and a similar
isocratic method was used to elute a single PFAA per experiment; information pertaining
to method 3 is also displayed in Table 3. Methods 2 and 3 later proved to be unsuccessful
due to column pressure issues that remain unresolved.
Table 3. The isocratic mobile phases used to separate analytes for methods 2 and 3.
Method and column Analyte eluted
Percentage of LC-MS grade methanol
Approximate analyte retention time (min)
Method 2; Sprite C18 (Higgins Analytical)
PFOA 55% 4.44
Method 3; Eclipse C18 (Agilent Technologies)
PFOA 65% 4.65
For methods 1 and 3, the following parameters were held constant throughout all
separations. For all gradient and isocratic methods, a 40 µL injection volume, 1 mL/min
flow rate, and 400 bar maximum pressure were used. Furthermore, the mass spectrometer
was operated in negative electrospray ionization (ESI) mode with multiple reaction
monitoring (MRM) analysis, with a 60 psi nebulizer pressure, 12 L/min gas flow, 350 °C
gas temperature kept constant for all analyses. For method 2, the following parameters
were utilized: 0.5 mL/min flow rate, 400 bar maximum pressure limit, negative ESI mode
with MRM analysis, 40 psi nebulizer pressure, 10 L/min gas flow, and 350 °C gas
temperature. The raw data obtained from the LC-MS/MS were processed using
MassHunter Qualitative and Quantitative software (Agilent Technologies; Santa Clara,

25
CA) and were analyzed in Microsoft Office Excel (Microsoft Corporation; Redmond,
WA) and KaleidaGraph graphical analysis software (Synergy Software Systems; Dubai,
United Arab Emirates).
The three MRM methods were optimized by using the MassHunter Optimizer
software (Agilent Technologies; Santa Clara, CA), which determined the relevant
transition ions to be monitored for each analyte along with fragmentor voltages and
collision energies. For all three methods, Table 4 summarizes the transition ions
monitored, their corresponding fragmentor voltages and collision energies, and the
quantifier and qualifier ions for all analytes studied.
Table 4. The MRM parameters used in this study.
Analyte Transition type
MRM transition (m/z)
Fragmentor Voltage (V)
Collision Energy (V)
PFBA
Quantifier 213 → 169 50 0
PFOA
Quantifier 413 → 369 65 4
Qualifier 413 → 169 65 16
PFDoA
Quantifier 613 → 569 80 4
Qualifier 613 → 169 80 24 [13C4]-PFOA
(ISTD) Quantifier 417 → 372 60 4
A nested calibration curve was designed to contain standard solutions (of a
particular PFAA or a mixture of PFAAs) within a linear concentration range of 0.150 –
6000 nM. Using a PFAA stock solution of known concentration, the nested calibration
standards were prepared via nested serial dilutions. Each diluted standard was pipetted

26
into an HPLC autosampler vial and was further diluted using 10 nM mass-labeled
internal standard, 50 mM sodium phosphate buffer (at appropriate pH), 70:30 mixture of
LC-MS grade methanol and 0.01% ammonium hydroxide, and/or LC-MS grade water.
The standards were “matrix-matched” to the samples (i.e., the standards had the same
proportions, by volume and concentration, of solvents, buffers, and internal standards).
The standard solutions were then analyzed via LC-MS/MS to measure the concentration
of the PFAA standards. Using MassHunter Quantitative software (Agilent Technologies;
Santa Clara, CA), a standard curve using the nested calibration standards was generated
and the standards with 70% – 130% accuracy, with 1/x weighting, were only kept. For all
PFAA-protein binding experiments, the PFAA standard solutions were made fresh and
were analyzed, using the LC-MS/MS, in tandem with the protein binding experiment
samples.
iv. Equilibration time determination
In order to establish the amount of time needed for a PFAA and HSA to reach
equilibrium using equilibrium dialysis, multiple samples of 500 µM HSA and 10 µM of a
specific PFAA were tested at different time points (between 18 – 120 hours) using the
96-well Equilibrium Dialyzer. At each time point, the appropriate sample was collected
from the “ligand” side of the plate, and the concentration of free PFAA was measured
using LC-MS/MS. A plot of percentage of PFAA bound versus time (in hours) was
constructed. The desired equilibration time occurs when the percentage of PFAA bound
to HSA approaches 100%, so the time at which this occurs is the optimal equilibration
time for the PFAA and HSA. We determined that a 48-hour equilibration time for all
27
HSA-PFAA experiments was sufficient for binding analysis (shown in the Results and
Discussion section).
v. HSA-PFOA binding experiments to measure protein-ligand affinity
In this experiment, seventeen PFOA:HSA mole ratios were tested using the 96-
well Equilibrium Dialyzer in triplicate, in which the HSA concentration remained
constant at 500 µM: 0.01:1, 0.02:1, 0.05:1, 0.1:1, 0.2:1, 0.4:1, 0.8:1, 1:1, 1.2:1, 1.4:1,
1.6:1, 2:1, 3:1, 3.6:1, 4:1, 8:1, and 16:1. After 48 hours of equilibration, the appropriate
sample was collected from the “free-ligand” side of the plate and was subsequently
diluted in a HPLC autosampler vial. The free PFOA concentration was measured using
LC-MS/MS for each mole ratio sample in tandem with freshly prepared PFOA standards.
The bound PFOA concentration was calculated by subtracting the measured free PFOA
concentration value from the nominal initial concentration. The binding coefficient was
calculated by dividing the bound PFOA concentration by the HSA concentration. Since
this experiment was performed in triplicate, the average free PFOA concentrations and
average binding coefficients, along with their standard deviations, were calculated. A
binding isotherm plot was constructed by plotting the average binding coefficient as a
function of average free PFOA concentration.
vi. Curve-fitting the binding isotherm plot via binding class models
Using KaleidaGraph software, the binding isotherm plot was curve-fitted using a
nonlinear regression function that assumes a two independent binding site model. Since
proteins often have more than one binding site for the same ligand, it is necessary to take
the number of binding sites, n, into account when creating a model. Thus, if the binding

28
events are independent, then the binding coefficient (𝜐) for a protein that contains n
binding sites can be expressed as:
𝜐 = 𝑛 𝜐!
!
!!!
If there is only one binding site class site associated with one Ka value, then
equation 6 becomes the one-binding class model:
𝜐 =𝑛!𝐾![PFOA]!"##
1+ (𝐾![PFOA]!"##)
However, if there are two different classes of binding sites with unique binding
affinities, then equation 6 becomes the two-binding class model:
𝜐 =𝑛!𝐾!,![PFOA]!"##
1+ (𝐾!,![PFOA]!"##)+
𝑛!𝐾!,![PFOA]!"##1+ (𝐾!,![PFOA]!"##)
Equation 7 was used in KaleidaGraph to generate a best-fit curve function and
determine the values for n1, n2, Ka,1, and Ka,2.
3. Results and Discussion
i. Development of a quantitative LC-MS/MS method for the analysis of PFAAs
Three different quantitative LC-MS/MS methods for the analysis of PFAAs were
developed during the course of this project. Each method corresponds to a specific HPLC
column; that is, method 1 utilizes the Phenomenex Gemini C18 column, method 2 utilizes
the Higgins Sprite C18 column, and method 3 utilizes the Agilent Eclipse C18 column.
Method 1 is no longer used since the Phenomenex Gemini C18 column is broken, which
resulted in the development of method 2. However, the Higgins Sprite C18 column is
currently experiencing unresolved pressure issues, so method 3 was developed as a
(6)
(8)
(7)
29
temporary placeholder for method 2. However, the Agilent Eclipse C18 column is
currently experiencing pressure and leaking issues, so the development of a new
quantitative LC-MS/MS method using a new column may be required for the
continuation of this project.
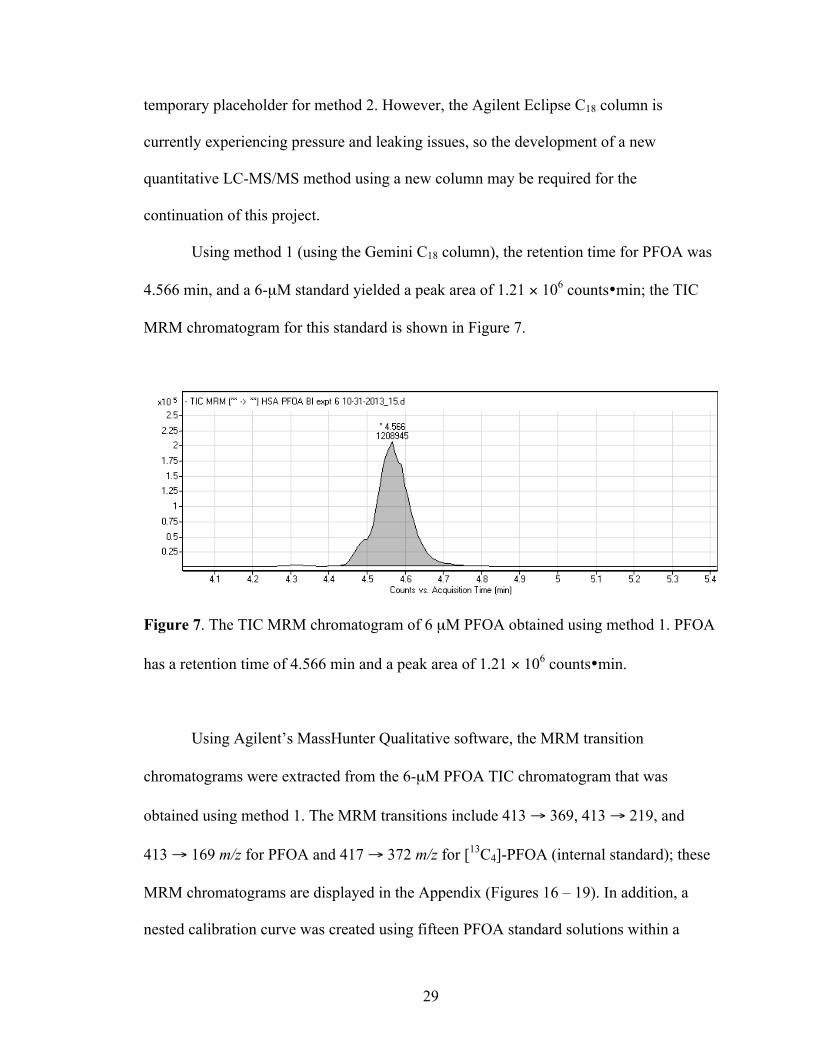
Using method 1 (using the Gemini C18 column), the retention time for PFOA was
4.566 min, and a 6-µM standard yielded a peak area of 1.21 × 10⁶ counts•min; the TIC
MRM chromatogram for this standard is shown in Figure 7.
Figure 7. The TIC MRM chromatogram of 6 µM PFOA obtained using method 1. PFOA
has a retention time of 4.566 min and a peak area of 1.21 × 10⁶ counts•min.
Using Agilent’s MassHunter Qualitative software, the MRM transition
chromatograms were extracted from the 6-µM PFOA TIC chromatogram that was
obtained using method 1. The MRM transitions include 413 → 369, 413 → 219, and
413 → 169 m/z for PFOA and 417 → 372 m/z for [13C4]-PFOA (internal standard); these
MRM chromatograms are displayed in the Appendix (Figures 16 – 19). In addition, a
nested calibration curve was created using fifteen PFOA standard solutions within a

30
concentration range of 0.150 – 6000 nM. The nested calibration curve of the PFOA
standards was plotted and fitted with a best-fit line using 1/x weight, and is shown in
Figure 8.
Figure 8. A nested calibration curve created from 0.150 – 6000 nM PFOA standards
using method 1. Agilent MassHunter Quantitative software was used to fit the nested
calibration curve using 1/x weight, and the best-fit line is displayed on the plot.
Using method 2 (using the Higgins Sprite C18 column), the retention time for
PFOA was 3.665 min, and a 6-µM standard yielded a peak area of
4.68 × 10⁶ counts•min; the TIC MRM chromatogram for this standard is shown in
Figure 9.

31
Figure 9. The TIC MRM chromatogram of 6 µM PFOA obtained using method 2. PFOA
has a retention time of 3.665 min and a peak area of 4.68 × 10⁶ counts•min.
Using Agilent’s MassHunter Qualitative software, the MRM transition
chromatograms were extracted from the 6-µM PFOA TIC chromatogram that was
obtained using method 2. The MRM transitions include 413 → 369, 413 → 219,
413 → 169, and 413 → 119 m/z for PFOA and 417 → 372 m/z for [13C4]-PFOA (internal
standard); these MRM chromatograms are displayed in the Appendix (Figures 20 – 24).
In addition, a nested calibration curve was created using fifteen PFOA standard solutions
within a concentration range of 0.150 – 6000 nM. The nested calibration curve of the
PFOA standards was plotted and fitted with a best-fit line using 1/x weight, and is shown
in Figure 10.

32
Figure 10. A nested calibration curve created from 0.150 – 6000 nM PFOA standards
using method 2. Agilent MassHunter Quantitative software was used to fit the nested
calibration curve using 1/x weight, and the best-fit line is displayed on the plot.
Using method 3 (using the Agilent Eclipse C18 column), the retention time for
PFOA was 3.088 min, and a 6-µM standard yielded a peak area of
2.14 × 10⁷ counts•min; the TIC MRM chromatogram is shown in Figure 11.

33
Figure 11. The TIC MRM chromatogram of 6 µM PFOA obtained using method 3.
PFOA has a retention time of 3.088 min and a peak area of 2.14 × 10⁷ counts•min.
Using Agilent’s MassHunter Qualitative software, the MRM transition
chromatograms were extracted from the 6-µM PFOA TIC chromatogram that was
obtained using method 3. The MRM transitions include 413 → 369, 413 → 219,
413 → 169, and 413 → 119 m/z for PFOA and 417 → 372 m/z for [13C4]-PFOA (internal
standard); these MRM chromatograms are displayed in the Appendix (Figures 25 – 29).
In addition, a nested calibration curve was created using fifteen PFOA standard solutions
within a concentration range of 0.150 – 6000 nM. The nested calibration curve of the
PFOA standards was plotted and fitted with a best-fit line using 1/x weight, and is shown
in Figure 12.

34
Figure 12. A nested calibration curve created from 0.150 – 6000 nM PFOA standards
using method 3. Agilent MassHunter Quantitative software was used to fit the nested
calibration curve using 1/x weight, and the best-fit line is displayed on the plot.
ii. Equilibration time determination
The time of complete equilibration for HSA and PFOA using equilibrium dialysis
was successfully determined to be 120 hours (5 days) at room temperature. This time of
equilibration was determined by making an equilibration time plot, in which percent
PFOA bound to HSA was plotted as a function of time (in hours); the equilibration time
plot for PFOA and HSA using equilibrium dialysis is shown in Figure 13. The timepoints
tested were 18, 24, 48, 72, 86, 96, and 120 hours of equilibration. At 48 hours, the
percentage of bound PFOA to HSA was 98.6%; thus, all equilibrium dialysis experiments
were carried out over a 48-hour timespan since a significant amount (~99%) of PFOA
was bound to HSA at this time point. This was a reasonable compromise since the bound

35
percentage difference between the 48- and 120-hour timepoints was negligible and since
120 hours is too long for experimental purposes.
Figure 13. The equilibration time plot used to determine the time of equilibration for
PFOA and HSA using equilibrium dialysis. The timepoints tested were 18, 24, 48, 72, 86,
96, and 120 hours of equilibration.
Furthermore, the times of equilibration for perfluorobutanoic acid (PFBA) and
perfluorododecanoic acid (PFDoA) with HSA using equilibrium dialysis were

36
determined to be 120 hr, with no significant difference between the 96 hr and the 120 hr
timepoints, as shown in Table 5. However, due to the overall similarity to PFOA in terms
of percent bound at each timepoint, it is reasonable to assume that 48 hours would be a
suitable equilibration time for PFBA and PFDoA.
Table 5. The percent bound to HSA, at specific time points, for PFBA, PFOA, and
PFDoA, determined by equilibrium dialysis and LC-MS/MS.
PFAA Timepoint (hr) Percent Bound to HSA
PFBA 96 99.1% 120 98.6%
PFOA 96 99.9% 120 100.0%
PFDoA 96 99.3% 120 98.2%
iii. HSA-PFOA binding experiments to measure protein-ligand affinity
Binding constants (Ka values) in this study were determined by constructing a
binding isotherm and curve-fitting the data by using the appropriate mathematical model.
Seventeen PFOA:HSA mole ratios were tested in triplicate, ranging from 0.01:1 to 16:1,
the concentration of HSA was held constant, and the total equilibration time was 48
hours. Accordingly, the binding coefficient (𝜐 = [PFOA]bound/[HSA]) was plotted as a
function of free PFOA concentration. The resulting binding isotherm data were fitted
using two different mathematical models. In the first model, it was assumed that there
was only one class of binding sites available in HSA for PFOA to bind, and so the plot
was subsequently modeled by using equation 7 in KaleidaGraph. The resulting binding
isotherm is shown in Figure 14.

37
Figure 14. The binding coefficient, 𝜐, for the binding of PFOA to 500 µM HSA versus
free concentration of PFOA ([PFOA]free). This binding isotherm was fitted using the one-
binding class model (equation 7); the best-fit parameters for this curve are
Ka = 8.7 (± 0.6) x 103 M-1 and n = 15.3 (± 0.4) sites, and the R2 value for this fit is 0.9930.
Error bars (both x and y) represent standard deviations from triplicate measurements.
The corresponding best-fit parameters for the one-binding class fit in Figure 14
are summarized in Table 6. In summary, the one-binding class model demonstrated that
there are approximately 15 binding sites in HSA that are associated with a binding

38
constant that is on the order of 103 M-1. However, this binding constant did not agree well
with the literature values for PFOA-serum albumin binding constants listed in Table 1,
which typically range between 104 – 106 M-1. Consequently, a two-binding class model
was sought to determine if more reasonable binding constants could be obtained.
The PFOA-HSA binding isotherm data were fitted using a mathematical model
that assumed that there are two binding site classes in HSA (two-binding class model;
equation 8). The resulting fitted plot is displayed in Figure 15.
39
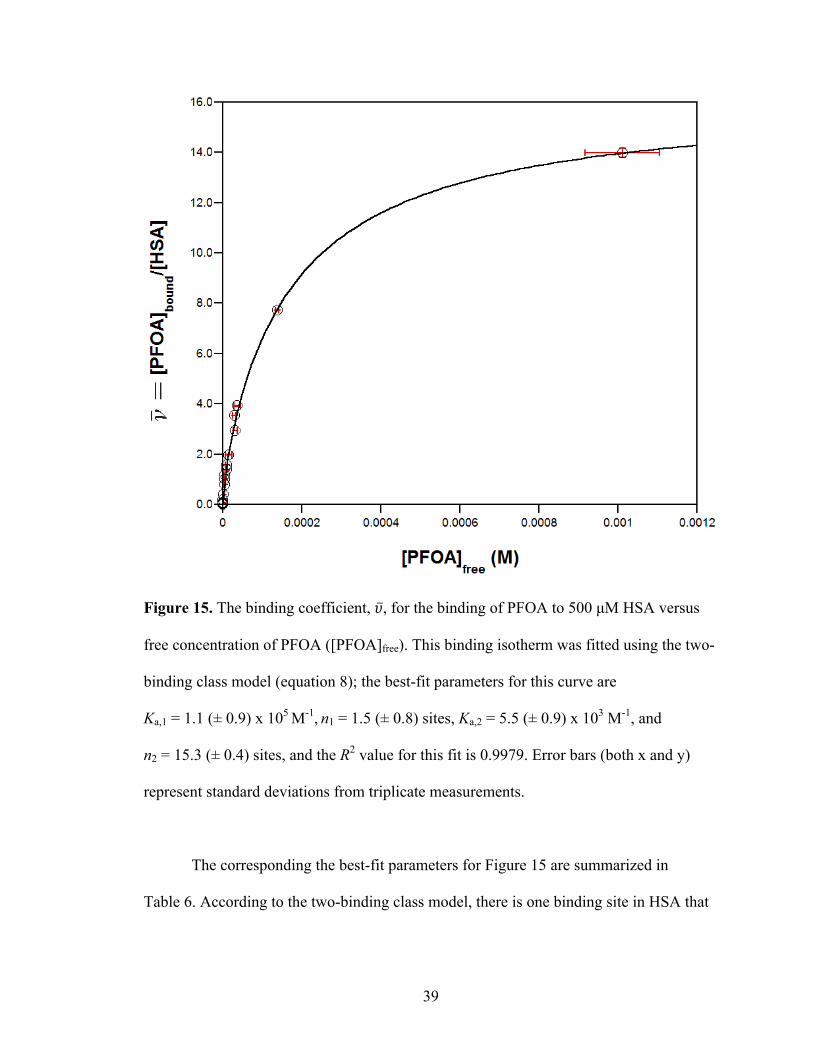
Figure 15. The binding coefficient, 𝜐, for the binding of PFOA to 500 µM HSA versus
free concentration of PFOA ([PFOA]free). This binding isotherm was fitted using the two-
binding class model (equation 8); the best-fit parameters for this curve are
Ka,1 = 1.1 (± 0.9) x 105 M-1, n1 = 1.5 (± 0.8) sites, Ka,2 = 5.5 (± 0.9) x 103 M-1, and
n2 = 15.3 (± 0.4) sites, and the R2 value for this fit is 0.9979. Error bars (both x and y)
represent standard deviations from triplicate measurements.
The corresponding the best-fit parameters for Figure 15 are summarized in
Table 6. According to the two-binding class model, there is one binding site in HSA that

40
has a high affinity for PFOA (Ka,1 ~ 105 M-1) as well as 15 other binding sites that are
associated with a weaker affinity (Ka,2 ~ 103 M-1).
Table 6. The corresponding Ka, n, and R2 values for the HSA-PFOA binding isotherm
plots, fitted using the one- and two-binding class models (Figures 14 and 15).
One-binding class model Two-binding class model Ka (M-1) 8.7 (± 0.6) × 103 Ka,1 (M-1) 1.1 (± 0.9) × 105
n 15.3 (± 0.4) n1 1.5 (± 0.8) R2 0.9930 Ka,2 (M-1) 5.5 (± 0.9) × 103
n2 14.7 (± 0.6) R2 0.9979
The results from the two-binding class model are significant in that: (1) the Ka,1
binding constant agrees better with the values reported in the literature for PFOA-serum
albumin binding, the majority of which range on the order of 104 to
105 M-1;23, 25, 26, 28, 41, 43 (2) the two binding class model is visually a better fit of the HSA-
PFOA binding isotherm data, and quantitatively, it has a higher R2 value of 0.9979; and
(3) the differences in the Ka,1 and Ka,2 values may provide clues about the mechanisms of
binding of PFOA to HSA.
As shown in Table 1, the literature values of the binding constants for PFOA-
serum albumin typically range from 104 to 105 M-1, 23, 25, 26, 28, 41, 43 and the Ka,1 binding
constant obtained from the two-binding class model (which is on the order of 105 M-1)
agrees with this range of literature values. This better agreement with the literature values
suggests that the two-binding class model is a more accurate representation of the HSA-
PFOA system. Furthermore, the better curve fit of the data in Figure 9 as well as its
higher R2 value further support the idea that the two-binding class model better represents

41
the HSA-PFOA system. Moreover, the smaller Ka value obtained when using the one-
binding class model reflects the fact that it is is a weighted average of the two binding
constants from the two-binding class model. In the two-binding class model, since there
are more binding sites (n2 ≈ 15 sites) associated with the weaker binding affinity (Ka,2),
the weaker affinity is more heavily weighted in the one-binding class model. This
explains why the one-binding class model Ka value is on the same order of magnitude of
Ka,2 from the two-binding class model.
Furthermore, the affinity differences between the Ka,1 and Ka,2 values obtained
from the two-binding class model may provide mechanistic information on HSA-PFOA
binding. According to the two-binding class model, there are approximately two high-
affinity binding sites, which are on the order of 105 M-1, for PFOA, as well as
approximately 15 lower-affinity sites for PFOA. Since physiologically-relevant
concentrations are those in which the PFOA:HSA mole ratio is low, then it is likely that
the high-affinity binding sites would be occupied under such conditions. Using the same
logic, the lower-affinity binding sites will be more likely to be occupied at a high
PFOA:HSA mole ratio, which is an unrealistic scenario. However, since HSA binds to a
variety of endogenous and exogenous ligands, including fatty acids,35, 38-40 then it is
possible that PFOA can bind to a lower-affinity binding site in HSA if the other binding
sites are occupied by other ligands at a low PFOA:HSA mole ratio. For this reason,
binding competitive experiments between PFAAs and fatty acids must be carried out in
order to gain insight into the mechanism of binding of PFAAs to HSA under
physiologically relevant conditions. Since there is only one binding site (n1) associated

42
with Ka,1, then the first molecule of PFOA to bind to HSA will bind with that affinity,
whereas subsequent PFOA molecules will bind with a lower affinity (Ka,2).
The data obtained in this study can be further examined via comparisons to
published reports that also analyzed the binding mechanism of certain PFAAs to HSA.
The first study utilized molecular modeling to investigate the binding thermodynamics
and binding sites of PFOA to HSA,55 while the second study provided and analyzed the
crystal structure of HSA with bound perfluorooctane sulfonate (PFOS).56
In the first study, Salvalaglio et al., 55 using computational methods, determined
that the maximum number of PFOA molecules that can bind to HSA was nine, and that
there were only five stable PFOA-HSA complexes. Of the five theoretically stable
complexes, only two complexes had a very large probability of stability: complexes J and
T. Complex J overlaps with fatty acid site 8, and is located in the core of the protein
between domains II and III of HSA, and is the most stable complex according to
Salvalaglio et al. In this complex, the fluorinated tail of PFOA exhibits van der Waals
interactions with Lys 199, Lys 195, Arg 218, Arg 222, and Trp 214. Furthermore,
electrostatic interactions between the carboxylate head group of PFOA and charged
residues are present and contribute to the overall stability of complex J. Complex T
coincides with fatty acid site 1, which is a favorable binding site for short chain fatty
acids. In this complex, the polar carboxylate head group of PFOA interacts with Arg 117
and Arg 186, while the nonpolar fluorinated tail of PFOA interacts with a network of
aromatic and nonpolar groups from Tyr 138, Tyr 161, Ile 142, His 146, Phe 149, Phe 157,
Leu 182, and Leu 185.55
43
The computational data from Salvalaglio et al. might be in agreement with our
observed data. Specifically, the high probability of two stable HSA-PFOA complexes J
and T, as shown by Salvalaglio et al., corresponds to our two-binding class model, in
which we have shown that there are approximately two higher-affinity PFOA binding
sites in HSA, compared to the fifteen lower-affinity sites, under physiological
concentrations. Thus, the computational results from Salvalaglio et al. and the data from
our study seem to suggest that there are two binding sites in HSA that exhibit favorable
and high-affinity interactions with PFOA, as well as some number of lower-affinity
binding sites.
In the second study, Luo et al.56 obtained a crystal structure of HSA with bound
PFOS. According to their crystal structure, there are two PFOS ligands bound to HSA,
with one bound to subdomain IIIA (which overlaps with fatty acid binding sites 3/4) and
the other ligand bound at the interface of subdomains IIA and IIB (which coincides with
fatty acid binding site 6). In general, the authors observed that the polar sulfonate head
group of PFOS interacts with hydrophilic amino acids in HSA, while the fluorinated tail
of PFOS interacts with adjacent hydrophobic residues. Moreover, the authors
successfully demonstrated that the HSA-PFOS complex is more compact than the
unliganded HSA structure, which contrasts with the conformational changes induced by
fatty acids in HSA, which exhibits a less compact structure.56 Although we cannot
directly compare our data with this study since we did not study the binding interactions
between PFOS and HSA or utilize X-ray crystallography, it is interesting to point out that
the crystal structure demonstrated that PFOS binds to HSA at a 2:1 mole ratio, while our
data demonstrated that there are two high-affinity binding sites in HSA for PFOA.

44
Altogether, the computational data by Salvalaglio et al., 55 the crystal structure
data by Luo et al.,56 and our data all suggest that PFOA binds to HSA at a 2:1 mole ratio
(at two high affinity binding sites). Although the data by Salvalaglio et al. is theoretical
and the results from Luo et al. involve a different method and ligand (albeit structurally
similar to PFOA), the results from these two studies correspond well to our data obtained
from equilibrium dialysis and LC-MS/MS. In addition, studies from Chen et al.,23
MacManus-Spencer et al.,26 and Messina et al.43 also obtained a binding constant of
105 M-1 for serum albumin-PFOA binding (see Table 1). Therefore, this excellent
agreement with published studies demonstrates that our equilibrium dialysis and LC-
MS/MS method is a valid way to measure binding constants, as well as the number of
binding sites, between HSA and PFAAs.
4. Conclusions
We have demonstrated that the use of an improved, higher-throughput
equilibrium dialysis method coupled with LC-MS/MS quantitation is a viable method to
determine binding constants between HSA and PFOA, which provided data that was
comparable to the literature. Using a two-binding class model, it was determined that
there are two higher-affinity binding sites in HSA for PFOA that would be more likely to
be occupied under physiological conditions. This result corresponded well with the
literature values,23, 26, 43 as well as to two mechanistic studies which demonstrated that
PFOA and PFOS bind to HSA at a 2:1 molar ratio.55, 56 In the future, a more complete
and deeper understanding of the binding mechanism of PFOA to HSA may be obtained
by acquiring a crystal structure of HSA with bound PFOA, in conjunction with more

45
binding experiments between other PFAAs and HSA achieved via equilibrium dialysis.
Furthermore, the equilibrium dialysis and LC-MS/MS methods that we developed in this
study can be applied to investigate the binding of PFAAs to HSA under varying solution
conditions (i.e., pH and ionic strength), the binding of PFAAs to other physiologically
relevant proteins, such as hemoglobin and myoglobin, to aid in the effort of furthering
our understanding of the toxicokinetics and bioaccumulation patterns of PFAAs in
humans.
5. Future Work
In this project, there are a plethora of areas in which the methods developed in
this study can be applied to further explore the binding mechanisms of PFFAs to proteins
and therefore their toxicokinetics in organisms, including:
• Investigating the binding of various PFAAs to HSA, especially those of shorter
chain lengths.
• Probing how solution conditions (including ionic strength and pH) influence the
binding of various PFAAs to HSA.
• Measuring the binding constants of various PFAAs to other physiologically
relevant proteins, including hemoglobin and myoglobin.
• Examining the competitive binding between PFAAs and fatty acids for HSA.
• Growing crystals of HSA (and of other proteins) with bound PFAAs to examine
conformational changes via X-ray crystallography.
• Studying the binding of PFAAs to HSA (and to other proteins) under controlled,
physiological temperatures.
46
In addition, the examination of crystal structures of HSA bound with PFAAs may
further elucidate the subtle conformational changes that occur upon binding, thereby
furthering our understanding of the binding mechanisms of PFAAs to HSA.
6. References
1. Schultz, M. M.; Barofsky, D. F.; Field, J. A. Fluorinated alkyl surfactants. Environ.
Eng. Sci. 2003, 20, 487-501.
2. Lau, C.; Anitole, K.; Hodes, C.; Lai, D.; Pfahles-Hutchens, A.; Seed, J. Perfluoroalkyl
acids: A review of monitoring and toxicological findings. Toxicol. Sci. 2007, 99, 366-
394.
3. Andersen, M. E.; Butenhoff, J. L.; Chang, S.; Farrar, D. G.; Kennedy, G. L.; Lau, C.;
Olsen, G. W.; Seed, J.; Wallace, K. B. Perfluoroalkyl acids and related chemistries -
toxicokinetics and modes of action. Toxicol. Sci. 2008, 102, 3-14.
4. Ritter, S. K. Fluorochemicals go short. Chem. Eng. News 2010, 88, 12-17.
5. Graham Solomons, T.W.; Fryhle, C.B. Organic Chemistry. 10th Ed; John Wiley &
Sons, Inc.: Hoboken, 2011. Page 462.
6. Rayne, S.; Forest, K. Theoretical studies on the pKa values of perfluoroalkyl
carboxylic acids. J. Mol. Struc.-THEOCHEM. 2010, 949, 60-69.
7. Cheng, J.; Psillakis, E; Hoffmann, M. R.; Colussi, A. J. Acid dissociation versus
molecular association of perfluoroalkyl oxoacids: Environmental implications. J.
Phys. Chem. A. 2009, 113, 8152–8156.

47
8. Olsen, G.; Ehresman, D.; Froehlich, J.; Burris, J.; Butenhoff, J. Evaluation of the half-
life (t1/2) of elimination of perfluorooctanesulfonate (PFOS),
perfluorohexanesulfonate (PFHS) and perfluorooctanoate (PFOA) from human
serum. FLUOROS. 2005, 18–20, 1. Available at:
http://www.chem.utoronto.ca/symposium/fluoros/pdfs/TOX017Olsen.pdf. Accessed
December 18, 2013.
9. Johnson, J. D.; Gibson, S. J.; Ober, R. E. Extent and route of excretion and tissue
distribution of total carbon-14 in rats after a single I.V. dose of FC-95-14C. 1979,
Riker Laboratories, Inc., St Paul, MN. US EPA Administrative Record, 8EHQ-1180-
00374.
10. Kemper, R. A. Perfluorooctanoic acid: Toxicokinetics in the rat. 2003, DuPont
Haskell Laboratories, Project No. DuPont–7473. US EPA Administrative Record,
AR-226-1499.
11. Lemal, D. M. Perspective on fluorocarbon chemistry. J. Org. Chem. 2004, 69, 1-11.
12. Houde, M.; Martin, J.; Letcher, R.; Solomon, K.; Muir, D. Biological monitoring of
polyfluoroalkyl substances: A review. Environ. Sci. Technol. 2006, 40, 3463-3473.
13. Shi, Y.; Wang, J.; Pan, Y.; Cai, Y. Tissue distribution of perfluorinated compounds in
farmed freshwater fish and human exposure by consumption. Environ. Toxicol.
Chem. 2012, 31, 717-723.
14. Taniyasu, S.; Kannan, K.; Horii, Y.; Hanari, N.; Yamashita, N. A survey of
perfluorooctane sulfonate and related perfluorinated organic compounds in water,
fish, birds, and humans from Japan. Environ. Sci. Technol. 2003, 37, 2634-2639.

48
15. Ankley, G.; Kuehl, D.; Kahl, M.; Jensen, K.; Linnum, A.; Leino, R.; Villeneuve, D.
Reproductive and developmental toxicity and bioconcentration of
perfluorooctanesulfonate in a partial life-cycle test with the fathead minnow
(Pimephales promelas). Environ. Toxicol. Chem. 2005, 24, 2316-2324.
16. Kelly, B. C.; Ikonomou, M. G.; Blair, J. D.; Surridge, B.; Hoover, D.; Grace, R.;
Gobas, F. A. P. C. Perfluoroalkyl contaminants in an Arctic marine food web:
Trophic magnification and wildlife exposure. Environ. Sci. Technol. 2009, 43, 4037-
4043.
17. Vanden Heuvel, J. P.; Kuslikis, B. I.; Van Rafelghem, M. J.; Peterson, R. E. Tissue
distribution, metabolism, and elimination of perfluorooctanoic acid in male and
female rats. J. Biochem. Toxicol. 1991, 6, 83-92.
18. Martin, J. W.; Mabury, S. A.; Solomon, K. R.; Muir, D. C. G. Dietary accumulation
of perfluorinated acids in juvenile rainbow trout (Oncorhynchus mykiss). Environ.
Toxicol. Chem. 2003, 22, 189-195.
19. Verreault, J.; Houde, M.; Gabrielsen, G. W.; Berger, U.; Haukås, M.; Letcher, R. J.;
Muir, D. C. G. Perfluorinated alkyl substances in plasma, liver, brain, and eggs of
glaucous gulls (Larus hyperboreus) from the Norwegian Arctic. Environ. Sci.
Technol. 2005, 39, 7439-7445.
20. Ahrens, L.; Siebert, U.; Ebinghaus, R. Total body burden and tissue distribution of
polyfluorinated compounds in harbor seals (Phoca vitulina) from the German Bight.
Mar. Pollut. Bull. 2009, 58, 520-525.

49
21. Yoo, H.; Guruge, K. S.; Yamanaka, N.; Sato, C.; Mikami, O.; Miyazaki, S.;
Yamashita, N.; Giesy, J. P. Depuration kinetics and tissue disposition of PFOA and
PFOS in white leghorn chickens (Gallus gallus) administered by subcutaneous
implantation. Ecotox. Environ. Safe. 2009, 72, 26-36.
22. Vestergren, R.; Cousins, I. T. Tracking the pathways of human exposure to
perfluorocarboxylates. Environ. Sci. Technol. 2009, 43, 5565-5575.
23. Chen, Y.; Guo, L. Fluorescence study on site-specific binding of perfluoroalkyl acids
to human serum albumin. Arch. Toxicol. 2009, 83, 255-261.
24. Bischel, H. N.; MacManus-Spencer, L. A.; Luthy, R. G. Noncovalent interactions of
long-chain perfluoroalkyl acids with serum albumin. Environ. Sci. Technol. 2010, 44,
5263-5269.
25. Hebert, P. C.; MacManus-Spencer, L. A. Development of a fluorescence model for
the binding of medium- to long-chain perfluoroalkyl acids to human serum albumin
through a mechanistic evaluation of spectroscopic evidence. Anal. Chem. 2010, 82,
6463-6471.
26. MacManus-Spencer, L. A.; Tse, M. L.; Hebert, P. C.; Bischel, H. N.; Luthy, R. G.
Binding of perfluorocarboxylates to serum albumin: A comparison of analytical
methods. Anal. Chem. 2010, 82, 974-981.
27. Bischel, H. N.; MacManus-Spencer, L. A.; Zhang, C.; Luthy, R. G. Strong
associations of short-chain perfluoroalkyl acids with serum albumin and investigation
of binding mechanisms. Environ. Toxicol. Chem. 2011, 30, 2423-2430.

50
28. O’Connor, M. P.; MacManus-Spencer, L. A. Investigation of the mechanism of
binding of medium- and long-chain perfluoroalkyl acids to human serum albumin
using fluorescence spectroscopy. In preparation.
29. Han, X.; Yang, C.-H.; Snajdr, S. I.; Nabb, D. L.; Mingoia, R. T. Uptake of
perfluorooctanoate in freshly isolated hepatocytes from male and female rats. Toxicol.
Lett. 2008, 181, 81-86.
30. Yang, C.-H.; Glover, K. P.; Han, X. Characterization of cellular uptake of
perfluorooctanoate via organic anion-transporting polypeptide 1A2, organic anion
transporter 4, and urate transporter 1 for their potential roles in mediating human
renal reabsorption of perfluorocarboxylates. Toxicol. Sci. 2010, 117, 294-302.
31. Luebker, D. J.; Hansen, K. J.; Bass, N. M.; Butenhoff, J. L.; Seacat, A. M.
Interactions of fluorochemicals with rat liver fatty acid binding protein. Toxicology
2002, 176, 175-185.
32. Weisiger, R. A. Mechanisms of intracellular fatty acid transport: Role of cytoplasmic-
binding proteins. J. Mol. Neurosci. 2007, 33, 42-44.
33. Hickey, N. J.; Crump, D.; Jones, S. P.; Kennedy, S. W. Effects of 18 perfluoroalkyl
compounds on mRNA expression in chicken embryo hepatocyte cultures. Toxicol.
Sci. 2009, 111, 311-320.
34. Carter, D. C. and Ho, J. X. Structure of serum albumin. Adv. Protein Chem. 1994, 45,
153-203.
35. Putnam, F. W. The Plasma Proteins. 2nd Ed; Academic Press, Inc: Orlando, 1984.

51
36. Brown, J. R. Structural origins of mammalian albumin. Fed. Proc. 1976, 35, 2141-
2144.
37. Sugio, S.; Kashima, A.; Mochizuki, S.; Noda, M.; Kobayashi, K. Crystal structure of
human serum albumin at 2.5 Å resolution. Protein Eng. 1999, 12, 439-446.
38. Fehske, K. J.; Muller, W. E.; Wollert, U. The location of drug binding sites in human
serum albumin. Biochem. Pharmacol. 1981, 30, 687-692.
39. Kragh-Hansen, U. Molecular aspects of ligand binding to serum albumin. Pharmacol.
Rev. 1981, 33, 17-53.
40. Peters, T. Serum albumin. Adv. Protein Chem. 1985, 37, 161-245.
41. Wu, L.; Gao, H.; Gao, N.; Chen, F.; Chen, L. Interaction of perfluorooctanoic acid
with human serum albumin. BMC Struct. Biol. 2009, 9, 31.
42. Han, X.; Snow, T. A.; Kemper, R. A.; Jepson, G. W. Binding of perfluorooctanoic
acid to rat and human plasma proteins. Chem. Res. Toxicol. 2003, 16, 775-781.
43. Messina, P.; Prieto, G.; Dodero, V.; Ruso, J. M.; Schulz, P.; Sarmiento, F.
Ultraviolet-circular dichroism spectroscopy and potentiometric study of the
interaction between human serum albumin and sodium perfluorooctanoate.
Biopolymers 2005, 79, 300-309.
44. Voet, D.; Voet, J. G.; Pratt, C. W. Fundamentals of Biochemistry: Life at the
Molecular Level. 4th Ed. John Wiley & Sons, Inc.: Hoboken, 2013.

52
45. Foy, B.; Frazier, J. Incorporation of protein-binding kinetics and carrier-mediated
membrane transport into a model of chemical kinetics in the isolated perfused rat
liver. Toxicol. Mech. Methods 2003, 13, 53-75.
46. Robinson, P.; Rapoport, S. Kinetics of protein-binding determine rates of uptake of
drugs by brain. Am. J. Physiol. 1986, 251, R1212-R1220.
47. Sebille, B.; Zini, R; Madjar, C. V.; Thuaud, N.; Tillement, J. P. Separation procedures
used to reveal and follow drug-protein binding. J Chromatogr. 1990, 12, 51-77.
48. Sebille, B. Methods of drug protein binding determinations. Fundam Clin Pharmacol.
1990, 4, Suppl 2, 151s-161s.
49. Guide to Equilibrium Dialysis, Harvard Apparatus, 2-9.
50. Kuriyan, J.; Konforti, B.; Wemmer, D. The Molecules of Life. 1st Ed. Garland
Science: New York, 2012.
51. Harris, D.C. Quantitative Chemical Analysis. 8th Ed. W. H. Freeman and Company:
New York, 2010.
52. Grebe, S. K.; Singh, R. J. LC-MS/MS in the clinical laboratory - where to from here?
Clin Biochem Rev. 2011, 32, 5-31.
53. Last, R.; Jones, D. A.; Shachar-Hill, Y. Towards the plant metabolome and beyond.
Nature 2007, 8, 167-174.

53
54. Sabin, J.; Prieto, G.; Gonzalez-Perez, A.; Ruso, J. M.; Sarmiento, F. Effects of
fluorinated and hydrogenated surfactants on human serum albumin at different pHs.
Biomacromolecules 2006, 7, 176-182.
55. Salvalaglio, M.; Muscionico, I.; Cavallotti, C. Determination of Energies and Sites of
Binding of PFOA and PFOS to Human Serum Albumin. J. Phys. Chem. B 2010, 114,
14860–14874.
56. Luo, Z.; Shi, X.; Hu, Q.; Zhao, B.; Huang, M. Structural Evidence of Perfluorooctane
Sulfonate Transport by Human Serum Albumin. Chem. Res. Toxicol., 2012, 25, 990–
992.
7. Appendix
Figure 16. The MRM chromatogram of the 417 → 372 m/z transition of 10 nM
[13C4]-PFOA obtained from method 1. [13C4]-PFOA has a retention time of 4.569 min, a
peak area of 2,482 counts•min, and a signal-to-noise ratio (SNR) of 143.2.

54
Figure 17. The MRM chromatogram of the 413 → 369 m/z transition of 6 µM PFOA
obtained from method 1. PFOA has a retention time of 4.569 min, a peak area of
8.82 × 10⁵ counts•min, and a signal-to-noise ratio (SNR) of 1,292.
Figure 18. The MRM chromatogram of the 413 → 219 m/z transition of 6 µM PFOA
obtained from method 1. PFOA has a retention time of 4.561 min, a peak area of
1.04 × 10⁵ counts•min, and a signal-to-noise ratio (SNR) of 775.2.
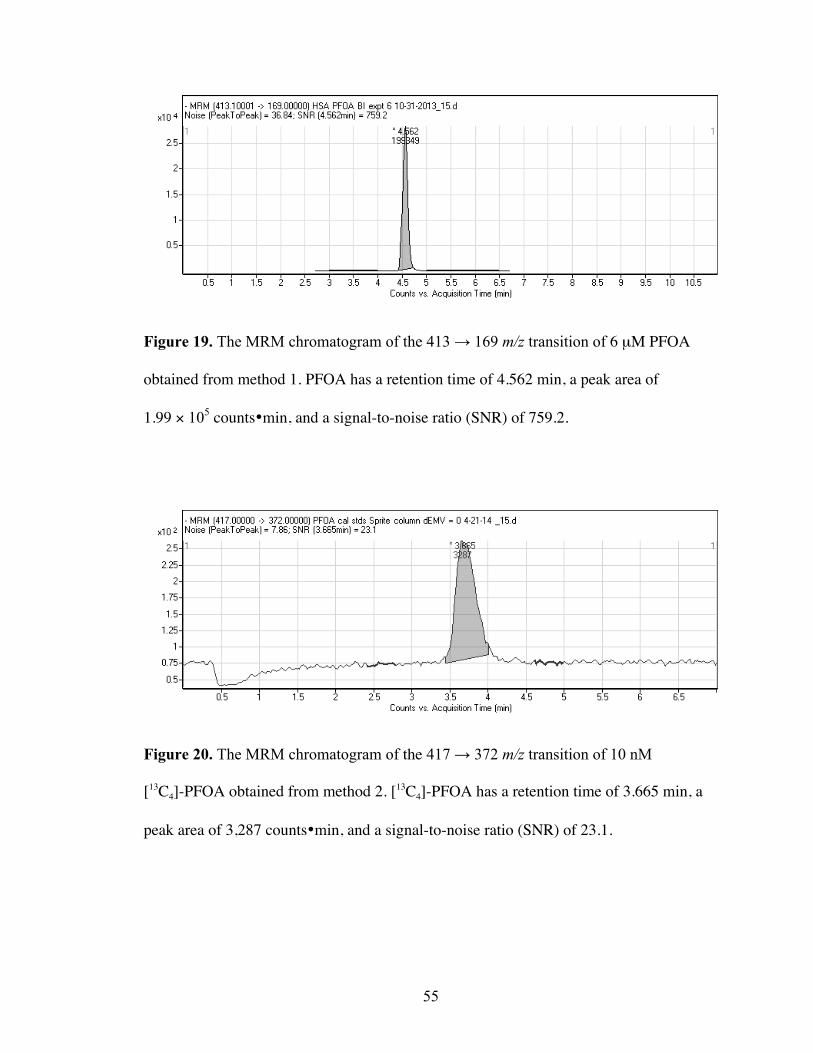
55
Figure 19. The MRM chromatogram of the 413 → 169 m/z transition of 6 µM PFOA
obtained from method 1. PFOA has a retention time of 4.562 min, a peak area of
1.99 × 10⁵ counts•min, and a signal-to-noise ratio (SNR) of 759.2.
Figure 20. The MRM chromatogram of the 417 → 372 m/z transition of 10 nM
[13C4]-PFOA obtained from method 2. [13C4]-PFOA has a retention time of 3.665 min, a
peak area of 3,287 counts•min, and a signal-to-noise ratio (SNR) of 23.1.

56
Figure 21 The MRM chromatogram of the 413 → 369 m/z transition of 6 µM PFOA
obtained from method 2. PFOA has a retention time of 3.669 min, a peak area of
3.09 × 10⁶ counts•min, and a signal-to-noise ratio (SNR) of 425.2.
Figure 22. The MRM chromatogram of the 413 → 219 m/z transition of 6 µM PFOA
obtained from method 2. PFOA has a retention time of 3.669 min, a peak area of
2.50 × 10⁵ counts•min, and a signal-to-noise ratio (SNR) of 340.2.

57
Figure 23. The MRM chromatogram of the 413 → 169 m/z transition of 6 µM PFOA
obtained from method 2. PFOA has a retention time of 3.686 min, a peak area of
9.26 × 10⁵ counts•min, and a signal-to-noise ratio (SNR) of 385.6.
Figure 24. The MRM chromatogram of the 413 → 119 m/z transition of 6 µM PFOA
obtained from method 2. PFOA has a retention time of 3.669 min, a peak area of
3.53 × 10⁴ counts•min, and a signal-to-noise ratio (SNR) of 327.3.

58
Figure 25. The MRM chromatogram of the 417 → 372 m/z transition of 10 nM
[13C4]-PFOA obtained from method 3. [13C4]-PFOA has a retention time of 3.105 min, a
peak area of 1.39 × 10⁴ counts•min, and a signal-to-noise ratio (SNR) of 14.3.
Figure 26. The MRM chromatogram of the 413 → 369 m/z transition of 6 µM PFOA
obtained from method 3. PFOA has a retention time of 3.109 min, a peak area of
1.48 × 10⁷ counts•min, and a signal-to-noise ratio (SNR) of 617.3.

59
Figure 27. The MRM chromatogram of the 413 → 219 m/z transition of 6 µM PFOA
obtained from method 3. PFOA has a retention time of 3.092 min, a peak area of
1.14 × 10⁶ counts•min, and a signal-to-noise ratio (SNR) of 447.2.
Figure 28. The MRM chromatogram of the 413 → 169 m/z transition of 6 µM PFOA
obtained from method 3. PFOA has a retention time of 3.092 min, a peak area of
4.21 × 10⁶ counts•min, and a signal-to-noise ratio (SNR) of 694.4.

60
Figure 29. The MRM chromatogram of the 413 → 119 m/z transition of 6 µM PFOA
obtained from method 3. PFOA has a retention time of 3.092 min, a peak area of
1.40 × 10⁵ counts•min, and a signal-to-noise ratio (SNR) of 350.3.