Investigation of the human tear film proteome using multiple proteomic approaches · 2008-03-07 ·...
15
Investigation of the human tear film proteome using multiple proteomic approaches Kari B. Green-Church, 1 Kelly K. Nichols, 2 Nan M. Kleinholz, 1 Liwen Zhang, 1 Jason J. Nichols 2 1 Mass Spectrometry and Proteomics Facility; 2 College of Optometry, The Ohio State University, Columbus, OH Purpose: The purpose of this work was to examine the tear film proteome using a combination of one-dimensional (1D) and two dimensional (2D) gel electrophoresis and mass spectrometry-based techniques and to explore the effect of the tear collection methods on the tear proteome. Methods: Tear samples from eight normal non-contact lens wearing human subjects collected by Drummond glass microcapillary and Schirmer strips were subjected to 1D-sodium dodecyl sulfate polyacrylamide gel electrophoresis (SDS–PAGE), 2D-SDS–PAGE, and 2D LC-MS/MS (Multidimensional protein identification technology - MudPIT). Bands or cores from the 1D- and 2D-SDS–PAGE were cut, digested with trypsin, and analyzed by tandem mass spectrometry for identification by the generation of sequence tags. Results: In total (across sampling and proteomic methods), 97 unique proteins were observed, and a significant number of the spots/bands in the PAGE were from posttranslational modifications. Fifty-four unique proteins were identified from proteins extracted from the Schirmer strips in comparison to 13 unique proteins identified from capillary tubes, and 30 unique proteins were identified by both collection methods. Secreted (serum) proteins were predominantly observed from tears collected by capillary whereas a combination of cellular and serum proteins were identified from tear film collected by Schirmer strips. Conclusions: Overall, these results suggest that the tear film collection and the proteomic method impacts the proteins present in the tear film and that care should be exercised in choosing a tear collection method to best correlate to the experiment being conducted or the hypothesis that is being tested. According to the annotated protein sequence derived from genome sequences, approximately 400,000 proteins have the potential to be expressed in the human alone. Many of these proteins are associated with normal human function and disease states [1]. Mass spectrometry (MS)-based proteomics possesses tremendous capabilities in the study of the entire differential output of proteins given the availability of genome sequence databases [1,2]. It also has several advantages over traditional methods such as chromatographic methods, electrophoretic methods, Edman degradation, immunological methods, and surface-enhanced laser desorption and ionization (SELDI). While SELDI, chromatographic, and gel-based methods alone can track the appearance, disappearance, or molecular weight shifts of proteins, they cannot identify proteins or measure the molecular weight (MW) of proteins with appreciable accuracy [3,4]. In addition, Edman degradation requires a large amount of sample and is ineffective on NH2-terminal blocked proteins [3,4]. ELISA and western blots can be somewhat presumptive relative to protein identification as they require the availability of a suitable and specific antibody. Further, SELDI-based methods are limited to low molecular weight proteins, typically less than 20 kDa. As such, these types of methods Correspondence to: Kari B. Green-Church, Ph.D., The Ohio State University, 460 W 12 th Ave, Columbus, OH, 43210; Phone: (614) 688-0581; FAX: (614) 292-5955; email: [email protected] are more appropriate for screening samples after the species have been established via MS-based proteomics. The benefits of MS-based methods are numerous with routine sensitivity in the nanogram-picogram range, rapid speed of analysis, the ability to precisely and accurately determine protein identity, the ability to characterize modifications, and the ability to analyze protein expression levels [1,2]. This is true as MS allows for simultaneous accurate mass measures in addition to the determination of structural properties of molecules via tandem MS. Using traditional electrophoretic, liquid chromatographic, or new chromatographic methods such as multi-dimensional protein identification technology (MudPIT) [5,6] in conjunction with MS for protein identification provides the most complete view of a proteome distribution relative to charge (pI), molecular weight (MW), abundance, and interactions (i.e., protein–protein complex). The current understanding of tear film proteomics, including differences in sampling techniques as well as a fundamental understanding of the core tear proteome, is limited in the literature. There is disagreement in the literature regarding the number of proteins in the tear film and the functions of the individual proteins. Some of these functions are thought to be protective relative to aiding in the ocular surface defense system (i.e., antimicrobial or inflammatory- related), related to ocular surface wound healing, or stability- promoting through interaction with other ligands (i.e., lipid- binding proteins). The up- or downregulation of these proteins Molecular Vision 2008; 14:456-470 <http://www.molvis.org/molvis/v14/a55> Received 24 October 2007 | Accepted 27 February 2008 | Published 7 March 2008 © 2008 Molecular Vision 456
Transcript of Investigation of the human tear film proteome using multiple proteomic approaches · 2008-03-07 ·...

Investigation of the human tear film proteome using multipleproteomic approaches
Kari B. Green-Church,1 Kelly K. Nichols,2 Nan M. Kleinholz,1 Liwen Zhang,1 Jason J. Nichols2
1Mass Spectrometry and Proteomics Facility; 2College of Optometry, The Ohio State University, Columbus, OH
Purpose: The purpose of this work was to examine the tear film proteome using a combination of one-dimensional (1D)and two dimensional (2D) gel electrophoresis and mass spectrometry-based techniques and to explore the effect of thetear collection methods on the tear proteome.Methods: Tear samples from eight normal non-contact lens wearing human subjects collected by Drummond glassmicrocapillary and Schirmer strips were subjected to 1D-sodium dodecyl sulfate polyacrylamide gel electrophoresis(SDS–PAGE), 2D-SDS–PAGE, and 2D LC-MS/MS (Multidimensional protein identification technology - MudPIT).Bands or cores from the 1D- and 2D-SDS–PAGE were cut, digested with trypsin, and analyzed by tandem massspectrometry for identification by the generation of sequence tags.Results: In total (across sampling and proteomic methods), 97 unique proteins were observed, and a significant numberof the spots/bands in the PAGE were from posttranslational modifications. Fifty-four unique proteins were identified fromproteins extracted from the Schirmer strips in comparison to 13 unique proteins identified from capillary tubes, and 30unique proteins were identified by both collection methods. Secreted (serum) proteins were predominantly observed fromtears collected by capillary whereas a combination of cellular and serum proteins were identified from tear film collectedby Schirmer strips.Conclusions: Overall, these results suggest that the tear film collection and the proteomic method impacts the proteinspresent in the tear film and that care should be exercised in choosing a tear collection method to best correlate to theexperiment being conducted or the hypothesis that is being tested.
According to the annotated protein sequence derivedfrom genome sequences, approximately 400,000 proteinshave the potential to be expressed in the human alone. Manyof these proteins are associated with normal human functionand disease states [1]. Mass spectrometry (MS)-basedproteomics possesses tremendous capabilities in the study ofthe entire differential output of proteins given the availabilityof genome sequence databases [1,2]. It also has severaladvantages over traditional methods such as chromatographicmethods, electrophoretic methods, Edman degradation,immunological methods, and surface-enhanced laserdesorption and ionization (SELDI). While SELDI,chromatographic, and gel-based methods alone can track theappearance, disappearance, or molecular weight shifts ofproteins, they cannot identify proteins or measure themolecular weight (MW) of proteins with appreciable accuracy[3,4]. In addition, Edman degradation requires a large amountof sample and is ineffective on NH2-terminal blocked proteins[3,4]. ELISA and western blots can be somewhat presumptiverelative to protein identification as they require the availabilityof a suitable and specific antibody. Further, SELDI-basedmethods are limited to low molecular weight proteins,typically less than 20 kDa. As such, these types of methods
Correspondence to: Kari B. Green-Church, Ph.D., The Ohio StateUniversity, 460 W 12th Ave, Columbus, OH, 43210; Phone: (614)688-0581; FAX: (614) 292-5955; email: [email protected]
are more appropriate for screening samples after the specieshave been established via MS-based proteomics. The benefitsof MS-based methods are numerous with routine sensitivityin the nanogram-picogram range, rapid speed of analysis, theability to precisely and accurately determine protein identity,the ability to characterize modifications, and the ability toanalyze protein expression levels [1,2]. This is true as MSallows for simultaneous accurate mass measures in additionto the determination of structural properties of molecules viatandem MS. Using traditional electrophoretic, liquidchromatographic, or new chromatographic methods such asmulti-dimensional protein identification technology(MudPIT) [5,6] in conjunction with MS for proteinidentification provides the most complete view of a proteomedistribution relative to charge (pI), molecular weight (MW),abundance, and interactions (i.e., protein–protein complex).
The current understanding of tear film proteomics,including differences in sampling techniques as well as afundamental understanding of the core tear proteome, islimited in the literature. There is disagreement in the literatureregarding the number of proteins in the tear film and thefunctions of the individual proteins. Some of these functionsare thought to be protective relative to aiding in the ocularsurface defense system (i.e., antimicrobial or inflammatory-related), related to ocular surface wound healing, or stability-promoting through interaction with other ligands (i.e., lipid-binding proteins). The up- or downregulation of these proteins
Molecular Vision 2008; 14:456-470 <http://www.molvis.org/molvis/v14/a55>Received 24 October 2007 | Accepted 27 February 2008 | Published 7 March 2008
© 2008 Molecular Vision
456

may be indicative of disease mechanisms (i.e., dry eyedisease). Tear film protein profiles have historically beencharacterized using gel electrophoresis and Edmandegradation in which both have shown the major constituentsto include lysozyme, lactoferrin, von Ebner’s gland protein(e.g., lipocalin and tear specific prealbumin), transferrin,serum albumin, secretory IgA, and lipophilin [7-12]. Usingthese methods, it was been estimated that 70%–85% of thetotal secretory protein can be accounted for by lipocalin,lysozyme, and lactoferrin [7,13]. However, many proteins gounidentified using these methods because they are either notdetected (e.g., due to masking by high abundant proteins orlow sensitivity), not separated within bands, or are NH2-terminally blocked and are identified by molecular weight andpI only. Sensitive immunoassay-based methods haveidentified other proteins to be present in the tear film ofmammals including phospholipid transfer protein [14],growth factors [15-19], neurotrophic factors [20], cytokines[17,21-29], cell adhesion molecules [30], matrixmetalloproteinases [25,31-33], bradykinins [34], tachykinins(e.g., substance P) [35,36], fibronectin [37], plasminogenactivator [38], defensins, aquaporins [39], phospholipase[40], immunoglobulins [41], lactate dehydrogenase [42], andinsulin [18]. Immunoassay-based methods can be superiorwhen studying a specific or individual protein whereas massspectrometry-based proteomics can examine thousands ofproteins without the need for antibodies. Discoveries made bymass spectrometric methods can then be closely examinedusing immunoassay techniques for validation and clinicalstudies.
Although matrix-assisted laser desorption ionization(MALDI) time-of-flight (TOF) MS had been used tocharacterize low molecular weight protein masses [43], it wasnot until more recently that it and electrospray ionization (ESI)MS/MS were used to identify some novel species in the tears[12,13,44,45]. The list of proteins found associated with thetear film continues to grow, and one recent study reported“approximately 500 proteins were detected andunambiguously identified by LC/MS/MS” [46], although theprotein identities were not provided by the authors. Morerecent MS-based methods have started to reveal other uniqueproteins in the tear film. De Souza and coworkers [6] recentlypublished the identification of 491 proteins from the tear filmusing a hybrid linear trap, Fourier Transform (LTQ-FT), anda linear ion trap, orbitrap (LTQ-Orbitrap). Recently, Ham etal. [47] used MALDI-TOF to examine proteins from normaland dry eye model rabbits. Similarly, Zhou et al. [12] analyzedrabbit tears using HPLC and electrospray ionization.However, while many proteins are commonly observed acrossthese MS-based studies (i.e., lysozyme, lactoferrin, lipocalin,etc), many proteins appear to be unique to the study and maybe associated with specific methodologies. Thus, the aims ofthis work were to examine the tear film proteome using acombination of one-dimensional (1D) and two-dimensional
(2D) gel electrophoresis and mass spectrometry-basedproteomics and to evaluate the differences in collectiontechniques on the measured tear proteome.
METHODSFigure 1 is a work flow diagram of the experiments performedin this study. Generally, proteomic work flow includes proteinpurification to remove salts, lipids, and non-proteinsubstances from the biofluid followed by protein separation(chromatography), mass spectrometry analysis, and finally,bioinformatics. The methods chosen here include proteinprecipitation to remove the non-protein substances from thesamples, 1D or 2D SDS–PAGE for protein separation, and in-gel digestion of individual protein spots or bands with trypsinto produce small peptides for analysis on nano-LC-MS/MSfor protein identification. The exception is themultidimensional protein identification technology (MudPIT)where proteins precipitated from tears or Schirmer strips werenot separated with SDS–PAGE and instead the entire proteinmixture is digested with trypsin and analyzed with 2D-LC-MS/MS.
Tear sampling: Eight subjects were seen on multipleoccasions for tear film sampling (average=8 visits, range 3–18 visits). The average age (± SD) of the patients was 35 ± 13years (range 24–55 years). Six of the eight subjects werefemale (75%), and seven of the eight (88%) were Caucasian(one was African-American). All participants were normalwith no ocular disease, using no current eye medications, andnone had eye-related symptoms (by patient report).
Tears were collected using small volume (1–5 µl)Drummond glass microcapillary tubes under 16X slit-lampmagnification. Non-reflex tears were collected from theinferior tear prism without contact with the lower lid until atotal of 5 µl had been collected. During a separate visit, tearcollection was performed by placing a Schirmer strip over thelower lid. The lid was not anesthetized and the strip was placedapproximately 6 mm from the lateral canthus. The subject wasinstructed to close his/her eyes for the 5 min test duration, thewet length was not recorded but was observed to be withinnormal ranges in all cases. The strip was then placed in a 1.6 mlamber Eppendorf tube at 4 °C until analysis. Gloves wereworn by the examiner for both collection methods and by allinvestigators handling any tear film samples.
Protein sample preparation and quantitation: Tearproteins collected by the capillary method were pooled fromdifferent patients and precipitated using acetone. The numberof samples pooled for each individual experiment wasdependent on the protein amount required and ranged from 3to 16 pooled samples. Briefly, acetone was added at −20 °Cat a volume four times that of the sample to be precipitated.The tube was vortexed and incubated for 60 min at −20 °C.The proteins were pelleted by centrifuging for 10 min at13,000 xg. The acetone was removed leaving the protein pellet
Molecular Vision 2008; 14:456-470 <http://www.molvis.org/molvis/v14/a55> © 2008 Molecular Vision
457

Figure 2. 1D-SDS–PAGE of coomassie stained proteins. Lane 1 isthe molecular weight marker. Lane 2 is 20 μg of total protein thatwas precipitated from tear film collected by capillary. Lane 3 is 20μg of total protein that was precipitated from tear film collected bySchirmer strip. The observed bands are labeled 1−11.
in the tube. Proteins collected by the Schirmer strip methodwere extracted by incubating the Schirmer strips inapproximately 100 μl of 100 mM ammonium bicarbonate atroom temperature for 1 h and then precipitating the solutionas described above. Precipitated proteins were resuspended ina solubilization buffer (8 M Urea, 0.5% CHAPS) or in purewater. Proteins were quantitated by Bradford assay [48] usingCoomassie plus protein assay reagent (Pierce, Rockford, IL)and BSA as a protein standard. The larger amounts of proteinrecovered from the Schirmer strip method sometimes madepooling unnecessary, although protein extracts from fourSchirmer strips were typically pooled together for eachexperiment.
1D SDS–PAGE: Protein samples were mixed with SDS–PAGE loading buffer containing β-mercaptoethanol, heatedto 95 °C for 5 min, and subjected to SDS–PAGE analysis usingthe Mini-Protean-III module (Bio-Rad, Hercules, CA).
Figure 1. Work flow of the methods used in this manuscript. Tears were collected by capillary or Schirmer strips. The proteins were extractedusing acetone precipitation and then were subject to either 1D-SDS–PAGE or 2D-SDS–PAGE or were directly digested into peptides withtrypsin.
Molecular Vision 2008; 14:456-470 <http://www.molvis.org/molvis/v14/a55> © 2008 Molecular Vision
458

Gradient gels (4%–15% acrylamide) were pre-cast (Bio-Rad),and homogenous gels (10% and 18% acrylamide) were castin-laboratory. Gels were fixed and stained with eitherCoomassie brilliant blue (Bio-Rad) or SyproRuby(Invitrogen, Carlsbad, CA) according to the manufacturer’sprotocol. The gels were then imaged with a Typhoon 9400variable mode scanner (GE Healthcare, Piscataway, NJ).ImageJ software (Rasband, W.S., ImageJ, USA NationalInstitutes of Health, Bethesda, Maryland, 1997–2006) wasused to examine lane profiles.
2D-SDS–PAGE mini gels: Protein samples (15 μg pergel) were diluted to 125 μl in a rehydration buffer (8 M urea,0.5% CHAPS, 2.6 mg/ml dithiothreitol, 0.002% bromophenolblue, 0.5% pH 3–10 immobilized pH gradient (IPG) buffer;GE Healthcare, Piscataway NJ). Isoelectric focusing stripswere focused on an IPGphor-II (GE Healthcare) with a fourstep IEF: the voltage was held at 300 V for 30 min, a gradientto 1000 V was applied for 30 min, a gradient to 5000 V wasapplied for 80 min, and lastly the 5000 V was held forapproximately held for 15 min, and IEF strips wereimmediately used for SDS–PAGE. IEF strips wereequilibrated with 5 ml of equilibration buffer 1 (6 M urea, 2%SDS, 29.3% glycerol, 0.002% bromophenol blue, 2.6 mg/mldithiothreitol) for 15 min. IEF strips were then equilibrated in
EQ buffer 2 (6 M urea, 2% SDS, 29.3% glycerol, 0.002%bromophenol blue, 6.5 mg/ml iodoacetamide) for 15 min. IEFstrips were run on 16% acrylamide SDS–PAGE gels asdescribed above.
In-gel digestion: Protein spots were excised from the gelusing a scalpel or a gel slicer. Trypsin was used to cut theprotein into peptides by cleaving arginine and lysine residuesto produce a searchable pattern of peptides. Individual bandsor spots were digested with sequencing grade trypsin fromPromega (Madison, WI) using the Montage In-Gel DigestionKit from Millipore (Bedford, MA) following themanufacturers’ recommended protocols. The gels werewashed in 50% methanol/5% acetic acid for 1–2 h. The gelbands were dried with acetonitrile and reconstituted withdithiothreitol (DTT) solution at 37 °C for 1 h to reducecysteines. Iodoacetamide was added and incubated for 1 h atroom temperature in the dark to alkylate cysteines. Trypsinwas added and digested at room temperature overnight. Theresulting peptides were extracted from the polyacrylamide gelwith 50% acetonitrile and 5% formic acid several times andpooled together and concentrated in a speed vacuum toapproximately 25 μl.
Capillary-liquid chromatography nanospray tandemmass spectrometry: Capillary-liquid chromatography
TABLE 1. PROTEINS IDENTIFIED BY LC-MS/MS ON A LINEAR ION TRAP FROM TEAR FILM AND ANALYZED BY 1D-SDS–PAGE.
Identification from Schirmer strip extracted proteins inband 4
Mowse score Number ofpeptides
% sequencecoverage
gi|187122 Lactoferrin 5797 44 66gi|13325287 Enolase 1 1931 25 68gi|23241675 Serum Albumin 1098 23 45gi|38026 Zn-alpha2-glycoprotein 1026 18 51gi|37046835 Proline rich 4 575 2 16gi|2183299 Aldehyde dehydrogenase 1 435 10 25gi|27270813 IGHM protein 407 11 34gi|113584 Ig alpha-1 386 7 33gi|16306550 selenium binding protein 361 11 32gi|306882 Haptoglobin 174 7 17Identification from capillary collected proteins in band 4 Mowse score Number of
peptides% sequencecoverage
gi|187122 Lactoferrin 4954 45 70gi|113584 Ig alpha-1 611 11 51gi|38026 Zn-alpha2-glycoprotein 591 13 52gi|4504963 Lipocalin 1 186 5 28gi|31377806 Poly Ig Receptor 143 5 7gi|623409 Keratin 10 117 2 3gi|47132620 Keratin 2 80 2 3Tear film proteins were collected by Schirmer strip or by capillary. The chromatography bands are those associated with Figure1.
Molecular Vision 2008; 14:456-470 <http://www.molvis.org/molvis/v14/a55> © 2008 Molecular Vision
459

nanospray tandem mass spectrometry (nano-LC/MS/MS) wasperformed on a Thermo Finnigan LTQ mass spectrometer.The LC system was an UltiMate™ Plus system from LC-Packings A Dionex Co. with a Famos autosampler andSwitchos column switcher (Sunnyvale, CA). Solvent A was50 mM acetic acid in water, and the solvent B was acetonitrile.Each sample (5 μl; tryptic peptides from the in-gel or solutionenzymatic digestion) was injected on to the trapping column(LC-Packings A Dionex Co., Sunnyvale, CA) and washedwith solvent A then loaded to a 5 cm 75 μm i.d. ProteoPep IIC18 column (New Objective Inc., Woburn, MA) packeddirectly in the nanospray tip. Peptides were eluted directly offthe column into the LTQ system using a gradient of 2%–80%B over 30 min with a flow rate of 300 nl/min. The scansequence of the mass spectrometer was based on theTopTen™ method; a full scan is acquired and a subsequentMS/MS scan is acquired in consecutive instrument scans of
the 10 most abundant peaks in the spectrum. Dynamicexclusion was used to exclude multiple MS/MS of the samepeptide.
Bioinformatics: Sequence information from the MS/MSdata was processed by converting the raw data files into amerged file (.mgf) using MGF creator (merge.pl, a Perl script).The resulting .mgf files were searched using Mascot Daemonby Matrix Science (Boston, MA). Data processing wasperformed following published proteomic guidelines [49].The mass accuracy of the precursor ions was set to 2.0 Da,and the fragment mass accuracy was set to 0.5 Da. Consideredmodifications (variable) were methionine oxidation andcysteine carbamidomethylation. Protein identifications werechecked manually. The Mowse (molecular weight search)score [50] is a probability-based scoring algorithm for peptidematching and protein identification, and only Mowse scoresof 80 or higher were accepted with a minimum of two unique
Figure 3. 10% 1D-SDS–PAGE of coomassie stained proteins optimized for higher molecular weight proteins. The gel band intensities wereprofiled and the region with observable differences was identified.
Molecular Vision 2008; 14:456-470 <http://www.molvis.org/molvis/v14/a55> © 2008 Molecular Vision
460

peptides from one protein having a -b or -y ion sequence tagof five residues or better.
Protein classifications were determined using ProteinANalysis THrough Evolutionary Relationships (PANTHER),the classification of genes and proteins. PANTHER classifiesgenes by their functions and categorizes them by molecularfunction and biologic purposes. The protein function andlocation were determined from the Human Protein ReferenceDatabase.
MudPIT: Ammonium sulfate (70%) was used tofractionate the tear samples with the intent to detect the lowerabundant proteins in the samples. Four samples wereexamined by MudPIT: (1) Capillary-collected, ammoniumsulfate precipitation; (2) Capillary-collected, ammoniumsulfate supernatant; (3) Schirmer-collected, ammoniumsulfate precipitation; and (4) Schirmer-collected, ammoniumsulfate supernatant.
Precipitated proteins were resuspended in 20 μl of 70%saturated ammonium sulfate (SAS) in water. Samples wereincubated for 1 h at room temperature, and precipitates werepelleted by centrifugation. Supernatants (70% SAS solublefractions) were moved to new tubes, and pellets (70% SASinsoluble fractions) were resuspended in 20 μl of 70% SAS.Water (300 μl) and 100% trichloroacetic acid (100 μl) wereadded to all samples, and proteins were precipitated at 4 °Cfor 1 h. The precipitated protein was pelleted bycentrifugation, the supernatant was discarded, and the pelletswere then washed with acetone and air dried.
Pre-fractionated proteins from Schirmer and capillarystrips were digested with trypsin in solution. Five microgramsof the 70% SAS soluble fractions and 10 μg of the SASinsoluble fractions were brought to a volume of 5 μl each in
Figure 4. 18% 1D-SDS–PAGE of coomassie stained proteinsoptimized for lower molecular weight proteins. The gel bandintensities were profiled and the region with observable differenceswas identified.
solubilization buffer (8 M urea, 1% CHAPS). The sampleswere then reduced with dithiothreitol (2.5 μl of 5 mg/mldithiothreitol in 100 mM ammonium bicarbonate) at 37 °C for1 h. Iodoacetamide (2.5 μl of 15 mg/ml iodoacetamide in100 mM ammonium bicarbonate) was then added to alkylatethe cysteines, and solutions were incubated for 1 h at roomtemperature in the dark. Sequencing grade trypsin (5 μl;Promega) prepared in water (25 ng trypsin per 1 μg of proteinsample) and 5 μl of 100 mM ammonium bicarbonate wereadded, and samples were digested at 37 °C for 5 h in a heatedwater bath.
The same LC-MS system described above was used for2D LC-MS/MS. Each sample (5 μl) was injected on a strongcation exchange (SCX) column (10 cm, 300 μm i.d. Poros10S; LC Packings Sunnyvale, CA) for the first dimension.Peptides initially not retained on the SCX column were elutedto a C18 trapping column (LC-Packings A Dionex Co.,Sunnyvale, CA) and washed with 50 mM acetic acid to desaltthe peptides. The peptides were eluted off of the trappingcolumn onto the C18 column into the LTQ system forseparation as described above. Ammonium acetate injections(salt plugs) were used to elute peptides stepwise from the SCXand then onto the C18 as described above. Injections (20 μl)of 10, 25, 50, 100, 200, 500, 1000 mM ammonium acetatewere used.
RESULTSQuantitation: The total protein amount collected by capillaryaveraged 7.0 ± 1.8 μg/μl (around 35 μg per 5 μl of tears).Typical amounts of protein collected by Schirmer Strip wereabout 120 μg of total protein per Schirmer strip. It is difficultto ascertain similar protein concentrations on total proteinquantities from a Schirmer strip since the volume collectedcannot be measured. However, based on qualitativecomparison, there was far more total protein collected by theSchirmer strip method compared with the capillary collectionmethod.
1D-SDS–PAGE and LC-MS/MS: To examine the differencein amount of protein content between capillary-collected andSchirmer-collected tear film, samples were initially analyzedby 1D-SDS–PAGE gradient gel and shown in Figure 2. Totalprotein amounts were measured based on equal load amountsof protein (20 μg) in each lane (despite the difference inprotein quantities associated with the two methods). Loadingequal amounts ensures that the differences noted in the gelpatterns are from the differences in the presence/absence ofproteins from the collection methods rather than one methodsimply having more protein than the other. The observedbands were sliced into 11 regions for each collection method(e.g., lane) with a total of 22 bands. Lane 3 (Schirmer strip)has several bands that are more visible than Lane 2 (capillary)all of which seem to fall in the 30–66 kDa range (e.g., bands2, 4, 5, and 6).
Molecular Vision 2008; 14:456-470 <http://www.molvis.org/molvis/v14/a55> © 2008 Molecular Vision
461

The proteins from 22 corresponding bands wereidentified by LC-MS/MS. Table 1 is a representative table ofthe protein identification data from band 4 includingascension number, Mowse score, number of peptides, andsequence coverage. All subsequent protein identificationswere tabulated in this manner but for brevity, are not includedin future results presented here. Instead, a summary of allproteins identified through the different proteomic methods,the protein function and location (determined from the HumanProtein Reference Database) is listed in Appendix 1.
From the 11 bands associated with the capillarycollection, a total of 40 distinct/unique proteins wereidentified. Several proteins were observed multiple times atdifferent molecular weight regions of the gel. For example,basic proline rich protein (a lacrimal gland-associated protein)has a molecular weight of 22.8 kDa, although it was alsoobserved in Band 2C at approximately 65 kDa. This likelyrepresents posttranslational modifications or the formation ofprotein homopolymers (e.g., dimers, trimers, and multimersof a protein) of lower molecular weight proteins. It could alsorepresent protein complexes that were not denatured. Thereare also higher molecular weight proteins observed at lowermolecular weight regions in the gel (e.g., lactoferrin isobserved throughout the gel). This could be from proteindegradation occurring from storage or tear proteases or fromsample carryover between analyses especially for highabundant proteins like lactoferrin.
From the 11 bands associated with the Schirmer stripcollection method, 66 unique proteins were identified and arelisted in Appendix 1. Band 2S (Lane 3, Figure 2) is quiteprominent while it is much weaker in the corresponding band(Band 2C) from the capillary collected tears (Lane 2). Asshown in Appendix 1, several well known cellular proteinsincluding heat shock protein 70–1 (HSP70–1; Band 2S),keratin proteins, and a series of S-100 calcium bindingproteins are observed from the Schirmer collection but notfrom the corresponding capillary. Similarly, proteinsidentified in bands 7S, 8S, 9S, 10S, and 11S (from theSchirmer strips) are quite different from the correspondingbands associated with capillary collection (Bands 7C, 8C, 9C10C, and 11C).
The dynamic range of protein molecular weight found inthe tear film is large; therefore, the 1D profiles of the tear filmwere analyzed using different percentages of polyacrylamide.Figure 3 shows the SYPRO Ruby-stained 10% SDS–PAGE(optimized for higher molecular weight proteins) with16.7 μg total protein each from Schirmer and capillarycollections and the corresponding image intensity profilesfrom these gels. Regions identified with the most significantdifferences between the two collection methods are labeled1–4 on both the gel and corresponding intensity profile graph.Similarly, Figure 4 is an 18% SDS–PAGE (optimized forlower molecular weight proteins) of 16.7 μg total protein fromthe Schirmer and capillary collection methods and thecorresponding image intensity profiles from these gels.
Figure 5. 1D-SDS–PAGE of coomassiestained lactoferrin and serum albumin.Shown is a graph of gel slice versusMowse score of lactoferrin and serumalbumin to determine what protein is thedominating factor from the gel band.
Molecular Vision 2008; 14:456-470 <http://www.molvis.org/molvis/v14/a55> © 2008 Molecular Vision
462

Notable differences are labeled 1–5 on both the gel image andthe corresponding image intensity profiles. A gel splicer thatcuts the gel into 40 equal bands was used to attempt to identifyevery protein in the entire lane, and the data from the resultingprotein identification are listed in Appendix 1. Thirteenadditional proteins from the Schirmer collection method andseven additional proteins from the capillary collection methodwere detected using the gel splicer.
The sequence coverage observed in the massspectrometry experiments reflects the amount of the protein.Highly abundant proteins yield high sequence coverage whilelow abundant proteins yield low sequence coverage(assuming that digestion is complete, the protein has a gooddigestion pattern, and the peptides do not suffer fromunusually low ionization efficiencies). The protein score isderived from the individual ion scores and, using the samelogic, the higher the protein score, the higher the abundance
Figure 6. 2D-SDS–PAGE. A sevencentimeter 2D-SDS–PAGE of capillarycollected and Schirmer extracted tearproteins stained with SYPRO Ruby andoverlaid to show the contrastingproteins observed between the twocollection methods. The red channelrepresents the image for capillarycollected tears and the blue channelrepresents the image from the tearproteins extracted from a Schirmer strip.
Figure 7. Eighteen-centimeter 2D-SDS–PAGE stained with SyproRuby ofSchirmer strip-collected tears. The gel islabeled with subsequent proteinidentifications by nano-LC/MS/MS.
Molecular Vision 2008; 14:456-470 <http://www.molvis.org/molvis/v14/a55> © 2008 Molecular Vision
463

of a particular protein in the sample. As the gel was sliced intoequal amounts and the protein score (Mowse) is looselycorrelated to protein abundance in the sample, a plot of the gelslice versus Mowse score for a single protein can be generated.The purpose of this experiment was to plot what specificprotein contributes to the visual band. Figure 5 shows the gelslice plotted against the Mowse scores for lactoferrin andserum albumin (obtained from the protein identifications fromthe 10% gel). The Schirmer method has a relatively lowpresence of lactoferrin in the regions marked 1 and 2 whereasthe capillary has a high presence of lactoferrin in the sameregion. The opposite is true of serum albumin where it isobserved a higher presence of serum albumin associated withthe Schirmer method than the capillary collected tears.2D-SDS–PAGE analyses and LC-MS/MS: Differences inprotein patterns between capillary- and Schirmer-collectedtears were examined on a 7-cm (mini) 2D-SDS–PAGE(Figure 6 with SYPRO Ruby staining with the capillary andSchirmer method gels overlaid). Several regions in the 2Danalysis show significant differences in protein patterns aswas also observed with the 1D gel band patterns. Onenoteworthy region is observed in the high molecular weightregion as an intense blue band, indicating a predominance ofproteins extracted from the Schirmer method. LC-MS/MSprotein identification of this region indicated serum albumin.The streak observed in the blue and red channel, which is alsoin the high molecular weight region, corresponds tolactoferrin. These results agree with the results from the 1Danalysis Mowse plots that there are differences in lactoferrinand serum albumin between the collection methods. Finally,there is an intense red channel protein identified as lysozyme.
While it is well known that lysozyme is a highly abundantprotein in the tear, it appears to not be efficiently recoveredfrom the Schirmer collection method.
Figure 7 and Figure 8 are the individual SyproRubystained gels labeled with the protein identifications. Similarto other published work [10,45,51,52], as many as 500 proteinspots are observed in the 2D gel. 2D electrophoresis is not themost efficient way to identify all the proteins in a complexmixture of proteins. Rather, it is better suited to examineprotein pattern changes between two samples. In this case, 2Dgel electrophoresis was mainly used to examine patternchanges observed between capillary- and Schirmer strip-collected tear films. Protein identifications were conducted on58 selected spots that were cored, digested, and analyzed bynano LC-MS/MS. A total of 31 unique proteins wereidentified, and 27 of the 58 spots matched proteins identifiedfrom other cores in other regions of the gel, similar to previousresults (e.g., the multiple spots along the 80 kDa region arepredicted to be glycosylated lactoferrin).
MudPIT: Finally, capillary-collected tear samples andproteins extracted from the Schirmer collection method wereanalyzed by digesting the sample without prior separation bySDS–PAGE before nano LC-MS/MS (i.e., a MudPITproteomic approach) [5]. Ammonium sulfate precipitationwas used to fractionate and remove the high abundant proteinsfrom less abundant proteins. Table 2 summarizes the proteinsidentified from the various fraction and collection methods.In both the capillary-collected tears and Schirmer-collectedtears, the precipitant fraction contained the most proteins andthe supernatant contained what are known to be the highlyabundant proteins in the tear. While the fractionation did
Figure 8. Eighteen-centimeter 2D-SDS–PAGE stained with SyproRuby ofcapillary-collected tears. The gel islabeled with subsequent proteinidentifications by nano-LC/MS/MS.
Molecular Vision 2008; 14:456-470 <http://www.molvis.org/molvis/v14/a55> © 2008 Molecular Vision
464
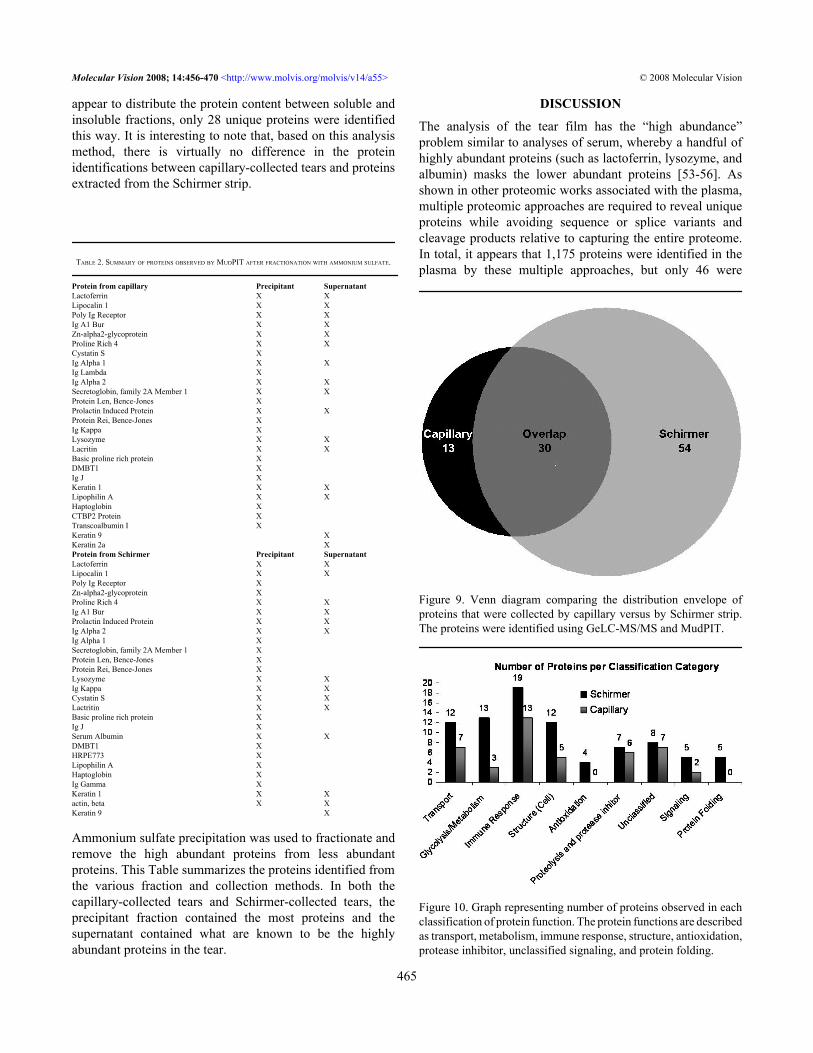
appear to distribute the protein content between soluble andinsoluble fractions, only 28 unique proteins were identifiedthis way. It is interesting to note that, based on this analysismethod, there is virtually no difference in the proteinidentifications between capillary-collected tears and proteinsextracted from the Schirmer strip.
TABLE 2. SUMMARY OF PROTEINS OBSERVED BY MUDPIT AFTER FRACTIONATION WITH AMMONIUM SULFATE.
Protein from capillary Precipitant SupernatantLactoferrin X XLipocalin 1 X XPoly Ig Receptor X XIg A1 Bur X XZn-alpha2-glycoprotein X XProline Rich 4 X XCystatin S XIg Alpha 1 X XIg Lambda XIg Alpha 2 X XSecretoglobin, family 2A Member 1 X XProtein Len, Bence-Jones XProlactin Induced Protein X XProtein Rei, Bence-Jones XIg Kappa XLysozyme X XLacritin X XBasic proline rich protein XDMBT1 XIg J XKeratin 1 X XLipophilin A X XHaptoglobin XCTBP2 Protein XTranscoalbumin I XKeratin 9 XKeratin 2a XProtein from Schirmer Precipitant SupernatantLactoferrin X XLipocalin 1 X XPoly Ig Receptor XZn-alpha2-glycoprotein XProline Rich 4 X XIg A1 Bur X XProlactin Induced Protein X XIg Alpha 2 X XIg Alpha 1 XSecretoglobin, family 2A Member 1 XProtein Len, Bence-Jones XProtein Rei, Bence-Jones XLysozyme X XIg Kappa X XCystatin S X XLactritin X XBasic proline rich protein XIg J XSerum Albumin X XDMBT1 XHRPE773 XLipophilin A XHaptoglobin XIg Gamma XKeratin 1 X Xactin, beta X XKeratin 9 X
Ammonium sulfate precipitation was used to fractionate andremove the high abundant proteins from less abundantproteins. This Table summarizes the proteins identified fromthe various fraction and collection methods. In both thecapillary-collected tears and Schirmer-collected tears, theprecipitant fraction contained the most proteins and thesupernatant contained what are known to be the highlyabundant proteins in the tear.
DISCUSSION
The analysis of the tear film has the “high abundance”problem similar to analyses of serum, whereby a handful ofhighly abundant proteins (such as lactoferrin, lysozyme, andalbumin) masks the lower abundant proteins [53-56]. Asshown in other proteomic works associated with the plasma,multiple proteomic approaches are required to reveal uniqueproteins while avoiding sequence or splice variants andcleavage products relative to capturing the entire proteome.In total, it appears that 1,175 proteins were identified in theplasma by these multiple approaches, but only 46 were
Figure 9. Venn diagram comparing the distribution envelope ofproteins that were collected by capillary versus by Schirmer strip.The proteins were identified using GeLC-MS/MS and MudPIT.
Figure 10. Graph representing number of proteins observed in eachclassification of protein function. The protein functions are describedas transport, metabolism, immune response, structure, antioxidation,protease inhibitor, unclassified signaling, and protein folding.
Molecular Vision 2008; 14:456-470 <http://www.molvis.org/molvis/v14/a55> © 2008 Molecular Vision
465

identified by all four methods used [57]. While massspectrometry-based proteomics is very sensitive (nanogram –picogram sensitivity), it does suffer from a limited dynamicrange (refers to the range of values that can be measured) forbiologic fluids, which are extremely complex and have a largedynamic range in protein concentrations. For example, theprotein epidermal growth factor (EGF) was not identified inthis study nor the de Souza study despite the fact that it isknown from immunological methods [58,59]. Likewise,various cytokines and matrix metalloproteases were also notfound in this study. Although these were normal tear filmsamples, their absence is not necessarily surprising [60-63].Therefore, proteins present in very low levels are not detectedbecause they are masked by the presence of very highconcentrated proteins. The purpose of this study was to furtherdevelop and understand the normal human tear film proteomesimilar to recent scientific activity as it relates to the humanplasma [57]. Appendix 1 sums all the proteins identified usingthe methods described in this paper with the 30 proteinsdescribed as the core tear proteome highlighted in gray.Approximately four times as many proteins were identifiedfrom 1D SDS–PAGE followed by in-gel digestions comparedto direct digestion of the proteins using the MudPIT approach(97 from gels and approximately 28 from MudPIT). This isvery similar to the results observed by Zhou and coworkers[12], although a total of 97 unique proteins were identified,which is far less than the 491 proteins identified by the deSouza [6] paper. The study by de Souza used a high resolutionmass spectrometer and MS3 capabilities allowing for highlyreliable protein identification from only a single peptide,whereas the low resolution ion-traps used in this studyrequires a minimum of two peptides to reliably identifyproteins. However, there were several of the same proteinsobserved in this work that were also observed by Zhou butwere excluded in our study as only a single peptide wassequenced.
The most proteins (n=97) identified were from the 1D-SDS–PAGE and nano-LC-MS/MS approach followed by the2D-SDS–PAGE and nano-LC-MS/MS approach (n=32) andlastly, the MudPIT approach (n=28) which is associated withcapillary collection discussed below. It is possible that moreunique proteins could have been identified from the 2Delectrophoresis. However, methods like MudPIT and proteinidentification from 1D gels are a more efficient way to detectproteins from a complex mixture. There were 30 proteinsidentified by all three methods (listed as the first 30 proteinsand shaded in gray in Appendix 1), and this likely representsthe core of the tear film proteome (i.e., the most abundantproteins). The MudPIT approach (n=28 proteins) seems tohave identified mainly the highly abundant proteins in thetears (e.g., lactoferrin, lipocalin, etc.). Perhaps by using asimilar approach as in serum proteomics where the highabundant serum proteins are removed before MudPIT analysisusing affinity removal, columns would lend itself to a better
examination of the lower abundant proteins via this method.The 2D-SDS–PAGE provided better insight to the overallpattern changes of proteins than the other methods, althoughit is not practical to core all the proteins observed in a 2D gelfor subsequent identification. The first reason is that theamount of protein required for a large 2D gel can limit aproteomic project to pooled samples, thus potentially limitinglarge clinical studies of individual patients in terms ofindividual analyses. More specifically, a single tear sample ofa healthy person contains roughly 10 μg of protein, and arecommended protein load for protein identification from alarge format 2D gel is approximately 300 μg of total protein.The second reason is that 2D SDS–PAGE followed by LC-MS/MS is more practical when choosing certain protein spotsthat are observed to change with disease, environmentalchallenge, or treatment with a drug and is not necessarilymeant for complete protein identification of the totalproteome. The 2D-SDS–PAGE followed by LC-MS/MSapproach will be more valuable when looking for up and ordown regulation of proteins.
A secondary goal of this research was to comparemethods of tear film collection (i.e., capillary collectionversus Schirmer collection). A Venn diagram in Figure 9shows the overlap of proteins identified between the twocollection methods. There were 84 proteins identified fromprotein associated with the Schirmer method and 43 identifiedfrom the capillary method. Only 30 total proteins identifiedoverlapped between the two collection methods. We proposethat this difference arises through the Schirmer strip’sinteraction with the epithelium of the ocular surface (whereasthe capillary does not). To help examine this hypothesis,analysis of the various classifications/functions of the proteinsidentified were grouped based on their general function asfollows transport, metabolism, immune response, structure,antioxidation, protease inhibitors, unclassified, cell signaling,and protein folding. Figure 10 is a graph of the number ofproteins found in each classification group compared bycollection method. There are several cellular proteins (i.e., notsecreted) observed from the Schirmer method that were notfound in tear film collected by capillary such as the S100calcium binding series of proteins. Interestingly, serumalbumin was detected at much higher levels in the proteinsassociated with the Schirmer collection method. As shown inFigure 10, no proteins classified as antioxidants were foundin the capillary-collected tears, but four are found in proteinsextracted from Schirmer. Similarly, five proteins classified asprotein-folding proteins are found in the Schirmer-collectedtears whereas none were detected in the capillary-collectedtears. There are also more proteins in the metabolism and cellstructure classifications from Schirmer-collected tears, andproteins classified as transport and immune response proteinshave notable differences between the two collection methods.Lastly, proteins classified as structure-related proteaseinhibitors and those that could not be classified show similar
Molecular Vision 2008; 14:456-470 <http://www.molvis.org/molvis/v14/a55> © 2008 Molecular Vision
466

levels between the two collection methods. Overall, theseresults suggest that the tear film collection method doesimpact the proteins present in the sample and that care shouldbe exercised in choosing a tear collection method to bestcorrelate to the experiment being conducted or the hypothesisthat is being tested.
ACKNOWLEDGMENTSThe authors wish to thank Richard Sessler and Ronnie Perez,Ph.D., for their contribution to the gel analyses and the criticalreading of the manuscript. The authors would also like tothank Beth Oglevee, Kathy Reuter, OD, and Kathy Keibel,OD, for their help in patient recruitment and samplecollection.
REFERENCES1. Aebersold R, Mann M. Mass spectrometry-based proteomics.
Nature 2003; 422:198-207. [PMID: 12634793]2. Ferguson PL, Smith RD. Proteome analysis by mass
spectrometry. Annu Rev Biophys Biomol Struct 2003;32:399-424. [PMID: 12574065]
3. Gevaert K, Vandekerckhove J. Protein identification methodsin proteomics. Electrophoresis 2000; 21:1145-54. [PMID:10786887]
4. Yates JR 3rd. Mass spectrometry and the age of the proteome.J Mass Spectrom 1998; 33:1-19. [PMID: 9449829]
5. Washburn MP, Wolters D, Yates JR 3rd. Large-scale analysisof the yeast proteome by multidimensional proteinidentification technology. Nat Biotechnol 2001; 19:242-7.[PMID: 11231557]
6. de Souza GA, Godoy LM, Mann M. Identification of 491proteins in the tear fluid proteome reveals a large number ofproteases and protease inhibitors. Genome Biol 2006;7:R72. [PMID: 16901338]
7. Azzarolo AM, Brew K, Kota S, Ponomareva O, Schwartz J,Zylberberg C. Presence of tear lipocalin and other majorproteins in lacrimal fluid of rabbits. Comp Biochem PhysiolB Biochem Mol Biol 2004; 138:111-7. [PMID: 15193265]
8. Baier G, Wollensak G, Mur E, Redl B, Stoffler G, Gottinger W.Analysis of human tear proteins by different high-performance liquid chromatographic techniques. JChromatogr 1990; 525:319-28. [PMID: 2329162]
9. Holly FJ, Hong BS. Biochemical and surface characteristics ofhuman tear proteins. Am J Optom Physiol Opt 1982;59:43-50. [PMID: 7055200]
10. Janssen PT, Van Bijsterveld OP. Comparison of electrophoretictechniques for the analysis of human tear fluid proteins. ClinChim Acta 1981; 114:207-18. [PMID: 7285346]
11. Molloy MP, Bolis S, Herbert BR, Ou K, Tyler MI, van Dyk DD,Willcox MD, Gooley AA, Williams KL, Morris CA, WalshBJ. Establishment of the human reflex tear two-dimensionalpolyacrylamide gel electrophoresis reference map: newproteins of potential diagnostic value. Electrophoresis 1997;18:2811-5. [PMID: 9504814]
12. Zhou L, Beuerman RW, Barathi A, Tan D. Analysis of rabbittear proteins by high-pressure liquid chromatography/electrospray ionization mass spectrometry. Rapid CommunMass Spectrom 2003; 17:401-12. [PMID: 12590388]
13. Fung KY, Morris C, Sathe S, Sack R, Duncan MW.Characterization of the in vivo forms of lacrimal-specificproline-rich proteins in human tear fluid. Proteomics 2004;4:3953-9. [PMID: 15526346]
14. Jauhiainen M, Setala NL, Ehnholm C, Metso J, Tervo TM,Eriksson O, Holopainen JM. Phospholipid transfer protein ispresent in human tear fluid. Biochemistry 2005; 44:8111-6.[PMID: 15924430]
15. Dartt DA. Interaction of EGF family growth factors andneurotransmitters in regulating lacrimal gland secretion. ExpEye Res 2004; 78:337-45. [PMID: 15106911]
16. Nava A, Barton K, Monroy DC, Pflugfelder SC. The effects ofage, gender, and fluid dynamics on the concentration of tearfilm epidermal growth factor. Cornea 1997; 16:430-8.[PMID: 9220241]
17. Ollivier FJ, Brooks DE, Schultz GS, Blalock TD, Andrew SE,Komaromy AM, Cutler TJ, Lassaline ME, Kallberg ME, VanSetten GB. Connective tissue growth factor in tear film of thehorse: detection, identification and origin. Graefes Arch ClinExp Ophthalmol 2004; 242:165-71. [PMID: 14648133]
18. Rocha EM, Cunha DA, Carneiro EM, Boschero AC, Saad MJ,Velloso LA. Identification of insulin in the tear film andinsulin receptor and IGF-1 receptor on the human ocularsurface. Invest Ophthalmol Vis Sci 2002; 43:963-7. [PMID:11923235]
19. Woo HM, Bentley E, Campbell SF, Marfurt CF, Murphy CJ.Nerve growth factor and corneal wound healing in dogs. ExpEye Res 2005; 80:633-42. [PMID: 15862170]
20. Kimata H. Passive smoking elevates neurotrophin levels intears. Hum Exp Toxicol 2004; 23:215-7. [PMID: 15222398]
21. Barton K, Monroy DC, Nava A, Pflugfelder SC. Inflammatorycytokines in the tears of patients with ocular rosacea.Ophthalmology 1997; 104:1868-74. [PMID: 9373119]
22. Barton K, Nava A, Monroy DC, Pflugfelder SC. Cytokines andtear function in ocular surface disease. Adv Exp Med Biol1998; 438:461-9. [PMID: 9634922]
23. Sack RA, Beaton A, Sathe S, Morris C, Willcox M, Bogart B.Towards a closed eye model of the pre-ocular tear layer. ProgRetin Eye Res 2000; 19:649-68. [PMID: 11029550]
24. Sack RA, Conradi L, Krumholz D, Beaton A, Sathe S, MorrisC. Membrane array characterization of 80 chemokines,cytokines, and growth factors in open- and closed-eye tears:angiogenin and other defense system constituents. InvestOphthalmol Vis Sci 2005; 46:1228-38. [PMID: 15790883]
25. Solomon A, Dursun D, Liu Z, Xie Y, Macri A, Pflugfelder SC.Pro- and anti-inflammatory forms of interleukin-1 in the tearfluid and conjunctiva of patients with dry-eye disease. InvestOphthalmol Vis Sci 2001; 42:2283-92. [PMID: 11527941]
26. Stern ME, Beuerman RW, Fox RI, Gao J, Mircheff AK,Pflugfelder SC. A unified theory of the role of the ocularsurface in dry eye. Adv Exp Med Biol 1998; 438:643-51.[PMID: 9634949]
27. Thakur A, Willcox MD. Contact lens wear alters the productionof certain inflammatory mediators in tears. Exp Eye Res 2000;70:255-9. [PMID: 10712811]
28. Thakur A, Willcox MD, Stapleton F. The proinflammatorycytokines and arachidonic acid metabolites in humanovernight tears: homeostatic mechanisms. J Clin Immunol1998; 18:61-70. [PMID: 9475355]
Molecular Vision 2008; 14:456-470 <http://www.molvis.org/molvis/v14/a55> © 2008 Molecular Vision
467
http://www.ncbi.nlm.nih.gov/entrez/query.fcgi?cmd=Retrieve&db=PubMed&dopt=abstract&list_uids=9449829
http://www.ncbi.nlm.nih.gov/entrez/query.fcgi?cmd=Retrieve&db=PubMed&dopt=abstract&list_uids=2329162
http://www.ncbi.nlm.nih.gov/entrez/query.fcgi?cmd=Retrieve&db=PubMed&dopt=abstract&list_uids=7055200
http://www.ncbi.nlm.nih.gov/entrez/query.fcgi?cmd=Retrieve&db=PubMed&dopt=abstract&list_uids=7285346
http://www.ncbi.nlm.nih.gov/entrez/query.fcgi?cmd=Retrieve&db=PubMed&dopt=abstract&list_uids=9504814
http://www.ncbi.nlm.nih.gov/entrez/query.fcgi?cmd=Retrieve&db=PubMed&dopt=abstract&list_uids=9220241
http://www.ncbi.nlm.nih.gov/entrez/query.fcgi?cmd=Retrieve&db=PubMed&dopt=abstract&list_uids=9220241
http://www.ncbi.nlm.nih.gov/entrez/query.fcgi?cmd=Retrieve&db=PubMed&dopt=abstract&list_uids=9373119
http://www.ncbi.nlm.nih.gov/entrez/query.fcgi?cmd=Retrieve&db=PubMed&dopt=abstract&list_uids=9634922
http://www.ncbi.nlm.nih.gov/entrez/query.fcgi?cmd=Retrieve&db=PubMed&dopt=abstract&list_uids=9634949
http://www.ncbi.nlm.nih.gov/entrez/query.fcgi?cmd=Retrieve&db=PubMed&dopt=abstract&list_uids=9634949

29. Trousdale MD, Zhu Z, Stevenson D, Schechter JE, Ritter T,Mircheff AK. Expression of TNF inhibitor gene in thelacrimal gland promotes recovery of tear production and tearstability and reduced immunopathology in rabbits withinduced autoimmune dacryoadenitis. J Autoimmune Dis2005; 2:6. [PMID: 15985164]
30. Lema I, Duran JA. Inflammatory molecules in the tears ofpatients with keratoconus. Ophthalmology 2005; 112:654-9.[PMID: 15808258]
31. Afonso AA, Sobrin L, Monroy DC, Selzer M, Lokeshwar B,Pflugfelder SC. Tear fluid gelatinase B activity correlateswith IL-1alpha concentration and fluorescein clearance inocular rosacea. Invest Ophthalmol Vis Sci 1999;40:2506-12. [PMID: 10509643]
32. Holopainen JM, Moilanen JA, Sorsa T, Kivela-Rajamaki M,Tervahartiala T, Vesaluoma MH, Tervo TM. Activation ofmatrix metalloproteinase-8 by membrane type 1-MMP andtheir expression in human tears after photorefractivekeratectomy. Invest Ophthalmol Vis Sci 2003; 44:2550-6.[PMID: 12766056]
33. Smith VA, Rishmawi H, Hussein H, Easty DL. Tear film MMPaccumulation and corneal disease. Br J Ophthalmol 2001;85:147-53. [PMID: 11159476]
34. Vita JB, Anderson JA, Hulem CD, Leopold IH. Angiotensin-converting enzyme activity in ocular fluids. InvestOphthalmol Vis Sci 1981; 20:255-7. [PMID: 6257623]
35. Varnell RJ, Freeman JY, Maitchouk D, Beuerman RW,Gebhardt BM. Detection of substance P in human tears bylaser desorption mass spectrometry and immunoassay. CurrEye Res 1997; 16:960-3. [PMID: 9288460]
36. Yamada M, Ogata M, Kawai M, Mashima Y, Nishida T.Substance P in human tears. Cornea 2003; 22:S48-54. [PMID:14703707]
37. Baleriola-Lucas C, Fukuda M, Willcox MD, Sweeney DF,Holden BA. Fibronectin concentration in tears of contact lenswearers. Exp Eye Res 1997; 64:37-43. [PMID: 9093019]
38. Csutak A, Silver DM, Tozser J, Facsko A, Berta A. Plasminogenactivator activity and inhibition in rabbit tears afterphotorefractive keratectomy. Exp Eye Res 2003; 77:675-80.[PMID: 14609555]
39. Ohashi Y, Ishida R, Kojima T, Goto E, Matsumoto Y, WatanabeK, Ishida N, Nakata K, Takeuchi T, Tsubota K. Abnormalprotein profiles in tears with dry eye syndrome. Am JOphthalmol 2003; 136:291-9. [PMID: 12888052]
40. Kari O, Aho VV, Peltonen S, Saari JM, Kari M, Maatta M,Collan Y, Saari KM. Group IIA phospholipase A(2)concentration of tears in patients with ocular rosacea. ActaOphthalmol Scand 2005; 83:483-6. [PMID: 16029275]
41. Bours J, Reitz C, Strobel J, Breipohl W. Detection of secretoryIgM in tears during rhino-conjunctivitis. Graefes Arch ClinExp Ophthalmol 2005; 243:456-63. [PMID: 15931543]
42. Tozser J, Berta A. Lactate dehydrogenase activity inpathological human tears obtained with glass capillariescorrelates with the albumin content. Int Ophthalmol 1998;22:289-92. [PMID: 10826546]
43. Mulvenna I, Stapleton F, Hains PG, Cengiz A, Tan M, WalshB, Holden B. Low molecular weight analysis of tears usingmatrix assisted laser desorption ionization-time of flight massspectrometry. Clin Experiment Ophthalmol 2000; 28:205-7.[PMID: 10981800]
44. Zhou L, Beuerman RW, Foo Y, Liu S, Ang LP, Tan DT.Characterisation of human tear proteins using high-resolutionmass spectrometry. Ann Acad Med Singapore 2006;35:400-7. [PMID: 16865190]
45. Koo BS, Lee DY, Ha HS, Kim JC, Kim CW. Comparativeanalysis of the tear protein expression in blepharitis patientsusing two-dimensional electrophoresis. J Proteome Res 2005;4:719-24. [PMID: 15952718]
46. Fung K, Morris C, Duncan M. Mass spectrometric techniquesapplied to the analysis of human tears: a focus on the peptideand protein constituents. Adv Exp Med Biol 2002;506:601-5. [PMID: 12613966]
47. Ham BM, Jacob JT, Cole RB. Single eye analysis andcontralateral eye comparison of tear proteins in normal anddry eye model rabbits by MALDI-ToF mass spectrometryusing wax-coated target plates. Anal Bioanal Chem 2007;387:889-900. [PMID: 17211596]
48. Bradford MM. A rapid and sensitive method for the quantitationof microgram quantities of protein utilizing the principle ofprotein-dye binding. Anal Biochem 1976; 72:248-54. [PMID:942051]
49. Carr S, Aebersold R, Baldwin M, Burlingame A, Clauser K,Nesvizhskii A. The need for guidelines in publication ofpeptide and protein identification data: Working Group onPublication Guidelines for Peptide and Protein IdentificationData. Mol Cell Proteomics 2004; 3:531-3. [PMID: 15075378]
50. Pappin DJ, Hojrup P, Bleasby AJ. Rapid identification ofproteins by peptide-mass fingerprinting. Curr Biol 1993;3:327-32. [PMID: 15335725]
51. Herber S, Grus FH, Sabuncuo P, Augustin AJ. Two-dimensional analysis of tear protein patterns of diabeticpatients. Electrophoresis 2001; 22:1838-44. [PMID:11425240]
52. Li N, Wang N, Zheng J, Liu XM, Lever OW, Erickson PM, LiL. Characterization of human tear proteome using multipleproteomic analysis techniques. J Proteome Res 2005;4:2052-61. [PMID: 16335950]
53. Govorukhina NI, Reijmers TH, Nyangoma SO, van der Zee AG,Jansen RC, Bischoff R. Analysis of human serum by liquidchromatography-mass spectrometry: improved samplepreparation and data analysis. J Chromatogr A 2006;1120:142-50. [PMID: 16574134]
54. Yocum AK, Yu K, Oe T, Blair IA. Effect of immunoaffinitydepletion of human serum during proteomic investigations. JProteome Res 2005; 4:1722-31. [PMID: 16212426]
55. Colantonio DA, Dunkinson C, Bovenkamp DE, Van Eyk JE.Effective removal of albumin from serum. Proteomics 2005;5:3831-5. [PMID: 16145708]
56. Fountoulakis M, Juranville JF, Jiang L, Avila D, Roder D, JakobP, Berndt P, Evers S, Langen H. Depletion of the high-abundance plasma proteins. Amino Acids 2004; 27:249-59.[PMID: 15592754]
57. Anderson NL, Polanski M, Pieper R, Gatlin T, Tirumalai RS,Conrads TP, Veenstra TD, Adkins JN, Pounds JG, Fagan R,Lobley A. The human plasma proteome: a nonredundant listdeveloped by combination of four separate sources. Mol CellProteomics 2004; 3:311-26. [PMID: 14718574]
58. Ohashi Y, Motokura M, Kinoshita Y, Mano T, Watanabe H,Kinoshita S, Manabe R, Oshiden K, Yanaihara C. Presence
Molecular Vision 2008; 14:456-470 <http://www.molvis.org/molvis/v14/a55> © 2008 Molecular Vision
468
http://www.ncbi.nlm.nih.gov/entrez/query.fcgi?cmd=Retrieve&db=PubMed&dopt=abstract&list_uids=6257623
http://www.ncbi.nlm.nih.gov/entrez/query.fcgi?cmd=Retrieve&db=PubMed&dopt=abstract&list_uids=9288460

of epidermal growth factor in human tears. Invest OphthalmolVis Sci 1989; 30:1879-82. [PMID: 2788149]
59. Wilson SE, Lloyd SA, Kennedy RH. Basic fibroblast growthfactor (FGFb) and epidermal growth factor (EGF) receptormessenger RNA production in human lacrimal gland. InvestOphthalmol Vis Sci 1991; 32:2816-20. [PMID: 1894478]
60. Sack R, Conradi L, Beaton A, Sathe S, McNamara N, LeonardiA. Antibody array characterization of inflammatorymediators in allergic and normal tears in the open and closedeye environments. Exp Eye Res 2007; 85:528-38. [PMID:17719576]
61. Shoji J, Inada N, Sawa M. Antibody array-generated cytokineprofiles of tears of patients with vernal keratoconjunctivitis
or giant papillary conjunctivitis. Jpn J Ophthalmol 2006;50:195-204. [PMID: 16767372]
62. Sobrin L, Liu Z, Monroy DC, Solomon A, Selzer MG,Lokeshwar BL, Pflugfelder SC. Regulation of MMP-9activity in human tear fluid and corneal epithelial culturesupernatant. Invest Ophthalmol Vis Sci 2000; 41:1703-9.[PMID: 10845589]
63. Sonoda S, Uchino E, Nakao K, Sakamoto T. Inflammatorycytokine of basal and reflex tears analysed by multicytokineassay. Br J Ophthalmol 2006; 90:120-2. [PMID: 16361687]
Molecular Vision 2008; 14:456-470 <http://www.molvis.org/molvis/v14/a55> © 2008 Molecular Vision
469
http://www.ncbi.nlm.nih.gov/entrez/query.fcgi?cmd=Retrieve&db=PubMed&dopt=abstract&list_uids=2788149

Appendix 1. Summary of all proteins observed by all of the variousproteomic approaches and collection methods.
To access the data, click or select the words “Appendix1”. This will initiate the download of a compressed (zip)archive that contains the file. This file should be
uncompressed with an appropriate program (the particularprogram will depend on your operating system).
Molecular Vision 2008; 14:456-470 <http://www.molvis.org/molvis/v14/a55> © 2008 Molecular Vision
The print version of this article was created on 7 March 2008. This reflects all typographical corrections and errata to the articlethrough that date. Details of any changes may be found in the online version of the article.
470


![RESEARCH Open Access The quantitative proteomic ...workflows to study broad proteome changes [14-17]. To date, there have only been two high-throughput quanti-tative proteomic assays](https://static.fdocuments.net/doc/165x107/60e092f770174701a63a4f5a/research-open-access-the-quantitative-proteomic-workflows-to-study-broad-proteome.jpg)