Investigation of Rare Earth Element Extraction from …...
34
Investigation of Rare Earth Element Extraction from North Dakota Coal‐Related Feed Stocks 3/27/2017 1 Steve Benson University of North Dakota 15 N. 23 Street, Stop 9018 Grand Forks, North Dakota 58202‐9018 [email protected] 2017 NETL Crosscutting Research & Analysis Portfolio Review March 22, 2017 DE‐FE0027006 Period of Performance 3/1/2016 to 8/31/2017
Transcript of Investigation of Rare Earth Element Extraction from …...

Investigation of Rare Earth Element Extraction from North Dakota Coal‐Related
Feed Stocks
3/27/2017 1
Steve BensonUniversity of North Dakota15 N. 23 Street, Stop 9018
Grand Forks, North Dakota 58202‐[email protected]
2017 NETL Crosscutting Research & Analysis Portfolio Review
March 22, 2017
DE‐FE0027006Period of Performance3/1/2016 to 8/31/2017

Goals and Objectives
• Goal: – To develop a high performance, economically viable, and
environmentally benign concentrating technology for coal‐related feedstocks to a mixed REE concentrate of > 2% by weight.
• Objectives/Milestones:– Identify ND coal‐related feedstock(s) with >300 ppm REE content– Identify the optimum methods to separate and concentrate the
REEs to two percent by weight.– Perform a technical and economic analysis of the optimum
methods.– Develop a design of a bench‐scale system to concentrate REEs.
3/27/2017 2

Presentation Outline• Project Team• Scope of Work – Description of tasks• Schedule• Accomplishments
– Sampling and analysis results– REE concentrating results– Technical and economic analysis results
• Next Steps
3/27/2017 3

Project TeamTechnical Team:• University of North Dakota – Institute for
Energy Studies; Energy & Environmental Research Center
• Barr Engineering• Pacific Northwest National Laboratory
Funding Support:• U.S. Department of Energy – National
Energy Technology Laboratory• North Dakota Industrial Commission –
Lignite Energy Council• Great River Energy• North American Coal Corporation
Advisory Support:• North Dakota Geological Survey
3/27/2017 4
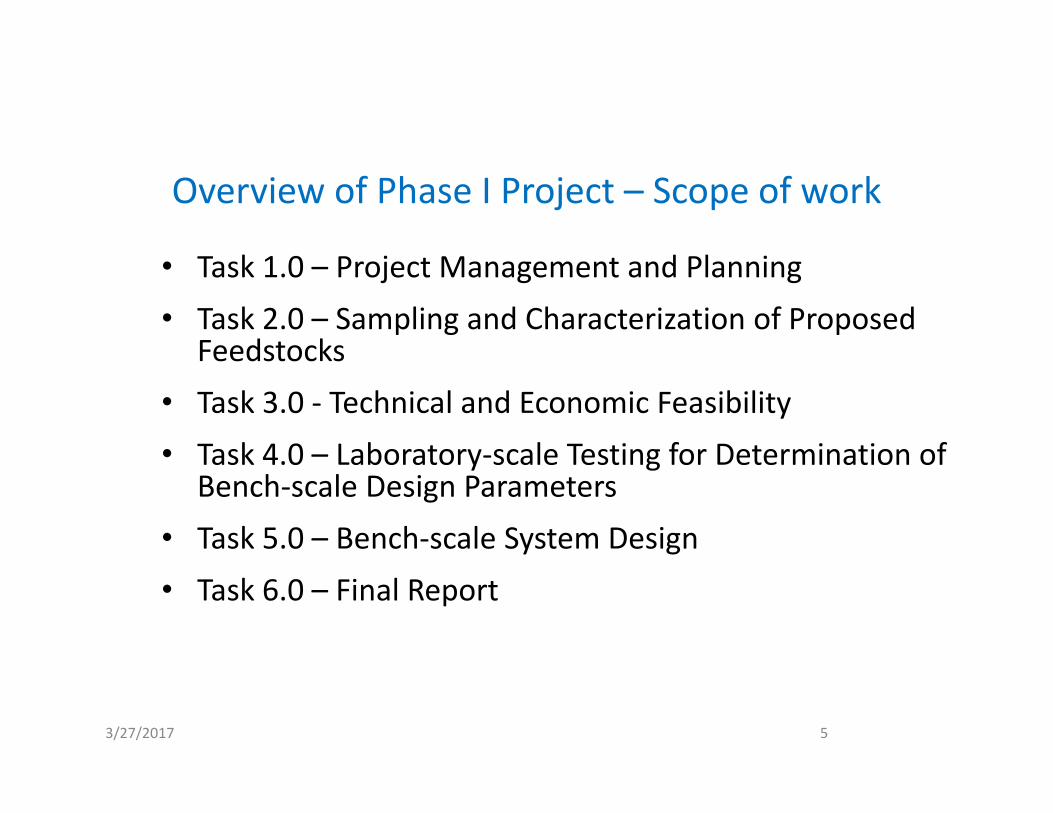
Overview of Phase I Project – Scope of work
• Task 1.0 – Project Management and Planning• Task 2.0 – Sampling and Characterization of Proposed
Feedstocks• Task 3.0 ‐ Technical and Economic Feasibility• Task 4.0 – Laboratory‐scale Testing for Determination of
Bench‐scale Design Parameters• Task 5.0 – Bench‐scale System Design• Task 6.0 – Final Report
3/27/2017 5

Accomplishments
3/27/2017 6

Overview of Task 2
• Task 2.0 – Sampling and Characterization of Proposed Feedstocks:
• This task involved extensive sampling and characterization of multiple potential feedstocks from NAcoal’s Falkirk mine, GRE’s Coal Creek station power plant in North Dakota, and other lignite related resources.
• Feedstocks from the mine included the lignite coal, roof, parting and floor materials.
• Feedstocks from Coal Creek Station plant included inlet coal, air jig outlet, feeder outlet and fabric filter fines associated with the DryFining™ system, and bottom ash and fly ash.
3/27/2017 7

Task 2 Analysis Methods
3/27/2017 8
Category Equipment Function
Bulk chemical composition
ASTM standard analysis Proximate analysis; Ultimate analysis; Ash composition
X-ray Fluorescence Bulk chemistry; major, minor and trace element
Inductive Coupled Plasma-Mass Spectrometry
Abundance of trace elements including REE
Forms of REE
Scanning Electron Microscopy
Morphological analysis –imaging and chemical composition of mineralsCCSEM – chemical composition, size and associations (included or excluded relative to coal particles)
Chemical FractionationQuantitatively determine the modes of occurrence of the inorganic elements

Sampling Locations at Coal Creek Station
3/27/2017 9

Coal Creek Station & DryFining™ Process Streams‐ REE content lower than expected
Sample Location Average total REEs –dry whole sample basis, ppm
Average total REEs – dry ash basis, ppm
air jig rejects 36 105coal dryer dust collector 66 199
Fly ash 240 240Clean coal to feeder 25 234
3/27/2017 10
On ash basis, fly ash REE content higher than mineral‐rich reject stream
Low REE content in plant due to blending of coals/sediments

Evaluation of Roof/Floor Sediments at Falkirk Mine
3/27/2017 11CONFIDENTIAL
0
5
10
15
20
25
30
Percen
tage
• REEs mainly associated with phosphates, carbonates and clays
• REE‐bearing minerals are very small: ~90% total REE in < 4 μm mineral grains
• Total REE content < 200 ppm (dry whole sample basis)

Physical Beneficiation Testing
• Size/density differences identified as possible separation drivers for REE enrichment
• UND is developing novel dry elutriation method for Chemical Looping Combustion– Method adapted and tested for REE enrichment in roof/floor sediments
• Simple wet screening evaluated to determine if enrichment by size naturally occurs with grinding or during combustion (flyash sample)
• Several samples with REE content above 150 ppm (whole sample basis) evaluated
3/27/2017 12

Physical Beneficiation Testing Results
3/27/2017 13
Sample ID (roof/floor sediments)
Dry ash basisElutriate Total REE
(ppmw)Non‐Elutriate Total REE
(ppmw)IES 16024 178 & 172 170IES 16025 194 201IES 16026 213 210IES 16035 202 204IES 16036 186 & 172 182IES 16037 171 169IES 16047 175 179IES 16048 179 179IES 16053 150 146IES 16054 178 168IES 16056 185 182
Sample IDSize Fraction (microns) Distribution (wt%) Total REE (ppmw)
Dry ash basis
IES16141 (Roof sediment)
+ 25 8.4 16925 x 10 15.8 139‐10 75.9 186
IES16147 (Flyash from Plant)
+25 25.0 27425 x 10 40.2 244‐10 34.8 243
Potentially some enrichment based on size…But, physicalbeneficiation extremely challenging due to fine particles –deemed not feasible for these samples
ND Coal Zone – Seam Sampling
• Lignite coal• Roof• Partings• Floor materials
3/27/2017 14

Coal Zones in North Dakota
3/27/2017 15
Hagel
Beulah-Zap
Harmon Hansen

Evaluation of Coal Samples – SEM‐EDS
3/27/2017 16
• REE minerals in raw coal difficult to detect via SEM –only La and Ce detected
• Mineral-bound REE appear to be associated with Zr, P and Fe in the raw coal

Comparison of Coal A and B Samples
3/27/2017 17
Additional sampling of Coal A seam shows significant enrichment of the roof sediments as well – 450 ppm whole sample basis ( 595 ppm ash basis)
Coal ACoal B
PPM

Content of Critical REE compared to global coal deposits and traditional mineral resources
3/27/2017 18
Seredin, V.V., Dai, S. “Coal deposits as potential alternative sources forlanthanides and yttrium”. International Journal of Coal Geology. 94 (2012) 67-93
• High REE-content coals are typically enriched in the heavy and critical REEs, more-so than traditional mineral resources (i.e. Mountain Pass USA)
• Coutl = ratio of critical to excessive elements
• REYdef,rel% = % critical REE in total REE
• ND Lignite fits nicely into Cluster II – Promising
• Coal ash represents a more promising resource than traditional carbonatite deposits

Task 2 Summary• Sampling/analysis conducted on a range of ND lignite‐related materials
• On ash basis, results indicate highest concentration of REEs exist in certain locations within certain coal seams
• Lower content in the associated sediments
• Lower content in the Coal Creek Station fly ash due to blending with lower REE content feed coals
• Selective mining likely needed – maybe not feasible at large utility‐scale?
• Ultrafine REE‐bearing mineral particles make physical beneficiation very challenging/not feasible for roof/floor sediments
• Modes of occurrence testing has identified that the majority of REEs in lignite are associated with clays/phosphates or as organic complexes
• Two promising REE‐rich resources identified:
1. Feedstock A (Coal A): 2300 ppm REE in ash
2. Feedstock B (Coal B): 580 ppm REE in ash
3/27/2017 19

Laboratory REE Concentration Results
3/27/2017 20

Laboratory REE Recovery Tests– Stage 1 Concentration
3/27/2017 21
element wt% rejected to tailingsSc 0Y 9.2La 2.7Ce 1.7Pr 0.6Nd 0.7Sm 1.3Eu 2.1Gd 3.7Tb 4.1Dy 4.6Ho 5.5Er 6.9Tm 6.8Yb 6.3Lu 7.8Co 68Ni 42Zn 57Ca 80Mg 80Na 80K 10Mn 57
• Minimal loss of REE to tailings
• Effective removal of some of the impurities
IMPU
RIT
IES

Laboratory REE Recovery Tests– Stage 2 Concentration Screening Tests
3/27/2017 22
Condition 1 Condition 2 Condition 3 Condition 4 Condition 5 Condition 6Sc 11.8 26.7 4.0 53.2 12.4 69.9Y 10.6 92.6 5.3 84.0 8.7 74.1La 10.8 90.4 4.5 64.5 7.5 61.1Ce 11.2 88.2 4.8 63.1 7.2 58.0Pr 11.0 87.0 3.8 63.3 7.2 57.5Nd 11.4 86.4 3.9 64.7 6.7 57.7Sm 11.7 86.4 3.7 68.4 6.9 64.0Eu 10.9 85.0 0.6 66.1 7.7 59.5Gd 11.4 89.4 2.6 75.6 7.5 67.7Tb 12.1 90.0 2.4 77.3 7.9 67.2Dy 11.8 90.1 2.9 79.1 7.2 66.4Ho 11.4 90.3 3.5 80.8 7.6 65.1Er 11.4 90.0 3.8 81.7 7.7 62.8Tm 11.6 89.1 4.1 82.2 8.5 61.5Yb 10.9 87.7 3.1 82.0 7.6 61.4Lu 11.3 87.4 3.4 82.0 7.7 62.0
Total wt% recovered 11.0 86.8 4.5 70.9 7.9 64.6LREE % recovered 11.2 83.9 4.3 63.8 7.6 60.4HREE % recovered 10.8 91.8 4.8 83.1 8.4 71.7
critial REE % recovered 10.9 90.8 4.7 79.0 8.1 69.2non‐critical REE % recovered 11.1 83.7 4.4 64.6 7.7 60.9
wt% recovered in REE concentrate

Stage 2 Concentration ‐ Optimized Results
3/27/2017 23
• Recovery of Feedstock B REEs lower, but good selectivity to critical/heavy REEs • Scandium (highest price ~$2000/kg oxide) has excellent recovery from
Feedstock A• Results also showed high recovery of other valuable elements
• Co, Cu, Ga, Ge…others – substantially improves economics
0
10
20
30
40
50
60
70
80
90
100
Sc Y La Ce Pr Nd Sm Eu Gd Tb Dy Ho Er Tm Yb Lu
wt%
recovered to con
centrate
Feedstock BFeedstock A

Feedstock A Concentration Results• 3‐stage approach• Stage 1 focus on impurity rejection• Stage 2 focus on REE recovery• Stage 3 primary focus on impurity rejection
3/27/2017 24
Feedstock A ‐ Initial Feedstock at 0.23 wt% (ash elemental basis)
Concentration Stage % REE Recovery to Concentrate wt% REE in Concentrate (elemental)
1 97 0.3
2 89 1
3 84 2.9 to 6.1

Technical and Economic Feasibility Study
3/27/2017 25

Commercial Concept: Integrated CHP+REE ‐ NDUS
• North Dakota University System (NDUS) campus heating plants need to be re-powered
• Concept includes recovery of REE from next generation design of NDUS combined heat & power plants
• NDUS systems use smaller quantities of fuel than utility-scale plants
• Opportunity to selectively mine REE rich seams
• Integration with existing facility results in cost-saving synergies
• Multiple revenue streams to augment REE economics
3/27/2017 26

TEA Mass Balance
3/27/2017 27
Valley City State University – Coal Feed Rate of 2.5 tons/hour
Basis: Feedstock A – 2300 ppm REE in Ash
• Total REE, Y, Sc production (pure oxides): ~12 tons/year• ~85% recovery into 2wt% REE concentrate product• ~80% recovery from the 2wt% concentrate during final purification
For future reference: If concept installed at largest NDUS facilities (UND & NDSU)
• UND = 20X scale-up• NDSU = 15X scale-up• Total REE, Y, Sc production (pure oxides): ~440 tons/year

TEA Results and Conclusions
3/27/2017 28
• 2wt% REE using Feedstock A is achievable using the 3-stage concentration approach
• Feedstock B results in lower REE concentration with the same methods
• The proposed plant concept is highly profitable
• Integration within existing coal conversion facility allows increased efficiency through synergy as well as multiple product streams besides REE to augment economics
• IRR ranging from 23 to 69% depending on sensitivity case
• Base case at 35% IRR and simple payback of 3 years

TEA Results – Scale Projections
3/27/2017 29
0.0
2.0
4.0
6.0
8.0
10.0
12.0
14.0
‐20%
0%
20%
40%
60%
80%
100%
120%
140%
100 1,000 10,000 100,000
Simple Pa
ybac
k (years)
IRR/RO
I
Coal Feedrate (lb/hr dry basis)
10 Year Plant Life ‐ Economics vs. Plant Scale
IRR ROI Payback
VCSU Scale
UND/NDSU Scale

TEA Results –‘Stand‐Alone’ Economics of REE Process
3/27/2017 30
• Case 1, 2015 prices for REE • Case 2 Decrease CAPEX by 10%• Case 3. Target only Co, Dy, Er,
Eu, Ga, Ge, Lu, Nd, Pr, Tb, Tm Sc, Y
• Case 4. Target only Co, Dy, Er, Eu, Ga, Ge, Lu, Nd, Pr, Tb, Tm Sc, Y and decrease CAPEX by 10%
• Case 5. Increase Revenue by 10%
• Case 6. Co-location with conversion to individual oxides
• Case 7. represents 2015 REE prices Increase revenue by 25%

Project Schedule – Remaining Items
3/27/2017 31
• Task 4 – Laboratory tests for bench-scale design parameters (March/April)
• Task 5 – Bench-scale system design (April)

AcknowledgementsProject Team Members• Dan Laudal, UND• Dan Palo, Barr Engineering• Shane Addleman, PNNL• Ned Kruger, NDGSProject Sponsor Representatives• Chuck Miller, NETL• Mike Holmes and Mike Jones, LEC/NDIC• Dennis James, NA Coal• Charlie Bullinger and Sandra Broekema, GRE
3/27/2017 32

DISCLAIMER This document was prepared as an account of work sponsored by an agency ofthe United States Government. Neither the United States Government nor anyagency thereof, nor any of their employees, makes any warranty, express orimplied, or assumes any legal liability or responsibility for the accuracy,completeness, or usefulness of any information, apparatus, product, or processdisclosed, or represents that its use would not infringe privately owned rights.Reference herein to any specific commercial product, process, or service by tradename, trademark, manufacturer, or otherwise does not necessarily constitute orimply its endorsement, recommendation, or favoring by the United StatesGovernment or any agency thereof. The views and opinions of authors expressedherein do not necessarily state or reflect those of the United States Governmentor any agency thereof.
3/27/2017 2

Questions?
3/27/2017 34