The Fabrication of Nanostructures on Polydimethylsiloxane ...

AR T I C L E
Investigation of porous polydimethylsiloxane structureswith tunable properties induced by the phase separationtechnique
Mohammad Abshirini1 | Mrinal C. Saha1 | M. Cengiz Altan1 | Yingtao Liu1 |
Laura Cummings2 | Thomas Robison2
1Materials Engineering, School ofAerospace and Mechanical Engineering,The University of Oklahoma, Norman,Oklahoma, USA2Department of Energy, Kansas CityNational Security Campus, Kansas City,Missouri, USA
CorrespondenceMrinal C. Saha, University of Oklahoma,Aerospace and Mechanical Engineering,865 Asp Avenue, Norman, OK 73019,USA.Email: [email protected]
Funding informationNational Nuclear Security Administration,Grant/Award Number: DE-NA0002839
Abstract
This article reports the fabrication and characterization of porous
polydimethylsiloxane (PDMS) structures developed by the solvent evaporation-
induced phase separation technique. Ternary systems containing water/
tetrahydrofuran (THF)/PDMS with various concentrations are produced
to form a stable solution. The porous PDMS structures are formed by
removing the solvent (THF) and nonsolvent (water) phases during the
stepping heat treatment procedure. The analytical ternary phase diagram
is constructed based on the thermodynamic equilibrium state in the poly-
mer solution to explain the stable/unstable formulations and the possible
composition change path. The results show that the isolated pores with
the adjustable pore size ranging from 330 to 1900 μm are obtained by tun-
ing the water to the THF ratio. The mechanical properties of the porous
PDMS structures are determined by conducting the tensile tests on the
prepared dog bone-shaped specimens. A wide range of elastic modulus
ranging between 0.49 and 1.05 MPa was achieved without affecting the
density of the porous sample by adjusting the solvent and non-solvent con-
tent in the solution. It is shown that the flexibility of the porous structures
can be improved by reducing the ratio of water to THF and decreasing the
PDMS content. The porosity measurements reveal that the PDMS concen-
tration is the major phase controlling the porosity of the structure, while
the effect of water/THF is negligible.
KEYWORD S
emulsion polymerization, mechanical properties, microscopy, phase behavior, porous materials
1 | INTRODUCTION
Porous polymers have attracted significant attentiondue to their excellent properties, such as large surfacearea, high flexibility, and high-adsorption capacity. Thedemands for porous polymers in novel applications have
been increased recently, including applications for energystorage, oil/water or gas separation, biomedical devices,and wearable electronics.1–5 It is reported that differentfabrication techniques can result in distinct porous prop-erties.6 For example, highly interconnected porous struc-tures can be fabricated using the direct templating
Received: 9 September 2020 Revised: 18 February 2021 Accepted: 20 February 2021
DOI: 10.1002/app.50688
J Appl Polym Sci. 2021;138:e50688. wileyonlinelibrary.com/journal/app © 2021 Wiley Periodicals LLC. 1 of 13
https://doi.org/10.1002/app.50688

technique, while phase separation can result in the porous,cellular framework. Conventional methods for synthesizingthe porous polymers include phase separation,7 directtemplating,3 emulation templating,8 and breath figure.9 Theappropriate fabrication process should be selected based onthe desired properties.
Phase separation is one of the most reliable tech-niques for the manufacturing of porous polymers.10
Compared to other methods, the main advantage of thistechnique is that the pore size is not limited to the tem-plate size. Removing the templates after curing the poly-mer is also not required, making the approach simpleand straightforward. Moreover, phase separation is asurfactant-free technique. Hence, there is no adverseimpact of the surfactant on the polymer's mechanicalproperties, and the effort to remove the surfactant aftercuring is not necessary here. This method can be classi-fied into four groups based on the mechanism of induc-ing phase separation: solvent evaporation-inducedphase separation (EIPS), thermally induced phase sepa-ration, nonsolvent-induced phase separation, and vapor-induced phase separation. EIPS is known as a promisingapproach for developing both three-dimensional struc-tures and membranes.6 In this method, polymer andnon-solvent phases with different solubility in a solventare mixed to create a homogeneous single-phase solu-tion. Then, by solvent evaporation, the stable system ischanged into two phases of polymer-rich and polymer-lean.11 The nonsolvent enriched droplets are formedand grow in the polymer-rich area with the nucleationand growth (NG) mechanism. The isolated cellularpores are developed by removing the large nonsolventdroplets and subsequent solidification of the continuouspolymer domain.
Polydimethylsiloxane (PDMS) is an organic andnontoxic silicon-based elastomer, recognized for its out-standing properties, such as mechanical performance,chemical, thermal stability, and biocompatibility. Thismaterial has been widely used in various fields, includingflexible strain sensors,12,13 optical applications,14 and bio-medical applications.15 Recently, the fabrication of theporous PDMS-based structures has received increasingconsiderations because of two primary purposes. In thefirst category, the porous PDMS is beneficial for specificapplications, such as oil/water separation3 or storage.16
In the second group, by fabrication of the porous struc-ture, the performance of the PDMS-based materials areimproved compared to the solid PDMS structures. Forexample, it has been reported that the porous PDMS hashigher flexibility compared to the bulk, nonporous mate-rial.17 Besides, it has been established that the porousPDMS-based nanocomposites used as strain sensors havehigher sensitivity compared to the solid one.18 Based on
the desired features, structures with different bulk poros-ity, pore size, and pore morphology can be producedusing PDMS as a primary polymer phase.
It is reported in the literature that the pore size distri-bution and pore morphology of porous polymers aredependent on the manufacturing method and the mate-rial used in the fabrication procedure. For example, theconcentration and the type of the solvent, nonsolvent,and polymer used in the EIPS can change the pore mor-phology of the composition.19 It has been shown that theambient condition during phase separation, such as aircirculation20 and the rate of solvent removal,21 can alsoaffect the pore morphology. Besides, the mechanicalproperties of the porous structures are different accordingto the porosity and the porous network. It is reportedthat different mechanical performances are desirablefor specific applications. For example, more flexibility isrequired for wearable electronics, while higher stiffness iscritical for biomedical engineering. Accordingly, a simplemethod for creating a porous structure with adjustablefeatures required for different applications is of greatimportance. It is essential to develop a formulation fordesigning porous structures with the desired properties,such as pore size and mechanical behavior.
This article reports a simple method for the synthesisof porous PDMS structures with tunable properties.Polymer solutions with various PDMS, water, and THFconcentrations were prepared, and the porous mediawas developed by removing solvent and nonsolvent dur-ing the stepping heat treatment. The ternary phase dia-gram of the three-phase system was also constructed,and the possible mass transfer paths were obtained. Theeffect of PDMS concentrations and water/THF contenton the pore size distribution, mechanical behavior, andporosity of the samples were investigated. Porous PDMSwith a wide range of pore size distribution and mechanicalproperties were fabricated by adjusting the nonsolvent/solvent ratio in the developed approach. The optimalmanufacturing parameters to achieve the desired prop-erties of the porous structures were evaluated.
2 | EXPERIMENTAL
2.1 | Materials
All the materials were used in this study as they received.As the polymer phase, SYLGARD 184 PDMS (base elasto-mer and hardener) was purchased from Dow Corningand was considered the polymer phase. Tetrahydrofuran(THF) purchased from Sigma-Aldrich was chosen as thesolvent phase. Deionized water (DI-water) was used asthe nonsolvent phase.
2 of 13 ABSHIRINI ET AL.

2.2 | Polymer solution preparation andmolding
The PDMS polymer solution was prepared by mixing thepolymer, solvent, and nonsolvent phases with different con-centrations. The whole process of the solution preparationand molding is depicted in Figure 1. First, water was mixedwith the PDMS base elastomer at 1000 RPM using a hotplate and magnetic stirrer bar. THF was added to the sys-tem in the next step. The solution was blended until a stableviscous mixture is reached, which can remain stable for sev-eral weeks without any phase separation. Before molding,the PDMS curing agent (part B) with the ratio of part A toB (10:1) was added and blended for 20 min using a mechan-ical shear mixer at 2000 RPM.
The prepared polymer solution was poured into a cus-tomized mold. The mold was prepared in the form of a win-dow frame (170 × 120 mm2) using a 1.5 mm thick metalshim. The metal frame was secured on a flat metal surface,and the viscous mixture was then poured inside the mold.The poured material was flattened smoothly using a bakingscraper tool. The tool was moved in one direction to mini-mize entrapped air. Next, the mold was covered using ametal plate and placed inside the oven for solvent evapora-tion and polymer curing using a stepped heating procedure.During the first step, the oven was heated to 50�C for90 min. During this step, the viscosity of the polymer solu-tion was increased, and THF started to evaporate slowly.During the second step, the temperature was raised to 65�C(close to THF boiling point of 67�C22), and all the solventwas evaporated. The phase separation was induced in thisstep. The sample was kept at 97�C for 180 min (close to theboiling point of water) to remove the nonsolvent phase
(water). Then, the sample was kept at 120�C to reach a con-stant weight to ensure that all the THF/water were evapo-rated and the PDMS was completely cured.
Several formulations were developed in three differ-ent categories to explore the effect of different phasesin the ternary system on the properties of the porousstructure. In the first group, a constant PDMS concen-tration of 40 wt% was chosen, and the ratio of water toTHF (α) was varied from 1 to 8. The same α with the60 wt% PDMS was considered for the second category.In the third group, multiple PDMS concentrationsranging from 20 to 80 wt% and the constant α = 2 wereprepared. All the formulations developed for furtheranalysis are listed in Table 1.
2.3 | Characterization
The porous PDMS sheets were examined to evaluate theeffect of the proposed formulation on the porous struc-ture, including pore size distribution, mechanical proper-ties, and porosity measurement.
2.3.1 | Pore size distribution
The microscope imaging was performed to determine thepore size distribution and obtain the average pore size ofthe fabricated samples. Accordingly, the Leica SP8 laserscanning confocal microscope was utilized to take theimages. For each case, several microscope images were cap-tured from different locations of multiple samples. Thenumber of pores explored in each sample was differentbased on the size of the pores. Generally, at least 30 poreswere analyzed for each case. The captured images wereevaluated using ImageJ open-source software. The area ofthe pores in the microscope images was obtained. Then, thepost-processing analysis was performed to calculate theaverage equivalent diameter and the SD.
2.3.2 | Mechanical properties
The mechanical properties of the porous PDMS struc-tures were evaluated by tensile tests. The dogbone-shapedsamples following ASTM standard D41223 were cut fromthe porous sheets by utilizing a customized cutting dieand mechanical press. Photograph of the cutting die andthe schematic of the samples with the dimensions(in mm) are depicted in Figure 2(a),(b), respectively. Thetensile displacement loading with the rate of 500 mm/min was carried out using the Instron uniaxial testmachine until complete fracture.
FIGURE 1 Schematic showing the preparation of polymer
solution and molding. PDMS, polydimethylsiloxane; THF,
tetrahydrofuran [Color figure can be viewed at
wileyonlinelibrary.com]
ABSHIRINI ET AL. 3 of 13

2.3.3 | Porosity
The porosity (void fraction) of the porous samples wascharacterized using an analytical balance and measuringtools. In this regard, the volume of the samples with themass of (M), thickness of (h), length of (l), and width of (b)was calculated by measuring the dimensions from multi-ple points utilizing a digital micrometer. The porosity (ε)of the specimens was determined using Equation (1).24
ε=Vpores
V tot= 1−
ρporousρpolymer
, ð1Þ
where Vtot and Vpores are the total volumes of the speci-mens and the volume of the pores, ρporous is the density
of the porous sample calculated from the volume andmass of the specimens, and ρpolymer is the PDMS densityobtained using a pycnometer (AccuPyc II 1340, Micro-meritics Instrument Corp., GA), respectively. Therelative uncertainty of the porosity measured usingEquation (1) can be calculated based on the followingequation.
Δεε
=1
ρpolymer
!ΔMM
+Δhh
+Δll+Δbb
� �, ð2Þ
where ΔM = 0.0001 g and Δh = Δl = Δb = 0.002 mmbased on the accuracy of the analytical balance and thedigital micrometer used for the measurement.
2.4 | Ternary phase diagram
The analytical ternary phase diagram describing the pos-sible miscible, unstable, and composition change ofwater/THF/PDMS was constructed. The thermodynamicbehavior of the polymer solution can be described withthe classical Flory-Huggins model.25 Tompa26 extendedthis approach to mathematically explain the ternary mix-ture containing nonsolvent (1), solvent (2), and polymer(3) phases. Based on this method, the Gibbs free energyfor such a mixture can be written as,
ΔGM
RT= n1lnϕ1 + n2lnϕ2 + n3lnϕ3 + n1ϕ2χ12 +n2ϕ3χ23 + n1ϕ3χ13,
ð3Þ
where T is the absolute temperature, R is the gas con-stant; ni and ϕi (i = 1, 2, 3) describe the number of moles,and the volume fraction of component i, respectively; χijdenotes the interaction parameter of a binary phase (i)/phase ( j). The nonsolvent, solvent, and polymer phasesare described with the subscripts 1, 2, and 3, respectively.By knowing the interaction parameters for a ternarypolymer solution, the phase diagram map containingbinodal and spinodal curves can be obtained. The chemi-cal potential of components in a mixture can be extractedfrom Equations (4–6).27
TABLE 1 Different formulations of the prepared polymer
solution
Category Case number PDMS (wt%) Water/THF ratio
I 1 40 1
2 40 2
3 40 3
4 40 4
5 40 6
6 40 8
II 7 60 1
8 60 2
9 60 3
10 60 4
11 60 6
12 60 8
III 13 20 2
14 30 2
15 40 2
16 50 2
17 60 2
18 70 2
19 80 2
Abbreviations: PDMS, polydimethylsiloxane; THF, tetrahydrofuran.
FIGURE 2 (a) Cutting die
used to cut the samples,
(b) schematic and dimensions of
the dog bone-shaped sample
(dimensions are in mm) [Color
figure can be viewed at
wileyonlinelibrary.com]
4 of 13 ABSHIRINI ET AL.
Δμ1RT
= lnϕ1 + 1−ϕ1−ν1ν2ϕ2−
ν1ν3ϕ3
+ χ12ϕ2 + χ13ϕ3ð Þ ϕ2 +ϕ3ð Þ
−χ23ν1ν2ϕ2ϕ3−u1u2ϕ2
dχ12du2
� �
−ϕ1ϕ32 dχ13
dϕ3
� �−ν1ν2ϕ2ϕ3
2 dχ23dϕ3
� �,
ð4Þ
Δμ2RT
= lnϕ2 + 1−ϕ2−ν2ν1ϕ1−
ν2ν3ϕ3
+ χ12ν2ν1ϕ1 + χ23ϕ3
� �ϕ1 +ϕ3ð Þ−χ13
ν2ν1ϕ1ϕ3
+ u1u2ν2ν1ϕ1
dχ12du2
� �−ν2ν1ϕ1ϕ3
2 dχ13dϕ3
� �−ϕ2ϕ3
2 dχ23dϕ3
� �,
ð5Þ
Δμ3RT
= lnϕ3 + 1−ϕ3−ν3ν1ϕ1−
ν3ν2ϕ2
+ χ13ν3ν1ϕ1 + χ23
ν3ν2ϕ2
� �ϕ1 +ϕ2ð Þ−χ12
ν3ν1ϕ1ϕ2
+ν3ν1ϕ1
dχ13dϕ3
� �+ν3ν2ϕ2
dχ23dϕ3
� �� �ϕ3 ϕ1 +ϕ2ð Þ,
ð6Þ
where Δμi is the potential chemical difference betweenthe pure state and the mixture for component i, u1 = ϕ1/(ϕ1 + ϕ2) and u2 = ϕ2/(ϕ1 + ϕ2) are the pseudo-binarymixture, respectively.
2.4.1 | Binodal curve
Based on the nature of the binodal curve, the chemicalpotential of the polymer-rich zone and polymer-lean zoneare in equilibrium described by,
Δμið ÞI = Δμið ÞII i=1,2,3, ð7Þ
where I and II denote the polymer-rich and polymer-lean,respectively. There are six unknows, including (ϕ1, ϕ2, ϕ3)
I
and (ϕ1, ϕ2, ϕ3)II. The binodal curve can be constructed by
multiple tie lines connecting two related nodes (one forpolymer-rich and one for the polymer-lean phase). Inaddition to three equations obtained by substitutingEquations (4–6) in Equation (7), there are two otherrelations based on the material balance at the polymer-rich and polymer-lean phase shown in Equation (8).X
ϕ1,ϕ2,ϕ3ð ÞI =X
ϕ1,ϕ2,ϕ3ð ÞII =1 i=1,2,3, ð8Þ
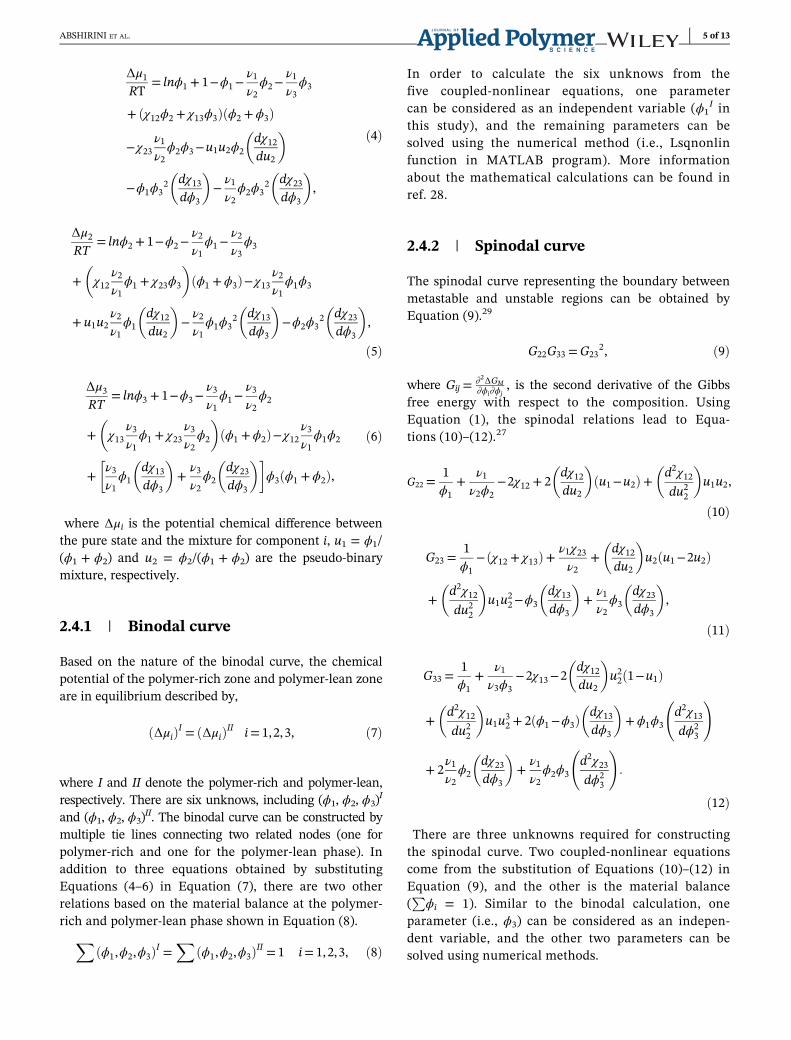
In order to calculate the six unknows from thefive coupled-nonlinear equations, one parametercan be considered as an independent variable (ϕ1
I inthis study), and the remaining parameters can besolved using the numerical method (i.e., Lsqnonlinfunction in MATLAB program). More informationabout the mathematical calculations can be found inref. 28.
2.4.2 | Spinodal curve
The spinodal curve representing the boundary betweenmetastable and unstable regions can be obtained byEquation (9).29
G22G33 =G232, ð9Þ
where Gij =∂2ΔGM∂ϕi∂ϕj
, is the second derivative of the Gibbsfree energy with respect to the composition. UsingEquation (1), the spinodal relations lead to Equa-tions (10)–(12).27
G22 =1ϕ1
+ν1
ν2ϕ2−2χ12 + 2
dχ12du2
� �u1−u2ð Þ+ d2χ12
du22
� �u1u2,
ð10Þ
G23 =1ϕ1
− χ12 + χ13ð Þ+ ν1χ23ν2
+dχ12du2
� �u2 u1−2u2ð Þ
+d2χ12du22
� �u1u
22−ϕ3
dχ13dϕ3
� �+ν1ν2ϕ3
dχ23dϕ3
� �,
ð11Þ
G33 =1ϕ1
+ν1
ν3ϕ3−2χ13−2
dχ12du2
� �u22 1−u1ð Þ
+d2χ12du22
� �u1u
32 + 2 ϕ1−ϕ3ð Þ dχ13
dϕ3
� �+ϕ1ϕ3
d2χ13dϕ2
3
!
+2ν1ν2ϕ2
dχ23dϕ3
� �+ν1ν2ϕ2ϕ3
d2χ23dϕ2
3
!:
ð12Þ
There are three unknowns required for constructingthe spinodal curve. Two coupled-nonlinear equationscome from the substitution of Equations (10)–(12) inEquation (9), and the other is the material balance(P
ϕi = 1). Similar to the binodal calculation, oneparameter (i.e., ϕ3) can be considered as an indepen-dent variable, and the other two parameters can besolved using numerical methods.
ABSHIRINI ET AL. 5 of 13

2.4.3 | Interaction parameters
As described above, three interaction parameters arerequired to find the binodal and spinodal curves. Gener-ally, the solvent-polymer binary interaction parameter(χ23) is not dependent on the volume fraction of the com-ponents.30 There are several experimental techniques tomeasure χ23, including gas–liquid equilibrium, osmoticpressure, and light scattering. The value of χ23 = 0.48 isreported in the literature for the THF/PDMS system at20�C.31 The nonsolvent-polymer binary interactionparameter (χ13) is usually calculated by the equilibriumswelling measurement.32 The nonsolvent phase diffusesin the polymer phase until the equilibrium state betweenthe chemical potential of the liquid inside the polymerand the liquid phase is achieved. According to the Florye-Rehner theory, χ13 is dependent on the polymer concen-tration and can be expressed with Equation (13).33,34
χ13 = −ln 1−ϕ3ð Þ+ϕ3
ϕ32 : ð13Þ
The non-solvent/solvent binary interaction parameter (χ12)depends on the u2 pseudo-binary mixture at different tem-peratures, which can be calculated from Equation (14).35
χ12 = α0 +β0
1−γ0u2, ð14Þ
where α0, β0, and γ0 are temperature-dependent parame-ters. The value of 0.720, 0.764, and 0.531are reported forwater/THF system at 20�C, respectively.35
3 | RESULTS AND DISCUSSIONS
3.1 | Phase diagram
The parameters required for constructing the phasediagram were calculated based on the numericalmethod described before. The thermodynamic ternaryphase diagram for water/THF/PDMS is illustrated inFigure 3. The binodal and spinodal curves divide thephase map into three different regions. Region (A) isthe homogenous domain where the mixture is stable.The area between spinodal and binodal curves (B) iscalled the metastable zone, while region (C) indicatesthe unstable area. The intersection of these two curves,called critical point (CP) is shown in this figure. TheCP for the water/THF/PDMS system was obtained as39.6/52/8.4. The region above the CP is related to thepolymer-rich zone, and the underneath area is thepolymer-lean phase.
Two scenarios can be attributed to the phase separa-tion mechanism based on the phase diagram's precipita-tion path, as demonstrated in Figure 3. The NG is theprimary mechanism in the first scenario, where the com-position slowly passes a line from a homogeneous regionto the metastable domain (Path 1). The composition fol-lows path 1 until all the solvent is evaporated (zero-THFedge). Then, water is removed from the system, and thecomposition moves toward the polymer section of thephase diagram on the zero-THF edge. The final porousstructure, in this case, is the isolated cellular pores in thepolymer matrix.35 The nature of the phase separation isdifferent based on the composition change path on thebinodal curve. If the path is above the CP, the nonsolventenriched droplets are formed in the polymer-lean area.Then, these droplets merge and grow by the concentra-tion gradient until the polymer-rich phase solidifies. Ifthe composition path is located below the CP, the iso-lated droplets of the polymer-rich phase are formed. Sim-ilarly, the droplets are driven to grow until the polymerphase solidifies.36
In the second scenario, the mechanism of the poreformation is spinodal decomposition (SD) if the composi-tion path passes the CP (Path 2) leads to the liquid–liquiddemixing in the unstable region. The composition pathreaches the zero-THF edge and then moves up to thepolymer section during the water removal. Continuouspore structure with interconnected networks is formed bythe SD mechanism.37 Considering the solvent evapora-tion procedure and the location of the CP in the ternarydiagram, it can be claimed that NG is the pore formation
FIGURE 3 Ternary phase diagram for water/THF/PDMS
system showing the possible mass-transfer path leading to porous
structures. PDMS, polydimethylsiloxane; THF, tetrahydrofuran
[Color figure can be viewed at wileyonlinelibrary.com]
6 of 13 ABSHIRINI ET AL.

mechanism of the water/THF/PDMS formulations usedin this study. For the same reason, it can be claimed thatthe NG of water-enriched droplets occurs in the polymer-rich domain.
3.2 | Pore size distribution
The microscope images captured from the porous sam-ples for groups 1 and 2 with different α are illustrated inFigures 4 and 5, respectively. The isolated pores with thecircular shape in dark colors are observed in theseimages, while the cured PDMS is the continuous shape inthe bright color. It can be seen that NG of the water-enriched droplets was the mechanism of the pore forma-tion. The pore formation mechanism can also beexplained by the ternary phase diagram (Figure 3), as allthe formulations used in this study have a polymer con-centration far above the CP (PDMS>8.4%). The dropletswere formed in the polymer-rich domain during thephase separation procedure, leading to the isolatedporous structure. After coalescence and creating largerdroplets, a thin film of PDMS covered the droplets due tothe higher surface tension of the water compared to thepolymer-rich solution. Then, the water was removed dur-ing the heat treatment resulted in hollow cellular poresin the structure.
Based on the microscope images, a higher water/THFratio caused larger pore sizes in both 40% and 60% PDMScategories. Multiple pores were seen through the thick-ness for the samples with α = 3, 4, 6, and 8, while onlyone pore was observed through the thickness for the sam-ples with α = 1 and 2. The equivalent diameter of thepores was measured using the ImageJ software. The aver-age pore size for the samples with 40% and 60% with dif-ferent α are given in Figure 6(a),(b), respectively. It canbe observed that the average pore size in both groups wasdecreased by increasing the parameter α. The increasedamount of solvent in a smaller value of α reduced the vis-cosity of the solution. Hence, the water droplets hadmore mobility to coalesce and create larger droplets, lead-ing to larger pore sizes. It should be noted that there wasa limitation in increasing the water/THF ratio. Bothexperiments and the ternary phase diagram showed thatthe value of α greater than 8 resulted in an unstablemixture.
Similar pore sizes can be seen in Figure 6(a),(b) bykeeping the water/THF ratio consistent in the sampleswith 40% and 60% PDMS concentrations. In order toprove this claim, the average pore size for the third groupof the formulation is calculated, as shown in Figure 7.Various PDMS concentrations with α = 2 resulted in sim-ilar pore sizes. Hence, it can be concluded that the water/THF ratio is the parameter controlling the pore size in
FIGURE 4 Microscope images showing the pore distribution for the samples with 40% PDMS and (a) α = 8, (b) α = 6, (c) α = 4, (d)
α = 3, (e) α = 2, (f) α = 1. PDMS, polydimethylsiloxane
ABSHIRINI ET AL. 7 of 13

different polymer concentrations. A slight increase inpore size for lower PDMS could be due to the lower vis-cosity of the mixture compared to higher polymer weight.Moreover, the pore size distribution for the samples with40% PDMS and α = 3, α = 4 are shown as examples inFigure 8(a),(b), respectively. Both larger and smallerpores compared to the average size were observed, whilethe majority of the pores are in the average range.
It should be noted that three samples of the 19 pre-pared water/THF/PDMS mixture did not result in a
porous structure. There was not a stable solution in casenumber 13 (PDMS = 20%, α = 2), while no pores werecreated by solvent evaporation in case numbers 18(PDMS = 70%, α = 2) and 19 (PDMS = 80%, α = 2). Inorder to justify the failure of these points, their formula-tions were plotted in the ternary diagram, as shown inFigure 9. It is obvious that case number 13 is located inan unstable region and could not result in a stable solu-tion. Besides, the possible composition path change forcase numbers 18, 19 shown in Figure 9 did not intercept
FIGURE 5 Microscope images showing the pore distribution for the samples with 60% PDMS and (a) α = 8, (b) α = 6, (c) α = 4, (d)
α = 3, (e) α = 2, (f) α = 1. PDMS, polydimethylsiloxane
FIGURE 6 The average pore size obtained for (a) 40% PDMS and (b) 60% PDMS with different water/THF ratio (α). PDMS,
polydimethylsiloxane; THF, tetrahydrofuran [Color figure can be viewed at wileyonlinelibrary.com]
8 of 13 ABSHIRINI ET AL.

the binodal curve, leading to PDMS solidification withoutany pore formation.
3.3 | Mechanical behavior
The dogbone-shaped samples were tested under tensileloading, and the mechanical behavior of the porousstructures was determined. As an example, preparedsamples with 40% PDMS and α = 1, 2, 3, 4, and thenonporous PDMS before and after the tensile test areshown in Figure 10(a),(b), respectively. The stress–strain curves showing the mechanical behavior of theporous structures with 40% PDMS, 60% PDMS and
different α are illustrated in Figure 11. According tothis figure, the porous PDMS samples in both groupsbecame stiffer as the water/THF ratio increased. Theelastic modulus of the samples was calculated fromthe stress–strain curves. It was observed that for thesamples with the same polymer concentration (40%PDMS), a wide range of elastic modulus increasingfrom 0.49 MPa (α = 1) to 1.05 MPa (α = 8) wasachieved by raising the nonsolvent/solvent content.
For a better comparison, the strain of the sampleswith 40% PDMS at the 0.18 MPa stress is shown inFigure 12(a). Higher deformation in the samples with alower water/THF ratio (larger pore size) can be seen inthis figure. Moreover, the stress of the specimens with60% PDMS at the 0.4 mm/mm strain is compared inFigure 12(b). A higher stress value can be observed forthe porous PDMS samples with a smaller pore size(higher water/THF ratio). The stiffness is controlled bythe solid phase, which is the pore's wall in the porousnetwork. The porous structure with smaller pores had ahigher ability to sustain the flow stress as the number ofpores along the width was improved by increasing thewater/THF ratio. In other words, the samples with largerpore sizes showed higher deformation, indicating moreflexible behavior than the specimens with small poresizes.
In order to demonstrate the effect of PDMS concen-tration on the mechanical performance of the poroussheet, the stress–strain of specimens with constant α = 2and different PDMS concentrations is displayed inFigure 13(a). According to this figure, higher PDMS con-centration resulted in increased stiffness. By comparingthe strain of the samples at 0.2 MPa stress in Figure 13(b), it was revealed that lower PDMS concentrationshowed higher deformation. For example, the strain of
FIGURE 7 The average pore size for the samples with α = 2
and different PDMS concentrations. PDMS, polydimethylsiloxane;
THF, tetrahydrofuran [Color figure can be viewed at
wileyonlinelibrary.com]
FIGURE 8 The pore size distribution for samples with 40% PDMS and (a) α = 3, (b) α = 4. PDMS, polydimethylsiloxane [Color figure
can be viewed at wileyonlinelibrary.com]
ABSHIRINI ET AL. 9 of 13

0.43 mm/mm was observed for the sample with 30%PDMS, which was 34.8% higher than the strain in thesample with 60% PDMS. Besides, the strain in the sample
with 30% PDMS was 258% higher than the nonporousPDMS, indicating the enhanced flexibility of the porousPDMS structure.
3.4 | Porosity measurement
The porosity of the fabricated specimens was calculatedusing Equation (1). The porosity and the relative uncer-tainty of the measurement for a representative samplewith l = 10.014 mm, b = 10.113 mm, h = 1.434 mm, andM = 0.0598 g were calculated as ε = 0.6002 andΔε/ε = 0.0034 based on Equation (1) and (2). Hence, theuncertainty of the measurement for this representativesample was found as Δε = 0.0020. The porosity measure-ments for the samples with 40% and 60% PDMS and vari-ous α are illustrated in Figure 14. Multiple samples wereexplored, and the standard deviation is obtained, asshown in this figure. Based on this figure, the porosity ofthe PDMS samples did not change by altering the water/THF ratio in both groups.
It can be concluded that a larger number of poreswere formed in the sample with larger α (smaller pore
FIGURE 9 Location of the failed formulation to create porous
media on the ternary phase diagram. PDMS, polydimethylsiloxane
[Color figure can be viewed at wileyonlinelibrary.com]
FIGURE 10 The samples
used for the tensile tests,
(a) before testing and (b) failed
samples [Color figure can be
viewed at
wileyonlinelibrary.com]
FIGURE 11 The stress–strain curve for the samples with different α and (a) 40%, (b) 60% PDMS concentrations. PDMS,
polydimethylsiloxane [Color figure can be viewed at wileyonlinelibrary.com]
10 of 13 ABSHIRINI ET AL.

size), making the void fraction a constant value. As it wasshown in the microscopy images, larger spaces with nopores were seen for the samples with lower PDMS
concentration. This can be verified from Figure 14, as theporosity of the samples with 40% PDMS is higher than60% PDMS.
FIGURE 12 (a) Strain for the samples with 40% PDMS at the stress of 0.18 MPa and (b) stress for the samples with 60% PDMS at the
strain of 0.4 mm/mm. PDMS, polydimethylsiloxane; THF, tetrahydrofuran [Color figure can be viewed at wileyonlinelibrary.com]
FIGURE 13 (a) Stress–strain curve for the samples
with α = 2 and different PDMS
concentrations and
(b) comparing the strains at
0.2 MPa stress for the samples
with different PDMS weight.
PDMS, polydimethylsiloxane
[Color figure can be viewed at
wileyonlinelibrary.com]
FIGURE 14 (a) The porosity of the samples with 40% and 60% PDMS and various α and (b) comparing the porosity of the specimens
with α = 2 and different PDMS concentrations. PDMS, polydimethylsiloxane [Color figure can be viewed at wileyonlinelibrary.com]
ABSHIRINI ET AL. 11 of 13

4 | CONCLUSION
The fabrication and analysis of porous PDMS struc-tures formed by solvent EIPS were discussed in thisarticle. Different formulations of polymer solutionswith various PDMS concentrations and water/THFratios were investigated. The analytical ternary phasediagram in the water/THF/PDMS system was con-structed to determine the stable, unstable, and metasta-ble regions and the binodal, spinodal curves. It wasshown that a phase diagram is an effective tool forpredicting the stable/unstable formulations and thepossible mass transfer path leading to PDMS sampleswith various porosity levels and pore sizes. The fabri-cated porous samples were analyzed to evaluate thepore size distribution, mechanical properties, andporosity microstructure. The isolated pores with theaverage pore size ranging from 330 to 1900 μm wereobtained from NG of the water enriched droplets in thePDMS-rich domain. It was observed that in the formu-lations with the same PDMS concentration, the averagepore size was decreased by raising the water/THF ratio.However, a similar pore size was achieved by changingthe PDMS concentrations from 30% to 60% and keepingthe water/THF ratio a fixed parameter.
Besides, the tensile tests of prepared samples rev-ealed that increasing the water/THF ratio at a con-stant PDMS concentration can increase the stiffness ofthe porous PDMS structures. The porous structurewith smaller pores had a higher ability to sustain theflow stress as the number of cells across the width wasimproved by increasing the water/THF ratio. In otherwords, the samples with larger pore sizes showedhigher deformation, indicating more flexible behaviorthan the specimens with small pore sizes. This studyshowed that a wide range of elastic modulus rangingbetween 0.49 and 1.05 MPa could be achieved in thesamples with the same density by adjusting the sol-vent and non-solvent content in the solution. Compar-ing the samples with different PDMS concentrationsand the same water/THF ratio, it was evident thathigher polymer weight can result in increased stiff-ness. It was shown the strain in a sample with 30%PDMS is 34.8% higher than the sample with 60%PDMS and 258% higher than the bulk, nonporousPDMS. Moreover, the porosity of the fabricated struc-ture was evaluated by measuring the void fraction ofthe samples. It was observed that higher PDMS con-centration leads to lower porosity. The results indi-cated that the porosity of the samples could becontrolled by the polymer concentration, while a neg-ligible effect was observed from changing the non-solvent/solvent ratio.
ACKNOWLEDGMENTSThis work is funded by the Department of Energy'sKansas City National Security Campus, operated byHoneywell Federal Manufacturing & Technologies, LLC,under contract number DE-NA0002839.
ORCIDMrinal C. Saha https://orcid.org/0000-0001-8682-6644
REFERENCES[1] J. Duan, W. Jin, S. Kitagawa, Coord. Chem. Rev. 2017, 332, 48.[2] C. Zhang, R. Kong, X. Wang, Y. Xu, F. Wang, W. Ren, Y.
Wang, F. Su, J.-X. Jiang, Carbon 2017, 114, 608.[3] S.-J. Choi, T.-H. Kwon, H. Im, D.-I. Moon, D. J. Baek, M.-L. Seol,
J. P. Duarte, Y.-K. Choi, ACS Appl. Mater. Interfaces 2011, 3, 4552.[4] H.-P. Hentze, M. Antonietti, Rev. Mol. Biotechnol. 2002, 90, 27.[5] S. Jung, J. H. Kim, J. Kim, S. Choi, J. Lee, I. Park, T. Hyeon,
D. H. Kim, Adv. Mater. 2014, 26, 4825.[6] D. Zhu, S. Handschuh-Wang, X. Zhou, J. Mater. Chem. A
2017, 5, 16467.[7] L. Xue, J. Zhang, Y. Han, Prog. Polym. Sci. 2012, 37, 564.[8] M. Tebboth, Q. Jiang, A. Kogelbauer, A. Bismarck, ACS Appl.
Mater. Interfaces 2015, 7, 19243.[9] G. Widawski, M. Rawiso, B. François, Nature 1994, 369, 387.[10] M. Ulbricht, Polymer 2006, 47, 2217.[11] A. K. Agrawal, M. Jassal, A. Sahoo, S. K. Garapati, J. Appl.
Polym. Sci. 2011, 119, 837.[12] M. Abshirini, M. Charara, Y. Liu, M. Saha, M. C. Altan, Adv.
Eng. Mater. 2018, 20, 1800425.[13] M. Abshirini, M. Charara, P. Marashizadeh, M. C. Saha, M. C.
Altan, Y. Liu, Appl. Nanosci. 2019, 9, 2071.[14] C.-H. Dong, L. He, Y.-F. Xiao, V. Gaddam, S. Ozdemir, Z.-F.
Han, G.-C. Guo, L. Yang, Appl. Phys. Lett. 2009, 94, 231119.[15] T. Yabuta, E. Bescher, J. Mackenzie, K. Tsuru, S. Hayakawa,
A. Osaka, J. Sol-Gel Sci. Technol. 2003, 26, 1219.[16] P. Thurgood, S. Baratchi, C. Szydzik, A. Mitchell, K.
Khoshmanesh, Lab Chip 2017, 17, 2517.
[17] W. Luo, M. Charara, M. C. Saha, Y. Liu, Appl. Nanosci. 2019,9, 1309.
[18] H. Lee, J. K. Yoo, J. H. Park, J. H. Kim, K. Kang, Y. S. Jung,Adv. Energy Mater. 2012, 2, 976.
[19] L. Cui, Y. Ding, X. Li, Z. Wang, Y. Han, Thin Solid Films 2006,515, 2038.
[20] M. Macchione, J. C. Jansen, E. Drioli, Desalination 2006, 192, 132.[21] S. A. McKelvey, W. J. Koros, J. Membr. Sci. 1996, 112, 29.[22] W. Hayduk, H. Laudie, O. H. Smith, J. Chem. Eng. Data 1973,
18, 373.[23] Standard, A., ASTM International: West Conshohocken, PA,
USA 10, 1 2013.[24] J. Jansen, M. Macchione, E. Drioli, J. Membr. Sci. 2005, 255, 167.[25] P. J. Flory, Principles of polymer chemistry, Cornell University
Press, Ithaca 1953.[26] H. Tompa, Trans. Faraday Soc. 1949, 45, 1142.[27] L. Yilmaz, A. McHugh, J. Appl. Polym. Sci. 1986, 31, 997.[28] F. W. Altena, C. Smolders, Macromolecules 1982, 15, 1491.[29] H. Tompa, Polymer solutions, Butterworths Scientific Publica-
tions, London 1956.[30] B. Barua, M. C. Saha, Polym. Eng. Sci. 2018, 58, 998.
12 of 13 ABSHIRINI ET AL.

[31] J. E. Mark, Physical properties of polymers handbook, Springer,New York 2007.
[32] J. Barzin, B. Sadatnia, Polymer 2007, 48, 1620.[33] L. Zeman, G. Tkacik, J. Membr. Sci. 1988, 36, 119.[34] M. Mulder, Basic principles of membrane technology, Springer
Science & Business Media, Netherlands 2012.[35] H. Fashandi, M. Karimi, Polymer 2012, 53, 5832.[36] L. Tan, D. Pan, N. Pan, J. Appl. Polym. Sci. 2008, 110, 3439.[37] J. Zhao, G. Luo, J. Wu, H. Xia, ACS Appl. Mater. Interfaces
2013, 5, 2040.
How to cite this article: Abshirini M, Saha MC,Altan MC, Liu Y, Cummings L, Robison T.Investigation of porous polydimethylsiloxanestructures with tunable properties induced by thephase separation technique. J Appl Polym Sci.2021;138:e50688. https://doi.org/10.1002/app.50688
ABSHIRINI ET AL. 13 of 13