INVESTIGATION OF PHYSICAL AND CHEMICAL DELAY PERIODS … · INVESTIGATION OF PHYSICAL AND CHEMICAL...
18
UNCLASSIFIED UNCLASSIFIED: Distribution Statement A. Approved for public release. Paper Number INVESTIGATION OF PHYSICAL AND CHEMICAL DELAY PERIODS OF DIFFERENT FUELS IN THE IGNITION QUALITY TESTER (IQT) Ziliang Zheng, Tamer Badawy, Naeim Henein Wayne State University Eric Sattler US Army RDECOM-TARDEC ABSTRACT This paper investigates the physical and chemical ignition delay (ID) periods in the constant volume combustion chamber of the Ignition Quality Tester (IQT). IQT was used to determine the Derived Cetane Number (DCN) according to ASTM D6890-10a standards. The fuels tested were ultra low sulfur diesel (ULSD), jet propellant-8 (JP-8), two synthetic fuels of Sasol IPK and F-T SPK (S-8). A comparison was made between the DCN and cetane number (CN) determined according to ASTM-D613 standards. Tests were conducted under steady state conditions at a constant pressure of 21 bar, and various air temperatures ranging from 778 K to 848 K. The rate of heat release (RHR) was calculated from the measured pressure trace and a detailed analysis of the RHR trace was made particularly for the autoignition process. Tests were conducted to determine the physical and chemical delay periods by comparing results obtained from two tests. In the first test, the fuel was injected into air according to ASTM standards. In the second test, the fuel was injected into nitrogen. The point at which the two resultant pressure traces separated was considered to be the end of the physical delay period. The effects of the charge temperature on the total ID as defined in ASTM D6890-10a standards, as well as on the physical and chemical delays were determined. It was noticed that the physical delay represented a significant part of the total ID over all the air temperatures covered in this investigation. Arrhenius plots were developed to determine the apparent activation energy for each fuel using different IDs. The first was based on the total ID measured according to ASTM standards. The second was the chemical delay determined in this investigation. The activation energy calculated from the total ID showed higher values for lower CN fuels except Sasol IPK. The activation energy calculated from the chemical delay period showed consistency in the increase of the activation energy with the drop in CN including Sasol IPK. The difference between the two findings could be explained by examining the sensitivity of the physical delay period of different fuels to the change in air temperature. 1. Introduction The autoignition of fuel-air mixtures in diesel engines has a strong impact on combustion, performance, fuel economy and engine-out emissions. The autoignition process includes overlapping physical processes that lead to the formation of an autoignitable mixture and chemical reactions that start the combustion process. Many efforts have been made to determine the effect of fuel properties on each of these processes, particularly with the increased interest in the use of renewable fuels to reduce the dependence on petroleum crude. Also, alternative fuels derived from petroleum crude and synthetic fuels are being considered for use in military diesel engines [1]. The separation between the physical and chemical processes has been known to be difficult to ascertain in diesel engines in part because of the complexity of the combustion chamber geometry which affect the fuel distribution, and the high turbulence in the charge that affects the processes of spray evaporation and mixing with the air [2, 3]. This is not the case in constant volume vessels where the charge is quiescent before start of injection. Furthermore, in engines the compressed air properties vary during the autoignition process which makes it difficult to determine the effect of the charge temperature and pressure on the ignition delay (ID) period. Many correlations between the ID period measured in engines and charge properties were developed considering the temperature and pressure at the start of injection [4, 5]. Other correlations considered the arithmetic mean pressure and temperature [6], or the integrated mean values [2, 7, 8] during the ID period. Such problems are reduced in constant volume vessels where the changes in the charge temperature and pressure during the ID period are much smaller than in engines. Other advantages of using constant volume vessels in the study of the autoignition process include the simplicity of the experimental setup and the smaller amount of fuel required for the experiment as compared to the engine setup and operation. Furthermore, it is feasible to run the experiment in the constant volume vessel by injecting the fuel into nitrogen [4, 9, 10] in order to differentiate between the physical and chemical processes, which would be very difficult and
Transcript of INVESTIGATION OF PHYSICAL AND CHEMICAL DELAY PERIODS … · INVESTIGATION OF PHYSICAL AND CHEMICAL...

UNCLASSIFIED
UNCLASSIFIED: Distribution Statement A. Approved for public release.
Paper Number
INVESTIGATION OF PHYSICAL AND CHEMICAL DELAY PERIODS OF DIFFERENT FUELS IN THE IGNITION QUALITY TESTER (IQT)
Ziliang Zheng, Tamer Badawy, Naeim Henein Wayne State University
Eric Sattler US Army RDECOM-TARDEC
ABSTRACT
This paper investigates the physical and chemical ignition delay (ID) periods in the constant volume combustion chamber of the Ignition Quality Tester (IQT). IQT was used to determine the Derived Cetane Number (DCN) according to ASTM D6890-10a standards. The fuels tested were ultra low sulfur diesel (ULSD), jet propellant-8 (JP-8), two synthetic fuels of Sasol IPK and F-T SPK (S-8). A comparison was made between the DCN and cetane number (CN) determined according to ASTM-D613 standards. Tests were conducted under steady state conditions at a constant pressure of 21 bar, and various air temperatures ranging from 778 K to 848 K. The rate of heat release (RHR) was calculated from the measured pressure trace and a detailed analysis of the RHR trace was made particularly for the autoignition process. Tests were conducted to determine the physical and chemical delay periods by comparing results obtained from two tests. In the first test, the fuel was injected into air according to ASTM standards. In the second test, the fuel was injected into nitrogen. The point at which the two resultant pressure traces separated was considered to be the end of the physical delay period. The effects of the charge temperature on the total ID as defined in ASTM D6890-10a standards, as well as on the physical and chemical delays were determined. It was noticed that the physical delay represented a significant part of the total ID over all the air temperatures covered in this investigation. Arrhenius plots were developed to determine the apparent activation energy for each fuel using different IDs. The first was based on the total ID measured according to ASTM standards. The second was the chemical delay determined in this investigation. The activation energy calculated from the total ID showed higher values for lower CN fuels except Sasol IPK. The activation energy calculated from the chemical delay period showed consistency in the increase of the activation energy with the drop in CN including Sasol IPK. The difference between the two findings could be explained by examining the sensitivity of the physical delay period of different fuels to the change in air temperature.
1. Introduction
The autoignition of fuel-air mixtures in diesel engines has a strong impact on combustion, performance, fuel economy and engine-out emissions. The autoignition process includes overlapping physical processes that lead to the formation of an autoignitable mixture and chemical reactions that start the combustion process. Many efforts have been made to determine the effect of fuel properties on each of these processes, particularly with the increased interest in the use of renewable fuels to reduce the dependence on petroleum crude. Also, alternative fuels derived from petroleum crude and synthetic fuels are being considered for use in military diesel engines [1]. The separation between the physical and chemical processes has been known to be difficult to ascertain in diesel engines in part because of the complexity of the combustion chamber geometry which affect the fuel distribution, and the high turbulence in the charge that affects the processes of spray evaporation and mixing with the air [2, 3]. This is not the case in constant volume vessels where the charge is quiescent before start of injection. Furthermore, in engines the compressed air properties vary during the autoignition process which makes it difficult to determine the effect of the charge temperature and pressure on the ignition delay (ID) period. Many correlations between the ID period measured in engines and charge properties were developed considering the temperature and pressure at the start of injection [4, 5]. Other correlations considered the arithmetic mean pressure and temperature [6], or the integrated mean values [2, 7, 8] during the ID period. Such problems are reduced in constant volume vessels where the changes in the charge temperature and pressure during the ID period are much smaller than in engines. Other advantages of using constant volume vessels in the study of the autoignition process include the simplicity of the experimental setup and the smaller amount of fuel required for the experiment as compared to the engine setup and operation. Furthermore, it is feasible to run the experiment in the constant volume vessel by injecting the fuel into nitrogen [4, 9, 10] in order to differentiate between the physical and chemical processes, which would be very difficult and

Report Documentation Page Form ApprovedOMB No. 0704-0188
Public reporting burden for the collection of information is estimated to average 1 hour per response, including the time for reviewing instructions, searching existing data sources, gathering andmaintaining the data needed, and completing and reviewing the collection of information. Send comments regarding this burden estimate or any other aspect of this collection of information,including suggestions for reducing this burden, to Washington Headquarters Services, Directorate for Information Operations and Reports, 1215 Jefferson Davis Highway, Suite 1204, ArlingtonVA 22202-4302. Respondents should be aware that notwithstanding any other provision of law, no person shall be subject to a penalty for failing to comply with a collection of information if itdoes not display a currently valid OMB control number.
1. REPORT DATE 03 NOV 2012
2. REPORT TYPE Journal Article
3. DATES COVERED 09-05-2011 to 18-09-2012
4. TITLE AND SUBTITLE INVESTIGATION OF PHYSICAL AND CHEMICAL DELAYPERIODS OF DIFFERENT FUELS IN THE IGNITION QUALITYTESTER (IQT)
5a. CONTRACT NUMBER W56HZV-04-2-0001
5b. GRANT NUMBER
5c. PROGRAM ELEMENT NUMBER
6. AUTHOR(S) Ziliang Zheng; Tamer Badawy; Naeim Henein; Eric Sattler
5d. PROJECT NUMBER
5e. TASK NUMBER
5f. WORK UNIT NUMBER
7. PERFORMING ORGANIZATION NAME(S) AND ADDRESS(ES) Wayne State University,5401 Cass Ave., ,Detroit,Mi,48202
8. PERFORMING ORGANIZATION REPORT NUMBER ; #23548
9. SPONSORING/MONITORING AGENCY NAME(S) AND ADDRESS(ES) U.S. Army TARDEC, 6501 East Eleven Mile Rd, Warren, Mi, 48397-5000
10. SPONSOR/MONITOR’S ACRONYM(S) TARDEC
11. SPONSOR/MONITOR’S REPORT NUMBER(S) #23548
12. DISTRIBUTION/AVAILABILITY STATEMENT Approved for public release; distribution unlimited
13. SUPPLEMENTARY NOTES

14. ABSTRACT This paper investigates the physical and chemical ignition delay (ID) periods in the constant volumecombustion chamber of the Ignition Quality Tester (IQT). IQT was used to determine the Derived CetaneNumber (DCN) according to ASTM D6890-10a standards. The fuels tested were ultra low sulfur diesel(ULSD), jet propellant-8 (JP-8), two synthetic fuels of Sasol IPK and F-T SPK (S-8). A comparison wasmade between the DCN and cetane number (CN) determined according to ASTM-D613 standards. Testswere conducted under steady state conditions at a constant pressure of 21 bar, and various airtemperatures ranging from 778 K to 848 K. The rate of heat release (RHR) was calculated from themeasured pressure trace and a detailed analysis of the RHR trace was made particularly for theautoignition process. Tests were conducted to determine the physical and chemical delay periods bycomparing results obtained from two tests. In the first test, the fuel was injected into air according toASTM standards. In the second test, the fuel was injected into nitrogen. The point at which the tworesultant pressure traces separated was considered to be the end of the physical delay period. The effects ofthe charge temperature on the total ID as defined in ASTM D6890-10a standards, as well as on the physicaland chemical delays were determined. It was noticed that the physical delay represented a significant partof the total ID over all the air temperatures covered in this investigation. Arrhenius plots were developed todetermine the apparent activation energy for each fuel using different IDs. The first was based on the totalID measured according to ASTM standards. The second was the chemical delay determined in thisinvestigation. The activation energy calculated from the total ID showed higher values for lower CN fuelsexcept Sasol IPK. The activation energy calculated from the chemical delay period showed consistency inthe increase of the activation energy with the drop in CN including Sasol IPK. The difference between thetwo findings could be explained by examining the sensitivity of the physical delay period of different fuelsto the change in air temperature.
15. SUBJECT TERMS
16. SECURITY CLASSIFICATION OF: 17. LIMITATIONOF ABSTRACT
Public Release
18. NUMBEROF PAGES
16
19a. NAME OFRESPONSIBLE PERSON
a. REPORT unclassified
b. ABSTRACT unclassified
c. THIS PAGE unclassified
Standard Form 298 (Rev. 8-98) Prescribed by ANSI Std Z39-18

UNCLASSIFIED
UNCLASSIFIED
expensive in engines. In a nitrogen environment, the chemical processes that occur are only the endothermic reactions.
The major parameters which affect the ID of conventional fuels in diesel engines are mainly the air temperature, air pressure [2, 4, 10] and the fuel molecular structure [3]. It has been found that the ID has higher sensitivity to changes in air temperature than changes in air pressure [2, 3]. Also, the sensitivity of the ID to changes in charge temperature and pressure increases with the drop in cetane number (CN) of the fuel [3]. Furthermore, the ignition quality of some alternative fuels does not always correlate well with CN [11-13] because of the wide range of their chemical and physical properties including composition, volatility, density and distillation [9, 14].
The aim of this investigation is to gain a better understanding of the effect of fuel properties on the physical and chemical parts of the ignition delay period at different charge temperatures. The experiments were conducted in the constant volume vessel of the IQT used in determining the Derived Cetane Number (DCN) according to ASTM D 6890-10a. Additionally, the Arrhenius plot was developed to determine the apparent activation energy of each fuel. The investigation covered the following fuels: (a) ultra low sulfur diesel (ULSD), considered as the baseline fuel, (b) jet propellant-8 (JP-8), a military petroleum based jet fuel [1, 13, 15, 16], (c) Sasol IPK, coal based Fischer-Tropsch catalytic process jet fuel [16] and (d) F-T SPK (S-8), natural gas based Fischer-Tropsch catalytic process jet fuel [15-18].
2. ASTM standards for cetane number
2.1 ASTM D613-10a to determine CN using the CFR engine
The cetane number of a fuel is determined in a variable compression ratio Cooperative Fuel Research (CFR) engine equipped with a movable plug in a cylindrical pre-chamber under a specified set of conditions [19]. The compression ratio of CFR engine is adjustable from 8:1 to 36:1 by using an external hand-wheel. The ID period is kept constant at 2.41 milliseconds which is equivalent to 13 crank angle degrees (CAD) at an engine speed of 900 rpm. The start of injection (SOI) is at 13 deg before top dead center (TDC), thus start of combustion (SOC) is always at TDC, with the intake air and cooling water temperatures at 65°C and 100°C respectively [3, 9, 11]. The injector nozzle opening pressure is 10.3±0.34 MPa. By definition, normal cetane (hexadecane C16H34) is assigned a CN of 100, whereas hepta-methyl-nonane (HMN) is assigned CN of 15 which defines the cetane number scale by the relationship [3, 11, 19]:
𝐶𝑒𝑡𝑎𝑛𝑒 𝑁𝑢𝑚𝑏𝑒𝑟 = %𝑛 𝑐𝑒𝑡𝑎𝑛𝑒 + 0.15(%𝐻𝑀𝑁) (1)
This test method has many disadvantages such as the need of a relatively large fuel sample, significant time consumption, difficulties in rating low ignition quality fuels [3] and reproducibility and repeatability problems [18, 19].
2.2 ASTM D6890-10a to determine DCN using the IQT
The DCN of a fuel is determined according to ASTM D6890 standard by using the Ignition Quality Tester (IQT) [20] and is widely used to rate the ignition quality of fuels for diesel engine. Also, DCN is considered as one of the critical properties in the investigation of surrogates for aviation fuels [21]. The tester consists of a constant volume cylindrical chamber, electrically heated and charged with high purity compressed air. The fuel sample is filtered prior to the test by using a syringe fitted with a disposable 5 μm filter and injected into a pre-heated, temperature-controlled air. A complete sequence comprises 15 preliminary tests followed by 32 tests. The values for the ID of the last 32 tests are averaged to obtain the result. This test method covers ID periods that range from 3.1 to 6.5 ms which correspond to 64 DCN and 33 DCN respectively. The following equation is used to calculate DCN from the measured ID.
𝐷𝐶𝑁 = 4.46 + (186.6/𝐼𝐷) (2)
For fuels that have ID shorter than 3.1 ms or longer than 6.5 ms, DCN can be calculated with less precision from Eqn. 3.
𝐷𝐶𝑁 = 83.99 × (𝐼𝐷 − 1.512)−0.658 + 3.547 (3)
The IQT test is simpler than the CFR engine test because it requires a small fuel sample of approximately 100 mL and the test time is approximately 20 min on a fit-for-use instrument [20, 22]. In addition, the IQT test has a higher repeatability and reproducibility as compared to the CFR engine method [23, 24], as shown in Appendix A. Furthermore, the IQT test is fully automated and can be run with minimal operator intervention.
The IQT equipment was utilized in the present investigation as a platform to investigate the physical and chemical processes that lead to the autoignition of different fuels under well-controlled charge pressures and temperatures. There are many definitions of the ignition delay period in the literature. All researchers agree on the start of fuel injection as the start of ID. However, several criteria have been used to define the end of ID or the start of combustion [2-4, 7-9, 25-27]. In the current investigation the end of the ID is considered to be the recovery point in the pressure trace as defined by ASTM D6890-10a standard.
3. IQT setup and procedure
The IQT is a bench-scale device, comprising of a constant volume combustion chamber with external electrical heating elements, a fuel injection system, an intake system, an exhaust system, a data acquisition system, and a cooling system. The combustion chamber is a cavity along a central axis of the body, having a volume of 0.213±0.002L, which is pre-heated to the standard test temperature of approximately 828 K by nine cartridge-type resistance heaters. The charge air pressure
UNCLASSIFIED
UNCLASSIFIED
and temperature are 2.137±0.007 MPa and 818 ± 30 K respectively [20]. The IQT is a high temperature combustion device that simulates compression temperatures in diesel engines, but at a reduced air pressure.
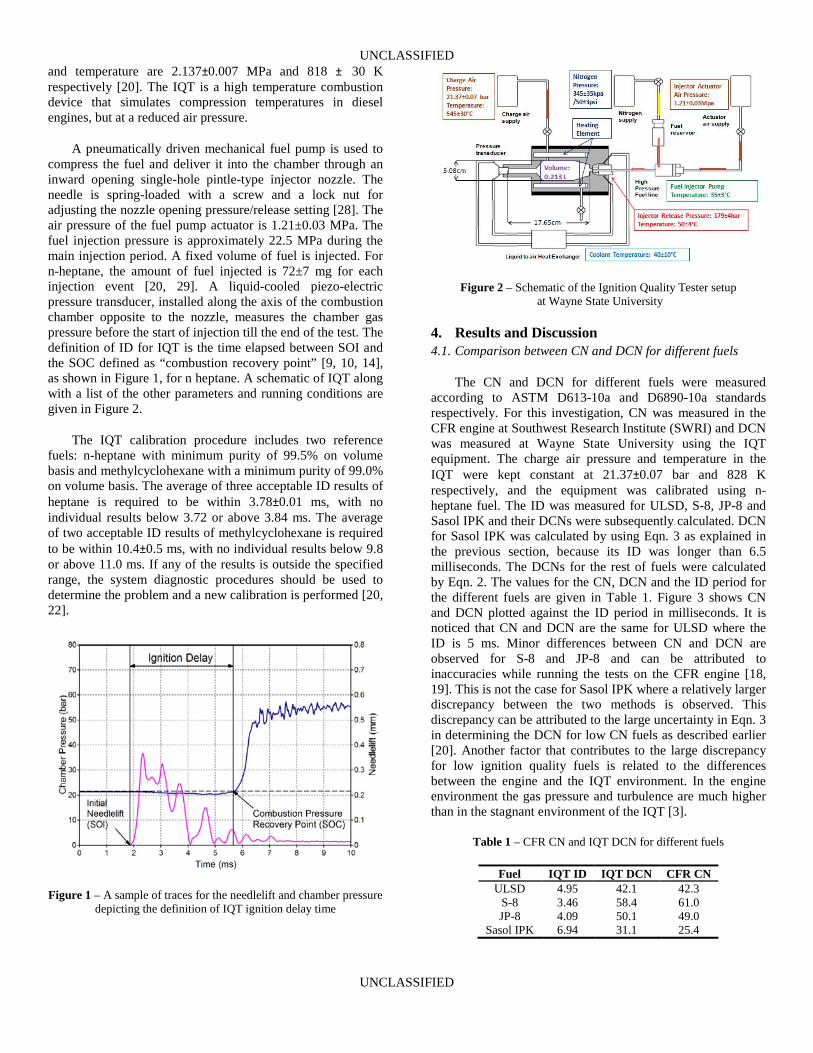
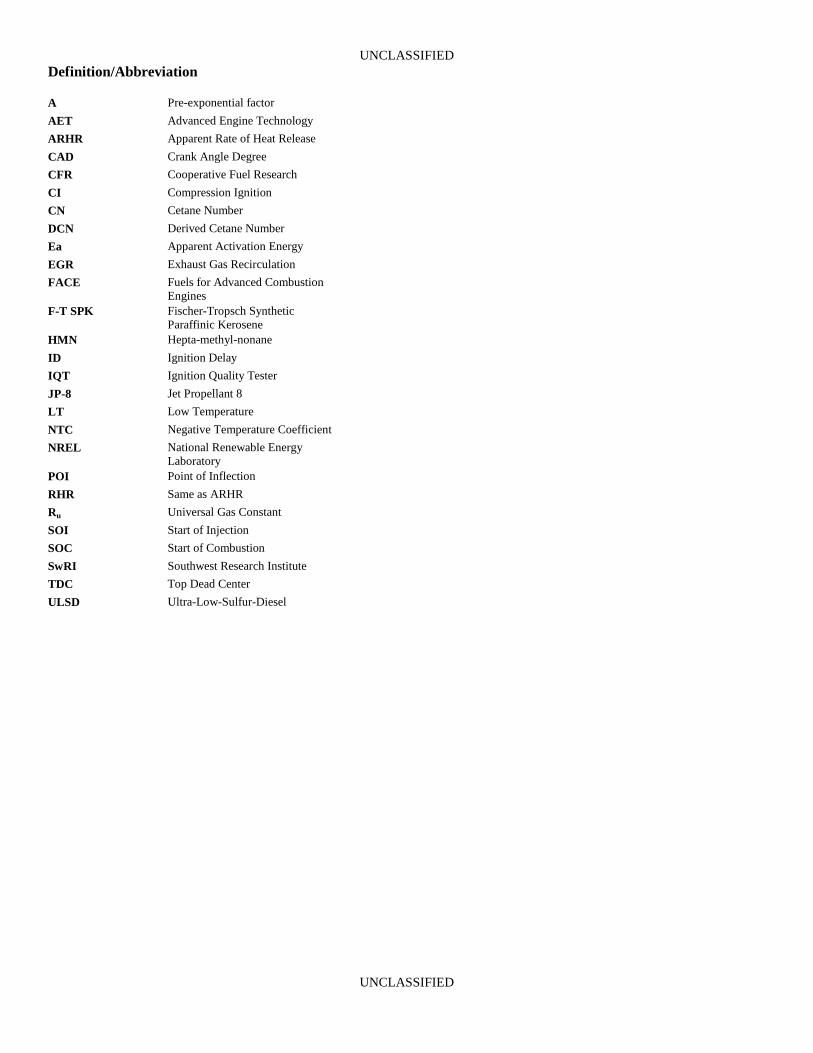
A pneumatically driven mechanical fuel pump is used to compress the fuel and deliver it into the chamber through an inward opening single-hole pintle-type injector nozzle. The needle is spring-loaded with a screw and a lock nut for adjusting the nozzle opening pressure/release setting [28]. The air pressure of the fuel pump actuator is 1.21±0.03 MPa. The fuel injection pressure is approximately 22.5 MPa during the main injection period. A fixed volume of fuel is injected. For n-heptane, the amount of fuel injected is 72±7 mg for each injection event [20, 29]. A liquid-cooled piezo-electric pressure transducer, installed along the axis of the combustion chamber opposite to the nozzle, measures the chamber gas pressure before the start of injection till the end of the test. The definition of ID for IQT is the time elapsed between SOI and the SOC defined as “combustion recovery point” [9, 10, 14], as shown in Figure 1, for n heptane. A schematic of IQT along with a list of the other parameters and running conditions are given in Figure 2.
The IQT calibration procedure includes two reference fuels: n-heptane with minimum purity of 99.5% on volume basis and methylcyclohexane with a minimum purity of 99.0% on volume basis. The average of three acceptable ID results of heptane is required to be within 3.78±0.01 ms, with no individual results below 3.72 or above 3.84 ms. The average of two acceptable ID results of methylcyclohexane is required to be within 10.4±0.5 ms, with no individual results below 9.8 or above 11.0 ms. If any of the results is outside the specified range, the system diagnostic procedures should be used to determine the problem and a new calibration is performed [20, 22].
Figure 1 – A sample of traces for the needlelift and chamber pressure depicting the definition of IQT ignition delay time
Figure 2 – Schematic of the Ignition Quality Tester setup at Wayne State University
4. Results and Discussion 4.1. Comparison between CN and DCN for different fuels
The CN and DCN for different fuels were measured according to ASTM D613-10a and D6890-10a standards respectively. For this investigation, CN was measured in the CFR engine at Southwest Research Institute (SWRI) and DCN was measured at Wayne State University using the IQT equipment. The charge air pressure and temperature in the IQT were kept constant at 21.37±0.07 bar and 828 K respectively, and the equipment was calibrated using n-heptane fuel. The ID was measured for ULSD, S-8, JP-8 and Sasol IPK and their DCNs were subsequently calculated. DCN for Sasol IPK was calculated by using Eqn. 3 as explained in the previous section, because its ID was longer than 6.5 milliseconds. The DCNs for the rest of fuels were calculated by Eqn. 2. The values for the CN, DCN and the ID period for the different fuels are given in Table 1. Figure 3 shows CN and DCN plotted against the ID period in milliseconds. It is noticed that CN and DCN are the same for ULSD where the ID is 5 ms. Minor differences between CN and DCN are observed for S-8 and JP-8 and can be attributed to inaccuracies while running the tests on the CFR engine [18, 19]. This is not the case for Sasol IPK where a relatively larger discrepancy between the two methods is observed. This discrepancy can be attributed to the large uncertainty in Eqn. 3 in determining the DCN for low CN fuels as described earlier [20]. Another factor that contributes to the large discrepancy for low ignition quality fuels is related to the differences between the engine and the IQT environment. In the engine environment the gas pressure and turbulence are much higher than in the stagnant environment of the IQT [3].
Table 1 – CFR CN and IQT DCN for different fuels
Fuel IQT ID IQT DCN CFR CN ULSD 4.95 42.1 42.3
S-8 3.46 58.4 61.0 JP-8 4.09 50.1 49.0
Sasol IPK 6.94 31.1 25.4

UNCLASSIFIED
UNCLASSIFIED
Figure 3 – ASTM D613 CN and D6890 DCN versus ID period for different fuels
4.2. Contributions of the physical and chemical processes in the autoignition of different fuels
In order to differentiate between the contributions of the physical and chemical processes during the autoignition of different fuels, tests were conducted in two steps. The first was with fuel injection into air and the second was with fuel injection into nitrogen, under the conditions specified by ASTM D6890 standard. For the nitrogen case, the physical processes and some endothermic reactions contribute to the rate of heat release. The differences in the pressure between the two tests provide information regarding the start of the active exothermic reactions leading to autoignition and combustion. In both cases, the rate of heat release (RHR) was computed from the pressure trace [30]. Figure 4 shows the details of the needlelift (N.L), pressure trace and RHR during the ID period. The oscillations in the pressure and RHR traces make it difficult to determine the start of the exothermic reactions.
Figure 4 – Raw data of N. L., pressure and RHR traces for n-heptane
4.2.1. Analysis of the oscillations in the pressure trace
A low pass filter was applied to the raw pressure signal with a cutoff frequency of 6 kHz to eliminate the noise as explained in Appendix B. Further, a band pass filter was applied to the pressure and N.L traces for the four fuels with low and high cutoff frequencies of one and four kHz respectively as shown in Figure 5a. The figure shows similarity between the oscillations in the pressure and the N.L traces, but with a slight phase shift. It is noticed that the oscillations are the same for all the fuels in spite of the differences in their physical properties, given in Table A.1 in Appendix A. Figure 5b represents a spectral analysis of the filtered pressure and N.L signals [31]. It is clear that the two traces have similar spectra that peak at a frequency of 2.2 kHz. This indicates that the oscillations in the pressure trace are related to the injection process. This relationship was investigated in National Renewable Energy Laboratory (NREL) [29, 32] by monitoring the N.L and the corresponding changes in high speed images taken for the fuel spray during the injection process. NREL concluded that the oscillations were caused by the changes in the rate of fuel delivery during the injection process. Also, the changes in the rate of fuel delivery were caused by changes in the flow area in the pintle nozzle, in addition to oscillations observed in the needle position during the injection process. It is worth noting that a detailed analysis of the pressure traces for the 32 tests, used to determine the DCN in this investigation, indicated test-to-test variability in these oscillations. Such variability can be explained by the test-to-test variability in the needle oscillations reported by NREL [29, 32].
In the present investigation, the oscillations in the pressure trace were filtered in order to differentiate between physical and chemical ignition delay periods as explained in Appendix B.
Figure 5a –Filtered pressure and needlelift signals for four fuels

UNCLASSIFIED
UNCLASSIFIED
Figure 5b – Spectral analysis for the filtered signals of pressure and needlelift for different fuels
4.2.2. Measurement of Physical and Chemical Ignition delays
The physical and chemical ignition delays were determined by comparing the filtered pressure and RHR traces for fuel injection in air with the corresponding traces for fuel injection in nitrogen. Figure 6 shows filtered traces for pressure, RHR, gas average temperature and N.L for injection into air and nitrogen. The N.L traces for both cases show the SOI at 1.8 ms. The drop in pressure immediately following the SOI is a measure of the drop in temperature caused by the heat transfer from the charge to the fuel for evaporation and endothermic reactions. It is observed that both the gas pressure traces and RHR traces for the injection in air and in nitrogen coincide during the period from SOI to 4.25 ms, after which they separate. The trace for injection into nitrogen continues to drop indicating a continuation of liquid evaporation and endothermic reactions. The trace for injection into air changes its slope indicating the start of active exothermic reactions. The point of separation between the two traces is defined as point of inflection (POI) [7] determining the start of active exothermic reactions and the end of the physical delay period [9, 10]. While the exothermic reactions start after POI, the trace for injection into air continues to drop and reaches a valley denoted by ‘b’. This indicates that endothermic reactions are predominant between POI and point ‘b’. After point ‘b’, the trace starts to rise up, indicating the domination of the exothermic reactions that lead to combustion. It should be noted that the contribution of the physical delay in the total ignition delay is more significant in the IQT compared to diesel engines [33]. This is mainly caused by the differences in the injection process, the charge pressure and turbulence in two experimental set setups.
Figure 6 – Traces for needlelift, pressure, RHR and temperature for injection of heptane in air and in nitrogen
4.2.3. Effect of fuel properties on the physical and chemical ignition delays in the IQT environment
The time histories of the gas pressure, N.L, gas mass average temperature and RHR are given in Figure 7 for four fuels. In this analysis, ULSD is considered to be the baseline fuel for the comparison with other fuels. The figure shows that, for all the fuels, SOI occurs at 1.8 ms and the main injection process is completed in about 2 ms before the rise in pressure due to combustion. As expected, S-8 has the shortest ID because it has the highest volatility and DCN. The volatility of a fuel is inversely proportional to its flash point [34-36]. Table A.1 gives the flash point for the fuels. The flash point of S-8 is 44.5°C compared to 75°C for ULSD. High volatility enhances fuel evaporation and the formation of an ignitable mixture [7, 37], and shortens the physical delay period. Again, the volatility and DCN contribute to the shorter ID of JP-8 compared to ULSD. The flash point of JP-8 is 49.5°C compared to 75°C for ULSD. The DCN for JP-8 is 50.1 compared to 42.1 for ULSD. Sasol IPK has the lowest DCN because of its longest ID period compared to the other fuels, in spite of its higher volatility, compared to ULSD and JP-8. The drop in the mass average temperature caused by energy consumed by fuel evaporation and endothermic reactions is more evident for Sasol IPK compared to the other fuels. Figure 7 shows that the rise in pressure due to the combustion, which is mostly in the premixed mode, is in line with the length of the ID for the different fuels. Figure 8 gives the details of RHR during the ID period. It is observed that S-8, ULSD and JP-8 depict the one-stage autoignition process, while Sasol IPK depicts the two-stage autoignition. The pressure rise due to combustion depends mainly on the length

UNCLASSIFIED
UNCLASSIFIED
of the ID and volatility the fuel. S-8 has the shortest ID and produced the lowest peak pressure among all fuels. Also, the pressure keeps increasing at a slow rate indicating diffusion combustion. Figure 9 shows the normalized RHR integral for different fuels, from the start of injection to the end of combustion. Table 2 gives the heat released in premixed and diffusion combustion and the premixed combustion fraction. S-8 has the lowest premixed combustion fraction among all the fuels, while Sasol IPK has the highest fraction. The sharp drop in the integrated RHR for Sasol IPK is the result of the release of almost all the energy in the premixed combustion mode.
Figure 7 – Pressure, needlelift, RHR, temperature traces for four fuels tested at temperature 828 K
Figure 8 – Details of RHR traces during autoignition for four fuels at temperature 828 K
Figure 9 – Normalized integral RHR of four fuels at temperature 828K
Table 2 – Energy Release of four fuels at temperature 828 K
Fuel Pre-mixed (kJ) Diffusion (kJ) Pre-mixed fraction ULSD 2.2506 0.6582 77.37%
S-8 1.6499 0.7757 68.02% JP-8 1.9135 0.8107 70.24%
Sasol IPK 2.7904 0.1393 95.25%
4.2.4. Effect of charge temperature on the physical and chemical ignition delays of different fuels
A series of tests were conducted, at charge temperatures between 778K and 848 K by controlling the chamber skin temperature. All the tests were conducted at a constant charge pressure of 21.37±0.07 bar (310±1 psi). The traces were analyzed and the physical and chemical delays were determined for each of the fuels at different temperatures and the results are given in Table 3. The data are plotted in Figure 10 versus the integrated mean temperature during the ignition delay period, rather than the temperature at the start of injection [2].

UNCLASSIFIED
UNCLASSIFIED
Figure.10a – Physical ID vs integrated mean temperature during the
physical process Figure 10b – Chemical ID vs integrated mean temperature during the
chemical process
Table 3 – Physical and chemical delay for four fuels at different temperature
ULSD S-8 JP-8 Sasol IPK
Test T (K) Phy ID (ms)
Chem ID (ms)
Phy ID (ms)
Chem ID (ms)
Phy ID (ms)
Chem ID (ms)
Phy ID (ms)
Chem ID (ms)
778 4.8 2.12 3.38 1.48 3.84 1.9 5.58 3.1 788 4.26 2.1 3.06 1.32 3.58 1.72 4.92 2.8 798 4 1.86 2.94 1.26 3.38 1.52 4.76 2.68 808 3.68 1.8 2.58 1.2 3.16 1.52 4.5 2.5 818 3.58 1.64 2.5 1.1 2.94 1.38 4.22 2.44 828 3.34 1.56 2.36 1.1 2.66 1.38 4.06 2.34 838 3.08 1.52 2.22 1.1 2.56 1.34 4.02 2.06 848 2.98 1.42 2.08 1.06 2.46 1.24 3.96 2
Reduced Percentage 38% 33% 38% 28% 36% 35% 29% 36%
Figure 11 shows the chamber pressure and temperatures before the start of injection and the integrated mean temperature during the ID delay period. It should be noted that the air temperature along the fuel spray should be lower than the mass average temperature, calculated from the pressure trace and the mass of the charge.
Figure 12 is a 3D plot of the total, physical and chemical ID periods plotted versus the integrated mean temperature for different DCN. It is observed that the physical delay is a major part of the total ID period for all the fuels in the IQT. It indicates that the DCN does not only represent the chemical characteristics of the fuel but also takes into consideration the physical properties of the fuel. Further, it is observed that the physical delay is more sensitive to the increase in temperature, particularly for the higher DCN fuels, as discussed in detail in the next section.
Figure.11 – Chamber pressure & temperatures before SOI and mean pressure vs integrated mean temperature during the ID period

UNCLASSIFIED
UNCLASSIFIED
Figure.12 – 3D plot of the ID period, integrated mean temperature and DCN
4.3. Forms of Arrhenius plot and corresponding apparent activation energy for different fuels
In this section different forms of the Arrhenius plot are demonstrated and the corresponding apparent activation energies, Ea, are calculated for different fuels. Ea is determined from Eqn. 4 and its value depends on the temperature, T, used in the equation. Temperatures of significance can be at the SOI [4, 5], the arithmetic mean temperature during ID [6] and the integrated mean temperature during the ID [2, 7, 8]. The first form of Arrhenius plot is for the total ID versus the reciprocal of the charge temperature before the start of injection and integrated mean temperature during the total ID period, as Figure 13 a & b.. The results of this form would be of use for engine design where diesel cycle simulation is used for determining overall engine performance. Also, this information can be used for electronic engine control, where fast computations are needed for ECU operation. The second plot is for the chemical ID versus the reciprocal of the integrated mean temperature during its ID period, as Figure 14. Here the results would be of value in the validation of detailed combustion mechanisms developed for different fuels. Also, such information can be used for the development of surrogates for different fuels. Since the chemical reactions are very sensitive to temperatures, it is felt that the temperature between the start of injection and the end of ID would be the most appropriate. The third plot is for the physical delay versus the integrated mean temperature during its ID period, as Figure 15. This plot explains the discrepancy between the apparent activation energy calculated from the first and the second plots.
𝐿𝑛(𝐼𝐷) = 𝐿𝑛𝐴 + 𝐸𝑎𝑅𝑢
1000𝑇
(4)
4.3.1. Apparent activation energy for the total ID plotted versus the charge temperature before the start of
injection and integrated mean temperature during the total ID period
Figure 13 a & b are the plot of the total ID measured from the start of injection to the pressure recovery point, specified in ASTM Standard 6890-10a, as end of ID. The apparent activation energies calculated from Figure 13 are given in Table 4. It is noticed that for all the fuels except Sasol IPK, Ea increases with the drop in DCN. This is the trend in many chemical reactions. However, this trend is not followed by Sasol IPK. Similar observations have been reported in investigations conducted on the same fuels in a high speed direct injection diesel engine [7] and on the FACE (fuels for advanced combustion engines) diesels in IQT by NREL [29].
Table 4 – Apparent activation energy based on total ignition delay for different fuels
Fuel Ea (kJ/mole) from Tcharge Ea (kJ/mole) from Tmean ULSD 15.81 28.56
S-8 14.75 27.56 JP-8 15.52 28.66
Sasol IPK 11.65 22.14
Figure 13a – Arrhenius plots for total ignition delay versus the
charge temperature before SOI for different fuels

UNCLASSIFIED
UNCLASSIFIED
Figure 13b – Arrhenius plots for total ignition delay versus the integrated mean temperature during ID period for different fuels
4.3.2. Apparent Activation energy for the chemical ID plotted versus the integrated mean charge temperature during the chemical ID
Figure 14 shows a plot of the chemical ID versus the integrated mean charge temperature during the chemical ID. It should be noted that the apparent activation energies calculated from Figure 14 are not for elementary chemical reactions but rather for the global of a large number of known, unknown, simple and complex chemical reactions that occur during the autoignition process within the temperature range studied [2]. The apparent activation energies, Ea, of different fuels are calculated, as shown in Table 5.
Table 5 – Apparent activation energy based on chemical ignition delay for different fuels
Fuel Apparent activation energy Ea (kJ/mole)
ULSD 27.31 S-8 19.26 JP-8 24.77
Sasol IPK 28.57
Figure 14 – Arrhenius plots for chemical ignition delay versus the integrated mean temperature for different fuels
Table 5 shows that S-8 which has the shortest chemical ID and the highest DCN has the lowest activation energy, 19.26 kJ/mole. Meanwhile, Sasol IPK which has the longest ID and lowest DCN has the highest activation energy, 28.57 kJ/mole. The activation energy of ULSD is 27.31 kJ/mole which is higher than 24.77 kJ/mole for JP-8.
The question here is why there is a difference between the trends shown in Figure 13 and 14, particularly for low DCN fuel. One of the factors that might have contributed to this difference is the sensitivity of the physical processes to the change in charge temperature.
4.3.3. Apparent Activation energy for the physical ID plotted versus the integrated mean charge temperature during the physical ID
Figure 15 shows the data in an Arrhenius plot for the physical ignition delay given in Figure 10. The slopes of the traces in Figure 15 are given in Table 6 and show that the physical processes of higher DCN fuels are more sensitive to changes in the charge temperature than the fuels with a lower DCN. This can be explained by the fact that the start of the exothermic reactions signifies the end of physical ID. In general, chemical reactions are more sensitive to increase in temperature which makes the physical ID equally sensitive to the increase in temperature.
Figure 15 – Arrhenius plots for physical ignition delay versus the integrated mean temperature for different fuels
Table 6 – Apparent activation energy based on physical ignition delay for different fuels
Fuel Apparent activation energy Ea (kJ/mole)
ULSD 30.60 S-8 33.43 JP-8 32.01
Sasol IPK 23.31
4.3.4. Arrhenius parameters of the total, physical and chemical ID for different fuels
By using the ID and temperature during the different process period, the Arrhenius parameters of total, physical and chemical ID period are determined respectively for different fuels using Eqn. 4, as shown in Table 7. It shows that the pre-exponential factors (A) and activation energies are different for the total ID, as the temperature at SOI and during the total ID period are taken into the calculations respectively. It indicates that the temperature should be chosen appropriately in order to determine the apparent activation energy of a certain interest.
Since the IQT is a heterogeneous combustion system, the measured total ID includes both physical process and chemical

UNCLASSIFIED
UNCLASSIFIED
reactions. As a result, the total ID can be expressed in Arrhenius equation as Eqn.5.
𝐼𝐷𝑡𝑜𝑡𝑎𝑙 = 𝐼𝐷𝑝ℎ𝑦 + 𝐼𝐷𝑐ℎ𝑒𝑚 = 𝐴𝑝ℎ𝑦 ∙ 𝑒𝐸𝑝ℎ𝑦
𝑅𝑢𝑇𝑚𝑒𝑎𝑛_𝑝ℎ𝑦 + 𝐴𝑐ℎ𝑒𝑚 ∙ 𝑒𝐸𝑐ℎ𝑒𝑚
𝑅𝑢𝑇𝑚𝑒𝑎𝑛_𝑐ℎ𝑒𝑚 (5)
Table 7 – Arrhenius parameters of ignition delay for different fuels
ULSD S-8 JP-8 Sasol IPK Temperature (K) A E (kJ/mol) A E (kJ/mol) A E (kJ/mol) A E (kJ/mol)
TSOI 0.1628 15.81 0.1438 14.75 0.1459 15.52 0.5660 11.65 Tmean total 0.0674 28.56 0.0577 27.56 0.0578 28.66 0.2432 22.14 Tmean phy 0.0346 30.60 0.0167 33.43 0.0238 32.01 0.1232 23.31 Tmean chem 0.0247 27.31 0.0614 19.26 0.0321 24.77 0.0281 28.57
5. Conclusions
The following conclusions are based on an experimental investigation of the role of the physical and chemical processes in the autoignition of fuels with different physical and chemical properties. Four fuels were tested at different temperatures, varying from 778 to 848 K. The physical and chemical ignition delays were determined by two tests. In the first test, the fuel was injected into air charge following the ASTM D6890-10a procedure. In the second test, the fuel was injected into pure nitrogen under the same conditions as the first test. The difference between the pressure traces measured in the two tests indicated the time when the chemical exothermic reactions started which was considered to be the end of the physical delay period. The total ID defined by ASTM D6890-10a, the chemical and physical IDs were correlated with the integrated mean temperature using the Arrhenius plot, from which the apparent activation energy was determined for each fuel.
1. A frequency analysis of the oscillations in the gas pressure trace indicated that they are related to the injection process, as has been reported earlier in the literature by using imaging techniques. These oscillations were filtered before the analysis was made.
2. The low DCN fuel, Sasol IPK, exhibited the two-stage autoignition process, particularly at the low charge temperatures, which was not the case for the other fuels.
3. The physical delay period in IQT is a major part of the total ignition delay period for all the fuels. This is not the case in high speed direct injection diesel engines where the physical delay period is a small fraction of total delay period, as a result of major differences in the design of the injection system and combustion chamber in the two cases.
4. The apparent activation energy calculated from the total ignition delay has an inverse relationship with the DCN of the fuels for DCNs higher than 40. This is not the case with Sasol IPK which has the lowest DCN and the lowest apparent activation compared to other fuels.
5. The apparent activation energy calculated from the chemical delay has an inverse relationship with the DCN of all fuels including Sasol IPK.
6. The difference between the two findings is explained by plotting the physical delay in an Arrhenius format. The plots indicated a higher sensitivity of the physical delay of high DCN fuels to changes in temperature compared to the sensitivity of lower DCN fuels.
Acknowledgments
This research was sponsored by US Army TARDEC and NAC, US Department of Energy, Next Energy center and Automotive Research Center (ARC): A Center of Excellence in Simulation and Modeling sponsored by US Army TARDEC and lead by University of Michigan. Our special thanks are to Pat Muzzell and N. Johnson of NAC, P. Schihl and L Hoogterp-Decker of TARDEC, Kapila Wadumesthrige and Elena Florea for their technical support. We also would like to thank National Renewable Energy Lab, Wayne State University Center of Automotive Research members for their help in conducting this research.
Disclaimer: reference herein to any specific commercial company, product, process, or service by trade name, trademark, manufacturer, or otherwise, does not necessarily consititute or imply its endorsement, recommendation, or favoring by the United States Government or the Department of the Army (DoA). The opinions of the authors expressed herein do not necessarily state or reflect those of the United States Government or the DoA, and shall not be used for advertising or product endorsement purposes.
References
[1] Frame, E. A., Alvarez, R. A., Blanks, M. G., Freerks, R. L., Stavinoha, L, Muzzell, P. A., Villahermosa, L., “Alternative Fuels: Assessment of Fischer-Tropsch Fuel for Military Use in 6.5L Diesel Engine”. SAE Technical Paper. 2004-01-2961. (2004). DOI: 10.4271/2004-01-2961.
[2] Henein, N. A., Bolt, J. A., “Correlation of Air Charge Temperature and Ignition Delay for Several Fuels in a Diesel Engine”. SAE Technical Paper. 690252. (1969). DOI: 10.4271/690252.
[3] Henein, N. A., Elias, N. Y., “A Modified Cetane Scale for Low Ignition Quality Fuels”. SAE Technical Paper. 780640. (1978). DOI: 10.4271/780640.
[4] Ryan, T. W., Callahan, T. J., “Engine and Constant Volume Bomb Studies of Diesel ignition and Combustion”. SAE Technical Paper. 881626. (1988). DOI: 10.4271/881626.
[5] Tsao, K., Myers, P., Uyehara, O., "Gas temperature during compression in motored and fired diesel engines". SAE Trans Vol 70: 136-145. (1962).
[6] Kook, S., Bae, C., Miles, P., Choi, D., Pickett, L.M., "The Influence of Charge Dilution and Injection Timing on Low-Temperature Diesel

UNCLASSIFIED
UNCLASSIFIED
Combustion and Emissions". SAE Technical Paper. 2005-01-3837. (2005). DOI: 10.4271/2005-01-3837.
[7] Jayakumar, C., Zheng, Z., Joshi, U. M., Bryzik, W., Henein, N. A., Sattler, E., “Effect of Inlet Temperature on Auto-ignition of Fuels with Different Cetane Number and Volatility”. ASME Internal Combustion Engine Technical Conference. ICEF2011-60141. (2011).
[8] Kwon,S.,Arai,M.,Hiroyasu,H., "Effects of cylinder temperature and pressure on ignition delay in direct injection diesel engine". Journal of M.E.S.J Vol 18 No 1. (1990).
[9] Ryan, T. W., “Correlation of Physical and Chemical Ignition Delay to Cetane Number”. SAE Technical Paper. 852103 (1985). DOI: 10.4271/852103.
[10] Ryan, T. W., Stapper, B., “Diesel Fuel Ignition Quality as Determined in a Constant Volume Combustion Bomb”. SAE Technical Paper. 870586. (1987). DOI: 10.4271/870586.
[11] Siebers, D. L., “Ignition Delay Characteristics of Alternative Diesel Fuels: Implications on Cetane Number”. SAE Technical Paper. 852102. (1985). DOI: 10.4271/852102.
[12] Needham, J. R., Doyle, D. M., “The Combustion and Ignition Quality of Alternative Fuels in Light Duty Diesel”. SAE Technical Paper. (1985). DOI: 10.4271/852101.
[13] Schihl, P., Hoogterp, L., Pangilinan, H., “Assessment of JP-8 and DF-2 Evaporation Rate of Cetane Numer Differences on a Military Diesel Engine”. SAE Technical Paper. 2006-01-1549. (2006). DOI: 10.4271/2006-01-1549.
[14] Aradi, A. A., Ryan, T. W., “Cetane Effect on Diesel Ignition Delay Times Measured in a Constant Volume Combustion Apparatus”. SAE Technical Paper. 952352. (1995). DOI: 10.4271/952352.
[15] Papagiannakis, R. G., Kotsiopoulos, P. N., Hountalas, D. T., Yfantis, E., “Single Fuel Research Program Comparative Results of the Use of JP-8 Aviation Fuel versus Diesel Fuel on a Direct Injection and Indirect Injection Diesel Engine”. SAE Technical Paper. 2006-01-1673. (2006). DOI : 10.4271/2006-01-1673.
[16] Schihl, P., Hoogterp, L., Gingrich, E., "The Ignition Behavior of a Coal to Liquid Fischer-Tropsch Jet Fuel in a Military Relevant Single Cylinder Diesel Engine". SAE Technical Paper. 2012-01-1197. (2012). DOI: 10.4271/2012-01-1197.
[17] Naik, C. V., Puduppakkam, K. V., Modak, A., Meeks, E., Wang, Y., Feng, Q., Tsotsis, T., "Detailed chemical kinetic mechanism for surrogates of alternative jet fuels". Combustion and Flame 158 (3): 434-445. (2011). DOI: 10.1016/j.combustflame.2010.09.016.
[18] Bezaire, N., Wadumesthrige, K., Ng, S., Salley, S. O., "Limitations of the use of cetane index for alternative compression ignition engine fuels". Fuel 89(12): 3807-3813. (2010). DOI: 10.1016/j.fuel.2010.07.013.
[19] American Society for Testing and Materials, “Standard Test Method for Cetane Number of Diesel Fuel Oil”. ASTM D613-10a, Rev. Aug (2010).
[20] American Society for Testing and Materials, “Standard Test Method for Determination of Ignition Delay and Derived Cetane Number (DCN) of Diesel Fuel Oils by Combustion in a Constant Volume Chamber”. ASTM D6890-10a, Rev. Aug (2010).
[21] Dooley, S., Won, S.H., Chaos, M., Heyne, J., Ju, Y., Dryer, F.L., Kumar, K., Sung, C-J., Wang, H., Oehlschlaeger, M.A., Santoro, R.J., and Litzinger, T.A., "A Jet Fuel Surrogate Formulated by Real Fuel Properties", Combust. Flame, 157, 12, 2333–2339 (2010).
[22] Advanced Engine Technology Ltd, “Ignition Quality Tester Manual”. 17 Fitzgerald Rd, Suite 102 Ottawa/Nepean Ontario Canada. (2002).
[23] Allard, L. N., Webster, G. D., Hole, N. J., Ryan, T. W., Ott, D., Fairbridge, C. W., “Diesel Fuel Ignition Quality as Determined in the Ignition Quality Tester (IQT)”. SAE Technical Paper. 961182. (1996). DOI: 10.4271/961182.
[24] Allard, L. N., Webster, G. D., Ryan, T. W., Matheaus, A. C., Baker, G., Beregszaszy, A., Read, H., Mortimer, K., Jones, G., “Diesel Fuel Ignition Quality as Determined in the Ignition Quality Tester (IQT) - Part IV”. SAE Technical Paper. 2001-01-3527. (2001). DOI: 10.4271/2001-01-3527.
[25] Hoskin, D. H., Edwards, C.F. and Siebers, D. L., "Ignition Delay Performance vs. Composition of Model Fuels", SAE Technical Paper. 920109. (1992) DOI: 10.4271/920109.
[26] Aligrot, C., Champoussin, Guerrassi, N. and Claus, G., "A Correlative Model to Predict Autoignition Delay of Diesel Fuels", SAE Techenical Paper 970638. (1997). DOI: 10.4271/970638.
[27] Lin, C. S. and Foster, D. E., "An Analysis of Ignition Delay, Heat Transfer and Combustion During Dynamic Load Changes in a Diesel Engine". SAE Technical Paper 892054. (1989). DOI: 10.4271/892054.
[28] International Standard, “Diesel engines ------Calibrating nozzle, delay pintle type”. ISO 4010: 1998 (E). (1998).
[29] Bogin, G., Dean, A. M., G., Ratcliff, M. A., Luecke, J., Zigler, B., "Expanding the Experimental Capabilities of the Ignition Quality Tester for Autoigniting Fuels." SAE Technical Paper. 2010-01-0741 (2010). DOI: 10.4271/2010-01-0741.
[30] Heywood, J. B., Internal Combustion Engine Fundamentals, McGraw-Hill, New York, (1988).
[31] Badawy, T., Shrestha, A., Henein, N., "Detection of combustion resonance using an ion current sensor in diesel engines", ASME Internal Combustion Engine Technical Conference. ICEF2011-60068. (2011).
[32] Bogin, G., DeFilippo, A., Chen, J. Y., Chin, G., Luecke, J., Ratcliff, M. A., Zigler, B., Dean, A. M., "Numerical and Experimental Investigation of n-Heptane Autoignition in Ignition Quality Tester (IQT) " Energy Fuels 25(12): 5562–5572. (2011). DOI: 10.1021/ef201079g.
[33] Henein, N., Akasaka, Y., "Effect of physical properties and composition on fuels on autoignition and cetane rating", SAE Technical Paper. 871617.(1987). DOI: 10.4271/871617.
[34] Koleske, J.V., "Paint and coating testing manual", ASTM, Philadelphia, PA (1995).
[35] Totten,G.E., Bates, C.E., Clinton, N.A., "Handbook of quenchants and quenching technology", ASM International, Material Park, OH. (1993).
[36] Tipper, H., "Automotive Industries and Automobile", New York, (1920).
[37] Pickett, L., Hoogterp, L., "Fundamental Spray and Combustion Measurements of JP-8 at Diesel Conditions". SAE Technical Paper. 2008-01-1083. (2008). DOI: 10.4271/2008-01-1083.
[38] Millo, F. and Ferraro, C., "Knock in S.I. Engines: A Comparison between Different Techniques for Detection and Control," SAE Technical Paper 982477, 1998.
[39] Guzzella, L. " Introduction to Modeling and Control of Internal Combustion Engine Systems," Book, Page 204- 208.
[40] Payri, F., Broatch, A., Tormos, B. and Marant, V. " New methodology for in-cylinder pressure analysis in direct injection diesel engines—application to combustion noise," 2005 Meas. Sci. Technol., Vol. 16, No. 2.
[41] Hickling, R., Fedmaier, D. A., Chen, F. H. K. and Morel, J. S., ―Cavity resonances in engine combustion chambers and some applications," J. Acoust. Soc. Am. 73(4), 1983.
[42] Scholl, D., Davis, C., Russ, S., and Barash, T., "The Volume Acoustic Modes of Spark-Ignited Internal Combustion Chambers," SAE Technical Paper 980893, 1998.
UNCLASSIFIED
UNCLASSIFIED
Definition/Abbreviation
A
Pre-exponential factor AET Advanced Engine Technology ARHR Apparent Rate of Heat Release CAD Crank Angle Degree CFR Cooperative Fuel Research CI Compression Ignition CN Cetane Number DCN Derived Cetane Number Ea Apparent Activation Energy EGR Exhaust Gas Recirculation FACE Fuels for Advanced Combustion
Engines F-T SPK Fischer-Tropsch Synthetic
Paraffinic Kerosene HMN Hepta-methyl-nonane ID Ignition Delay IQT Ignition Quality Tester
JP-8 Jet Propellant 8 LT Low Temperature NTC Negative Temperature Coefficient NREL National Renewable Energy
Laboratory POI Point of Inflection RHR Same as ARHR Ru Universal Gas Constant SOI Start of Injection SOC Start of Combustion SwRI Southwest Research Institute TDC Top Dead Center ULSD Ultra-Low-Sulfur-Diesel

UNCLASSIFIED
UNCLASSIFIED
Appendix A
Table A.1 – Fuel Properties Fuel ULSD JP-8 Sasol IPK S-8 D613 CN 42.3 49 25.4 61 D6890 DCN 42.1 50.1 31.1 58.4 Flash point (°C) min 75 49.5 42 44.5 Density (@15°C) kg/m3 842 798 755 749 Heating Value (MJ/kg) 41.2 43.2 44.0 44.1
Figure A.1 – Distillation curves for four fuels
Table A.2 Repeatability and Reproducibility Values for Information ID (ms) Repeatability (r) Reproducibility (r)
3.1 0.030 0.158 3.6 0.055 0.198 4.2 0.085 0.246 4.8 0.115 0.293 6.0 0.175 0.388 6.5 0.200 0.428
DCN Repeatability (r) Reproducibility (r) 33 0.67 1.96 40 0.77 2.23 45 0.83 2.43 50 0.90 2.62 55 0.96 2.81 60 1.03 3.00 64 1.08 3.16

UNCLASSIFIED
UNCLASSIFIED
Appendix B
The time history of the needlelift (N.L.), raw pressure and rate of heat release (RHR) are shown in Figure 4. It is observed that the pressure trace has oscillations and signal noise. Moreover, the RHR trace shows more noise, since it is derived from raw pressure trace. The technology of filtering is applied to eliminate the noise and oscillations, which enhances the understanding for the autoignition period. Figure B.1a shows the zoomed-in raw, smoothed, noise filtered and N.L oscillation filtered pressure traces of n-heptane. Figure B.1b shows the Fast Fourier Transform (FFT) analysis plot for the raw, smoothed, noise filtered and N.L oscillation filtered pressure signals. The solid blue line is the raw pressure signal. The dash red line is the smoothed pressure signal by eleven-point moving average method. The dash-dot green line is the noise filtered pressure signal. The dash-two-dot orange line is the N.L oscillation filtered pressure signal. The frequencies of N.L, combustion, resonance and etc. can be differentiated and determined using wave equation in the combustion chamber [31, 38-42].
1. Signal Smoothing The eleven-point moving average smoothing method is applied to smooth the raw pressure as shown in Figure B.1a. From which, the SOC can be determined from the pressure recovery point. It is observed that the signal noise is minimized without any shift in the pressure trace. However, all frequencies are still present in the signal even after smoothing as shown in Figure B.1b. Further, the oscillations caused by N.L. are still observed in the smoothing trace which affects the precision of determining point of inflection (POI). In addition, a very important disadvantage of the moving average method is that the point of the moving average would need to be tuned for each cycle in order to obtain optimum smoothing results.
2. Finite impulse response (FIR) filter with phase correction On the other hand, using FIR filter with phase correction is recommended. A low pass filter with a cutoff frequency of 6 kHz eliminates the noise present in the raw pressure signal as shown in Figure B.1a. It is also observed the noises with higher than 6 kHz frequencies are wiped out in the corresponding FFT plot as shown in Figure B.1b. Since the N.L. frequency is determined at 2.2 kHz, an additional low pass filter with a cutoff frequency of 1.6 kHz is applied to get rid of the N.L oscillations presented in the pressure trace as shown in Figure B.1a. As a result, it is also observed the frequencies with higher than 1.6 kHz are eliminated in the corresponding FFT plot as shown in Figure B1.b.,However, a shift occurred in the combustion phase compared with raw pressure signal as shown in Figure B.1a and B.1b. Although the SOC cannot be accurately determined from the 1.6 kHz low pass filtered signal, the POI in the autoignition period can be defined with high accuracy.
Thus, the SOC should be determined from the pressure signal after applying the noise filter with the cutoff frequency of 6 kHz. And the POI could be defined from the pressure signal after applying the N.L oscillation filter with the cutoff frequency of 1.6 kHz.

UNCLASSIFIED
UNCLASSIFIED

UNCLASSIFIED
UNCLASSIFIED
Figure B.1a – Zoomed raw, smoothed, noise filtered and N.L oscillation filtered pressure traces for n-heptane Figure B.1b – FFTs analysis for the raw, smoothed, noise filtered and N.L oscillation filtered pressure signals