INVESTIGATION OF LABORATORY TEST PROCEDURES FOR …
62
Report No. UT-16.11 INVESTIGATION OF LABORATORY TEST PROCEDURES FOR ASSESSING THE STRUCTURAL CAPACITY OF GEOGRID-REINFORCED AGGREGATE BASE MATERIALS Prepared For: Utah Department of Transportation Research Division Submitted By: Brigham Young University Department of Civil and Environmental Engineering Authored By: W. Spencer Guthrie, Ph.D. Jaren T. Knighton Final Report April 2015
Transcript of INVESTIGATION OF LABORATORY TEST PROCEDURES FOR …
Report No. UT-16.11
INVESTIGATION OF LABORATORY TEST PROCEDURES FOR ASSESSING THE STRUCTURAL CAPACITY OF GEOGRID-REINFORCED AGGREGATE BASE MATERIALS
Prepared For:
Utah Department of Transportation Research Division Submitted By:
Brigham Young University Department of Civil and Environmental Engineering
Authored By:
W. Spencer Guthrie, Ph.D. Jaren T. Knighton Final Report April 2015
ii
DISCLAIMER
The authors alone are responsible for the preparation and accuracy of the information,
data, analysis, discussions, recommendations, and conclusions presented herein. The contents do
not necessarily reflect the views, opinions, endorsements, or policies of the Utah Department of
Transportation or the U.S. Department of Transportation. The Utah Department of
Transportation makes no representation or warranty of any kind, and assumes no liability
therefore. The authors also make no warranty, express or implied, regarding the suitability of
findings documented in this report for a particular purpose and shall not be held liable under any
circumstances for any direct, consequential, or other damages with respect to claims by users of
any findings documented in this report, including claims based on allegations of errors,
omissions, or negligence.
ACKNOWLEDGMENTS
The authors acknowledge the Utah Department of Transportation for funding this
research. Staker Parson Companies, Geneva Rock Products, and Tensar International
Corporation supplied the materials used in the research. Appreciation is given for the
contributions of Brigham Young University (BYU) students Jake Tolbert and Kirk Jackson in
completing this research. In addition, the authors acknowledge Dennis Eggett of the BYU
Department of Statistics for his assistance in completing the statistical analyses.

iii
TECHNICAL REPORT ABSTRACT
1. Report No. UT-16.11
2. Government Accession No. NA
3. Recipient's Catalog No. NA
4. Title and Subtitle INVESTIGATION OF LABORATORY TEST PROCEDURES FOR
ASSESSING THE STRUCTURAL CAPACITY OF GEOGRID-
REINFORCED AGGREGATE BASE MATERIALS
5. Report Date April 2015
6. Performing Organization Code
7. Author(s) W. Spencer Guthrie and Jaren T. Knighton
8. Performing Organization Report No.
9. Performing Organization Name and Address Brigham Young University
Department of Civil and Environmental Engineering
368 Clyde Building
Provo, UT 84602
10. Work Unit No. 5H07690H
11. Contract or Grant No.
12-9110 12. Sponsoring Agency Name and Address
Utah Department of Transportation
4501 South 2700 West
P.O. Box 148410
Salt Lake City, UT 84114-8410
13. Type of Report & Period Covered Final Report
July 2013 to April 2015 14. Sponsoring Agency Code
UT 09.301 15. Supplementary Notes
Prepared in cooperation with the Utah Department of Transportation and the U.S. Department of Transportation,
Federal Highway Administration
16. Abstract
The objective of this research was to identify a laboratory test method that can be used to quantify improvements
in structural capacity of aggregate base materials reinforced with geogrid. For this research, National Cooperative
Highway Research Program Report 598 repeated load triaxial, American Association of State Highway and
Transportation Officials (AASHTO) T 307 quick shear, and CBR testing protocols were used to test unreinforced
and geogrid-reinforced aggregate base materials from northern Utah. Biaxial and triaxial geogrid were investigated
in multiple reinforcement configurations. Several statistical analyses were performed on the results of each test
method to identify the test that is most likely to consistently show an improvement in the structural capacity of
aggregate base materials reinforced with geogrid. The results of this research indicate that, for the methods and
materials evaluated in this study, calculation of the modulus at 2 percent strain from the AASHTO T 307 quick
shear data is the test method most likely to consistently show an improvement in structural capacity associated with
geogrid reinforcement. Of the three configurations investigated as part of this research, placing the geogrid at an
upper position within a specimen is preferred. Given that the end goal of the use of geogrid reinforcement is to
improve pavement performance, additional research is needed to compare the results of the AASHTO T 307 quick
shear test obtained in the laboratory with the structural capacity of geogrid-reinforced aggregate base materials
measured in the field. In addition, correlations between the results of the AASHTO T 307 quick shear test and
resilient modulus need to be investigated in order to incorporate the findings of the AASHTO T 307 quick shear test
on reinforced base materials into mechanistic-empirical pavement design. 17. Key Words Aggregate Base Materials, Biaxial Geogrid,
Mechanistic-Empirical Pavement Design, Modulus,
Quick Shear Test, Triaxial Geogrid
18. Distribution Statement Not restricted. Available through:
UDOT Research Division
4501 South 2700 West
P.O. Box 148410
Salt Lake City, UT 84114-8410
www.udot.utah.gov/go/research
23. Registrant's Seal
19. Security Classification
(of this report) Unclassified
20. Security Classification (of this page)
Unclassified
21. No. of Pages
58
22. Price

iv
TABLE OF CONTENTS
LIST OF TABLES ......................................................................................................................... vi
LIST OF FIGURES ...................................................................................................................... vii
LIST OF ACRONYMS ............................................................................................................... viii
EXECUTIVE SUMMARY ............................................................................................................ 1
1.0 INTRODUCTION .................................................................................................................... 2
1.1 Problem Statement ................................................................................................................ 2
1.2 Research Objective and Scope .............................................................................................. 3
1.3 Outline of Report .................................................................................................................. 4
2.0 BACKGROUND ...................................................................................................................... 5
2.1 Overview ............................................................................................................................... 5
2.2 Pavement Design and Construction ...................................................................................... 5
2.3 Geogrid Reinforcement ......................................................................................................... 5
2.3.1 Laboratory Testing ......................................................................................................... 6
2.3.2 Field Testing .................................................................................................................. 8
2.4 Summary ............................................................................................................................. 10
3.0 PROCEDURES....................................................................................................................... 11
3.1 Overview ............................................................................................................................. 11
3.2 Experimental Design ........................................................................................................... 11
3.3 Materials Characterization .................................................................................................. 16
3.4 Testing of Geogrid-Reinforced Base Materials .................................................................. 16
3.4.1 NCHRP Report 598 Repeated Load Triaxial Testing.................................................. 16
3.4.2 AASHTO T 307 Quick Shear Testing ......................................................................... 21
3.4.3 California Bearing Ratio Testing ................................................................................. 22
3.5 Statistical Analyses ............................................................................................................. 24

v
3.6 Summary ............................................................................................................................. 25
4.0 RESULTS AND ANALYSIS ................................................................................................. 27
4.1 Overview ............................................................................................................................. 27
4.2 Test Results ......................................................................................................................... 27
4.3 Statistical Analyses ............................................................................................................. 30
4.4 Summary ............................................................................................................................. 39
5.0 CONCLUSION ....................................................................................................................... 41
5.1 Summary ............................................................................................................................. 41
5.2 Findings............................................................................................................................... 42
5.3 Recommendations ............................................................................................................... 42
REFERENCES ............................................................................................................................. 43
APPENDIX A MOISTURE-DENSITY RELATIONSHIPS .................................................... 47
APPENDIX B MECHANICAL PROPERTY TEST DATA .................................................... 49
APPENDIX C ANALYSIS OF COVARIANCE RESULTS ................................................... 52
APPENDIX D POST-HOC COMPARISONS OF MEANS .................................................... 54

vi
LIST OF TABLES
Table 3-1: Experimental Design ................................................................................................... 12
Table 4-1: Moisture-Density Relationships .................................................................................. 28
Table 4-2: NCHRP Report 598 RLT Test Results........................................................................ 29
Table 4-3: AASHTO T 307 Quick Shear Test Results ................................................................. 29
Table 4-4: CBR Test Results ........................................................................................................ 30
Table 4-5: Statistical Analyses of NCHRP Report 598 RLT Test Results ................................... 31
Table 4-6: Statistical Analyses of AASHTO T 307 Quick Shear Test Results ............................ 31
Table 4-7: Statistical Analyses of CBR Test Results .................................................................... 32
Table 4-8: Lower Bounds for AASHTO T 307 Methods of Data Analysis ................................. 33
Table 4-9: Lower Bounds for AASHTO T 307 Geogrid Configurations ..................................... 33
Table B-1: NCHRP Report 598 RLT Test Data ........................................................................... 49
Table B-2: AASHTO T 307 Quick Shear Test Data .................................................................... 50
Table B-3: CBR Test Data ............................................................................................................ 51
Table C-1: Full ANOCOVA Models ............................................................................................ 53
Table C-2: Reduced ANOCOVA Models .................................................................................... 53
Table D-1: Post-Hoc Comparisons of Means ............................................................................... 54

vii
LIST OF FIGURES
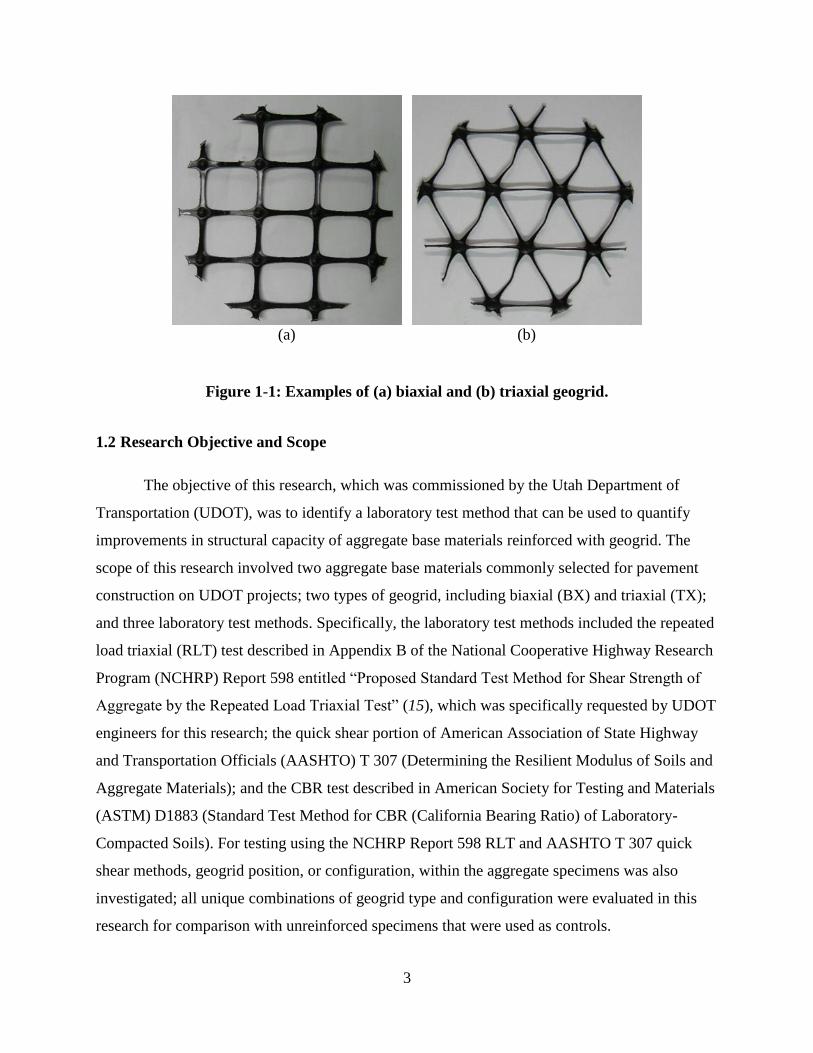
Figure 1-1: Examples of (a) Biaxial and (b) Triaxial Geogrid ...................................................... 3
Figure 3-1: Point of the Mountain Aggregate Base Material ...................................................... 13
Figure 3-2: Trenton Aggregate Base Material ............................................................................ 13
Figure 3-3: Testing Configurations for NCHRP Report 598 RLT and AASHTO T 307
Quick Shear Testing ................................................................................................. 15
Figure 3-4: Testing Configuration for CBR Testing ................................................................... 15
Figure 3-5: UTM-100 Testing Equipment .................................................................................. 17
Figure 3-6: Steel Split Mold for Compacting Specimens ........................................................... 19
Figure 3-7: Membrane Expander ................................................................................................ 20
Figure 3-8: Triaxial Cell Placed inside the UTM-100 ................................................................ 21
Figure 3-9: CBR Specimen Placed inside the Instron Material Testing Machine ...................... 23
Figure 4-1: Particle-Size Distributions ........................................................................................ 28
Figure 4-2: Typical Point of the Mountain Specimens after AASHTO T 307 Quick
Shear Testing: (a) No Geogrid, (b) Geogrid Configuration A, (c) Geogrid
Configuration B, (d) Geogrid Configuration C ........................................................ 35
Figure 4-3: Typical Trenton Specimens after AASHTO T 307 Quick Shear Testing: (a)
No Geogrid, (b) Geogrid Configuration A, (c) Geogrid Configuration B, (d)
Geogrid Configuration C .......................................................................................... 36
Figure 4-4: Modulus Values for AASHTO T 307 Quick Shear Testing in Geogrid
Configuration A ........................................................................................................ 37
Figure 4-5: Modulus Values for AASHTO T 307 Quick Shear Testing in Geogrid
Configuration B ........................................................................................................ 38
Figure 4-6: Modulus Values for AASHTO T 307 Quick Shear Testing in Geogrid
Configuration C ........................................................................................................ 38
Figure A-1: Moisture-Density Curve for Point of the Mountain Material ................................... 47
Figure A-2: Moisture-Density Curve for Trenton Material ......................................................... 48

viii
LIST OF ACRONYMS
AASHTO American Association of State Highway and Transportation Officials
ANOCOVA analysis of covariance
ASTM American Society for Testing and Materials
BX biaxial
CBR California bearing ratio
DCP dynamic cone penetrometer
MDD maximum dry density
MEPDG Mechanistic-Empirical Pavement Design Guide
NCHRP National Cooperative Highway Research Program
OMC optimum moisture content
RAP reclaimed asphalt pavement
RCA recycled concrete aggregate
RLT repeated load triaxial
TX triaxial
UDOT Utah Department of Transportation
USCS Unified Soil Classification System

1
EXECUTIVE SUMMARY
The modulus of aggregate base layers in pavement structures can potentially be increased
through the use of geogrid. However, methods for determining how much structural benefit can
be expected from a given geogrid product have not been standardized. A laboratory testing
protocol is therefore needed to enable evaluation, in terms of modulus or California bearing ratio
(CBR), for example, of the degree of improvement that may be achieved by a given geogrid.
Consequently, the objective of this research was to identify a laboratory test method that can be
used to quantify improvements in structural capacity of aggregate base materials reinforced with
geogrid.
For this research, National Cooperative Highway Research Program Report 598 repeated
load triaxial, American Association of State Highway and Transportation Officials (AASHTO) T
307 quick shear, and CBR testing protocols were used to test unreinforced and geogrid-
reinforced aggregate base materials from northern Utah. Biaxial and triaxial geogrid were
investigated in multiple reinforcement configurations. Several statistical analyses were
performed on the results of each test method to identify the test that is most likely to consistently
show an improvement in the structural capacity of aggregate base materials reinforced with
geogrid.
The results of this research indicate that, for the methods and materials evaluated in this
study, calculation of the modulus at 2 percent strain from the AASHTO T 307 quick shear data is
the test method most likely to consistently show an improvement in structural capacity
associated with geogrid reinforcement. Of the three configurations investigated as part of this
research, placing the geogrid at an upper position within a specimen is preferred.
Given that the end goal of the use of geogrid reinforcement is to improve pavement
performance, additional research is needed to compare the results of the AASHTO T 307 quick
shear test obtained in the laboratory with the structural capacity of geogrid-reinforced aggregate
base materials measured in the field. In addition, correlations between the results of the
AASHTO T 307 quick shear test and resilient modulus need to be investigated in order to
incorporate the findings of the AASHTO T 307 quick shear test on reinforced base materials into
mechanistic-empirical pavement design.

2
1.0 INTRODUCTION
1.1 Problem Statement
Flexible pavements are generally designed to have multiple layers, including the asphalt
surface course, aggregate base course, and native subgrade. In pavement design, engineers need
to know the structural properties of each layer in order to determine thicknesses of the asphalt
and aggregate base layers. For aggregate base materials, structural capacity is commonly
quantified in terms of modulus or California bearing ratio (CBR), for example, with the former
being an especially important input in the Mechanistic-Empirical Pavement Design Guide
(MEPDG) (1, 2, 3). The modulus of aggregate base layers can potentially be increased through
the use of geogrid, an extruded polypropylene material, which would then enable reductions in
base layer thickness (4, 5) or prolonged service life (5, 6) compared to unreinforced sections.
Geogrid is available globally in different geometries from several different
manufacturers, with two primary examples shown in Figure 1-1. Manufactured in wide rolls,
geogrid is generally placed directly on prepared subgrade soils and covered with aggregate base
material that is compacted in place (4). To the extent that the aggregate particles penetrate the
openings, or apertures, in the geogrid, the geogrid increases the lateral confinement of the base
material in the region around the geogrid (7, 8), which can result in an increase in the modulus of
the base layer (9, 10, 11). In this way, the degree of improvement in modulus is determined by
the extent of interlock that occurs between the aggregate and the geogrid; for this reason, geogrid
properties such as rib size, aperture size, aperture shape, material type, and tensile strength can
influence the interlock that occurs with a given base material (12, 13). However, methods for
determining how much structural benefit can be expected from a given geogrid product have not
been standardized. Although a pull-out test has been used to evaluate the extent of interlock of a
given geogrid product with a given soil (12, 14), that test does not generate results that can be
used in pavement design. A laboratory testing protocol is therefore needed to enable evaluation,
in terms of modulus or CBR, for example, of the degree of improvement that may be achieved
by a given geogrid so that the cost of incorporating the geogrid in a pavement structure can be
compared with the potential cost savings associated with its use.
3
(a) (b)
Figure 1-1: Examples of (a) biaxial and (b) triaxial geogrid.
1.2 Research Objective and Scope
The objective of this research, which was commissioned by the Utah Department of
Transportation (UDOT), was to identify a laboratory test method that can be used to quantify
improvements in structural capacity of aggregate base materials reinforced with geogrid. The
scope of this research involved two aggregate base materials commonly selected for pavement
construction on UDOT projects; two types of geogrid, including biaxial (BX) and triaxial (TX);
and three laboratory test methods. Specifically, the laboratory test methods included the repeated
load triaxial (RLT) test described in Appendix B of the National Cooperative Highway Research
Program (NCHRP) Report 598 entitled “Proposed Standard Test Method for Shear Strength of
Aggregate by the Repeated Load Triaxial Test” (15), which was specifically requested by UDOT
engineers for this research; the quick shear portion of American Association of State Highway
and Transportation Officials (AASHTO) T 307 (Determining the Resilient Modulus of Soils and
Aggregate Materials); and the CBR test described in American Society for Testing and Materials
(ASTM) D1883 (Standard Test Method for CBR (California Bearing Ratio) of Laboratory-
Compacted Soils). For testing using the NCHRP Report 598 RLT and AASHTO T 307 quick
shear methods, geogrid position, or configuration, within the aggregate specimens was also
investigated; all unique combinations of geogrid type and configuration were evaluated in this
research for comparison with unreinforced specimens that were used as controls.

4
1.3 Outline of Report
This report contains five chapters. This chapter introduces the research by presenting the
problem statement, research objectives, and scope. Chapter 2 gives background information on
geogrid reinforcement of base materials in flexible pavements. Chapters 3 and 4 detail the
procedures and results, respectively, of the research. Chapter 5 provides conclusions and
recommendations resulting from the research.
5
2.0 BACKGROUND
2.1 Overview
This chapter discusses pavement design and construction and describes geogrid
reinforcement in the context of both laboratory and field testing of aggregate base materials.
2.2 Pavement Design and Construction
Flexible pavements are generally designed to have multiple layers of varying mechanical
properties, with stronger layers placed over weaker layers. The surface course in a flexible
pavement structure is normally a hot mix asphalt layer. Having a comparatively high modulus,
the asphalt protects the underlying base course and subgrade by decreasing the magnitude of
traffic-induced stresses that are transferred downwards into the pavement structure.
The base course is normally composed of a dense-graded aggregate base material, which
provides additional protection to the underlying subgrade. Traffic loads are distributed through
the base layer through interparticle friction between aggregates (16, 17). As the aggregate base
material is compacted in place to a specified density, the resulting interparticle friction between
especially the larger aggregates allows the base layer to spread traffic loads over the subgrade.
The subgrade is the natural soil that exists on a site and may exhibit very low modulus
values. In particular, weak subgrade materials can cause difficulty in road construction because
they may not offer sufficient support for compaction of overlying base materials to an
appropriate density. For this reason, geogrid reinforcement is sometimes placed over weak
subgrades to potentially create an improved construction platform that leads to better compaction
and greater strength of the base material (13, 18).
2.3 Geogrid Reinforcement
Since the 1980s, geogrid reinforcement of base materials has been increasingly used in
roadway construction (4, 11, 19), and several studies have been performed to evaluate its

6
performance. The results of both laboratory and field testing are summarized in the following
sections.
2.3.1 Laboratory Testing
Numerous laboratory experiments have been performed to better understand geogrid
reinforcement of aggregate base material. The experiments involved evaluation of modulus and
permanent deformation as measured in the plate load test, triaxial shear test, and RLT test.
Cyclic plate load testing involves compressive loading of a circular plate and
measurement of the surface deflection of the supporting material as described in ASTM D1195
(Standard Test Method for Repetitive Static Plate Load Tests of Soils and Flexible Pavement
Components, for Use in Evaluation and Design of Airport and Highway Pavements). The results
of cyclic plate load tests on laboratory-scale pavement sections with a crushed limestone
aggregate base were analyzed using the MEPDG in one study, and the researchers concluded that
geogrid reinforcement increased the resilient modulus of the base materials by 10 to 90 percent
and suggested that the base layer thickness could therefore be decreased by up to 49 percent (20);
in this study, geogrid was placed at one of three locations, including the base-subgrade interface,
the middle of the base layer, or the upper one-third position within the base layer in the
reinforced sections, which were composed of a 12-in.-thick base layer and a 0.75-in.-thick
asphalt layer. However, in another study, cyclic plate load tests performed on crushed base
material composed of reclaimed asphalt pavement (RAP) and recycled concrete aggregate
(RCA) showed that, while permanent deformation was significantly different for the
unreinforced and reinforced materials, the resilient modulus did not increase significantly for the
reinforced sections (21); in this study, geogrid was placed at the middle of the base layer in the
reinforced sections, which were composed of a 12-in.-thick base layer. One study performed on a
dense-graded aggregate base layer focused on evaluating correlations between various geogrid
index properties, such as junction and rib strength and pullout resistance, and the results of plate
load tests indicated that the change in stiffness achieved for a given aggregate base material
depended on the properties of the geogrid (12); in this study, geogrid was placed at one of three
locations, including the base-subgrade interface, 1 in. above a geotextile that was placed at the
base-subgrade interface, or directly on top of a geotextile that was placed at the base-subgrade

7
interface in the reinforced sections, which each had an 8-in.-thick base layer. The results of plate
load testing performed on laboratory-scale pavement sections with a crushed-stone aggregate
base indicated that the same pavement life can be achieved with a base thickness that is reduced
by up to 20 percent as a result of the inclusion of geogrid (11); in this study, geogrid was placed
at one of two locations, including the base-subgrade interface or the lower one-third position
within the base layer in the reinforced sections, which each had a base layer that varied in
thickness from 8 to 15 in. and an asphalt layer that was 3 in. thick. In a modified plate load test
performed in a study specific to railway track structures, cyclic loading in a box was performed
on ballast material; this research showed that there was an optimum geogrid aperture size for a
given nominal aggregate size (22); in this study, geogrid was placed at one of two locations,
including the ballast-subballast interface or 2 in. above the ballast-subballast interface in the
reinforced sections, which each had a 12-in.-thick base layer.
Triaxial shear testing involves compressive loading of a confined cylindrical test
specimen at a constant vertical strain rate and measurement of the load sustained by the
specimen during the testing as described in ASTM D7181 (Method for Consolidated Drained
Triaxial Compression Test for Soils). In one study, triaxial shear testing performed at a rate of 10
percent strain per hour on crushed limestone samples showed that the strength and stiffness of
geogrid-reinforced samples were higher than those of unreinforced samples and that greater
improvement from geogrid was realized at higher strain levels (23); in this study, geogrid was
placed at one of three locations, including the middle, upper one-third, or upper and lower one-
third positions within the reinforced specimens, which were 6 in. in diameter and 12 in. in height.
RLT testing involves compressive loading of a confined cylindrical test specimen in
repeated load pulses followed by rest periods as described in NCHRP Report 598 (15) or
AASHTO T 307. Multiple studies using RLT testing to investigate the permanent deformation
and resilient modulus of geogrid-reinforced samples have found that geogrid reinforcement
reduced permanent deformation but did not significantly increase resilient modulus (21, 23, 24,
25, 26); in these studies, “common” crushed aggregate, crushed limestone aggregate, finely
crushed basaltic aggregate, and RAP with RCA were evaluated with geogrid placed at the
middle, lower one-third, upper one-third, and/or upper and lower one-third positions within the
reinforced specimens, which were either 6 in. in diameter and 12 in. in height, 9 in. in diameter

8
and 18 in. in height, or 12 in. in diameter and 24 in. in height. However, another study that used
RLT testing to evaluate RAP, RCA, and crushed brick indicated that the permanent deformation
not only decreased by up to 37 percent but that the resilient modulus also increased by up to 55
percent for geogrid-reinforced specimens compared to unreinforced specimens (27); in this
study, geogrid was positioned at the middle of the reinforced specimens, which were 4 in. in
diameter and 8 in. in height. Another study reported that specimens with a higher density above
the geogrid, simulating the higher density possible because of the reinforcing effects of geogrid,
exhibited a significant increase in resilient modulus when compared to unreinforced specimens
(18); in this study, geogrid was placed at the middle of the reinforced specimens, which were 6
in. in diameter and 12 in. in height. In another study, RLT testing performed on crushed
amphibolite showed that geogrid confines a region that extends approximately one specimen
diameter above and below the geogrid (26); in this study, geogrid was placed at the middle of the
reinforced specimens, which were 12 in. in diameter and 24 in. in height. Another laboratory
study utilized RLT testing to investigate the effect of varying geogrid position, geometry, and
tensile properties on the structural capacity of aggregate base materials and found that the
location of the geogrid within the test specimens contributed most to the reduction in permanent
strain in the specimens and that placing the geogrid at the upper one-third position within the
specimen yielded better results than placing the geogrid at the middle of the specimen (24); in
this study, geogrid was placed at one of three locations, including the middle, upper one-third, or
upper and lower one-third positions within the reinforced specimens, which were 6 in. in
diameter and 12 in. in height. Other studies have also concluded that varying the location of
geogrid within specimens or laboratory-scale pavement sections can have a significant effect on
test results (20, 23); nonetheless, as demonstrated in most of the cited studies, placing the
geogrid at the middle is most common.
2.3.2 Field Testing
Numerous field experiments have been performed to better understand geogrid
reinforcement of aggregate base material. The experiments involved evaluation of pavement
responses and properties, including cracking, rutting, and stiffness as measured in distress
surveys and dynamic cone penetrometer (DCP) tests.
9
Distress surveys involve assessing the distresses, including cracking and rutting, evident
in a pavement section. Distress surveys are commonly performed after accelerated pavement
testing and full-scale field testing to evaluate pavement performance. Full-scale field testing
involves constructing pavement sections and subjecting them to trafficking, usually in a
controlled environment, and accelerated pavement testing involves subjecting pavement sections
to specified levels of trafficking in a comparatively short period of time, usually using a testing
assembly. A study performed using full-scale accelerated pavement testing with measurements
of rutting and cracking showed that placing the geogrid at the base-subgrade interface was best
for thin aggregate base layers, while placing the geogrid within the base layer was best for
thicker base layers (7); in this study, geogrid was placed at one of two locations, including the
base-subgrade interface or the upper one-third position within the base layer in the reinforced
sections, which each had a base layer that varied in thickness from 8 to 18 in. Another study
performed using accelerated pavement testing on a one-third-scale model pavement section
found that the resilient modulus of the pavement section was not significantly influenced by the
inclusion of geogrid reinforcement, but rutting in the subgrade layer was reduced (28); in this
study, geogrid was placed at the base-subgrade interface in the reinforced sections, which each
had a 4-in.-thick base layer and a 1.5-in.-thick asphalt layer. In one study, researchers
constructed a single-lane test track with different types of geogrid in many test sections with base
thickness varying from 12 to 20 in. throughout the track; they found that 12-in.-thick geogrid-
reinforced base layers sustained the same amount of rutting as 20-in.-thick unreinforced base
layers (5); in this study, geogrid was placed at the base-subgrade interface in the reinforced
sections, which each had a base layer that varied in thickness from 12 to 20 in. and a 3-in.-thick
asphalt layer.
DCP testing involves recording the number of hammer drops required to drive a cone-
tipped rod into the ground, and the penetration rate of the rod is used to estimate the in-situ
strength of soils as described in ASTM D6951 (Standard Test Method for Use of the Dynamic
Cone Penetrometer in Shallow Pavement Applications). In one study, DCP test results showed
that a region of increased stiffness immediately above the geogrid layer was attained because of
the lateral confinement provided by the geogrid (9); in this study, geogrid was placed at one of
two locations, including the base-subgrade interface or the lower one-third position within the
base layer in the reinforced section, which had a base layer that varied in thickness from 8 to 18

10
in. and an asphalt layer that was 3 in. thick. In another study, the results of DCP tests performed
on unreinforced and geogrid-reinforced pavement sections after 5 years of trafficking showed
that the reinforced base materials had a region extending 4 to 6 in. above the geogrid with
increased stiffness when compared to the unreinforced materials (16); in this study, geogrid was
placed at the base-subgrade interface in the reinforced sections, which each had a base layer that
varied in thickness from 6 to 11 in. and an asphalt layer that was 9 to 11 in. thick.
2.4 Summary
Flexible pavements are generally designed to have multiple layers of varying mechanical
properties, with stronger layers placed over weaker layers. The layers normally included in
flexible pavement are a surface course composed of hot mix asphalt, a base course composed of
aggregate base material, and the natural soil that exists on site, known as the subgrade. Each
layer protects the layers beneath by decreasing the magnitude of traffic-induced stresses that are
transferred downwards into the pavement structure. The interparticle friction in the base course,
especially between the larger aggregates, allows the base layer to spread traffic loads over the
subgrade. Weak subgrade materials can cause difficulty in road construction because they may
not offer sufficient support for compaction of overlying base materials to an appropriate density.
Geogrid reinforcement is sometimes placed over weak subgrades to create an improved
construction platform that leads to better compaction and greater strength of the base material.
Since the 1980s, geogrid reinforcement of base materials has been increasingly used in
roadway construction, and several laboratory and field studies have been performed to evaluate
its performance. Laboratory testing has involved evaluation of a number of material properties as
measured in the plate load test, triaxial shear test, and RLT test. Field testing has involved
evaluation of pavement responses and properties as measured in distress surveys and DCP tests.
Multiple laboratory studies have shown increases in modulus as a result of geogrid
reinforcement, while other studies have not shown an increase. Likewise, some field studies have
shown increases in modulus and stiffness as a result of geogrid reinforcement, while other
studies have not shown an increase. Variations in testing protocols, specimen dimensions,
materials, and geogrid placement may all contribute to the inconsistent results of these laboratory
and field studies on geogrid reinforcement of aggregate base materials.

11
3.0 PROCEDURES
3.1 Overview
This research was motivated by the need to identify a single laboratory test protocol that
UDOT engineers could specify to quantify improvements in structural capacity of aggregate base
materials reinforced with geogrid. In this research, various laboratory testing procedures were
evaluated with respect to their ability to demonstrate improvements in material properties
commonly used in pavement design, such as modulus or CBR, for example. This chapter
describes the experimental design, materials characterization, test procedures, and statistical
analyses performed for this research.
3.2 Experimental Design
The experimental design for this research is presented in
Table 3-1. Testing was performed on aggregate base materials from the Point of the
Mountain Pit and the Trenton Gravel Pit #3, both of which are located in northern Utah. The
base materials from the Point of the Mountain and Trenton Pits were included in this research
because they are representative of aggregate base materials commonly used on UDOT projects
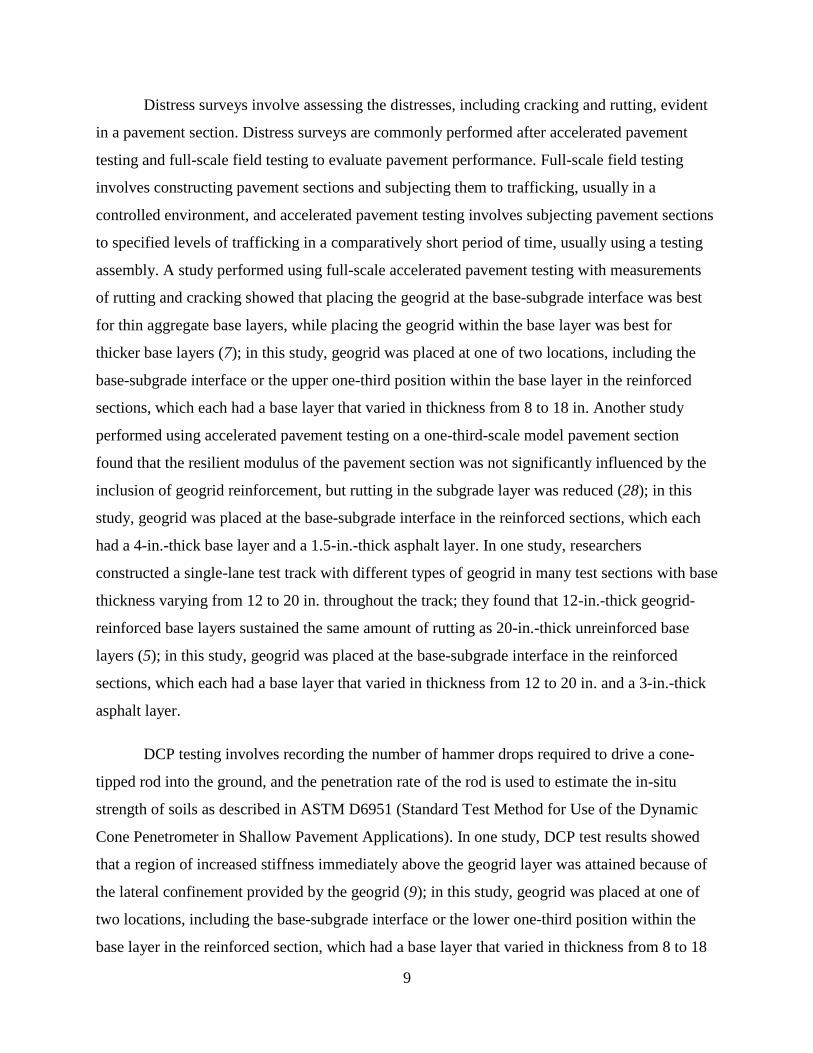
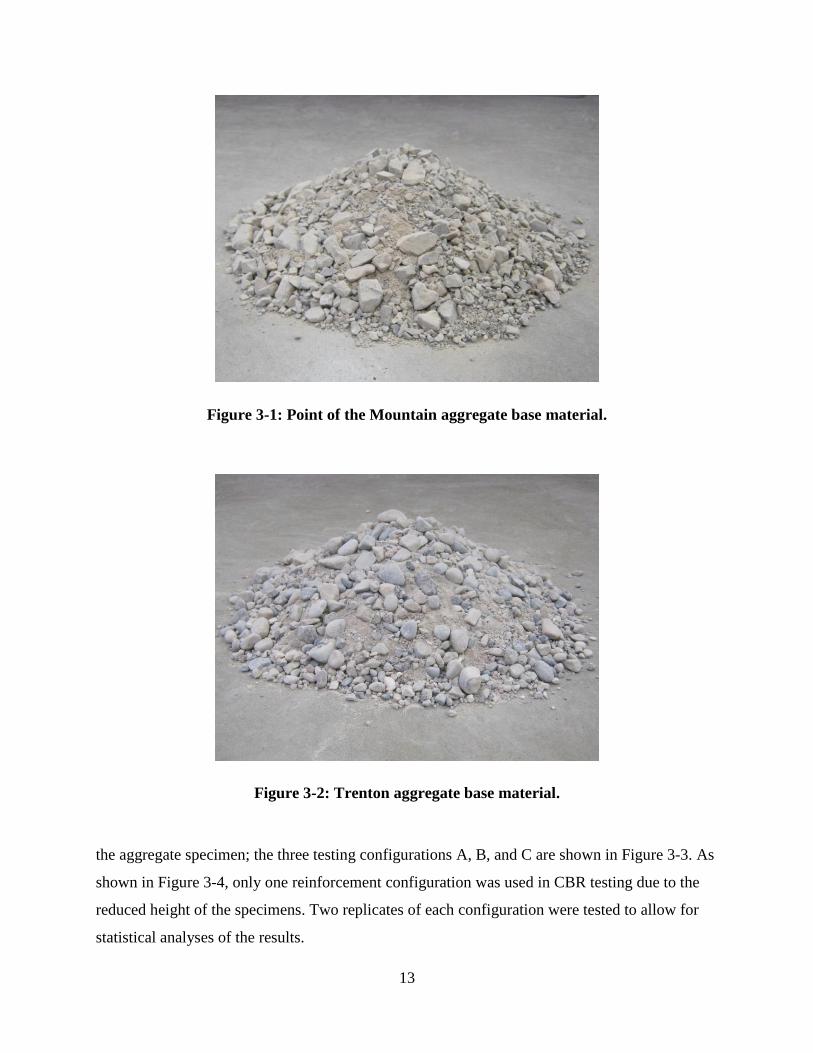
and because they also exhibit different particle angularity; as depicted in Figures 3-1 and 3-2, the
Point of the Mountain material is an angular, crushed aggregate, and the Trenton material is a
rounded gravel. In addition to unreinforced control specimens, testing was also performed on
specimens reinforced with BX or TX geogrid, which was supplied in rolls by the manufacturer.
The purpose of including these primary geogrid types was to ensure that the experimentation was
representative of the geogrid products available in the industry. Geogrid circles having a
diameter of approximately 5.8 in., as shown in Figure 1-1, were cut from the rolls and placed
within the specimens. The geogrid circles were cut in such a way as to preserve the maximum
number of intact apertures; the BX geogrid had eight intact rectangular apertures with side
lengths of approximately 1.1 and 1.3 in., and the TX geogrid had 13 intact triangular apertures
with equal side lengths of approximately 1.5 in. Three different reinforcement configurations
were tested for each unique combination of aggregate and geogrid using the NCHRP Report 598

12
RLT and AASHTO T 307 quick shear test protocols to investigate the effect of geogrid
positioning within
Table 3-1: Experimental Design
NCHRP
598
AASHTO
T 307CBR
None - x x x
A x x x
B x x
C x x
A x x x
B x x
C x x
None - x x x
A x x x
B x x
C x x
A x x x
B x x
C x x
MaterialGeogrid
Type
Geogrid
Configuration
Test Protocol
Point of
the
Mountain
BX
TX
Trenton
BX
TX
13
Figure 3-1: Point of the Mountain aggregate base material.
Figure 3-2: Trenton aggregate base material.
the aggregate specimen; the three testing configurations A, B, and C are shown in Figure 3-3. As
shown in Figure 3-4, only one reinforcement configuration was used in CBR testing due to the
reduced height of the specimens. Two replicates of each configuration were tested to allow for
statistical analyses of the results.
14
Different compaction procedures were used for the different reinforcement configurations
evaluated in the NCHRP Report 598 and AASHTO T 307 protocols. In configuration A, the
geogrid was placed horizontally in the middle of the third of five lifts to allow both top-down
and bottom-up penetration of the aggregate into the geogrid apertures. Half of the material for
the third lift was placed in the mold and leveled by hand, the geogrid was placed on top, and the
second half of the lift was then placed and compacted. In configuration B, the geogrid was
placed on top of the third of six lifts to allow top-down penetration of the aggregate. After the
third lift was compacted, the surface was lightly scarified, the geogrid was placed on top, and the
fourth lift was placed and compacted. In configuration C, the geogrid was placed on top of the
sixth of eight lifts after the surface of the sixth lift was scarified in the same manner as performed
for configuration B. Configuration C was added to the experimental design to examine
placement of geogrid at an upper position within the reinforced specimens. The unreinforced
control specimens tested using the NCHRP Report 598 and AASHTO T 307 protocols were
compacted in five and six lifts, respectively.
For the CBR testing, the geogrid in configuration A was placed on top of the third of five
lifts after the surface of the third lift was lightly scarified. This geogrid position was chosen
because it was high enough in the specimen to allow the aggregate to engage the geogrid as the
piston was driven into the top of the specimen but also low enough in the specimen to allow
development of a normal aggregate matrix above the geogrid. The unreinforced control
specimens tested using the CBR testing protocols were compacted in five lifts.

15
Figure 3-3: Testing configurations for NCHRP Report 598 RLT and
AASHTO T 307 quick shear testing.
Figure 3-4: Testing configuration for CBR testing.

16
3.3 Materials Characterization
To characterize the materials, the aggregates were initially dried at 140°F and sieved in
bulk to produce a master gradation. Based on the master gradation, samples of each aggregate
base material were subsequently prepared for washed sieve analysis, Atterberg limits testing, and
determination of optimum moisture content (OMC) and maximum dry density (MDD). In
addition, the aggregates were classified according to the Unified Soil Classification System
(USCS) and the AASHTO methods. The specific procedures applicable to this testing are
documented in other research (29).
3.4 Testing of Geogrid-Reinforced Base Materials
As previously discussed, specimens of geogrid-reinforced aggregate base materials were
evaluated using three different methods, including the NCHRP Report 598 RLT, AASHTO T
307 quick shear, and CBR protocols. The specimen preparation and testing procedures are
outlined in the following sections.
3.4.1 NCHRP Report 598 Repeated Load Triaxial Testing
RLT testing was performed in general accordance with the NCHRP Report 598 RLT test
procedures. The testing consists of 10 sequences of 1,000 cycles each, where each cycle lasts 1
second. During each cycle, a deviatoric stress is applied through a haversine-shaped load pulse
over a 0.1-second time interval that is followed immediately by a 0.9-second rest period. The
confining stress remains constant at 15 psi during the test. The deviatoric stress is 10 psi for the
first sequence and 20 psi for the second sequence and then increases by 20 psi for each
subsequent sequence.
NCHRP Report 598 test procedures require a sophisticated testing apparatus in order to
execute the precise loadings and measurements necessary for successful test results. The
computer-controlled, servo-hydraulic UTM-100 equipment available in the Brigham Young
University Highway Materials Laboratory was utilized for the testing. Figure 3-5 displays the
UTM-100 setup in the laboratory.

17
The specimens prepared for testing using the NCHRP Report 598 method were 6 in. in
diameter and 12 in. in height. The appropriate amounts of each sieve size were weighed out for
Figure 3-5: UTM-100 testing equipment.
each material according to the respective master gradation to produce a sample of the appropriate
dimensions and the target unit weight as determined from the respective MDD.
After being weighed out, the aggregate samples were placed in the oven at 140°F for at
least 24 hours to remove any residual moisture. The samples were then removed from the oven,
covered in aluminum foil, and placed on the bench for 4 hours to cool to room temperature. Once
the samples were cooled, an appropriate amount of deionized water was added to bring the
gravimetric water content of the specimens to 0.5 to 1.0 percent above the previously determined
OMC; the additional water was added to compensate for the amount of water evaporation that
can occur during sample preparation in the laboratory. The water was mixed into the aggregate
samples until uniform color and texture were achieved. The moistened aggregates were then
sealed in an airtight plastic bag and allowed to equilibrate for 24 hours.
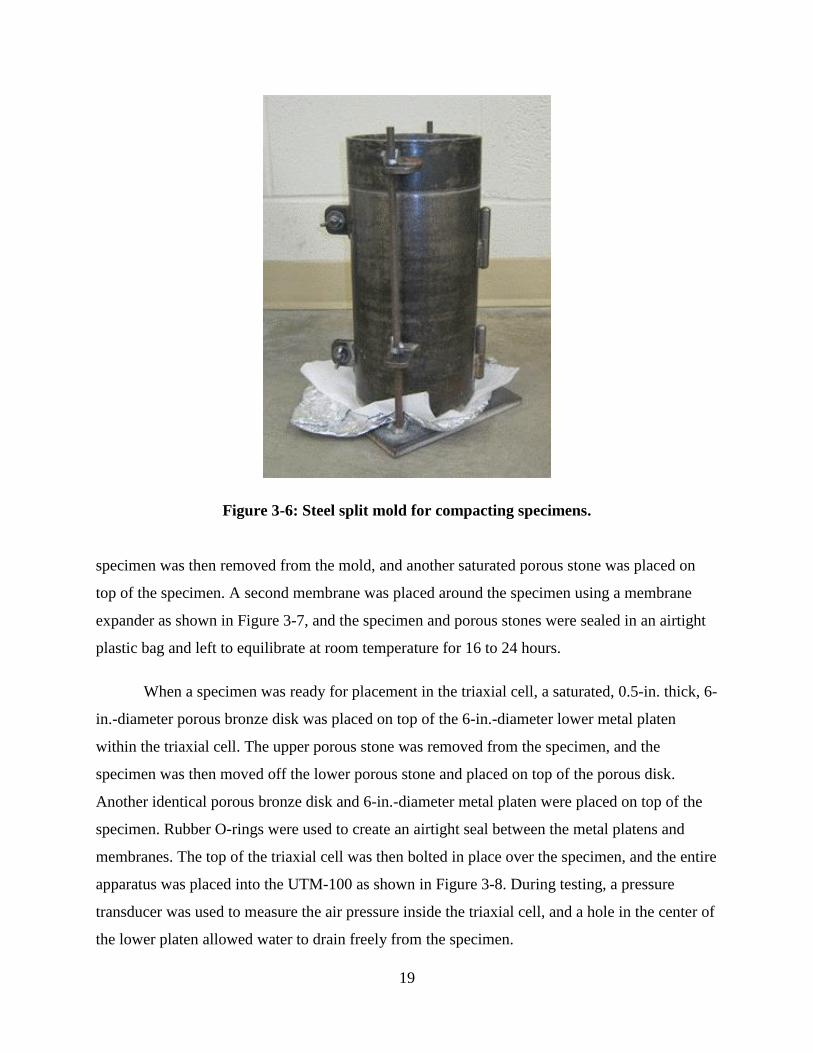
The specimens were compacted in a custom-made steel split mold with an inner diameter
of 6 in. and a height of 12 in., which was fastened to a steel base plate as shown in Figure 3-6.
18
The mold was prepared by first placing a layer of aluminum foil on the base plate to provide
support to the bottom of the compacted specimen when it was later transferred from the base
plate. A latex membrane was placed inside the mold. The mold was secured to the base plate,
and a collar was placed on top of the mold to prevent damage to the top of the inner membrane
during the compaction process. Specimens were compacted manually in lifts of equal weight in
general accordance with ASTM D1557 (Standard Test Methods for Laboratory Compaction
Characteristics of Soil Using Modified Effort (56,000 ft-lbf/ft3 (2,700 kN-m/m
3))). Modified
Proctor compaction effort required 122 blows per lift for the six-lift specimens, 146 blows per
lift for the five-lift specimens, and 92 blows per lift for the eight-lift specimens. Prior to
placement of another lift in the mold, a flathead screwdriver was used to lightly scarify the
surface of each compacted lift to a depth of about 0.125 in. in three parallel lines, which were 1.5
to 2.0 in. apart, and another three similarly spaced parallel lines perpendicular to the first three.
Care was taken not to dislodge large aggregates during this process. A finishing tool was used to
flatten the top lift of the specimens; in this process, three drops of a 10-lb. hammer were applied
from a height of 18 in. onto a 6-in.-diameter plate placed on top of the compacted specimen.
After compaction of a specimen was complete, the specimen and mold were removed from the
base plate and placed on top of a saturated, 2-in.-thick, 6-in.-diameter porous stone. The
19
Figure 3-6: Steel split mold for compacting specimens.
specimen was then removed from the mold, and another saturated porous stone was placed on
top of the specimen. A second membrane was placed around the specimen using a membrane
expander as shown in Figure 3-7, and the specimen and porous stones were sealed in an airtight
plastic bag and left to equilibrate at room temperature for 16 to 24 hours.
When a specimen was ready for placement in the triaxial cell, a saturated, 0.5-in. thick, 6-
in.-diameter porous bronze disk was placed on top of the 6-in.-diameter lower metal platen
within the triaxial cell. The upper porous stone was removed from the specimen, and the
specimen was then moved off the lower porous stone and placed on top of the porous disk.
Another identical porous bronze disk and 6-in.-diameter metal platen were placed on top of the
specimen. Rubber O-rings were used to create an airtight seal between the metal platens and
membranes. The top of the triaxial cell was then bolted in place over the specimen, and the entire
apparatus was placed into the UTM-100 as shown in Figure 3-8. During testing, a pressure
transducer was used to measure the air pressure inside the triaxial cell, and a hole in the center of
the lower platen allowed water to drain freely from the specimen.

20
Figure 3-7: Membrane expander.
The resilient modulus and number of cycles to failure were recorded for each specimen
tested. (Although cycles to failure is not a pavement design input and would therefore not by
itself be an appropriate measure of the degree of improvement that may be achieved by a given
geogrid in the context of this research, it was included in this experimentation because it was
easy to measure in conjunction with resilient modulus.) As specified in the NCHRP Report 598
test procedures, the resilient modulus was calculated using the methods outlined in the AASHTO
T 307 test procedures. The testing stopped when the specimens reached 10 percent strain or
10,000 cycles, whichever occurred first. After the testing, the specimens were dried to constant
weight, and the gravimetric moisture content was calculated. The dry density of each specimen
was estimated from the wet density measured immediately after compaction and the moisture
content measured immediately after testing.

21
Figure 3-8: Triaxial cell placed inside the UTM-100.
3.4.2 AASHTO T 307 Quick Shear Testing
Quick shear testing was performed in general accordance with the applicable portions of
AASHTO T 307. The specimens were subjected only to the shear portion of the test; the
conditioning and resilient modulus portions of the test were not performed. The testing consisted
of measuring the compressive load while subjecting the specimens to a constant strain rate of
0.12 in. per minute, which corresponds to 1 percent strain per minute. The confining pressure
remained constant at 5 psi throughout the testing.
Specimens tested using the AASHTO T 307 quick shear procedure were prepared in the
same manner as the specimens tested using the NCHRP Report 598 method, including the
compaction procedures and assembly in the UTM-100. However, in the AASHTO T 307 testing,
the specimens were allowed to equilibrate for several minutes until reaching constant height
under the applied confining pressure before the testing commenced. Measurements of load and

22
axial displacement were recorded and used to develop a stress-strain plot for each specimen
tested. The test stopped when the specimens reached 15 percent strain, and the peak axial stress
was recorded. In addition, various modulus values were calculated from the plot, including the
modulus to the peak axial stress, the modulus of the elastic portion of the curve, and the modulus
at 2 percent strain in the specimens.
The modulus to the peak axial stress was calculated by dividing the peak stress by the
corresponding strain. The modulus of the elastic portion of the curve was calculated as the slope
of a linear trend line computed for a middle portion of the stress-strain curve between the start of
the test and the greater of the peak stress or the stress corresponding to a level of 10 percent
strain; specifically, the curve in this range was divided into four segments of equal length, and
the slope of the second segment was analyzed. A maximum strain value of 10 percent was
chosen in this analysis because all of the specimens experienced plastic deformation at this strain
level. The modulus at 2 percent strain was calculated by dividing the stress corresponding to 2
percent strain by a strain value of 2 percent. Linear interpolation was used when necessary to
determine the exact value of stress corresponding to 2 percent strain in each test.
After the testing, the specimens were dried to constant weight, and the gravimetric
moisture content was calculated. The dry density of each specimen was estimated from the wet
density measured immediately after compaction and the moisture content measured immediately
after testing.
3.4.3 California Bearing Ratio Testing
CBR testing was performed in general accordance with ASTM D1883. The testing
consists of measuring the compressive load sustained by the specimen as a 1.95-in.-diameter
loading piston is driven into the top of the specimen at a strain rate of 0.05 in. per minute. Load
measurements are reported at every 0.1 in. of penetration up to 0.5 in.
CBR specimens were prepared in much the same way as the specimens tested using the
NCHRP Report 598 method; however, the aggregate was compacted into a 6-in.-diameter mold
that was only 4.59 in. in height, and latex membranes were not used. Each specimen was
compacted using 56 blows per lift in five equal lifts by weight, in general accordance with

23
ASTM D1557. The compacted specimen, mold, and base plate were then sealed in an airtight
plastic bag and left to equilibrate at room temperature for 16 to 24 hours, after which the
specimen was tested using an Instron material testing machine, as shown in Figure 3-9. A ring-
shaped metal weight was placed on top of the specimen to provide the overburden stress required
during testing. To calculate the CBR, the stresses computed at the penetration depths of 0.1, 0.2,
0.3, 0.4, and 0.5 in. were divided by 1000, 1500, 1900, 2300, and 2600 psi, respectively, to
obtain the ratio of the measured stress to the standard stress. The maximum of these ratios was
multiplied by 100 to obtain the CBR. After the testing, the specimens were dried to constant
weight, and the gravimetric moisture content was calculated. The dry density of each specimen
was estimated from the wet density measured immediately after compaction and the moisture
content measured immediately after testing.
Figure 3-9: CBR specimen placed inside the Instron material testing machine.
24
3.5 Statistical Analyses
An analysis of covariance (ANOCOVA) was performed on the results of each test for
each aggregate base material. The independent variable in each ANOCOVA model was
treatment, where an individual treatment was one of seven unique combinations of geogrid type
and configuration, as applicable, for the NCHRP Report 598 RLT and AASHTO T 307 quick
shear testing and one of three unique combinations of geogrid type and configuration, as
applicable, for the CBR testing. The potential covariates were moisture content, as measured
immediately after testing, and dry density, and they were represented in the ANOCOVA as
percentage of OMC and percentage of MDD, respectively, where the OMC and MDD values
were those for the given aggregate base material. When either covariate had a p-value greater
than 0.15, it was removed from the model. The p-value of 0.15 was used because it is the default
value for variable selection using the stepwise function in the statistical analysis program used in
this research (30). The dependent variables were the modulus and number of cycles to failure
from the NCHRP Report 598 testing; the peak axial stress, modulus to the peak stress, modulus
of the elastic portion of the curve, and modulus at 2 percent strain from the AASHTO T 307
testing; and the CBR. For each dependent variable, post-hoc pairwise comparisons were
performed to assess the difference between the control and each of the unique combinations of
geogrid type and configuration that were evaluated. The differences were reported in terms of a
t-value that facilitated comparison of the various treatment combinations. The treatment with the
largest magnitude of t-value within any single subgroup of treatments was determined to be the
most different from the control, where positive t-values signify an increase in structural capacity
of the geogrid-reinforced specimens compared to the control specimens.
To determine which method of data analysis is most likely to consistently show an
improvement in the structural capacity of geogrid-reinforced aggregate base materials, the lower
bound of the 95 percent confidence interval for the t-values from the post-hoc pairwise
comparisons that were performed on the results from the AASHTO T 307 testing was computed
for each method of data analysis. In this analysis, the t-values for both aggregate base materials
were pooled for each method, and an Anderson-Darling normality test was performed to
determine if the pooled set of t-values for each method were normally distributed, where normal
distributions are indicated by a p-value greater than or equal to 0.05. The data that were found to
25
be non-normally distributed were transformed, as needed, and the Anderson-Darling normality
test was performed again. The lower bound of the 95 percent confidence interval was then
computed for each method of data analysis by subtracting 1.96 standard deviations from the
mean, where the mean and standard deviation were computed from the pooled set of t-values.
For the method(s) for which a transformation was required, the resulting lower bound was then
untransformed to give a value that could be directly compared to the other bounds. The method
with the highest lower bound was determined to be the method most likely to show an
improvement in structural capacity associated with geogrid reinforcement.
In addition, for the selected method of data analysis, to determine which geogrid
configuration is most likely to consistently show an improvement in the structural capacity of
geogrid-reinforced aggregate base materials, the lower bound of the 95 percent confidence
interval for the t-values from the same post-hoc pairwise comparisons was computed. In this
analysis, the t-values for both aggregate base materials were again pooled for each geogrid
configuration, and an Anderson-Darling normality test was performed to determine if the data
from each configuration were normally distributed. The lower bound of the 95 percent
confidence interval was then computed for each configuration by subtracting 1.96 standard
deviations from the mean, where the mean and standard deviation were computed from the
pooled set of t-values. The geogrid configuration with the highest lower bound was determined
to be the configuration most likely to show an improvement in structural capacity associated with
geogrid reinforcement.
3.6 Summary
This research was motivated by the need to identify a single laboratory test protocol that
UDOT engineers could specify to quantify improvements in structural capacity of aggregate base
materials reinforced with geogrid. The factors investigated in this research were test protocol,
aggregate base material, geogrid type, and geogrid placement. The testing protocols used in this
research were the NCHRP Report 598 RLT, AASHTO T 307 quick shear, and CBR protocols.
Testing was performed on unreinforced and geogrid-reinforced aggregate base material from the
Point of the Mountain Pit and the Trenton Gravel Pit #3, both of which are located in northern
Utah. These materials were included in this research because they are representative of aggregate
26
base materials commonly used on UDOT projects and because they also exhibit different particle
angularity. Two geogrid types, BX and TX, were utilized in this research to ensure that the
experimentation was representative of the geogrid products available in the industry. Three
different reinforcement configurations were tested for each unique combination of aggregate and
geogrid using the NCHRP Report 598 and AASHTO T 307 test protocols. Only one
reinforcement configuration was used in CBR testing due to the reduced height of the specimens.
Two replicates of each configuration were tested to allow for statistical analysis of the results.
The aggregate base materials used in this research were characterized using washed sieve
analyses and Atterberg limits testing, and soil classifications were determined according to the
USCS and AASHTO methods. The OMC and MDD were also determined.
The resilient modulus and number of cycles to failure were recorded for each specimen
tested using the NCHRP Report 598 procedures. For the AASHTO T 307 testing, the resulting
stress-strain plot for each specimen was analyzed, the peak axial stress was determined, and
various modulus values were calculated from the plot, including the modulus to the peak axial
stress, the modulus of the elastic portion of the curve, and the modulus at 2 percent strain in the
specimens. The CBR was determined by dividing the measured stresses by the standard stresses
and selecting the largest ratio. The dry density of each specimen was estimated from the wet
density measured immediately after compaction and the moisture content measured immediately
after testing.
An ANOCOVA was performed on the results of each test for each aggregate base
material. For each dependent variable, post-hoc pairwise comparisons were performed, and t-
values were calculated to assess the difference between the control and each of the unique
treatment combinations of geogrid type and configuration that were evaluated. Anderson-Darling
normality tests were performed to determine if the pooled sets of t-values were normally
distributed, and the lower bounds of the 95 percent confidence intervals were computed. The test
method and the geogrid configuration with the highest lower bound were determined to be the
method and the configuration most likely to show an improvement in structural capacity
associated with geogrid reinforcement.

27
4.0 RESULTS AND ANALYSIS
4.1 Overview
This chapter presents the results of testing and statistical analyses performed for this
research. While the various laboratory test procedures are directly compared through formal
statistical analyses, differences in performance between the two aggregate base materials and the
two geogrid types are discussed only incidentally. As explained in Chapter 3, the two aggregate
base materials and the two geogrid types were selected only to ensure that the experimentation
was representative of the products available in the industry.
4.2 Test Results
Materials characterization included washed sieve analysis, Atterberg limits testing, soil
classification, and determination of OMC and MDD for each aggregate base material. The
results of the washed sieve analyses are plotted in Figure 4-1, which shows that the Point of the
Mountain material is finer than the Trenton material. Based on the washed sieve analyses and the
Atterberg limits testing, which indicated that neither material was plastic, the Point of the
Mountain material was classified as A-1-a and SW-SM (well-graded sand with silt and gravel),
and the Trenton material was classified as A-1-a and GW (well-graded gravel with sand)
according to the AASHTO and USCS methods, respectively. The OMC and MDD values
obtained from moisture-density testing of the materials are shown in Table 4-1, and the
corresponding moisture-density curves are shown in Appendix A. Given the relative sizes of the
largest aggregate particles and the geogrid apertures, the results of especially the sieve analyses
indicate that both aggregate base materials exhibit the potential for interlocking with both types
of geogrid included in the study. Compared to the unreinforced condition, some improvement in
structural capacity associated with geogrid reinforcement was therefore expected.
The average test results obtained in the NCHRP Report 598 RLT, AASHTO T 307 quick
shear, and CBR tests are given in Tables 4-2 to 4-4, respectively; two replicate specimens were
evaluated in each test. Hyphens in these tables indicate that geogrid configuration was not
applicable due to the absence of geogrid in the control specimens. Data for individual specimens,

28
including the moisture content measured immediately after testing and the estimated dry density,
are provided in Appendix B. The results of statistical analyses and discussion of the data are
provided in the next section.
Figure 4-1: Particle-size distributions.
Table 4-1: Moisture-Density Relationships
0
10
20
30
40
50
60
70
80
90
100
0.00100.01000.10001.0000
Per
cen
t F
iner
(%
)
Grain Size (in.)
Point of the Mountain
Trenton
Point of the
Mountain6.6 138.0
Trenton 5.6 142.2
MaterialOptimum Moisture
Content (%)
Maximum Dry
Density (pcf)

29
Table 4-2: NCHRP Report 598 RLT Test Results
Table 4-3: AASHTO T 307 Quick Shear Test Results
MaterialGeogrid
Type
Geogrid
Configuration
Average
Resilient
Modulus (ksi)
Average
Cycles to
Failure
None - 23.3 7013
A 20.9 6035
B 21.7 6062
C 20.1 6230
A 29.7 9926
B 23.1 6797
C 23.2 7177
None - 29.0 7722
A 26.9 7709
B 27.3 8309
C 21.9 5677
A 35.4 9507
B 20.1 4583
C 22.6 5382
Trenton
BX
TX
Point of the
Mountain
BX
TX
MaterialGeogrid
Type
Geogrid
Configuration
Average Peak
Axial Stress
(psi)
Average Modulus
to Peak Stress
(psi)
Average Elastic
Modulus (psi)
Average
Modulus at 2%
Strain (psi)
None - 77.9 2591 3198 3414
A 97.3 3616 5352 4417
B 98.8 2998 3635 4081
C 81.8 3617 5548 4203
A 83.8 2956 4783 3860
B 89.6 3064 4868 4143
C 92.7 3963 5696 4436
None - 55.5 575 965 874
A 68.5 925 1089 1099
B 84.9 609 1227 1145
C 58.8 1082 1228 1187
A 70.7 702 1137 1174
B 86.9 704 1191 1183
C 49.1 845 1090 1071
Trenton
BX
TX
Point of the
Mountain
BX
TX

30
Table 4-4: CBR Test Results
4.3 Statistical Analyses
The results of statistical analyses included results for the ANOCOVAs and also for post-
hoc pairwise comparisons that were performed on the data. The p-values for the full and reduced
ANOCOVA models are presented in Appendix C. Among the ANOCOVAs performed for the
Point of the Mountain material, moisture content was included as a covariate in terms of
percentage of OMC in the analysis of the resilient modulus and cycles to failure data from the
NCHRP Report 598 RLT testing, and dry density was included as a covariate in terms of
percentage of MDD in the analysis of the peak axial stress data from the AASHTO T 307 quick
shear testing. Among the ANOCOVAs performed for the Trenton material, neither moisture
content nor dry density were included as covariates. The results of the post-hoc pairwise
comparisons used to analyze the NCHRP Report 598, AASHTO T 307, and CBR test data are
presented in Tables 4-5 through 4-7.
As shown in Tables 4-5 and 4-7, the average t-value calculated for both materials, both
geogrid types, and all configurations from the NCHRP Report 598 and CBR testing is negative
for each test result, signifying that the geogrid-reinforced specimens had lower structural
capacity than the unreinforced specimens for both materials evaluated in this research according
to those methods. Therefore, for the base materials and reinforcement configurations tested, the
NCHRP Report 598 and CBR procedures are not likely to produce results showing an
improvement in resilient modulus, cycles to failure, or CBR as a result of the inclusion of
geogrid in the test specimens; in particular, the results of the NCHRP Report 598 testing are
consistent with selected literature showing that the inclusion of geogrid does not generally have a
MaterialGeogrid
Type
Geogrid
Configuration
Average
CBR
None - 109
BX A 142
TX A 94
None - 73
BX A 57
TX A 58
Point of the
Mountain
Trenton

31
Table 4-5: Statistical Analyses of NCHRP Report 598 RLT Test Results
Table 4-6: Statistical Analyses of AASHTO T 307 Quick Shear Test Results
Resilient
Modulus
Cycles to
Failure
A -1.82 -1.89
B -2.09 -2.75
C -2.72 -1.77
A 4.78 5.44
B 0.26 0.03
C 1.86 2.45
A -0.84 -0.01
B -0.68 0.53
C -2.83 -1.86
A 2.57 1.62
B -3.58 -2.85
C -2.56 -2.13
-0.64 -0.27
2.44 2.38
MaterialGeogrid
Type
Geogrid
Configuration
t -value
Average
Standard Deviation
Point of the
Mountain
BX
TX
Trenton
BX
TX
Peak Axial
Stress
Modulus to
Peak Stress
Elastic
Modulus
Modulus at
2% Strain
A 0.61 1.94 2.27 2.46
B 1.39 0.77 0.79 1.64
C -1.02 1.94 2.63 1.94
A -0.52 0.69 1.50 1.10
B 0.01 0.90 0.97 1.79
C -0.15 2.60 2.60 2.51
A 2.48 4.97 1.28 1.90
B 5.56 0.47 2.35 2.28
C 0.63 7.20 1.69 2.64
A 2.88 1.81 0.81 2.53
B 5.95 1.83 1.87 2.60
C -1.20 3.83 1.17 1.66
1.39 2.41 1.66 2.09
2.30 1.92 0.65 0.47
Trenton
BX
TX
Average
Standard Deviation
t -valueGeogrid
Type
Geogrid
ConfigurationMaterial
Point of the
Mountain
BX
TX

32
Table 4-7: Statistical Analyses of CBR Test Results
significant effect on the resilient modulus of base materials (21, 23, 24, 25, 26). Because neither
of these two test methods yielded results that satisfied the research objective, they are not
discussed further.
As shown in Table 4-6, the average t-value calculated for both materials, both geogrid
types, and all configuration from the AASHTO T 307 testing is positive for each method of data
analysis, signifying that the geogrid-reinforced specimens had higher structural capacity than the
unreinforced specimens for both materials evaluated in this research according to those methods.
Therefore, for the base materials and reinforcement configurations tested, the AASHTO T 307
procedure is likely to produce results showing an improvement in peak axial stress, modulus to
peak stress, elastic modulus, and/or modulus at 2 percent strain as a result of the inclusion of
geogrid in the test specimens.
In the process of determining which method of data analysis is most likely to consistently
show an improvement in the structural capacity of geogrid-reinforced specimens evaluated using
the AASHTO T 307 procedure, use of the Anderson-Darling normality test showed that the peak
axial stress, elastic modulus, and modulus at 2 percent strain data were normally distributed,
while the modulus to peak stress data were not normally distributed; therefore, a square-root
transformation was applied to normalize the modulus to peak stress data prior to computing the
lower bound of the 95 percent confidence interval, which was then untransformed afterwards.
The results showing the lower bound of the 95 percent confidence interval for each method of
t -value
CBR
BX A 2.65
TX A -1.24
BX A -1.43
TX A -1.32
-0.34
1.72
Material
Point of the
Mountain
Trenton
Average
Standard Deviation
Geogrid
Type
Geogrid
Configuration
33
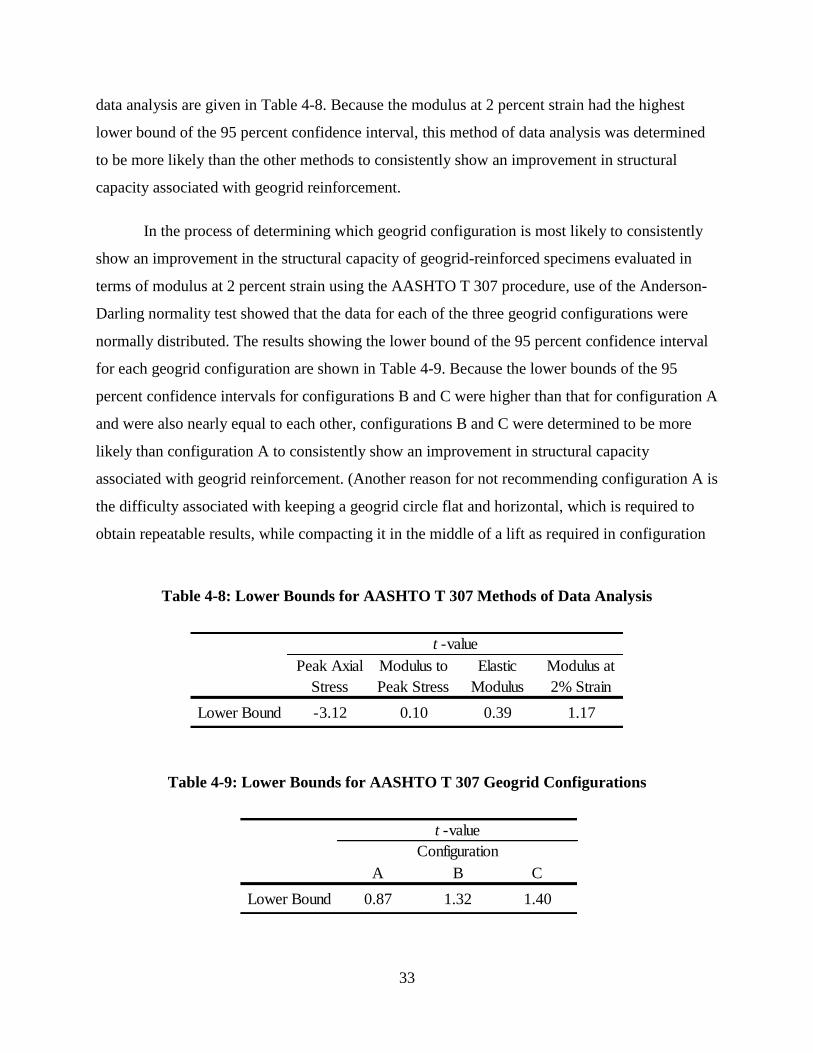
data analysis are given in Table 4-8. Because the modulus at 2 percent strain had the highest
lower bound of the 95 percent confidence interval, this method of data analysis was determined
to be more likely than the other methods to consistently show an improvement in structural
capacity associated with geogrid reinforcement.
In the process of determining which geogrid configuration is most likely to consistently
show an improvement in the structural capacity of geogrid-reinforced specimens evaluated in
terms of modulus at 2 percent strain using the AASHTO T 307 procedure, use of the Anderson-
Darling normality test showed that the data for each of the three geogrid configurations were
normally distributed. The results showing the lower bound of the 95 percent confidence interval
for each geogrid configuration are shown in Table 4-9. Because the lower bounds of the 95
percent confidence intervals for configurations B and C were higher than that for configuration A
and were also nearly equal to each other, configurations B and C were determined to be more
likely than configuration A to consistently show an improvement in structural capacity
associated with geogrid reinforcement. (Another reason for not recommending configuration A is
the difficulty associated with keeping a geogrid circle flat and horizontal, which is required to
obtain repeatable results, while compacting it in the middle of a lift as required in configuration
Table 4-8: Lower Bounds for AASHTO T 307 Methods of Data Analysis
Table 4-9: Lower Bounds for AASHTO T 307 Geogrid Configurations
Peak Axial
Stress
Modulus to
Peak Stress
Elastic
Modulus
Modulus at
2% Strain
Lower Bound -3.12 0.10 0.39 1.17
t -value
A B C
Lower Bound 0.87 1.32 1.40
Configuration
t -value

34
A.) Among configurations B and C, configuration B may be more favorable because specimens
are more commonly reinforced at the middle, as evidenced in the literature (18, 26, 27).
However, this research and previous research suggest that placing the geogrid at an upper
position within a specimen, similar to configuration C, can yield a greater improvement in
structural capacity than placing geogrid in the middle of the specimens (23, 24).
The region of failure within the specimens, as evidenced by “barreling,” varied
depending on the presence of geogrid and the geogrid configuration. Photographs illustrating the
barreling behavior of specimens in the unreinforced condition and with each reinforcement
configuration are shown in Figures 4-2 and 4-3 for the Point of the Mountain and Trenton
materials, respectively. As observed in both materials, the region of barreling in the control
specimens was not centered at the middle but was shifted slightly upwards from the middle,
perhaps due to the development of a density gradient during compaction, where lower density
may have occurred near the top of the specimen compared to the bottom of the specimen as
observed in other research (15, 31); for unreinforced specimens of uniform density, the region of
barreling would be expected to occur in the middle. The region of barreling in the specimens
reinforced with geogrid in configurations A and B was consistently above the geogrid in the
region of possible lower density. The specimens reinforced with geogrid in configuration C
failed in the region below the geogrid. These specimens likely did not fail in the region above the
geogrid, which may have had lower density, due to the reinforcing effect of the geogrid; previous
research suggests that, in RLT testing, the influence of the geogrid extends approximately one
specimen radius above and below the geogrid layer (26). For configuration C in this research, the
geogrid circles were placed 3 in. below the top surface of the aggregate base specimens, and, as a
result, if the region influenced by the geogrid in quick shear testing is similar to that in RLT
testing, the confinement provided by the geogrid would extend to the top surface of the
specimens and would then not allow failure to occur in that region. Instead, failure would occur
in the region of possible higher density below the geogrid, yielding a greater improvement in
structural capacity compared to other configurations. For this reason, placing the geogrid at an
upper position within a specimen, similar to configuration C, may be more useful for quantifying
improvements in structural capacity of aggregate base materials reinforced with geogrid.

35
(a) (b)
(c) (d)
Figure 4-2: Typical Point of the Mountain specimens after AASHTO T 307 quick shear
testing: (a) no geogrid, (b) geogrid configuration A, (c) geogrid configuration B, (d) geogrid
configuration C.
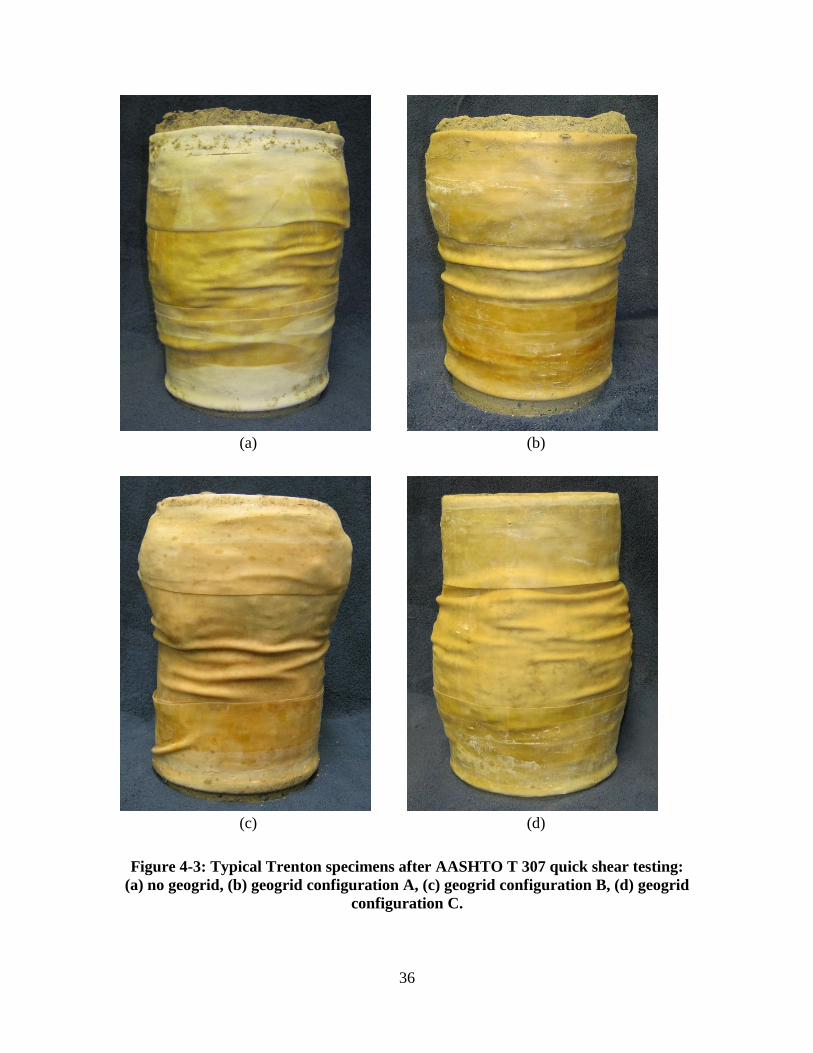
36
(a) (b)
(c) (d)
Figure 4-3: Typical Trenton specimens after AASHTO T 307 quick shear testing:
(a) no geogrid, (b) geogrid configuration A, (c) geogrid configuration B, (d) geogrid
configuration C.
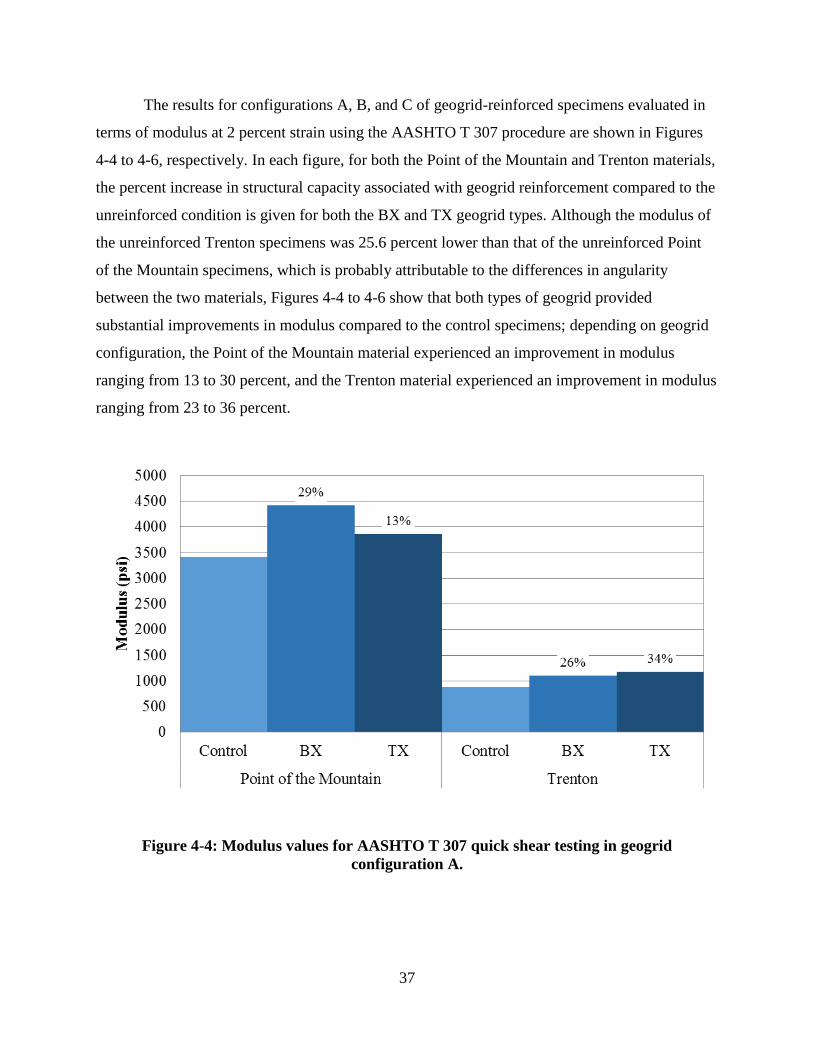
37
The results for configurations A, B, and C of geogrid-reinforced specimens evaluated in
terms of modulus at 2 percent strain using the AASHTO T 307 procedure are shown in Figures
4-4 to 4-6, respectively. In each figure, for both the Point of the Mountain and Trenton materials,
the percent increase in structural capacity associated with geogrid reinforcement compared to the
unreinforced condition is given for both the BX and TX geogrid types. Although the modulus of
the unreinforced Trenton specimens was 25.6 percent lower than that of the unreinforced Point
of the Mountain specimens, which is probably attributable to the differences in angularity
between the two materials, Figures 4-4 to 4-6 show that both types of geogrid provided
substantial improvements in modulus compared to the control specimens; depending on geogrid
configuration, the Point of the Mountain material experienced an improvement in modulus
ranging from 13 to 30 percent, and the Trenton material experienced an improvement in modulus
ranging from 23 to 36 percent.
Figure 4-4: Modulus values for AASHTO T 307 quick shear testing in geogrid
configuration A.

38
Figure 4-5: Modulus values for AASHTO T 307 quick shear testing in geogrid
configuration B.
Figure 4-6: Modulus values for AASHTO T 307 quick shear testing in geogrid
configuration C.

39
4.4 Summary
Based on the washed sieve analyses and the Atterberg limits testing, which indicated that
neither material was plastic, the Point of the Mountain material was classified as A-1-a and SW-
SM (well-graded sand with silt and gravel), and the Trenton material was classified as A-1-a and
GW (well-graded gravel with sand) according to the AASHTO and USCS methods, respectively.
The OMC and MDD values were 6.6 percent and 138.0 pcf for the Point of the Mountain
material and 5.6 percent and 142.2 pcf for the Trenton material. Given the relative sizes of the
largest aggregate particles and the geogrid apertures, the results of especially the sieve analyses
indicate that both aggregate base materials exhibit the potential for interlocking with both types
of geogrid included in the study. Compared to the unreinforced condition, some improvement in
structural capacity associated with geogrid reinforcement was therefore expected.
For the methods and materials evaluated in this study, the average t-values from the post-
hoc pairwise comparisons for the NCHRP Report 598 RLT and CBR testing were negative for
each test result, signifying that the geogrid-reinforced specimens had lower structural capacity
than the unreinforced specimens for both materials evaluated in this research according to those
methods. The average t-values from the post-hoc pairwise comparisons for the AASHTO T 307
quick shear testing were positive for each method of data analysis, signifying that the geogrid-
reinforced specimens had higher structural capacity than the unreinforced specimens for both
materials evaluated in this research according to those methods.
Use of the Anderson-Darling normality test on the results of each of the four methods of
data analysis for AASHTO T 307 showed that only the modulus to peak stress data were not
normally distributed; therefore, a square-root transformation was applied to normalize this data
prior to computing the lower bound of the 95 percent confidence interval, which was then
untransformed afterwards. Because the modulus at 2 percent strain had the highest lower bound
of the 95 percent confidence interval, this method of data analysis was determined to be more
likely than the other methods to consistently show an improvement in structural capacity
associated with geogrid reinforcement.
Use of the Anderson-Darling normality test on the modulus at 2 percent strain data from
the AASHTO T 307 procedure showed that the data for each of the three geogrid configurations

40
were normally distributed. Because the lower bounds of the 95 percent confidence intervals for
configurations B and C were higher than that for configuration A and were also nearly equal to
each other, configurations B and C were determined to be more likely than configuration A to
consistently show an improvement in structural capacity. Among configurations B and C,
configuration B may be more favorable because specimens are more commonly reinforced at the
middle, as evidenced in the literature. However, this research and previous research suggests that
placing the geogrid at an upper position within a specimen, similar to configuration C, can yield
a greater improvement in structural capacity than placing geogrid in the middle of the specimens.
For the protocols and geogrid configurations evaluated in this research, both types of
geogrid provided substantial improvements in modulus for the geogrid-reinforced specimens
when compared to the control specimens. Depending on geogrid configuration, the Point of the
Mountain material experienced an improvement in modulus ranging from 13 to 30 percent, and
the Trenton material experienced an improvement in modulus ranging from 23 to 36 percent.

41
5.0 CONCLUSION
5.1 Summary
The modulus of aggregate base layers in pavement structures can potentially be increased
through the use of geogrid. To the extent that the aggregate particles penetrate the openings in
the geogrid, the geogrid increases the lateral confinement of the base material in the region
around the geogrid, which can result in an increase in the modulus of the base layer. However,
methods for determining how much structural benefit can be expected from a given geogrid
product have not been standardized. A laboratory testing protocol is therefore needed to enable
evaluation, in terms of modulus or CBR, for example, of the degree of improvement that may be
achieved by a given geogrid so that the cost of incorporating the geogrid in a pavement structure
can be compared with the potential cost savings associated with its use. Consequently, the
objective of this research was to identify a laboratory test method that can be used to quantify
improvements in structural capacity associated with geogrid reinforcement.
For this research, NCHRP Report 598 RLT, AASHTO T 307 quick shear, and CBR
testing protocols were used to test unreinforced and geogrid-reinforced aggregate base materials
from the Point of the Mountain Pit and the Trenton Gravel Pit #3, both of which are located in
northern Utah. These materials were included in this research because they are representative of
aggregate base materials commonly used on UDOT projects and because they also exhibit
different particle angularity. Two geogrid types, BX and TX, were utilized in this research to
ensure that the experimentation was representative of the geogrid products available in the
industry. Three different reinforcement configurations were tested for each unique combination
of aggregate and geogrid using the NCHRP Report 598 and AASHTO T 307 test protocols. Only
one reinforcement configuration was used in CBR testing due to the reduced height of the
specimens. Two replicates of each configuration were tested to allow for statistical analyses of
the results. Several statistical analyses were performed on the results of each test method to
identify the test that is most likely to consistently show an improvement in the structural capacity
of aggregate base materials reinforced with geogrid.

42
5.2 Findings
The results of this research indicate that, for the methods and materials evaluated in this
study, the NCHRP Report 598 RLT and CBR test methods are not likely to show an
improvement in structural capacity associated with geogrid reinforcement. Instead, calculation of
the modulus at 2 percent strain from the AASHTO T 307 quick shear data is the method most
likely to consistently show an improvement in structural capacity associated with geogrid
reinforcement. Among the three configurations investigated as part of this research,
configuration C, with geogrid placed at an upper position within a specimen, is preferred over
configurations A and B.
5.3 Recommendations
Calculation of the modulus at 2 percent strain from the AASHTO T 307 quick shear data
is recommended as a laboratory test protocol that engineers can specify to quantify
improvements in structural capacity of aggregate base materials reinforced with geogrid. Placing
the geogrid at an upper position within a specimen, similar to configuration C, is recommended
as the configuration most likely to show an improvement in structural capacity associated with
geogrid reinforcement.
Given that the end goal of the use of geogrid reinforcement is to improve pavement
performance, additional research is needed to compare the results of the AASHTO T 307 quick
shear test obtained in the laboratory with the structural capacity of geogrid-reinforced aggregate
base materials measured in the field. In addition, correlations between the results of the
AASHTO T 307 quick shear test and resilient modulus need to be investigated in order to
incorporate the findings of the AASHTO T 307 quick shear test on reinforced base materials into
mechanistic-empirical pavement design; similar correlations for unreinforced base materials
have already been developed (32). Finally, other combinations of aggregate base material and
geogrid should be evaluated using the AASHTO T 307 quick shear test to determine the degree
to which improvements in modulus of aggregate base materials reinforced with geogrid can be
assessed.

43
REFERENCES
1. American Association of State Highway and Transportation Officials (AASHTO) (2008).
“Mechanistic-empirical pavement design guide: a manual of practice.” Washington, DC.
2. National Cooperative Highway Research Program (NCHRP) (2004a). “Guide for
mechanistic-empirical design of new and rehabilitated structures.” NCHRP Report 1-37A,
Transportation Research Board, Washington, DC.
3. National Highway Institute (NHI) (2002). “Introduction to mechanistic-empirical
pavement design: reference manual.” NHI-02-048, Arlington, VA.
4. Montanelli, F., Zhao, A., and Rimoldi, P. (1997). “Geosynthetic-reinforced pavement
system: testing and design.” Proceedings of the Conference Geosynthetics ’97, IFAI,
Roseville, MN, 619-632.
5. Cancelli, A., and Montanelli, F. (1999). “In-ground test for geosynthetic reinforced
flexible paved roads.” Proceedings of the Conference Geosynthetics ’99, IFAI, Roseville,
MN, 863-878.
6. Al-Qadi, I. L., Brandon, T. L., and Bhutta, S. A. (1997). “Geosynthetic stabilized flexible
pavements.” Proceedings of Geosynthetics ’97, Industrial Fabrics Association
International (IFAI), Roseville, MN, 647-662.
7. Al-Qadi, I. L., Dessouky, S. H., Kwon, J., and Tutumluer, E. (2008). “Geogrid in flexible
pavements: validated mechanism.” Transportation Research Record: Journal of the
Transportation Research Board, 2045, 102-109.
8. Qian, Y., Han, J., Pokharel, S., and Parsons, R. (2013). “Performance of triangular
aperture geogrid-reinforced base courses over weak subgrade under cyclic loading.”
Journal of Materials in Civil Engineering, 25(8), 1013-1021.
9. Kwon, J., Tutumluer, E, Al-Qadi, I., and Dessouky, S. (2008). “Effectiveness of geogrid
base-reinforcement in low-volume flexible pavements.” GeoCongress 2008:
Geosustainability and Geohazard Mitigation, ASCE, Reston, VA.

44
10. Perkins, S. W., and Ismeik, M. A. (1997). “A synthesis and evaluation of geosynthetic-
reinforced base layers in flexible pavements: part I. Geosynthetics International, (4)6,
549-604.
11. Perkins, S. W. (1999). “Geosynthetic reinforcement of flexible pavements: laboratory
based pavement test sections.” Report No. FHWA/MT-99-001/8138, Federal Highway
Administration, Washington, DC.
12. Hatami, K., Mahmood, T., Zaman, M., and Ghabchi, R. (2012). “Development of ODOT
guidelines for the use of geogrids in aggregate bases.” Report No. OTCREOS9.1-23-F,
Oklahoma Transportation Center, Midwest City, OK.
13. Tutumluer, E., and Kwon, J. (2006). “Evaluation of geosynthetics use for pavement
subgrade restraint and working platform construction.” ASCE Geotechnical Practice
Publication No. 3: Geotechnical Applications for Transportation Infrastructure, Titi, H.,
eds., ASCE, Reston, VA, 96-107.
14. Palmeira, E. M. (2004). “Bearing force mobilisation in pull-out tests on geogrids.”
Geotextiles and Geomembranes, 22(6), 481-509.
15. NCHRP (2004b). “Laboratory determination of resilient modulus for flexible pavement
design.” NCHRP Report 1-28A, Transportation Research Board, Washington, DC.
16. Kwon, J., and Tutumluer, E. (2009). “Geogrid base reinforcement with aggregate
interlock and modeling of associated stiffness enhancement in mechanistic pavement
analysis.” Transportation Research Record: Journal of the Transportation Research
Board, 2116, 85-95.
17. Xiao, Y., Tutumluer, E., Qian, Y., and Siekmeier, J. A. (2012). “Gradation effects
influencing mechanical properties of aggregate base-granular subbase materials in
Minnesota.” Transportation Research Record: Journal of the Transportation Research
Board, 2267, 14-26.
45
18. Wayne, M., Boudreau R. L., and Kwon, J. (2011a). “Characterization of mechanically
stabilized layer by resilient modulus and permanent deformation testing. Transportation
Research Record: Journal of the Transportation Research Board, 2204, 76-82.
19. Tutumluer, E., Huang, H., and Bian, X. (2009). “Research on the behaviour of geogrids
in stabilisation applications.” Proceedings of Jubilee Symposium on Polymer Geogrid
Reinforcement, Tensar International Limited, Blackburn, UK.
20. Chen, Q., and Abu-Farsakh, M. (2012). “Structural contribution of geogrid reinforcement
in pavement.” GeoCongress 2012: State of the Art and Practice in Geotechnical
Engineering, ASCE, Reston, VA, 1468-1475.
21. Wayne, M. H., Kwon, J., and Boudreau, R. (2011b). “Resilient modulus, repeated load
permanent deformation and plate load testing of a mechanically stabilized crushed
miscellaneous base material.” Transportation Research Board 90th
Annual Meeting,
Washington, DC.
22. Brown, S. F., Kwan, J., and Thom, N. H. (2007). “Identifying the key parameters that
influence geogrid reinforcement of railway ballast.” Geotextiles and Geomembranes,
25(6), 326-335.
23. Nazzal, M., Abu-Farsakh, M., and Mohammad, L. (2007). “Evaluation of geogrid
benefits using monotonic and repeated load triaxial tests.” Analysis of Asphalt Pavement
Materials and Systems, 145-155.
24. Abu-Farsakh, M., Souci, G., Voyiadjis, G. Z., and Chen, Q. (2012). “Evaluation of
factors affecting the performance of geogrid-reinforced granular base material using
repeated load triaxial tests.” Journal of Materials in Civil Engineering, 24(1), 72-83.
25. Moghaddas-Nejad, F., and Small, J. C. (2003). “Resilient and permanent characteristics
of reinforced granular materials by repeated load triaxial tests.” Geotechnical Testing
Journal, 26(2), 152-166.

46
26. Perkins, S. W., Christopher, B. R., Cuelho, E. L., Eiksund, G. R., Hoff, I., Schwartz, C.
W., Svanø, G., and Watn, A. (2004). “Development of design methods for geosynthetic-
reinforced flexible pavements.” Report No. DTFH61-01-X-00068, U.S. Dept. of
Transportation, Federal Highway Administration, Washington, DC.
27. Rahman, M., Arulrajah, A., Piratheepan, J., Bo, M., and Imteaz, M. (2014). “Resilient
modulus and permanent deformation responses of geogrid-reinforced construction and
demolition materials.” Journal of Materials in Civil Engineering, 26(3), 512-519.
28. Tang, X., Stoffels, S. M., and Palomino, A. M. (2013). “Resilient and permanent
deformation characteristics of unbound pavement layers modified by geogrids.”
Transportation Research Record: Journal of the Transportation Research Board, 2369,
3-10.
29. Jackson, K. (2015). “Laboratory resilient modulus measurements of aggregate base
materials in Utah.” M.S. thesis, Department of Civil and Environmental Engineering,
Brigham Young University, Provo, UT.
30. SAS. (2010). Version 9.3, SAS Institute, Inc., Cary, NC.
31. Sebesta, S., Guthrie, W. S., and Harris, J. P. (2004). “Gyratory compaction of soils for
laboratory swell tests.” Transportation Research Board 83rd
Annual Meeting,
Washington, DC.
32. Hossain, M. S. (2008). “Characterization of subgrade resilient modulus for Virginia soils
and its correlation with the results of other soil tests.” Report No. VTRC 09-R4, Virginia
Transportation Research Council, Charlottesville, VA.

47
APPENDIX A MOISTURE-DENSITY RELATIONSHIPS
Figure A-1: Moisture-density curve for Point of the Mountain material.
133
134
134
135
135
136
136
137
137
138
138
139
5.0 5.5 6.0 6.5 7.0 7.5
Dry
Den
sity
(p
cf)
Moisture Content (%)

48
Figure A-2: Moisture-density curve for Trenton material.
138
139
139
140
140
141
141
142
142
143
4.0 4.5 5.0 5.5 6.0 6.5 7.0 7.5
Dry
Den
sity
(p
cf)
Moisture Content (%)

49
APPENDIX B MECHANICAL PROPERTY TEST DATA
Tab
le B
-1:
NC
HR
P R
ep
ort
598 R
LT
Tes
t D
ata

50
Tab
le B
-2:
AA
SH
TO
T 3
07
Qu
ick
Sh
ear
Tes
t D
ata

51
Table B-3: CBR Test Data

52
APPENDIX C ANALYSIS OF COVARIANCE RESULTS
The full and reduced models resulting from the analyses of covariance (ANOCOVAs)
performed in this research are presented in Tables C-1 and C-2. The full models include the
independent variable of treatment and both potential covariates of moisture content and dry
density. The reduced models include the independent variable of treatment and only the
covariates having a p-value greater than 0.15. In these analyses, the null hypothesis was that the
means of the levels of each independent variable or covariate were equal, and the alternative
hypothesis was that at least one mean was different from another. When the p-values computed
in the analysis are less than or equal to 0.05, the null hypothesis can be rejected, and the
alternative hypothesis can be accepted. However, as the purpose of the ANOCOVA was only to
adjust the test results for statistically significant covariates in preparation for the post-hoc
pairwise comparisons that were performed to assess the difference between the control and each
of the unique combinations of geogrid type and configuration that were evaluated, hypothesis
testing was not performed. Indeed, the p-values shown in these models for treatment are
probably not meaningful in the context of this research, as the comparatively small sample size
used in this experimentation may prevent identification of statistically significant effects of
geogrid reinforcement even when practically important differences are observed. When the
results for all geogrid-reinforced specimens are pooled together for a given test and compared to
the corresponding results for control specimens, more meaningful p-values are obtained as
shown in Appendix D.

53
Table C-1: Full ANOCOVA Models
Table C-2: Reduced ANOCOVA Models
CBR
Resilient
Modulus
Cycles to
Failure
Peak Axial
Stress
Modulus
to Peak
Stress
Modulus
of Elastic
Region
Modulus
at 2%
Strain
CBR
Moisture Content
(% of OMC)0.0190 0.0104 0.4865 0.5113 0.7287 0.4909 0.5416
Dry Density
(% of MDD)0.5501 0.4492 0.1197 0.7460 0.5603 0.5992 0.8237
Treatment 0.0211 0.0107 0.5101 0.6213 0.6787 0.8128 0.5895
Moisture Content
(% of OMC)0.4718 0.2653 0.1824 0.6240 0.7179 0.5893 0.6713
Dry Density
(% of MDD)0.3282 0.5413 0.2408 0.2420 0.1802 0.7201 0.4657
Treatment 0.1247 0.2303 0.0031 0.0168 0.4685 0.6745 0.8912
NCHRP 598 RLT
p -value
Material Effect
AASHTO T 307 Quick Shear
Trenton
Point of the
Mountain
CBR
Resilient
Modulus
Cycles to
Failure
Peak Axial
Stress
Modulus
to Peak
Stress
Modulus
of Elastic
Region
Modulus
at 2%
Strain
CBR
Moisture Content
(% of OMC)0.0076 0.0043 - - - - -
Dry Density
(% of MDD)- - 0.0534 - - - -
Treatment 0.0031 0.0020 0.2670 0.2587 0.1867 0.3005 0.0641
Moisture Content
(% of OMC)- - - - - - -
Dry Density
(% of MDD)- - - - - - -
Treatment 0.0057 0.0230 0.0011 0.0016 0.4137 0.2400 0.3991
NCHRP 598 RLT AASHTO T 307 Quick Shear
Effect
p -value
Point of the
Mountain
Trenton
Material
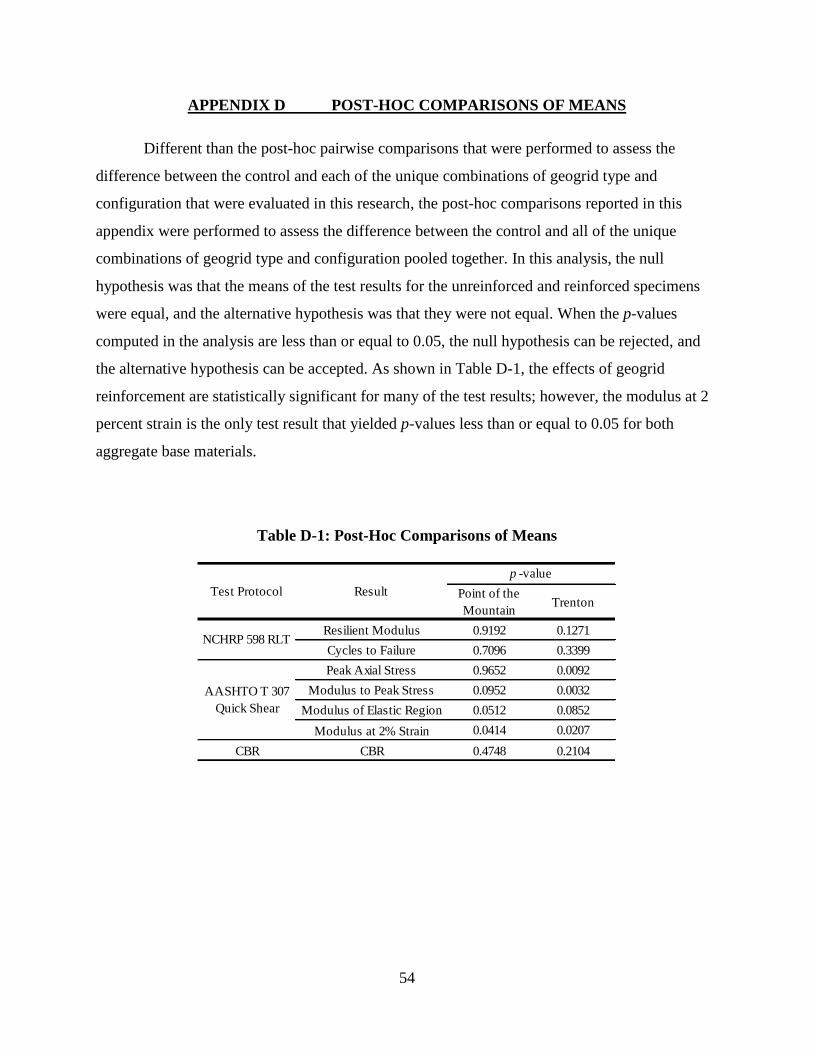
54
APPENDIX D POST-HOC COMPARISONS OF MEANS
Different than the post-hoc pairwise comparisons that were performed to assess the
difference between the control and each of the unique combinations of geogrid type and
configuration that were evaluated in this research, the post-hoc comparisons reported in this
appendix were performed to assess the difference between the control and all of the unique
combinations of geogrid type and configuration pooled together. In this analysis, the null
hypothesis was that the means of the test results for the unreinforced and reinforced specimens
were equal, and the alternative hypothesis was that they were not equal. When the p-values
computed in the analysis are less than or equal to 0.05, the null hypothesis can be rejected, and
the alternative hypothesis can be accepted. As shown in Table D-1, the effects of geogrid
reinforcement are statistically significant for many of the test results; however, the modulus at 2
percent strain is the only test result that yielded p-values less than or equal to 0.05 for both
aggregate base materials.
Table D-1: Post-Hoc Comparisons of Means
Point of the
MountainTrenton
Resilient Modulus 0.9192 0.1271
Cycles to Failure 0.7096 0.3399
Peak Axial Stress 0.9652 0.0092
Modulus to Peak Stress 0.0952 0.0032
Modulus of Elastic Region 0.0512 0.0852
Modulus at 2% Strain 0.0414 0.0207
CBR CBR 0.4748 0.2104
Test Protocol
p -value
Result
NCHRP 598 RLT
AASHTO T 307
Quick Shear