Investigation of Geometrical Effects on Microneedle ...
103
University of South Florida Scholar Commons Graduate eses and Dissertations Graduate School 7-19-2005 Investigation of Geometrical Effects on Microneedle Geometry for Transdermal Applications Smitha Shey University of South Florida Follow this and additional works at: hps://scholarcommons.usf.edu/etd Part of the American Studies Commons is esis is brought to you for free and open access by the Graduate School at Scholar Commons. It has been accepted for inclusion in Graduate eses and Dissertations by an authorized administrator of Scholar Commons. For more information, please contact [email protected]. Scholar Commons Citation Shey, Smitha, "Investigation of Geometrical Effects on Microneedle Geometry for Transdermal Applications" (2005). Graduate eses and Dissertations. hps://scholarcommons.usf.edu/etd/860
Transcript of Investigation of Geometrical Effects on Microneedle ...
University of South FloridaScholar Commons
Graduate Theses and Dissertations Graduate School
7-19-2005
Investigation of Geometrical Effects onMicroneedle Geometry for TransdermalApplicationsSmitha ShettyUniversity of South Florida
Follow this and additional works at: https://scholarcommons.usf.edu/etd
Part of the American Studies Commons
This Thesis is brought to you for free and open access by the Graduate School at Scholar Commons. It has been accepted for inclusion in GraduateTheses and Dissertations by an authorized administrator of Scholar Commons. For more information, please contact [email protected].
Scholar Commons CitationShetty, Smitha, "Investigation of Geometrical Effects on Microneedle Geometry for Transdermal Applications" (2005). GraduateTheses and Dissertations.https://scholarcommons.usf.edu/etd/860
Investigation of Geometrical Effects on Microneedle Geometry for Transdermal Applications
by
Smitha Shetty
A thesis submitted in partial fulfillment
of the requirements for the degree of
Master of Science in Electrical Engineering
Department of Electrical Engineering
College of Engineering
University of South Florida
Major Professor: Shekhar Bhansali, Ph.D.
Sangchae Kim, Ph.D.
William Lee, Ph.D.
Thomas Koob, Ph.D.
Date of Approval:
July 19, 2005
Keywords: Skin, Drie, Porous Silicon, Penetration Force, Fracture Force
© Copyright 2005 , Smitha Shetty

DEDICATION
To My Parents
ACKNOWLEDGEMENTS
This project is supported by the National Science Foundation (NSF) Career Award 0239262. I
would like to thank my major advisor, Dr. Shekhar Bhansali for providing me an opportunity to
pursue active research in MEMS. I am indebted to Dr Sangchae Kim for his guidance, technical
expertise and insights on the research which enabled me to hold a firm grasp on mechanical
aspect of this project. Special thanks to Dr Tom Koop for his invaluable suggestions and guidance
especially during the microneedle testing and data analysis phase. I would also like to thank
Douglas Pringle at Shriners hospital for his help with skin and polymer compressive and
indentation tests. I would like to acknowledge Dan Hernandez form Shriners hospital for his help
on frozen section on cryotome for skin imaging. I would like to acknowledge Star Center, Largo
for DRIE processing and provision of motorized micrometer. Thanks to Bill Pickens at the Skin
Science Institute (Cincinnati, Ohio, USA) for help in obtaining the skin specimens and
information on skin. Jay Beiber, Robert Tufts and Richard Everly from NNRC need to be
acknowledged for their help while operating cleanroom and metrology tools during fabrication.
Finally, my thanks to Helen for her help with the skin testing and my fellow MEMS teammates
for their help in the fabrication process. Last but not the least I am appreciative to Sunny for his
motivation, support and guidance all throughout my stay at USF.

i
TABLE OF CONTENT
LIST OF TABLES.......................................................................................................................... iv
LIST OF FIGURES ........................................................................................................................ vi
ABSTRACT ............................................................................................................................... x
CHAPTER 1 INTRODUCTION ................................................................................................. 1
1.1 Motivation ............................................................................................................................. 1
1.2 Thesis Overview.................................................................................................................... 3
1.3 Applications for Microneedle................................................................................................ 4
1.4 State -of-Art Microneedle Research ...................................................................................... 5
1.4.1 Solid Silicon Microneedle Array by Black Silicon Method........................................... 5
1.4.2 Bulk Micromachined Multichannel Silicon Neural Probes............................................ 5
1.4.3 Surface Micromachined Hollow Metallic Microneedles ............................................... 6
1.4.4 Hollow Deep Reactive Ion Etching (DRIE) Based Etching Needle Arrays .................. 7
1.4.5 Polysilicon Molded Microneedle Array......................................................................... 8
1.4.6 Silicon Microneedles...................................................................................................... 9
1.5 Significance of Current Work................................................................................................ 9
CHAPTER 2 SKIN AND MICRONEEDLE DESIGN ............................................................. 11
2.1 Understanding Skin Barrier ................................................................................................. 11
2.1.1 Structure and Significance of Skin Barrier................................................................... 13
2.1.2 Biomechanical Properties of Skin ................................................................................ 14

ii
2.2 Design Consideration for Microneedle Strength ................................................................. 15
2.2.1 Buckling Analysis ........................................................................................................ 16
2.2.2 Parametric Study for Buckling Analysis ...................................................................... 17
2.2.3 Shear and Bending Failure Analysis ............................................................................ 19
2.2.4 Shear Stress Analysis using ANSYS ........................................................................... 21
CHAPTER 3 MICRONEEDLE FABRICATION..................................................................... 23
3.1 DRIE Based Microneedles .................................................................................................. 23
3.1.1 Introduction: DRIE....................................................................................................... 23
3.1.2 Detailed Process Flow and Results .............................................................................. 24
3.2 Porous Silicon Based Microneedles .................................................................................... 34
3.2.1 Introduction to Macroporous Silicon ........................................................................... 34
3.2.2 Fabrication of Porous Silicon based Microneedles ...................................................... 37
3.3 DRIE Vs. Porous Silicon Based Microneedle Fabrication Process..................................... 43
CHAPTER 4 BIO-MECHANICAL CHARACTERISATION ................................................. 44
4.1 Introduction ......................................................................................................................... 44
4.2 Experimental Setup.............................................................................................................. 44
4.3 Calibration of Load Cell ...................................................................................................... 47
4.4 Calibration of Motorized Micrometer ................................................................................. 50
4.5 Mechanical Tests on Skin like Polymer and Split Skin....................................................... 51
4.5.1 Compressive Tests on Polymer and Skin ..................................................................... 52
4.5.2 Indentation Test on Polymer and Split Thickness Skin ............................................... 56
CHAPTER 5 FRACTURE AND PENETRATION TESTING................................................. 61
5.1 Measurement of Fracture Force........................................................................................... 61
5.1.1 Experimental Plan ........................................................................................................ 61
5.1.2 Fracture Results Analysis............................................................................................. 62
iii
5.2 Insertion Testing on Skin like Polymer ............................................................................... 68
5.3 Penetration Testing on Split Thickness Skin ....................................................................... 71
5.3.1 Skin Tests Using Manual Translation .......................................................................... 71
5.3.2 Skin Test Using Motorized Micrometer....................................................................... 75
5.4 Confirmation of microneedle penetration as against indentation on split thickness skin.... 79
5.5 Penetration Tests on Isolated Stratum Corneum ................................................................. 81
CHAPTER 6 CONCLUSIONS AND RECOMMENDATIONS FOR FUTURE WORK........ 84
6.1 Conclusions ......................................................................................................................... 84
6.2 Recommendations for Future Work .................................................................................... 86
REFERENCES ............................................................................................................................ 87
iv
LIST OF TABLES
Table 2.1 Microneedle Design Constraints.................................................................................... 17
Table 2.2 Analytical Buckling Results .......................................................................................... 18
Table 2.3 Mathematical Analyses for Shear Force ........................................................................ 20
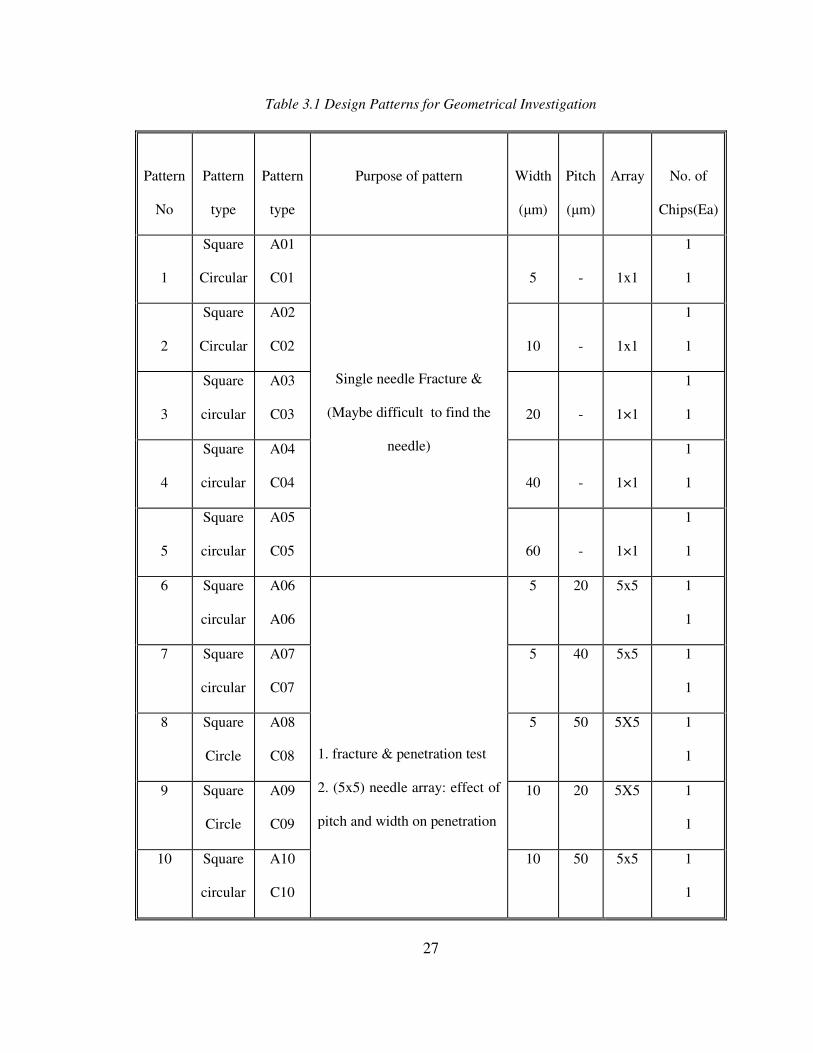
Table 3.1 Design Patterns for Geometrical Investigation .............................................................. 27
Table 3.2 RIE Process Parameters ................................................................................................. 31
Table 3.3 Bosch Cycle in DRIE..................................................................................................... 32
Table 3.4 Comparison of Porous Silicon and DRIE Processes..................................................... 43
Table 4.1 Comparison Between Experimental and Data Sheet Readings...................................... 47
Table 4.2 Calibration Table for Motorized Micrometer ................................................................ 51
Table 4.3 Polymer Plug Specimen Dimension Chart .................................................................... 53
Table 4.4 Elastic Modulus of Polymer Plugs at Different Strain Levels ....................................... 53
Table 4.5 Skin Plugs Dimension Chart.......................................................................................... 53
Table 4.6 Elastic Modulus of Skin Plugs at Different Strain Levels ............................................. 55
Table 4.7 Indentation Stiffness at 1mm/sec and 5mm/sec Indentation Rates................................ 58
Table 4.8 Indentation Stiffness for Cadaver Skin .......................................................................... 60
Table 5.1 Microneedle Dimensional Variation for Fracture Failure Tests .................................... 62
Table 5.2 Fracture Failure Test Results ......................................................................................... 64
Table 5.3 Theoretical Fracture Force Values for Short Beam Structures Derived from Material
Strength (Compressive Strength of Thermal SiO2=690-1380 MPa).............................................. 65
Table 5.4 Penetration Force Summary with Needle Specifications............................................... 75

v
Table 5.5 Split Thickness Penetration Results Using Motorized Meter ........................................ 78
Table 5.6 Stratum Corneum Penetration Results ........................................................................... 82

vi
LIST OF FIGURES
Figure 1.1 Solid Silicon Microneedle Array Fabricated by Black Silicon Method [6] ................... 5
Figure 1.2 Bulk Micromachined Multichannel Silicon Neural Probes [5] ...................................... 6
Figure 1.3 Surface Micromachined Metallic Array ........................................................................ 7
Figure 1.4 DRIE Based Needles by Gardeneir et. al....................................................................... 7
Figure 1.5 Sharp Needle Array by Stoeber et al ............................................................................ 8
Figure 1.6 Pointed, Side Opened Out of Plane DRIE Needles by Griss et. al ................................ 8
Figure 1.7 Microneedles by Two Wafer Micromolding Process..................................................... 9
Figure 1.8 Silicon needles by Lin and Pisano.................................................................................. 9
Figure 2.1 Schematic Illustrating the Layers of Human Skin [14] ................................................ 12
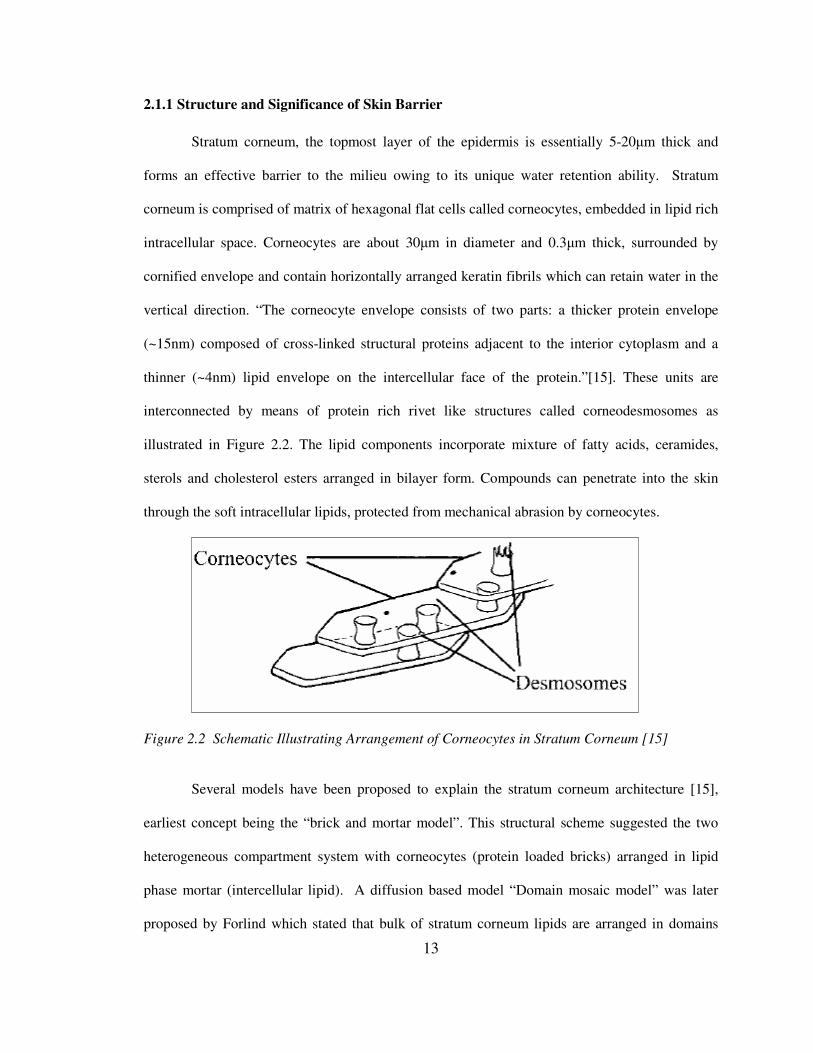
Figure 2.2 Schematic Illustrating Arrangement of Corneocytes in Stratum Corneum [15] ......... 13
Figure 2.3 Elastic Behaviour of Ligament[17] ............................................................................. 14
Figure 2.4 Compressive Behaviour as a Function of Length......................................................... 15
Figure 2.5 Buckling Failure Mode................................................................................................. 16
Figure 2.6 Cross-sectional Dimensions for Buckling Calculations ............................................... 16
Figure 2.7 ANSYS Modeling for Microneedle Column............................................................... 21
Figure 2.8 Von Mises Simulation Results Using Finite Element Analysis ................................... 21
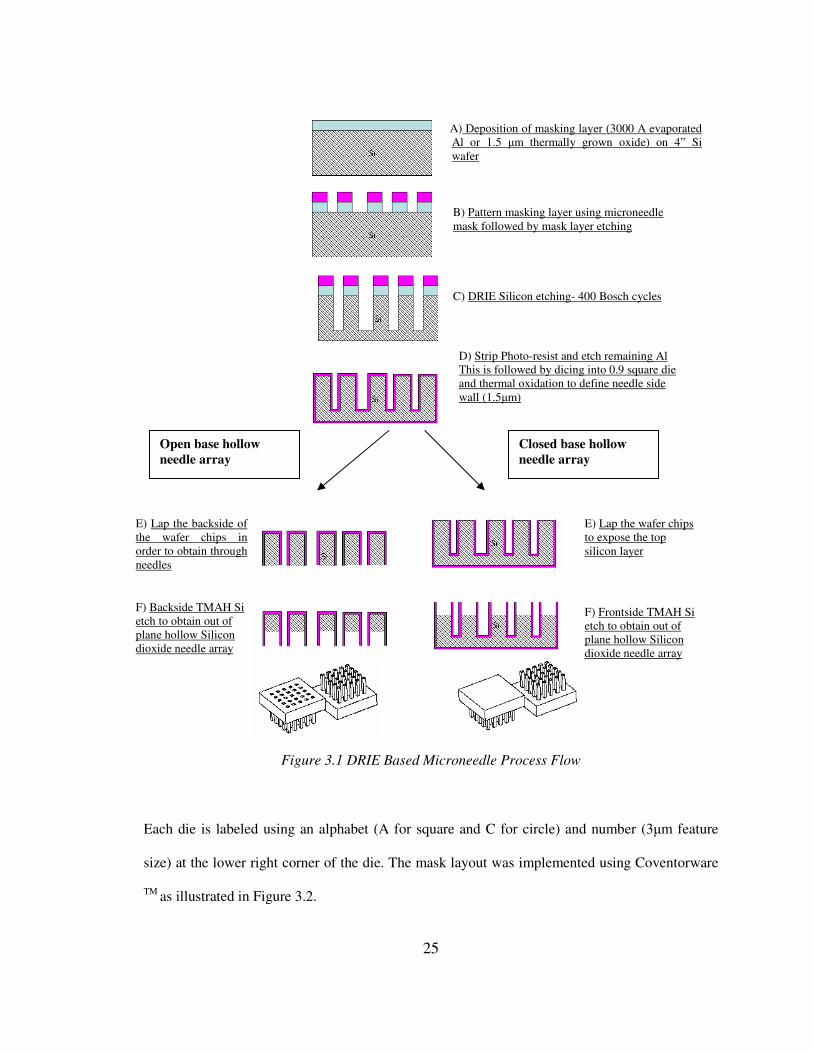
Figure 3.1 DRIE Based Microneedle Process Flow ...................................................................... 25
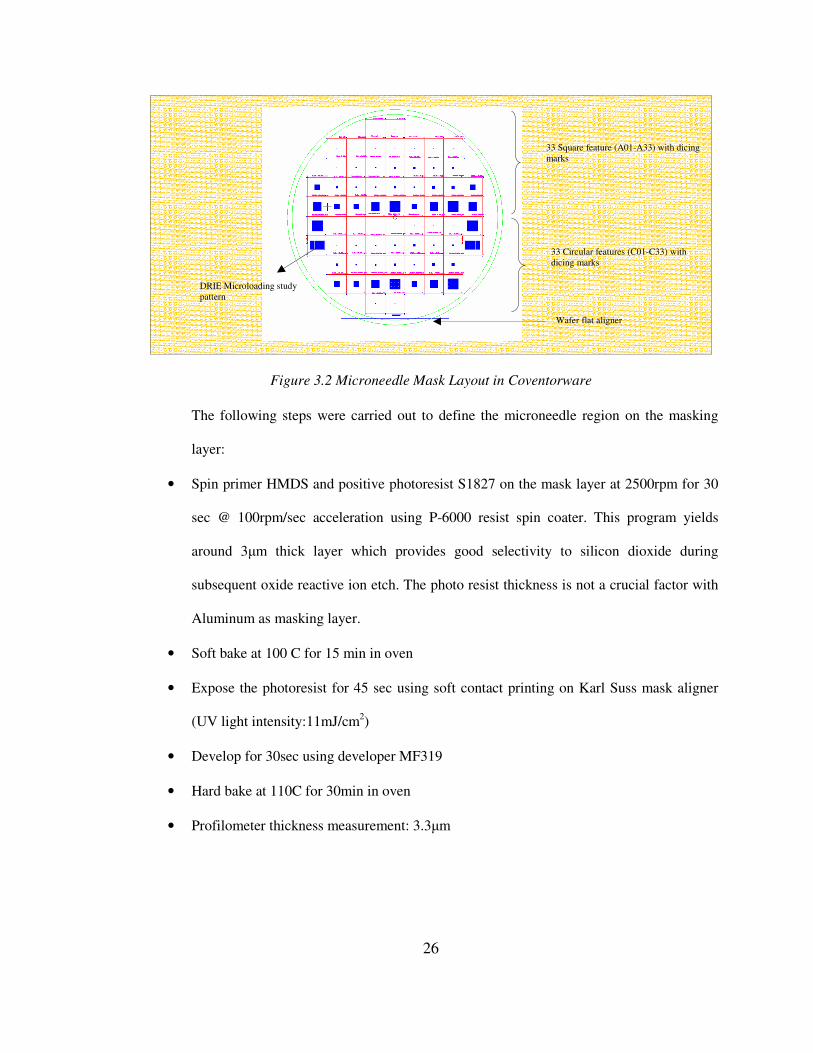
Figure 3.2 Microneedle Mask Layout in Coventorware ................................................................ 26
Figure 3.3 1x1 Array of Width 40µm and 5x5 Array of Width 60µm........................................... 30
Figure 3.4 25x25 Array after Al Etching ....................................................................................... 31

vii
Figure 3.5 Microloading Effect in Die 34 Illustrating Etch Depth Variation with Increasing
Window Size on Masking Layer in DRIE ..................................................................................... 33
Figure 3.6 Scalloping Effect in DRIE Illustrating Surface Roughness......................................... 33
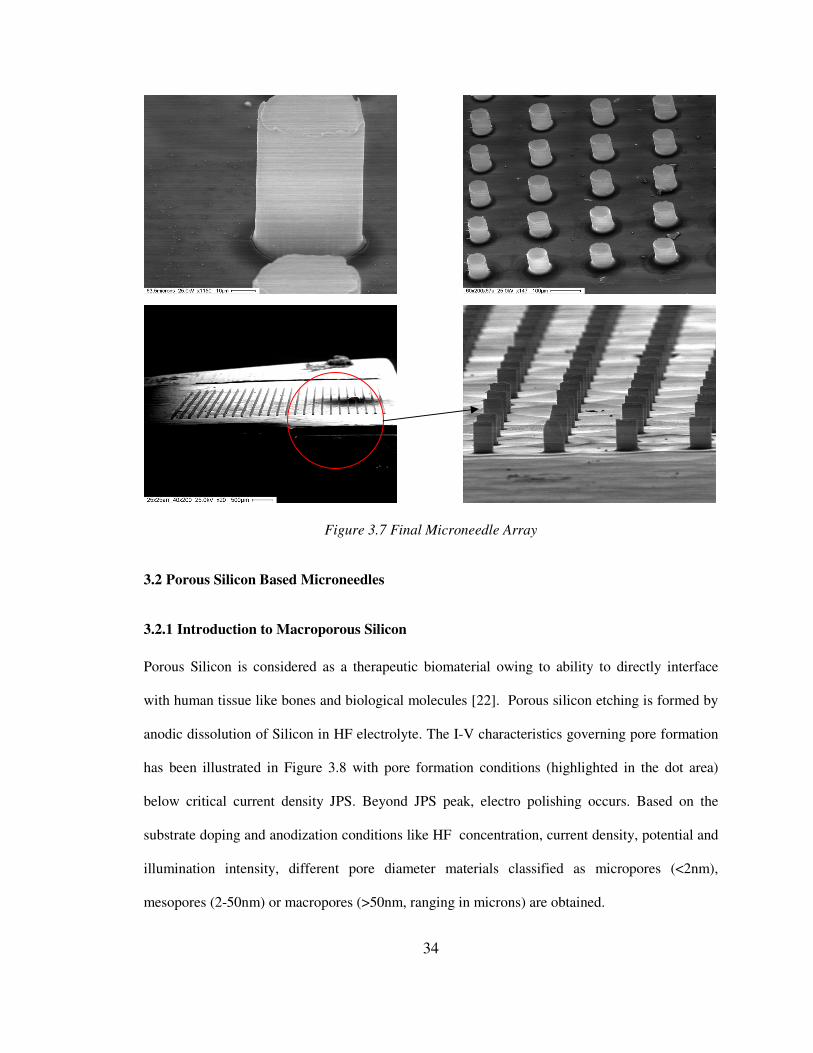
Figure 3.7 Final Microneedle Array .............................................................................................. 34
Figure 3.8 I-V Characteristics Governing Electrochemical Dissolution of Silicon [23] ............... 35
Figure 3.9 Variation in Pore Cross-section if Doping Density or Bias is Increased [25] .............. 37
Figure 3.10 Process Flow for Porous Silicon Based Microneedles ............................................... 38
Figure 3.11 Photograph Illustrating the Porous Silicon Etching Setup at USF ............................. 40
Figure 3.12 Experimental Setup for Macroporous Silicon Etching Setup at USF......................... 41
Figure 3.13 SEM Image Illustrating 5x20µm Macropore Array, Height=150µm after Etching for
24 hrs.............................................................................................................................................. 41
Figure 3.14 20x100µm Array with Branched Pores (Bias 2.5V)................................................... 42
Figure 3.15 20x100µm Array with Reduced Branching (Bias 2V) ............................................... 42
Figure 3.16 Blocked, Out of Plane Microneedles......................................................................... 42
Figure 4.1 Testing Module............................................................................................................. 45
Figure 4.2(a) Load Cell Block (Top) (b) Microneedle Block ( Bottom) ....................................... 46
Figure 4.3 Calibration Setup .......................................................................................................... 47
Figure 4.4 Best Fit Graph for Experimental Values Compared with Standard Data Values ......... 48
Figure 4.5 Experimental Calibration Readings.............................................................................. 48
Figure 4.6 Illustration of Load Cell Output Variation over Time under (a) Normal Conditions (b)
Partial Shield (c) Complete Shield (d) Variation over 3 hrs Time with Metal Fixture.................. 50
Figure 4.7 Compressive Tests: Stress-Strain Relation for Polymer Plugs.................................... 53
Figure 4.8 Stress-Strain Relation for Skin Plugs on Compressive Loading .................................. 54
Figure 4.9 Comparative Analysis Between Elastic Modulus of Polymer and Split Thickness Skin
....................................................................................................................................................... 55
viii
Figure 4.10 Force-Depth Plots for Indentation Rate of 1mm/sec .................................................. 57
Figure 4.11 Force-Depth Plots for Indentation Rate of 5mm/sec .................................................. 57
Figure 4.12 Force Normalisation for Stiffness Calculation at Position 1-10mm........................... 58
Figure 4.13 Relaxation Test Result Illustrating Elastic Behaviour of Polymer with Small Viscous
Element (Straight Step Plot Represents Instantaneous Step Strain while Wavy Curve Indicates
Force Values)................................................................................................................................. 59
Figure 4.14 Indentation Plot for Split Thickness Skin at 1mm/sec................................................ 59
Figure 5.1 Typical Plot Displaying Fracture Peak for 40µm wide square microneedle of length
125µm ............................................................................................................................................ 63
Figure 5.2 Fracture Test Results as Function of Needle Length and Width .................................. 65
Figure 5.3 Force-Length Relation for 40µm Wide Square Microneedle ....................................... 66
Figure 5.4 Force-Length Relation for 40µm Wide Circular Microneedle ..................................... 66
Figure 5.5 Force-Length Relation for 60µm Wide Square Microneedle ...................................... 67
Figure 5.6 Force-Length Relation for 60µm Wide Circular Microneedle ..................................... 67
Figure 5.7 Fracture Force vs Width (Length=constant) for Circular Geometry ............................ 68
Figure 5.8 Wall Buckling after TMAH Etch (10x-Optical Microscope)....................................... 68
Figure 5.9 Illustrating the Condition of 5x5 Microneedle Array (Width 40µm, Pitch 150µm and
Length 75µm) Before and After Needle Insertion. Needles show Polymer Trace in the Needle
Lumen after insertion..................................................................................................................... 69
Figure 5.10 Penetration Plot for 5x5 Array with Penetration Discontinuity Observed at 0.2gF ... 70
Figure 5.11 Penetration Plots for 25x25 Array (Width=60µm, Pitch=150µm, Length=75µm) with
First Force Peak at 0.8 gF .............................................................................................................. 70
Figure 5.12 Typical Force-Time Plot for 25x25 Array Marked by a Number of Peaks Due to Non
Uniform Insertion Rate .................................................................................................................. 72
ix
Figure 5.13 Optical Microscope Image Illustrating Black India Ink Stains on Cadaver Skin after
Insertion for (A) 25x25 Array –Circular Needles (Width=20µm, Pitch=100µm, Height=125µm)72
Figure 5.14 Microneedle While Being Removed from the Skin Sample Indicating Penetration ..73
Figure 5.15 SEM Image of 25x25 Array of Circular Needles (Width=20µm, Pitch=100µm,
Height=125µm) after Skin Insertion .............................................................................................. 73
Figure 5.16 SEM Image Illustrating Clogging of Needle with Skin.............................................. 74
Figure 5.17 SEM Image Showing Effective 4.5µm Clogging of Needle Lumen .......................... 74
Figure 5.18 Magnified Peak in Skin Penetration Force-Time Plot for 25X25 Array (Circular
Needle-Width 60µm, Pitch 150µm, Length 105µm) Indicating 4.03gF as Penetration Force....... 76
Figure 5.19 Typical Skin Penetration Force-Time Plot for 25X25 Array (Circular Needle-Width
60µm, Pitch 150µm, Length 105µm) with Motorized Micrometer. .............................................. 77
Figure 5.20 Plot Illustrating Work Done by 25 X 25 Needle Array (Width 60µm, Pitch150µm,
Length 105µm )-Area Between Force Displacement Curves for Chips with and without Needles.
....................................................................................................................................................... 78
Figure 5.21 Optical Microscope Image (4X Magnification) Illustrating Microneedle Penetration
Marks ............................................................................................................................................. 80
Figure 5.22 Optical Microscope Image (20X Magnification) Illusrating (A) Split Thickness Skin
Section Without Penetration (B) Split Thickness Skin Section with 90 µm Deep,20 µm Wide
Needle Marks into Epidermis ........................................................................................................ 80
Figure 5.23 Penetration Marks of 25X25 Microneedle Array (Square Needle-Width 40µm,
Pitch150µm, Length 100µm) on SC after Insertion Test with Magnified Single Needle Mark .... 82
Figure 5.24 SC Penetration Plot for 25X25 Microneedle Array ((Square Needle-Width 40µm,
Pitch150µm, Length 100µm) ......................................................................................................... 82
x
INVESTIGATION OF GEOMETRICAL EFFECTS ON MICRONEEDLE RELIABILITY
FOR TRANSDERMAL APPLICATIONS
Smitha Shetty
ABSTRACT
Hollow biocompatible microneedle arrays were designed and fabricated using two
different bulk micromachining techniques-Deep Reactive Ion Etching and Coherent Porous
Silicon technology to investigate their reliability for transdermal applications. An in-house
experimental setup was developed for microneedle fracture and split thickness penetration force
measurements. Out of plane needle array configurations (100µm needle length) with intra array
geometric variations including needle shape, diameter, intra-array pitch and density (1~625) were
characterized on cadaver skin to predict skin barrier penetration without fracture. Use of
microneedle array as transdermal patch necessitates reliable penetration and not just pushing
against stratum corneum like a “bed of nails”. Critical in plane fracture tests were conducted on
single microneedle columns with different geometry to validate the failure mechanism with force
quantification relations. Preliminary penetration characterization was performed on skin like
polymer followed by direct testing on cryogen preserved cadaver skin. Compressive and
indentation test were performed on both excised skin and polymer to analyze their mechanical
behavior on loading and establish a mechanical correlation. Finite element modeling using
ANSYS was done to examine the effect of shear loading on the needles due to lack of
experimental verification.
1
CHAPTER 1 INTRODUCTION
1.1 Motivation
Rapid advancement in pharmaceutical industry has necessitated development of physical
enhancement techniques for transdermal applications to overcome limitations of oral drug
administration. These include poor absorption in intestine and liver (first pass metabolism effect)
and sensitivity to enzymatic degradation. As compared to oral treatment, topical route provides
large surface absorption area and negligible degradation of drug. For effectual delivery, the drug
has to diffuse through the outermost barrier of the skin, stratum corneum, at therapeutic rate and
reach the blood vessel located in the dermis. Several methodologies [1] are being investigated to
increase the permeability of stratum corneum:
• Electrical based techniques: iontophoresis, electroporation, ultrasound, photomechanical
wave
• Structure based techniques: microneedles
• Velocity based techniques: jet propulsion.
Velocity and electrical based delivery systems tend to be unreliable since they induce skin
irritation, burns and shock the cells. Hence there has been an increased emphasis on development
of structure based techniques.
Microneedles are emerging as critical drug delivery and bio-fluid extraction mechanism
owing to advances in microfabrication technology. As compared to commercially available
hypodermic gauge needles (needle length in mm range and thickness greater than 300µm), they
are much smaller (diameter less than 100µm) and exhibit features like minimal pain and tissue
2
trauma during skin insertion. They also provide increased control over drug dosage, independent
of drug composition and concentration. Due to short lengths, microneedles increase the skin
permeability without stimulating the nerve endings located in the dermis enabling minimally
invasive drug administration. The size and geometry of these microneedles are lithographically
defined so that they can be fabricated in accordance with the application requirement. In addition,
microneedles offer mass production capabilities since fabrication processes are conducive for
batch production making them cost effective. Furthermore, the out-of-plane structure translates to
their scalability into a multi-array configuration.
To accelerate their inclusion into mainstream medicine and to advance their scope of
applicability, microneedles need to conform to requirements of simple design, low price and high
reliability. Design and cost factors have been sufficiently optimized in past research; however,
performance studies specific for biomedical applications have been inadequate. While exploring
the avenue of microneedle array patch for transdermal application, it is critical to ensure that all
needles reliably penetrate through the stratum corneum and not just push against it like a “bed of
nails”. Studies have been conducted to study the mechanics of single needle insertion into skin
[2]; however effect of intra-array geometry on safe dermal insertion is still an unreported research
domain.
Current research focuses on fabrication and bio-mechanical characterization of out of
plane, hollow Silicon dioxide microneedle array chips exhibiting intra-array parametric variation :
needle width (5~60µm), cross-section (square and circular), intra-array pitch(20~200µm) and
needle density (1~625). Two different approaches- Deep Reactive Ion Etching (DRIE) and
Coherent Porous Silicon technology (variation in the technique to obtain bulk micromachined
straight wall pores) were implemented to fabricate multi-geometry microneedle arrays. Critical
in-plane buckling and penetration tests were conducted to study needle efficacy. Preliminary
characterization was performed using artificial skin polymer (palpability similar to skin) before
3
direct testing on skin. Polymer Compressive and indentation tests were carried out to correlate its
properties to excised cadaver skin. Finite element modeling using ANSYSTM
was done to
corroborate the experimental results obtained after buckling and insertion tests. This research
would be further extended to develop implantable needle array for continuous body monitoring
for medical conditions.
1.2 Thesis Overview
Chapter one briefly discusses the necessity and current applications of microneedles in
biomedicine. An overview of existing microneedle research is presented with an analysis of the
functionality and limitations of several proposed schemes in the literature. Chapter two elaborates
on heterogeneous skin anatomy discussing the structure and properties of the physical layers. The
design consideration for needle array has also been investigated for reliable penetration
overcoming skin barrier. This chapter presents buckling and shear stress analysis in a column
analogous to the needle structure and analyses results of finite element analysis (ANSYS) used to
model the effect of varying needle dimension and shape on buckling. Chapter three discusses the
two fabrication methodologies employed to realize hollow needles, highlighting the rationale
behind adoption of the processes for current study. Chapter four presents the mechanical
characterization of successfully fabricated microneedles, describing the experimental setup in
detail. Stress- strain results obtained from compressive tests and indentation tests on
commercially available polymer employed as skin substitute has been included for correlation
studies. This is followed by buckling and real skin testing and discussion. Chapter Five
summarizes the work and provide recommendations towards incorporation of fabricated needles
for realization of implantable sensors for body monitoring.
4
1.3 Applications for Microneedle
Recently, bioinstrumentation research has exhibited a growing interest in micro system
technologies for development of biodevices owing to miniaturization, increased functionality,
bulk fabrication capabilities and reliability. Microneedles are finding increasing application in all
areas of biomedical instrumentation including drug delivery, diagnostics, neural and minimally
invasive surgery.
• Continuous body fluid monitoring for diseased conditions like diabetes: Microneedles
could be used in a feedback mechanism to monitor the blood sugar level and administer
therapeutics like insulin in precisely controlled amounts [3].
• Cellular delivery: Cellular and molecular biology generally requires injection of
membrane impermeable molecules like DNA, proteins and other genetic entities into
cells. Arrays of solid silicon microprobes and hollow glass capillaries have been
successfully utilized for injecting DNA into tobacco cell conglomerates [4]. Further
sharpening of these microcapillaries would enable their application for bacteria transfer.
• Neural stimuli to cortical membrane and electrical signal recording: Micromachined
silicon neural probes with microchannels developed at University of Michigan [5] have
been interfaced to the neurons with minimal tissue disruption for delivery of neuro-
simulating drugs while simultaneously recording electrical signals. These probes
significantly indicate contribution of MEMS towards neuroscience instrumentation.
• Antibiotic administration in controlled quantity
• Intravascular drug delivery for stenotic arteriosclerosis treatment: The efficacy of
antirestenotic drugs prescribed to prevent reblockage of arteries is hindered due to
difficulty in local delivery to the clogged arteries. Coronary stents could be developed
with microprobes on the periphery for delivering anti-clogging agents [4]. Silicon
5
microprobes of 140µm length have been successfully pierced into plaqued rabbit iliac
arteries in vitro at 500 mm Hg pressure.
1.4 State -of-Art Microneedle Research
Many fabrication approaches utilizing different design schemes and materials have been
employed for microneedle development. These processes are aimed towards optimization of
geometry and process cost targeting various applications.
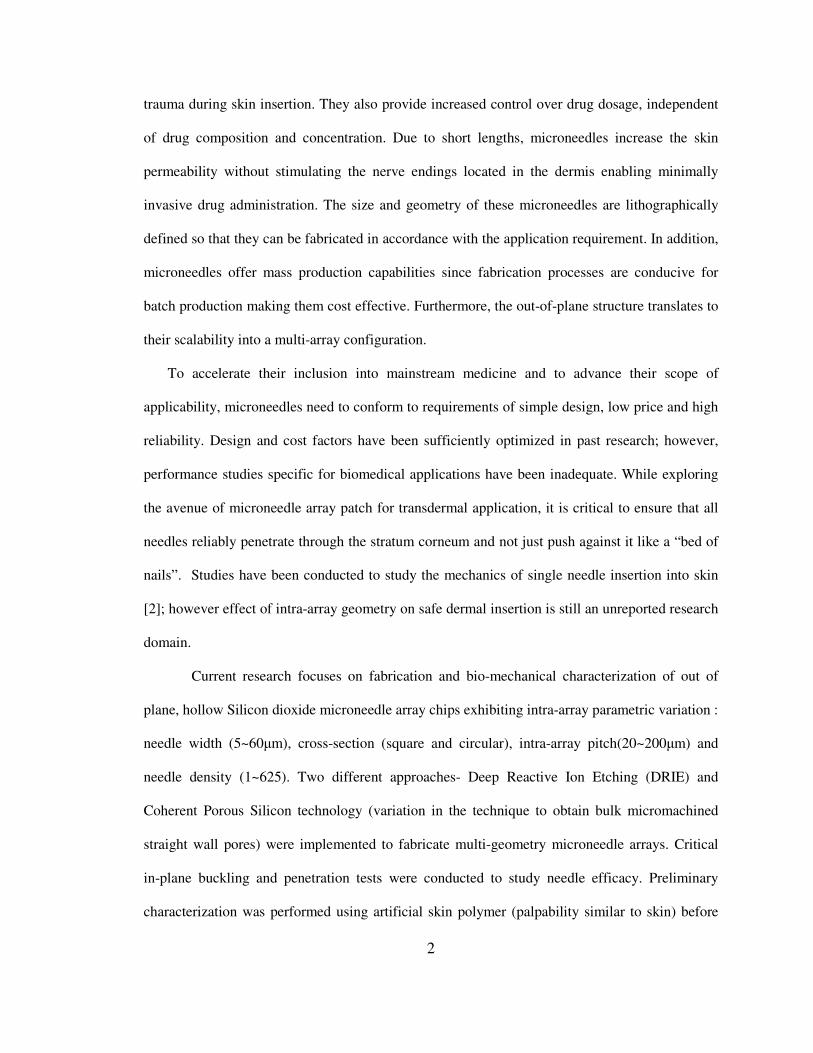
1.4.1 Solid Silicon Microneedle Array by Black Silicon Method
Early work in the area of transdermal microneedle arrays was reported by Henry et. al [6],
testing solid needles to ensure if micro-holes created after insertion increase the skin permeability.
20x20 needle arrays (dimension: length 180µm, diameter 50-80µm and tip radius close to 1µm)
were fabricated by Black Silicon process (Silicon reactive ion etching using SF6/O2) followed by
lateral under etching needles as shown in Figure 1.1. Authors confirmed the microneedle strength
to pierce skin without fracture to enable therapeutic diffusion of calcein in skin by three orders of
magnitude. However this solid model design was inefficient for large volume drug delivery and
fluid extraction.
Figure 1.1 Solid Silicon Microneedle Array Fabricated by Black Silicon Method [6]
1.4.2 Bulk Micromachined Multichannel Silicon Neural Probes
Biocompatible Neural probes with hollow buried channels developed by Chen, Wise et al
[5] contributed significantly to needle research owing to highly localized drug delivery and in situ
6
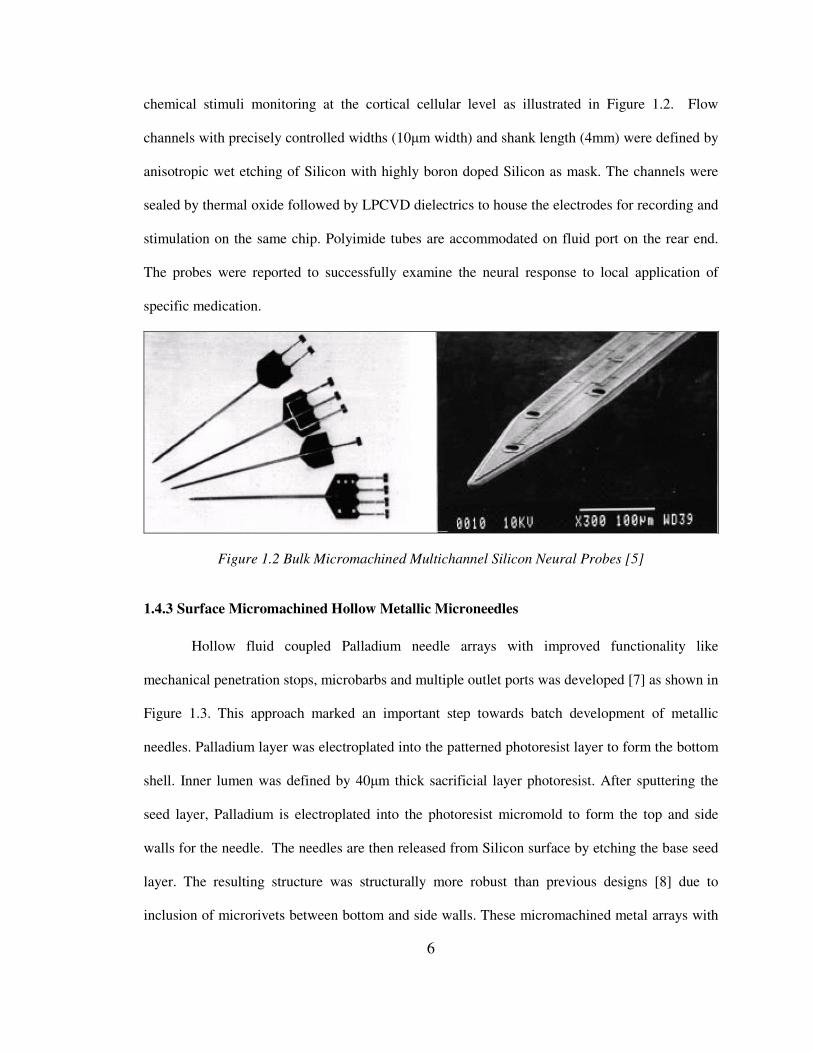
chemical stimuli monitoring at the cortical cellular level as illustrated in Figure 1.2. Flow
channels with precisely controlled widths (10µm width) and shank length (4mm) were defined by
anisotropic wet etching of Silicon with highly boron doped Silicon as mask. The channels were
sealed by thermal oxide followed by LPCVD dielectrics to house the electrodes for recording and
stimulation on the same chip. Polyimide tubes are accommodated on fluid port on the rear end.
The probes were reported to successfully examine the neural response to local application of
specific medication.
Figure 1.2 Bulk Micromachined Multichannel Silicon Neural Probes [5]
1.4.3 Surface Micromachined Hollow Metallic Microneedles
Hollow fluid coupled Palladium needle arrays with improved functionality like
mechanical penetration stops, microbarbs and multiple outlet ports was developed [7] as shown in
Figure 1.3. This approach marked an important step towards batch development of metallic
needles. Palladium layer was electroplated into the patterned photoresist layer to form the bottom
shell. Inner lumen was defined by 40µm thick sacrificial layer photoresist. After sputtering the
seed layer, Palladium is electroplated into the photoresist micromold to form the top and side
walls for the needle. The needles are then released from Silicon surface by etching the base seed
layer. The resulting structure was structurally more robust than previous designs [8] due to
inclusion of microrivets between bottom and side walls. These micromachined metal arrays with
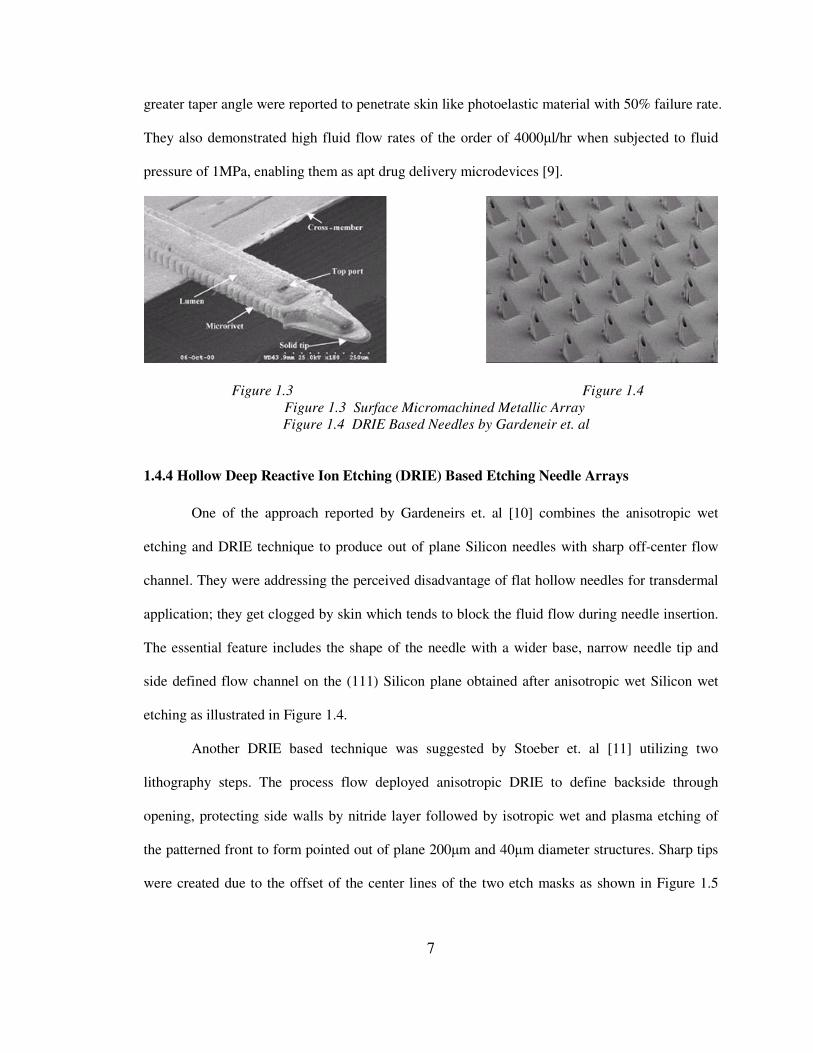
7
greater taper angle were reported to penetrate skin like photoelastic material with 50% failure rate.
They also demonstrated high fluid flow rates of the order of 4000µl/hr when subjected to fluid
pressure of 1MPa, enabling them as apt drug delivery microdevices [9].
Figure 1.3 Figure 1.4
Figure 1.3 Surface Micromachined Metallic Array
Figure 1.4 DRIE Based Needles by Gardeneir et. al
1.4.4 Hollow Deep Reactive Ion Etching (DRIE) Based Etching Needle Arrays
One of the approach reported by Gardeneirs et. al [10] combines the anisotropic wet
etching and DRIE technique to produce out of plane Silicon needles with sharp off-center flow
channel. They were addressing the perceived disadvantage of flat hollow needles for transdermal
application; they get clogged by skin which tends to block the fluid flow during needle insertion.
The essential feature includes the shape of the needle with a wider base, narrow needle tip and
side defined flow channel on the (111) Silicon plane obtained after anisotropic wet Silicon wet
etching as illustrated in Figure 1.4.
Another DRIE based technique was suggested by Stoeber et. al [11] utilizing two
lithography steps. The process flow deployed anisotropic DRIE to define backside through
opening, protecting side walls by nitride layer followed by isotropic wet and plasma etching of
the patterned front to form pointed out of plane 200µm and 40µm diameter structures. Sharp tips
were created due to the offset of the center lines of the two etch masks as shown in Figure 1.5

8
This structure improves the mechanical stability of the needles with superior penetration abilities.
However the drawback with this design was clogging of the channel.
Griss and Stemme [12] developed a similar procedure to obtain side opened geometry for
Silicon microneedles with high structural stability and minimized blockage. Flow channel was
anisotropically etched in a way similar to the above described process. This is followed by ICP
and anisotropic etching to underetch the oxide front mask and form the cross structures
respectively without the side opening. A subsequent isotropic etch step opens up the side walls.
Figure 1.6 illustrates the resulting needles.
Figure 1.5 Figure 1.6
Figure 1.5 Sharp Needle Array by Stoeber et al
Figure 1.6 Pointed, Side Opened Out of Plane DRIE Needles by Griss et. al
1.4.5 Polysilicon Molded Microneedle Array
Hollow polysilicon hypodermic microneedles were fabricated using two wafer
micromolding process developed by Zahn et al. [13] illustrated in Figure 1.7. The mold wafer is
patterned with the needle shape on the front side which is aligned to a through hole on the
backside (etched using KOH). This needle mold is then etched by DRIE followed by
Phosphosilicate glass (PSG) deposition. This mold is bonded to another PSG coated bare silicon
wafer. Subsequent process includes polysilicon deposition onto the mold, annealing and wafer
release in HF. Since polysilicon is ceramic, cracking is a crucial cause of failure. This was
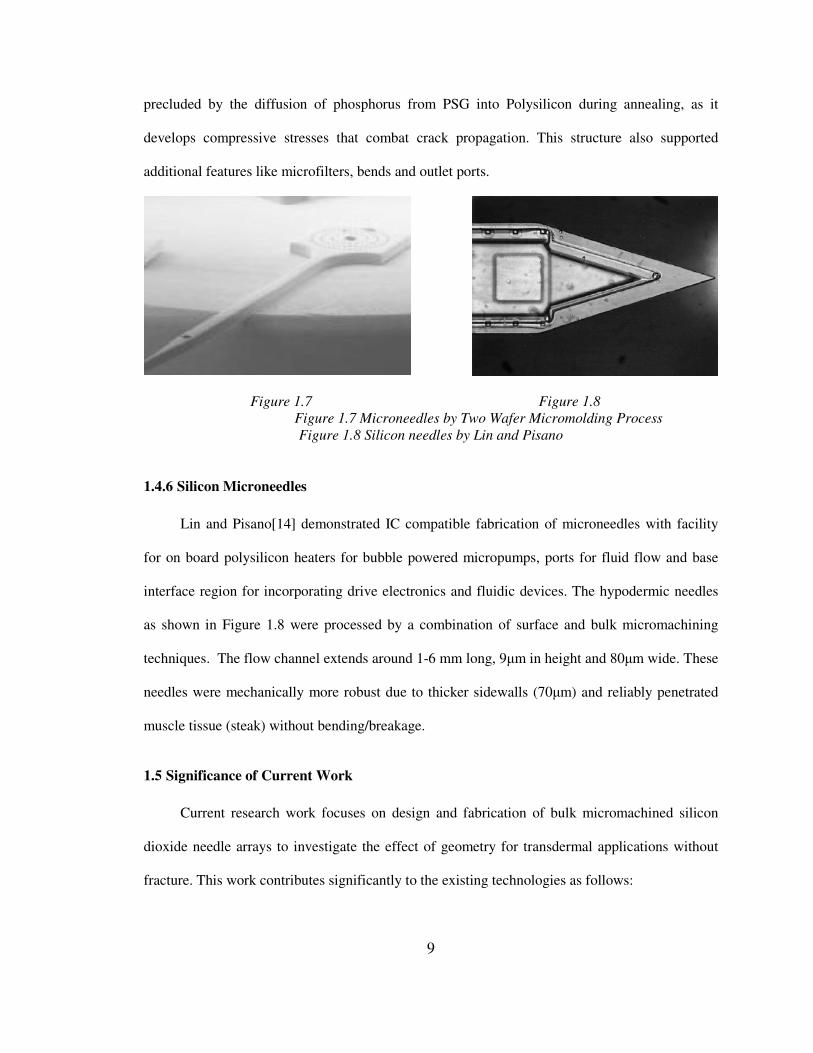
9
precluded by the diffusion of phosphorus from PSG into Polysilicon during annealing, as it
develops compressive stresses that combat crack propagation. This structure also supported
additional features like microfilters, bends and outlet ports.
Figure 1.7 Figure 1.8
Figure 1.7 Microneedles by Two Wafer Micromolding Process
Figure 1.8 Silicon needles by Lin and Pisano
1.4.6 Silicon Microneedles
Lin and Pisano[14] demonstrated IC compatible fabrication of microneedles with facility
for on board polysilicon heaters for bubble powered micropumps, ports for fluid flow and base
interface region for incorporating drive electronics and fluidic devices. The hypodermic needles
as shown in Figure 1.8 were processed by a combination of surface and bulk micromachining
techniques. The flow channel extends around 1-6 mm long, 9µm in height and 80µm wide. These
needles were mechanically more robust due to thicker sidewalls (70µm) and reliably penetrated
muscle tissue (steak) without bending/breakage.
1.5 Significance of Current Work
Current research work focuses on design and fabrication of bulk micromachined silicon
dioxide needle arrays to investigate the effect of geometry for transdermal applications without
fracture. This work contributes significantly to the existing technologies as follows:

10
• Ease in fabrication: In this work, out-of-plan array structures were fabricated using DRIE
and porous silicon etching methods, both enabling mass production capabilities.
• Biocompatibility: Silicon dioxide is known to be biocompatible hence these needles can
form a part of an implantable device without susceptibility to body corrosion.
• Multidimensional chips from one Silicon wafer: Since the needles are lithographically
patterned, it is possible to obtain different geometry chips with the same photo mask to
investigate biomechanical characteristics.
• Length control: The needle length can be precisely controlled by anisotropic wet etching.
Hence one can control the penetration depth into the skin enabling local drug
administration.
• Simulation and validation of models with real skin tissue.
11
CHAPTER 2 SKIN AND MICRONEEDLE DESIGN
2.1 Understanding Skin Barrier
Skin is referred as a prototypical “smart” material providing a dynamic interface between
the environment and the human body. Skin maintains the water homeostasis of the body and
protects the internal organs from damage. This chapter presents an overview of the skin anatomy
followed by detailed discussion on the structure and properties of the skin barrier-stratum
corneum. The equivalent microneedle model and motivation for proposed design parameters for
reliable skin penetration are explained.
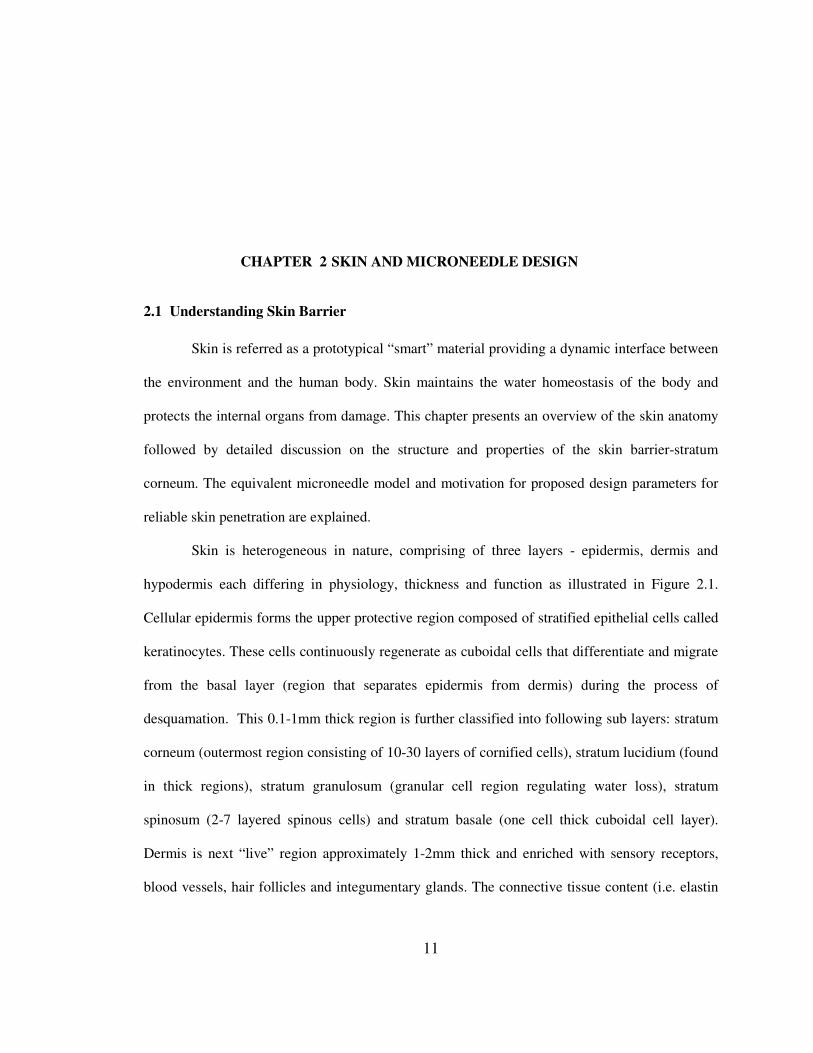
Skin is heterogeneous in nature, comprising of three layers - epidermis, dermis and
hypodermis each differing in physiology, thickness and function as illustrated in Figure 2.1.
Cellular epidermis forms the upper protective region composed of stratified epithelial cells called
keratinocytes. These cells continuously regenerate as cuboidal cells that differentiate and migrate
from the basal layer (region that separates epidermis from dermis) during the process of
desquamation. This 0.1-1mm thick region is further classified into following sub layers: stratum
corneum (outermost region consisting of 10-30 layers of cornified cells), stratum lucidium (found
in thick regions), stratum granulosum (granular cell region regulating water loss), stratum
spinosum (2-7 layered spinous cells) and stratum basale (one cell thick cuboidal cell layer).
Dermis is next “live” region approximately 1-2mm thick and enriched with sensory receptors,
blood vessels, hair follicles and integumentary glands. The connective tissue content (i.e. elastin

12
and collagen fibre) in the dermis is responsible for the tensile strength and elasticity of skin layer.
Hypodermic needles are invasive since they stimulate the nerve endings in the dermis region and
drugs penetrate into the blood vessels. Hypodermis constitutes the basal network of loose
connective and adipose tissue that binds the skin to the underlying organs. This layer plays an
important role in metabolism, serving as insulation padding against injury.
Figure 2.1 Schematic Illustrating the Layers of Human Skin [14]
The stratum corneum forms the primary region of interest for studying the permeability and
transport mechanism through the skin. It is essential to understand the structural and functional
details of this skin barrier.
13
2.1.1 Structure and Significance of Skin Barrier
Stratum corneum, the topmost layer of the epidermis is essentially 5-20µm thick and
forms an effective barrier to the milieu owing to its unique water retention ability. Stratum
corneum is comprised of matrix of hexagonal flat cells called corneocytes, embedded in lipid rich
intracellular space. Corneocytes are about 30µm in diameter and 0.3µm thick, surrounded by
cornified envelope and contain horizontally arranged keratin fibrils which can retain water in the
vertical direction. “The corneocyte envelope consists of two parts: a thicker protein envelope
(~15nm) composed of cross-linked structural proteins adjacent to the interior cytoplasm and a
thinner (~4nm) lipid envelope on the intercellular face of the protein.”[15]. These units are
interconnected by means of protein rich rivet like structures called corneodesmosomes as
illustrated in Figure 2.2. The lipid components incorporate mixture of fatty acids, ceramides,
sterols and cholesterol esters arranged in bilayer form. Compounds can penetrate into the skin
through the soft intracellular lipids, protected from mechanical abrasion by corneocytes.
Figure 2.2 Schematic Illustrating Arrangement of Corneocytes in Stratum Corneum [15]
Several models have been proposed to explain the stratum corneum architecture [15],
earliest concept being the “brick and mortar model”. This structural scheme suggested the two
heterogeneous compartment system with corneocytes (protein loaded bricks) arranged in lipid
phase mortar (intercellular lipid). A diffusion based model “Domain mosaic model” was later
proposed by Forlind which stated that bulk of stratum corneum lipids are arranged in domains
14
with a crystalline packing minimizing penetration of water. “These crystalline domains have
fringes with lipids in a liquid crystalline phase, permitting diffusion of water” [15].
Under normal conditions, there would be no penetration through the corneocytes. The
penetrating substances need to penetrate through the lipids in intercellular space.
2.1.2 Biomechanical Properties of Skin
Skin is a viscoelastic material with its properties varying as function of its heterogeneous
composition, strain rate, hydration content and age. Young’s modulus obtained through stress-
strain characterizes skin elasticity. The elastic modulus of skin varies from 2-12MPa and
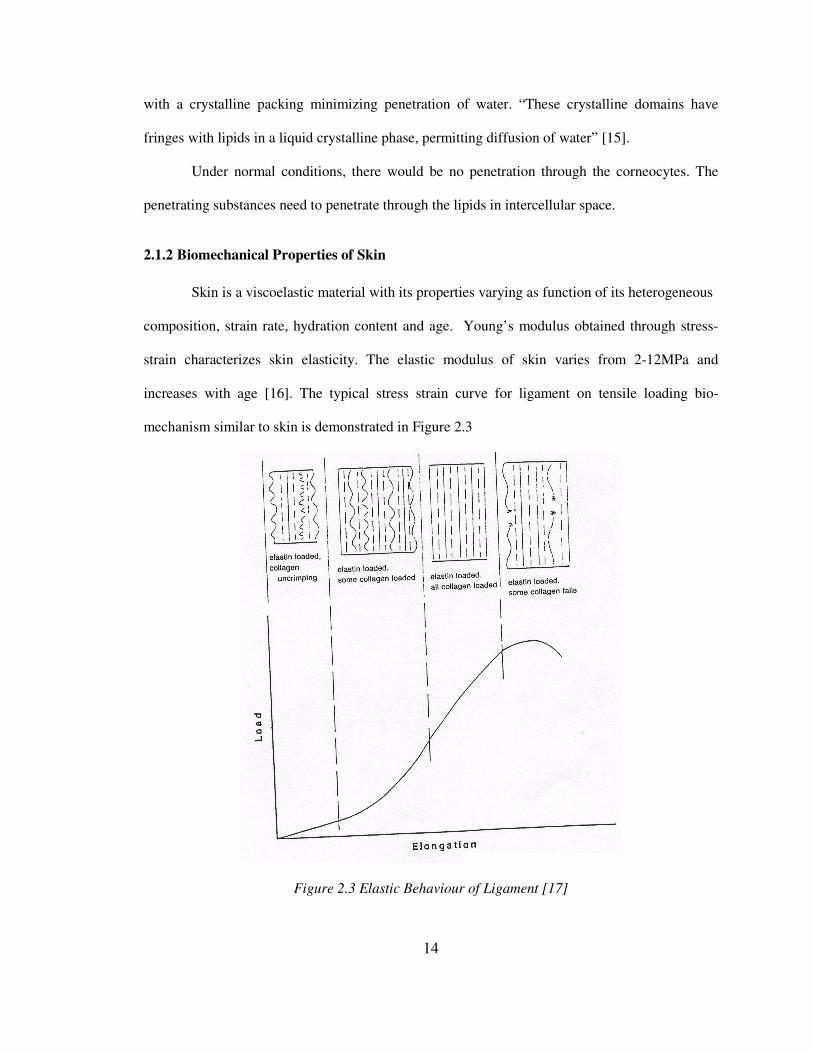
increases with age [16]. The typical stress strain curve for ligament on tensile loading bio-
mechanism similar to skin is demonstrated in Figure 2.3
Figure 2.3 Elastic Behaviour of Ligament [17]
15
On loading the skin tissue, initially the strain increases with small increase in stress. This
is associated to straightening of elastin owing to breaking of cross bond between elastin
molecules in the dermis layer. On further loading, the strain varies linearly with stress indicating
elasticity. Even before the yield stress is reached, some of the collagen fibers begin to develop
micro-fractures. If the loading is further continued, the tissue permanently ruptures.
2.2 Design Consideration for Microneedle Strength
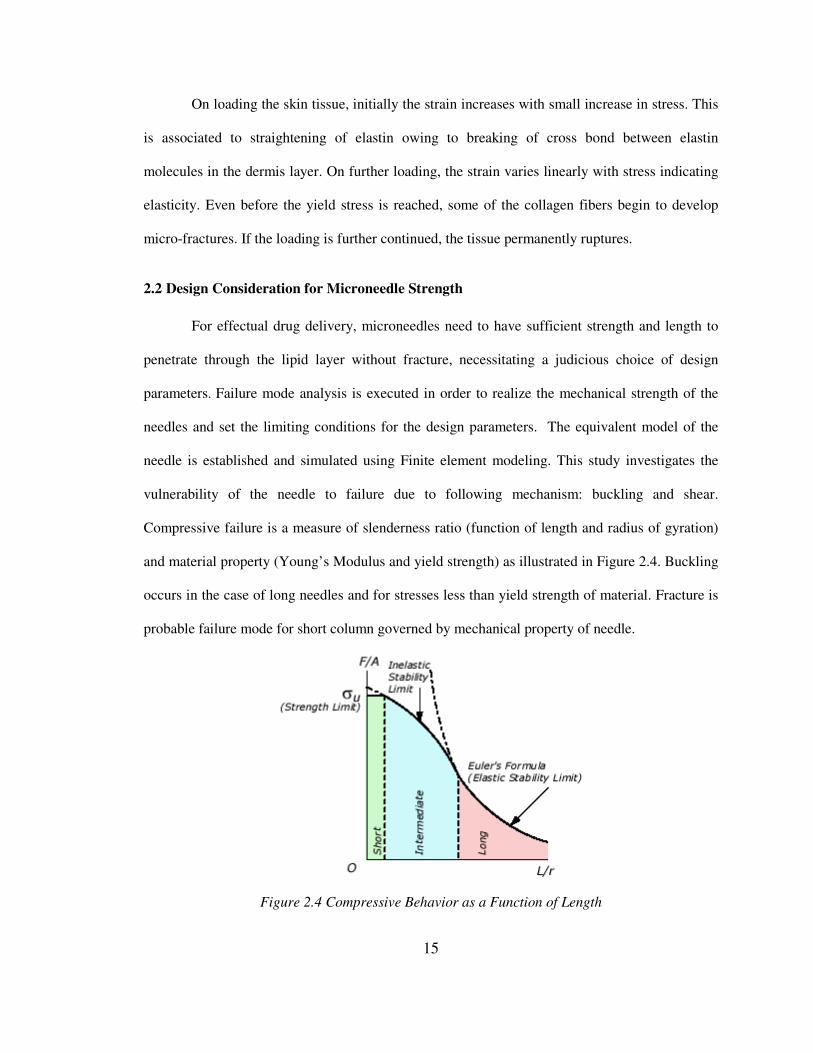
For effectual drug delivery, microneedles need to have sufficient strength and length to
penetrate through the lipid layer without fracture, necessitating a judicious choice of design
parameters. Failure mode analysis is executed in order to realize the mechanical strength of the
needles and set the limiting conditions for the design parameters. The equivalent model of the
needle is established and simulated using Finite element modeling. This study investigates the
vulnerability of the needle to failure due to following mechanism: buckling and shear.
Compressive failure is a measure of slenderness ratio (function of length and radius of gyration)
and material property (Young’s Modulus and yield strength) as illustrated in Figure 2.4. Buckling
occurs in the case of long needles and for stresses less than yield strength of material. Fracture is
probable failure mode for short column governed by mechanical property of needle.
Figure 2.4 Compressive Behavior as a Function of Length

16
2.2.1 Buckling Analysis
Typically microneedles are modeled as long rectangular or cylindrical columns. During
needle penetration into a membrane, if the axial compressive loads exceed the critical load as
defined in Euler’s equation stated below, the needles buckle as shown in Figure 2.5. This loading
setup for the microneedle array can be considered similar to loading of array of hollow beam
fixed at base. Euler’s equation gives a mathematical expression of the buckling force for a beam
of as a function of its length L:
22 4LEIFbuckling π= ………………………………………………………………….. (2.1)
Where E=Modulus of Elasticity
I = Area moment of Inertia
= (b1h13-b2h2
3)/12 ……………………………………………………………….. (2.2)
(For rectangular hollow beam as shown in Figure 2.6)
= π (d24-d1
4)/64 ……………………………………………………………….. (2.3)
(For hollow beam with circular cross section as shown in Figure 2.6)
Figure 2.5 Figure 2.6
Figure 2.5 Buckling Failure Mode
Figure 2.6 Cross-sectional Dimensions for Buckling Calculations
h1
b2
h2
b1 d2
d1

17
2.2.2 Parametric Study for Buckling Analysis
Microneedle design was governed by basic assumption of maximum fracture force that a
microneedle can withstand to be 5gF/needle. From Euler’s equation, one can derive an optimized
relation between width of square needles (b) and needle length (L) with fixed needle wall
thickness (∆=1.5µm), restricted by fabrication limitation.
From (2.2), I= (b1h13-b2h2
3)/12= (b+2 ∆) (h+ 2∆)
3- (b) (h)
3/12
Neglecting higher order increments,
I= ∆h2 (3b+h)/12= ∆b
3/3………….. (For square geometry, b= h)
From (2.1), Fbuckling=π2E ∆ b
3/12L
2>50
For ∆=1.5µm, b3/L
2>5
This constraint leads to determination of the design chart as illustrated in Table 2.1.
Table 2.1 Microneedle Design Constraints
DESIGN PARAMETERS TYPE
Geometry Square, Circular
Needle Width 5µm,10 µm,20 µm,40µm,60µm
Needle Length 25~175µm
Wall thickness 1.5µm
Intra array needle pitch 20,50,100,150,200
Needle density 1,5x5,25x25
Typical values for elastic modulus and yield strength of bulk SiO2 is 70GPa and 8.4GPa
respectively [18, 19]. The following parameters are varied to study their effect on buckling force:
• Needle shape: Square and circular cross section
• Needle length: (25µm~175µm)
• Needle width: (5µm ~ 60µm)
The analytical results have been presented in Table 2.2

18
Table 2.2 Analytical Buckling Results
Microneedle Design
Parameter
Square
Geometry
Circular
Geometry
Width
(µm)
Length
(µm)
Thickness
(µm)
Moment of
Inertia (m4)
Buckling
Force (N)
Moment of
Inertia(m4)
Buckling
Force(N)
25 3.39e-2 1.99e-2
50 8.48e-3 4.98e-3
75 3.77e-3 2.21e-3
100 2.12e-3 1.24e-3
125 1.36e-3 7.98e-4
150 9.43e-4 5.54e-4
5
175
1.5
1.23e-22
6.92e-4
7.22e-23
4.07e-4
25 2.68e-1 1.57e-1
50 6.69e-2 3.94e-2
75 2.98e-2 1.75e-2
100 1.67e-2 9.84e-3
125 1.07e-2 6.29e-3
150 7.44e-3 4.37e-3
10
175
1.5
9.69e-22
5.46e-3
5.69e-22
3.21e-3
25 2.16e+0 1.27e+0
50 5.41e-1 3.18e-1
75 2.40e-1 1.41e-1
100 1.35e-1 7.95e-2
125 8.65e-2 5.09e-2
150 6.01e-2 3.53e-2
20
175
1.5
7.83e-21
4.42e-2
4.60e-21
2.59e-2
25 1.75e+1 1.03e+1
50 4.37e+0 2.57e+0
75 1.94e+0 1.14e+0
100 1.09e+0 6.42e-1
125 6.98e-1 4.11e-1
150 4.85e-1 2.85e-1
40
175
1.5
6.32e-20
3.57e-1
3.72e-20
2.09e-1
25 5.92e+1 3.48e+1
50 1.48e+1 8.70e+0
75 6.58e+0 3.87e+0
100 3.69e+0 2.18e+0
125 2.37e+0 1.39e+0
150 1.64e+0 9.67e-1
60
175
1.5
2.14e-19
1.21e+0
1.26e-19
7.10e-1

19
2.2.3 Shear and Bending Failure Analysis
Bending failure is commonly observed for free standing microneedle columns as a result
of bending moment produced by shear force acting on needle tips. Flexure formula states the
expression for maximum bending stress generated in a beam given as:
σ = My/I
where, y = distance from neutral axis to outer edge of the beam
M= Bending moment
I = Moment of Inertia about centroid of the beam
The maximum shear force that the needle of length L can withstand before fracture is given as:
F = σ I/ Yl
Assuming the yield strength for thermal SiO2 as 8.4GPa, the mathematical analysis for the
parametric studies have been summarized in Table 2.3
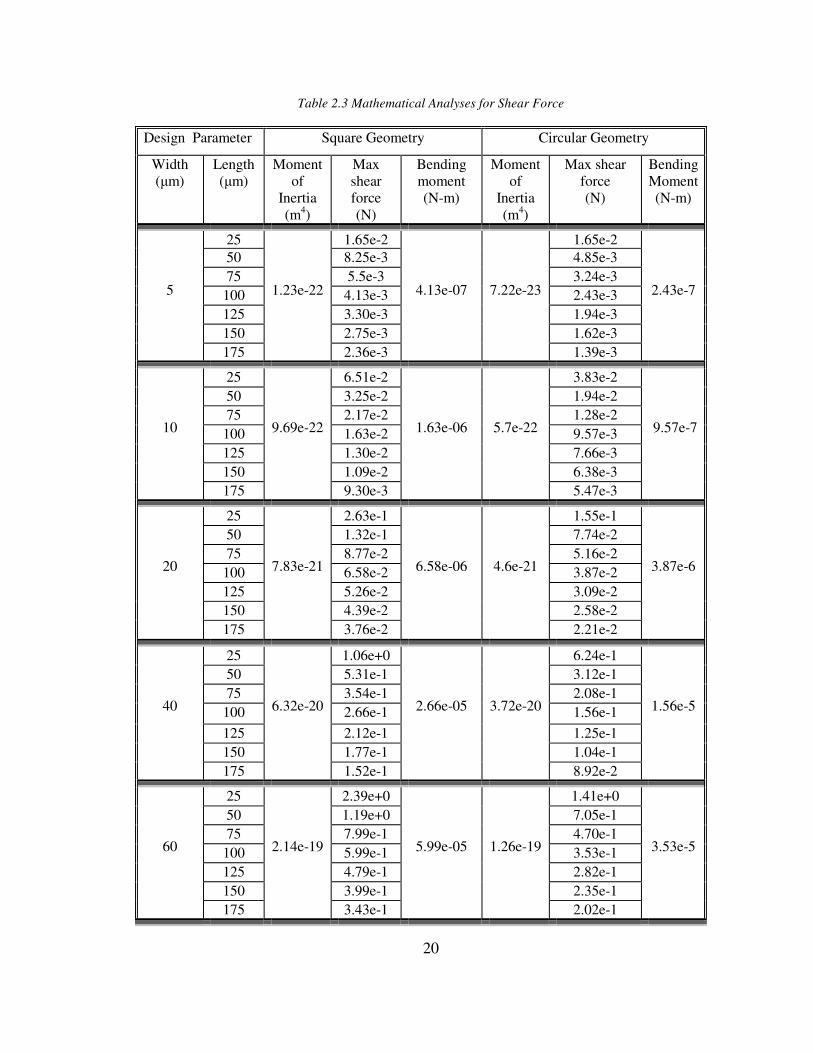
20
Table 2.3 Mathematical Analyses for Shear Force
Design Parameter Square Geometry Circular Geometry
Width
(µm)
Length
(µm)
Moment
of
Inertia
(m4)
Max
shear
force
(N)
Bending
moment
(N-m)
Moment
of
Inertia
(m4)
Max shear
force
(N)
Bending
Moment
(N-m)
25 1.65e-2 1.65e-2
50 8.25e-3 4.85e-3
75 5.5e-3 3.24e-3
100 4.13e-3 2.43e-3
125 3.30e-3 1.94e-3
150 2.75e-3 1.62e-3
5
175
1.23e-22
2.36e-3
4.13e-07
7.22e-23
1.39e-3
2.43e-7
25 6.51e-2 3.83e-2
50 3.25e-2 1.94e-2
75 2.17e-2 1.28e-2
100 1.63e-2 9.57e-3
125 1.30e-2 7.66e-3
150 1.09e-2 6.38e-3
10
175
9.69e-22
9.30e-3
1.63e-06
5.7e-22
5.47e-3
9.57e-7
25 2.63e-1 1.55e-1
50 1.32e-1 7.74e-2
75 8.77e-2 5.16e-2
100 6.58e-2 3.87e-2
125 5.26e-2 3.09e-2
150 4.39e-2 2.58e-2
20
175
7.83e-21
3.76e-2
6.58e-06
4.6e-21
2.21e-2
3.87e-6
25 1.06e+0 6.24e-1
50 5.31e-1 3.12e-1
75 3.54e-1 2.08e-1
100 2.66e-1 1.56e-1
125 2.12e-1 1.25e-1
150 1.77e-1 1.04e-1
40
175
6.32e-20
1.52e-1
2.66e-05
3.72e-20
8.92e-2
1.56e-5
25 2.39e+0 1.41e+0
50 1.19e+0 7.05e-1
75 7.99e-1 4.70e-1
100 5.99e-1 3.53e-1
125 4.79e-1 2.82e-1
150 3.99e-1 2.35e-1
60
175
2.14e-19
3.43e-1
5.99e-05
1.26e-19
2.02e-1
3.53e-5
21
2.2.4 Shear Stress Analysis using ANSYS
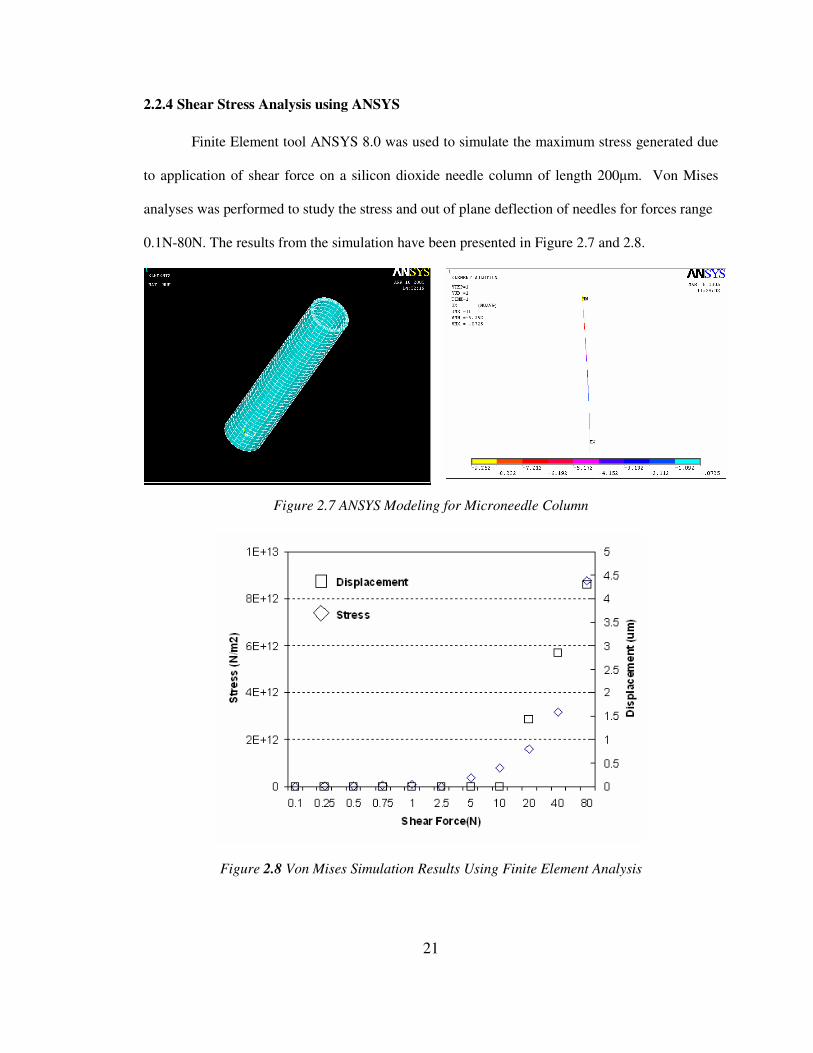
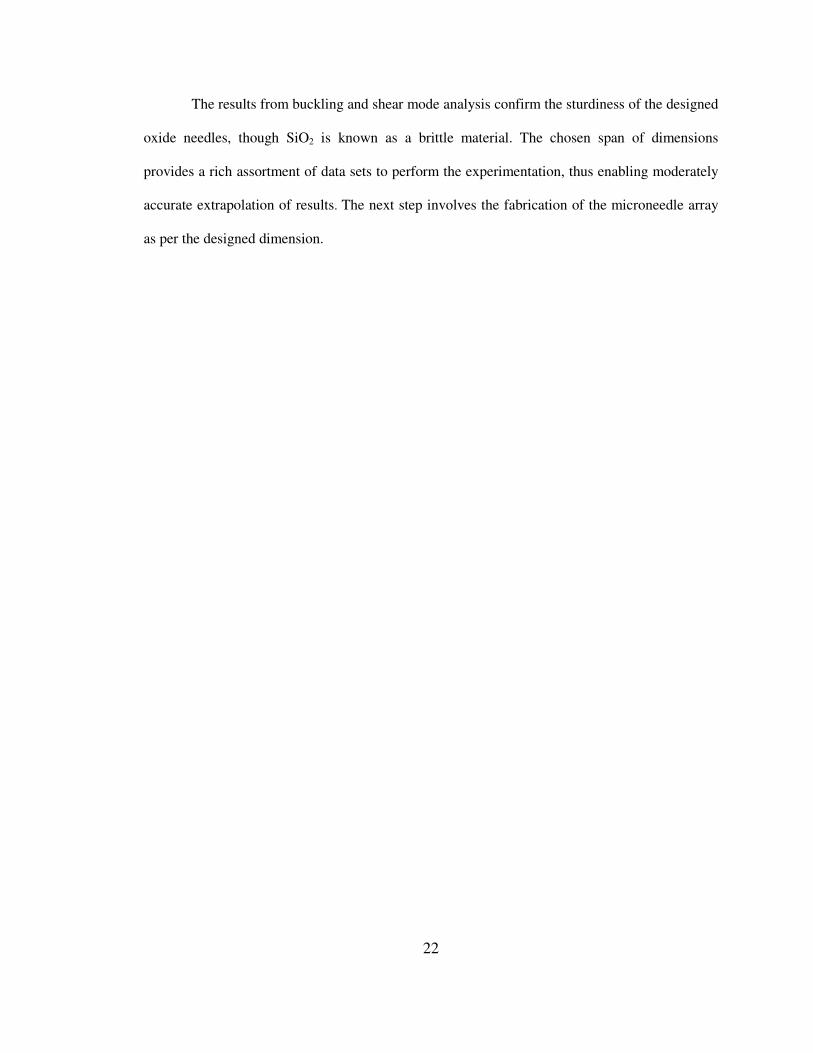
Finite Element tool ANSYS 8.0 was used to simulate the maximum stress generated due
to application of shear force on a silicon dioxide needle column of length 200µm. Von Mises
analyses was performed to study the stress and out of plane deflection of needles for forces range
0.1N-80N. The results from the simulation have been presented in Figure 2.7 and 2.8.
Figure 2.7 ANSYS Modeling for Microneedle Column
Figure 2.8 Von Mises Simulation Results Using Finite Element Analysis
22
The results from buckling and shear mode analysis confirm the sturdiness of the designed
oxide needles, though SiO2 is known as a brittle material. The chosen span of dimensions
provides a rich assortment of data sets to perform the experimentation, thus enabling moderately
accurate extrapolation of results. The next step involves the fabrication of the microneedle array
as per the designed dimension.
23
CHAPTER 3 MICRONEEDLE FABRICATION
This chapter presents a detailed discussion on the fabrication approaches adopted
for development of hollow, out of plane silicon dioxide microneedle arrays. Two approaches
differing in the techniques employed to obtain bulk micromachined anisotropic pores: Deep
Reactive Ion etching (dry process) and Porous Silicon etching (wet electrochemical process) were
adopted. However, the post pore formation process remains the same for each of these methods.
The process flow details have been presented with description of issues encountered in each
approach.
3.1 DRIE Based Microneedles
3.1.1 Introduction: DRIE
Also referred as Bosch process, DRIE is anisotropic, crystal-orientation independent dry
etch technique capable of producing High Aspect Ratio Structures (HARS). It is used widely for
fabrication of micro system components like capacitors, accelerometers, optical switches etc. This
is a sub class of inductively coupled plasma etch schemes capable of generating high density
plasma discharge on RF power coupling to a low pressure gas medium. The etch rate for Silicon
substrates ranges from 1-3µm/min and the variation in selectivity to masking is from 50 to 100:1
for photoresist and from 120 to 200:1 for oxide mask [20]. The process operates on a continuous
time multiplexing scheme consisting of alternate etch and polymer deposition cycles to obtain a
nearly vertical side wall (90±2°). The etch cycle exploits the high etch rates obtained by ion
24
bombardment of fluorinated discharges (such as SF6) but yields an isotropic geometry. Highly
anisotropic profile is obtained by subsequent side wall passivation cycle (using C4F8) via polymer
deposition. The polymer is immediately sputtered away on the horizontal surfaces only due to the
physical nature of the etching, with the sidewalls remaining unaffected. This behavior results
from the directional nature of the accelerated ions. Features like anisotropy, etch rate and
selectivity can be controlled through proper choice of RF power, gas pressure and time.
3.1.2 Detailed Process Flow and Results
A similar process flow was implemented at University of Tokyo to obtain hollow
microcapillaries for DNA injection [21] .The process flow design for fabrication of open ended
microneedle array has been outlined in Figure 3.1. Since the current research is dedicated towards
mechanical characterization, the later steps of the process flow have been slightly modified to
open closed base needles for ease of fabrication.
4” DSP n-type <100> Silicon wafers of thickness 400-500µm were employed for
processing. These wafers were subjected to RCA clean prior to deposition of masking layer for
further bulk micromachining. Silicon dioxide (selectivity 150:1) and Aluminum (selectivity
300:1) were used as masking materials for DRIE etching of Silicon. 1.5µm thick oxide layer was
thermally grown on three wafers at 10500C after subjecting to 8 hrs of wet oxidation. 3000 A of
Al was deposited on three other wafers using AJA International Electron Beam Evaporator.
A 5” dark field Chrome mask was designed in order to study the effect of
multidimensional geometric patterns as discussed in Chapter 2. 68 different design as listed in
Table 3.1 were finalized for fabrication and were individually implemented in form of 0.9 by 0.9
square cm feature size on photomask.
25
Figure 3.1 DRIE Based Microneedle Process Flow
Each die is labeled using an alphabet (A for square and C for circle) and number (3µm feature
size) at the lower right corner of the die. The mask layout was implemented using Coventorware
TM as illustrated in Figure 3.2.
A) Deposition of masking layer (3000 A evaporated
Al or 1.5 µm thermally grown oxide) on 4” Si
wafer
E) Lap the wafer chips
to expose the top
silicon layer
F) Frontside TMAH Si
etch to obtain out of
plane hollow Silicon
dioxide needle array
E) Lap the backside of
the wafer chips in
order to obtain through
needles
F) Backside TMAH Si
etch to obtain out of
plane hollow Silicon
dioxide needle array
Al
Open base hollow
needle array
D) Strip Photo-resist and etch remaining Al
This is followed by dicing into 0.9 square die
and thermal oxidation to define needle side
wall (1.5µm)
B) Pattern masking layer using microneedle
mask followed by mask layer etching
C) DRIE Silicon etching- 400 Bosch cycles
Closed base hollow
needle array
26
Figure 3.2 Microneedle Mask Layout in Coventorware
The following steps were carried out to define the microneedle region on the masking
layer:
• Spin primer HMDS and positive photoresist S1827 on the mask layer at 2500rpm for 30
sec @ 100rpm/sec acceleration using P-6000 resist spin coater. This program yields
around 3µm thick layer which provides good selectivity to silicon dioxide during
subsequent oxide reactive ion etch. The photo resist thickness is not a crucial factor with
Aluminum as masking layer.
• Soft bake at 100 C for 15 min in oven
• Expose the photoresist for 45 sec using soft contact printing on Karl Suss mask aligner
(UV light intensity:11mJ/cm2)
• Develop for 30sec using developer MF319
• Hard bake at 110C for 30min in oven
• Profilometer thickness measurement: 3.3µm
Wafer flat aligner
33 Square feature (A01-A33) with dicing
marks
33 Circular features (C01-C33) with
dicing marks
DRIE Microloading study
pattern
27
Table 3.1 Design Patterns for Geometrical Investigation
Pattern
No
Pattern
type
Pattern
type
Purpose of pattern
Width
(µm)
Pitch
(µm)
Array
No. of
Chips(Ea)
1
Square
Circular
A01
C01
5
-
1x1
1
1
2
Square
Circular
A02
C02
10
-
1x1
1
1
3
Square
circular
A03
C03
20
-
1×1
1
1
4
Square
circular
A04
C04
40
-
1×1
1
1
5
Square
circular
A05
C05
Single needle Fracture &
(Maybe difficult to find the
needle)
60
-
1×1
1
1
6 Square
circular
A06
A06
5 20 5x5 1
1
7 Square
circular
A07
C07
5 40 5x5 1
1
8 Square
Circle
A08
C08
5 50 5X5 1
1
9 Square
Circle
A09
C09
10 20 5X5 1
1
10 Square
circular
A10
C10
1. fracture & penetration test
2. (5x5) needle array: effect of
pitch and width on penetration
10 50 5x5 1
1
28
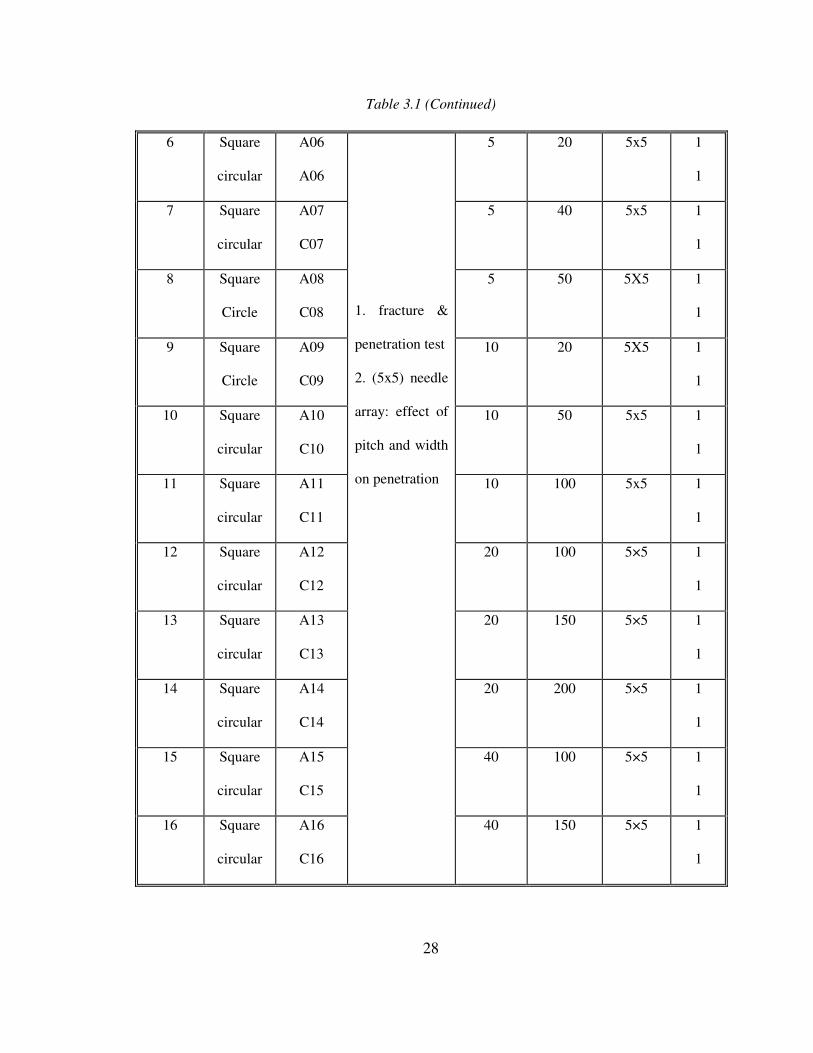
Table 3.1 (Continued)
6 Square
circular
A06
A06
5 20 5x5 1
1
7 Square
circular
A07
C07
5 40 5x5 1
1
8 Square
Circle
A08
C08
5 50 5X5 1
1
9 Square
Circle
A09
C09
10 20 5X5 1
1
10 Square
circular
A10
C10
10 50 5x5 1
1
11 Square
circular
A11
C11
10 100 5x5 1
1
12 Square
circular
A12
C12
20 100 5×5 1
1
13 Square
circular
A13
C13
20 150 5×5 1
1
14 Square
circular
A14
C14
20 200 5×5 1
1
15 Square
circular
A15
C15
40 100 5×5 1
1
16 Square
circular
A16
C16
1. fracture &
penetration test
2. (5x5) needle
array: effect of
pitch and width
on penetration
40 150 5×5 1
1
29
Table 3.1 (Continued)
17 Square
circular
A17
C17
40 200 5×5 1
1
18 Square
circular
A18
C18
60 100 5×5 1
1
19 Square
circular
A19
C19
60 150 5×5 1
1
20 Square
circular
A20
C20
60 200 5×5 1
1
21 Square
circular
A21
C21
5 20 25x25 1
1
22 Square
circular
A22
C22
5 50 25x25 1
1
23 Square
circular
A23
C23
10 50 25x25 1
1
24 Square
circular
A24
C24
10 100 25x25 1
1
25 Square
circular
A25
C25
20 100 25x25 1
1
26 Square
circular
A26
C26
20 150 25x25 1
1
27 Square
circular
A27
C27
20 200 25x25 1
1
28 Square
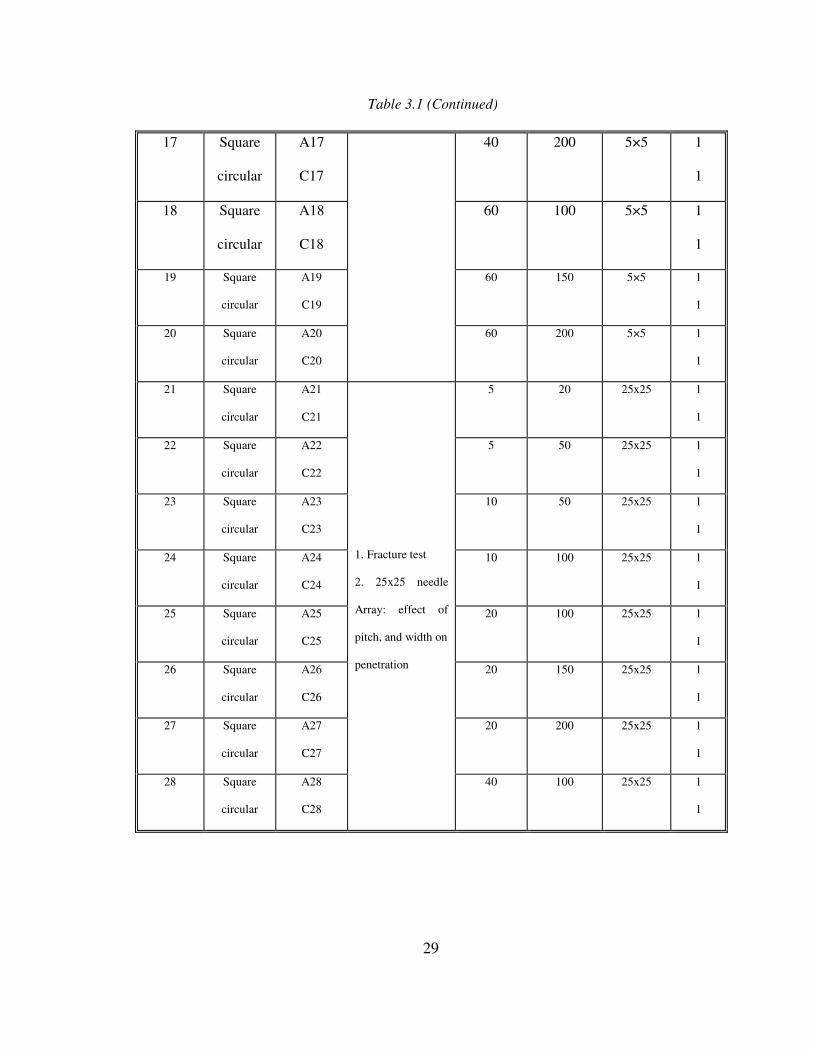
circular
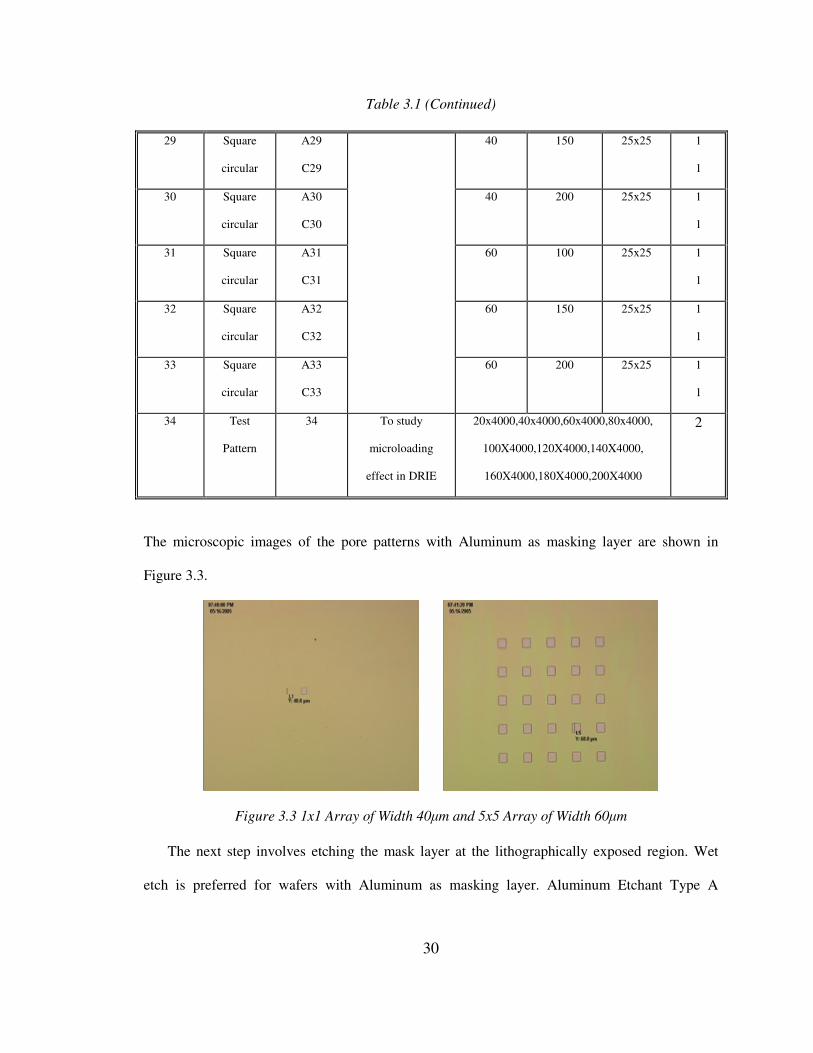
A28
C28
1. Fracture test
2. 25x25 needle
Array: effect of
pitch, and width on
penetration
40 100 25x25 1
1
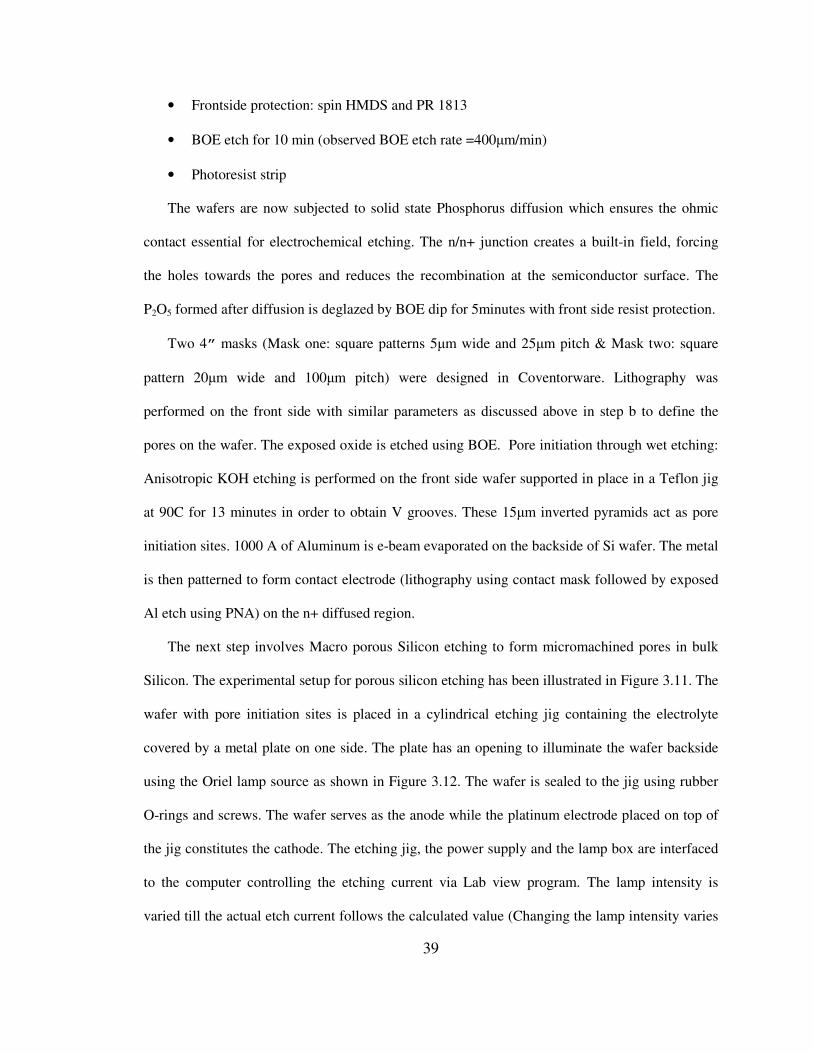
30
Table 3.1 (Continued)
29 Square
circular
A29
C29
40 150 25x25 1
1
30 Square
circular
A30
C30
40 200 25x25 1
1
31 Square
circular
A31
C31
60 100 25x25 1
1
32 Square
circular
A32
C32
60 150 25x25 1
1
33 Square
circular
A33
C33
60 200 25x25 1
1
34 Test
Pattern
34 To study
microloading
effect in DRIE
20x4000,40x4000,60x4000,80x4000,
100X4000,120X4000,140X4000,
160X4000,180X4000,200X4000
2
The microscopic images of the pore patterns with Aluminum as masking layer are shown in
Figure 3.3.
Figure 3.3 1x1 Array of Width 40µm and 5x5 Array of Width 60µm
The next step involves etching the mask layer at the lithographically exposed region. Wet
etch is preferred for wafers with Aluminum as masking layer. Aluminum Etchant Type A
31
Phosphoric-Nitric-Acetic Acid) etches Al at the rate of 100 A/sec at 50C. Figure 3.4 illustrates
the exposed Silicon region after Al etching and photoresist strip.
Figure 3.4 25x25 Array after Al Etching
Dry etch technique is preferred for oxide mask layers since buffered oxide etchant (wet)
produces considerable amount of undercutting while etching 1.5µm thick oxide. The oxide wafers
are subjected to reactive ion etching in the Unaxis RIE tool using CHF3/O2 etch chemistry with
1:1 oxide to photoresist selectivity. The process parameters for oxide etch have been summarized
in Table 3.2.
Table 3.2 RIE Process Parameters
Gases
(sccm)
Time (in min)
RF power
(watts) CHF3 O2
Pressure
( mtorr)
DC bias
(V)
Etch rate
(A/min)
45 200 45 5 40 440V 400-500
The patterned wafers were subjected to 400 Bosch cycles in Unaxis DRIE Tool
(Courtesy: Star Centre, Largo) with process parameters as listed in Table 3.3.
32
Table 3.3 Bosch Cycle in DRIE
Process Time
(sec)
RF power
(watts)
Gases
( sccm)
Pressure
( mtorr)
RF1 RF2 C4F8 SF6 Ar He
Passivation 5 1.0 825 70 0.5 40 5.18 23.0
Clean 2 9.0 825 0.5 50 40 5.18 23.0
Etch 6 9.0 825 0.5 100 40 5.18 23.0
Etching Issues associated with DRIE process:
• Microloading: Die 34 in the microneedle mask is dedicated to study the loading effect in
DRIE. From the SEM image in Figure 3.5, die 34 manifests an intra-die variation in etch
rate due to Aspect Ratio Dependent Effect (ARDE). The etch depth increases to about
80µm with increase in local opening from 20µm to 200µm. This is due to reduced
transport of reactive species in narrow structures.
• Surface Roughness: Owing to alternate spontaneous etch and deposition processes
involved in Bosch cycles, etched high aspect ratio DRIE structures exhibit scalloped
rough sidewalls as observed in Figure 3.6. This issue can be minimized by optimizing the
operating DRIE parameters.
The next step involves sidewall development of silicon oxide microneedle. The 4” wafer is
diced into individual chips each of 0.9 square cm along dicing marks using Kulicke & Soffa
Dicing Saw. This process is performed before oxidation since subsequent Silicon wet etch of
diced oxidized wafer causes non uniform edges, eating away patterns on large density needles.
Each chip is tracked by a label, visible under 5x optical microscope. This is followed by dry
oxidation (1hr) and wet oxidation (11 hrs) of chips at 1100C in a quartz tube mounted on inverted
boat in the furnace tube to obtain 1.5µm thick sidewall.

33
Figure 3.5 Figure 3.6
Figure 3.5 Microloading Effect in Die 34 Illustrating Etch Depth Variation with
Increasing Window Size on Masking Layer in DRIE
Figure 3.6 Scalloping Effect in DRIE Illustrating Surface Roughness
The top oxide layer has to be removed in order to expose the underlying bare silicon for
TMAH etch. This is achieved by lapping chips (wax bonded to 4” glass plate) on Logitech PM5.
The lapping parameters employed for fabrication is stated below:
• Lapping solution: Calcined Alumina powder + water (1:10)
• Lapping Time: 5 min at rate of ~2-4µm/min
• The chips are debonded and excessive wax is removed from the die by means of
Opticlear wax remover and solvent wash.
The final fabrication step involves silicon wet etching in order to expose the bulk
micromachined needles. Tetramethyl Ammonium hydroxide (25% TMAH, (CH3)4NOH) is
preferred over other silicon etchants owing to increased selectivity of Silicon to oxide
(TMAH=500:1) [20]. The etching was performed at 850C for 2hrs with uniform stirring. The
observed etch rate was found to be around 25~30µm/hr. One of the issues faced with the etching
was surface roughness which was overcome by addition of IPA and pyrazine [20]. Figure 3.7
exhibits the final hollow out of plane microneedle array with closed base.
Scalloping
34
Figure 3.7 Final Microneedle Array
3.2 Porous Silicon Based Microneedles
3.2.1 Introduction to Macroporous Silicon
Porous Silicon is considered as a therapeutic biomaterial owing to ability to directly interface
with human tissue like bones and biological molecules [22]. Porous silicon etching is formed by
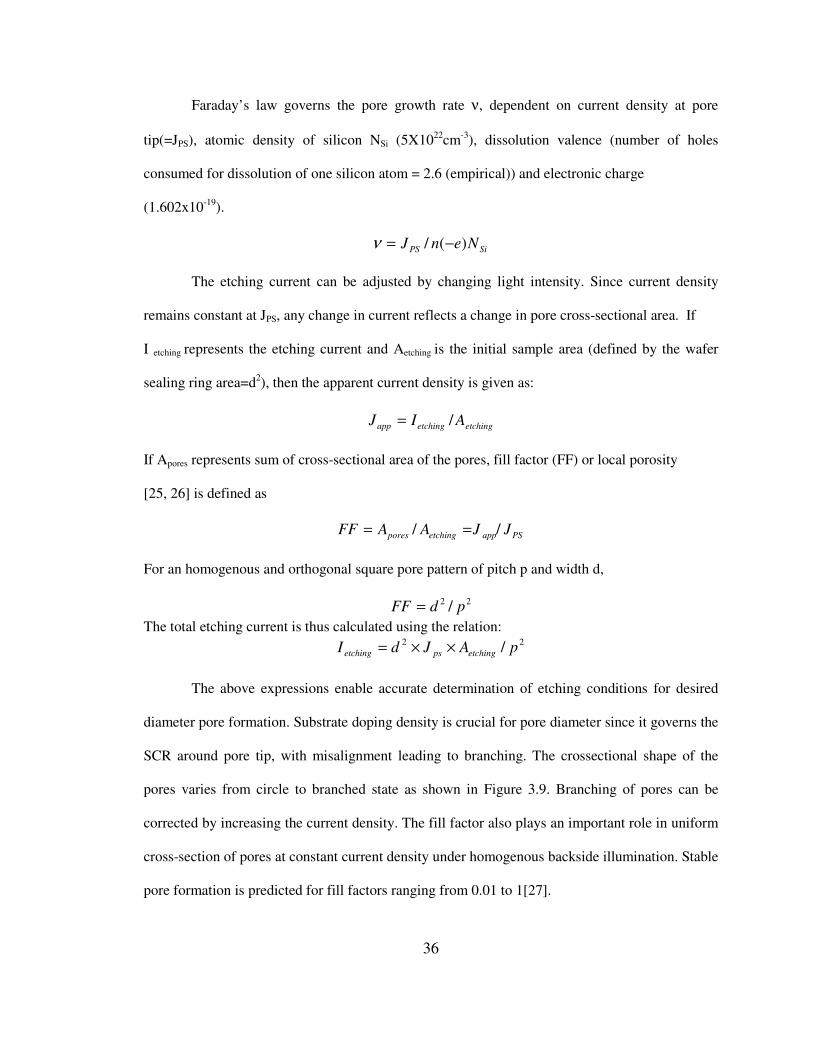
anodic dissolution of Silicon in HF electrolyte. The I-V characteristics governing pore formation
has been illustrated in Figure 3.8 with pore formation conditions (highlighted in the dot area)
below critical current density JPS. Beyond JPS peak, electro polishing occurs. Based on the
substrate doping and anodization conditions like HF concentration, current density, potential and
illumination intensity, different pore diameter materials classified as micropores (<2nm),
mesopores (2-50nm) or macropores (>50nm, ranging in microns) are obtained.

35
Figure 3.8 I-V Characteristics Governing Electrochemical Dissolution of Silicon [23]
Macroporous Silicon formation occurs in n type substrate in presence of illumination and
aqueous electrolyte during etching process [24]. Backside Illumination generates the holes
required to promote silicon dissolution, otherwise restricted by holes present as minority carriers
in n type substrate. Under anodic bias at constant current density JPS, space charge region (SCR)
is generated at pore tips and silicon dissolution reaches steady state condition between charge
transfer and mass transport. Macropores can be localized by pore initiation etch pits defined by
lithography. The value of JPS is anisotropic and is found to be maximum in (100) direction
thereby making it the dominant pore growth direction without branching. The critical current
density JPS (in mA-cm2) is calculated by the Arrhenius expression:
)/exp(2/3kTECcJ aPS =
Where c = electrolyte concentration (in wt% HF)
T = absolute temperature (in K)
Ea = Activation energy (0.345 eV)
C = 3300A/cm2 wt%
2/3=constant experimentally determined by Lehmann[23]
36
Faraday’s law governs the pore growth rate ν, dependent on current density at pore
tip(=JPS), atomic density of silicon NSi (5X10²²
cm-3
), dissolution valence (number of holes
consumed for dissolution of one silicon atom = 2.6 (empirical)) and electronic charge
(1.602x10⁻¹⁹
).
SiPS NenJ )(/ −=ν
The etching current can be adjusted by changing light intensity. Since current density
remains constant at JPS, any change in current reflects a change in pore cross-sectional area. If
I etching represents the etching current and Aetching is the initial sample area (defined by the wafer
sealing ring area=d2), then the apparent current density is given as:
etchingetchingapp AIJ /=
If Apores represents sum of cross-sectional area of the pores, fill factor (FF) or local porosity
[25, 26] is defined as
PSappetchingpores JJAAFF // ==
For an homogenous and orthogonal square pore pattern of pitch p and width d,
22 / pdFF =
The total etching current is thus calculated using the relation: 22 / pAJdI etchingpsetching ××=
The above expressions enable accurate determination of etching conditions for desired
diameter pore formation. Substrate doping density is crucial for pore diameter since it governs the
SCR around pore tip, with misalignment leading to branching. The crossectional shape of the
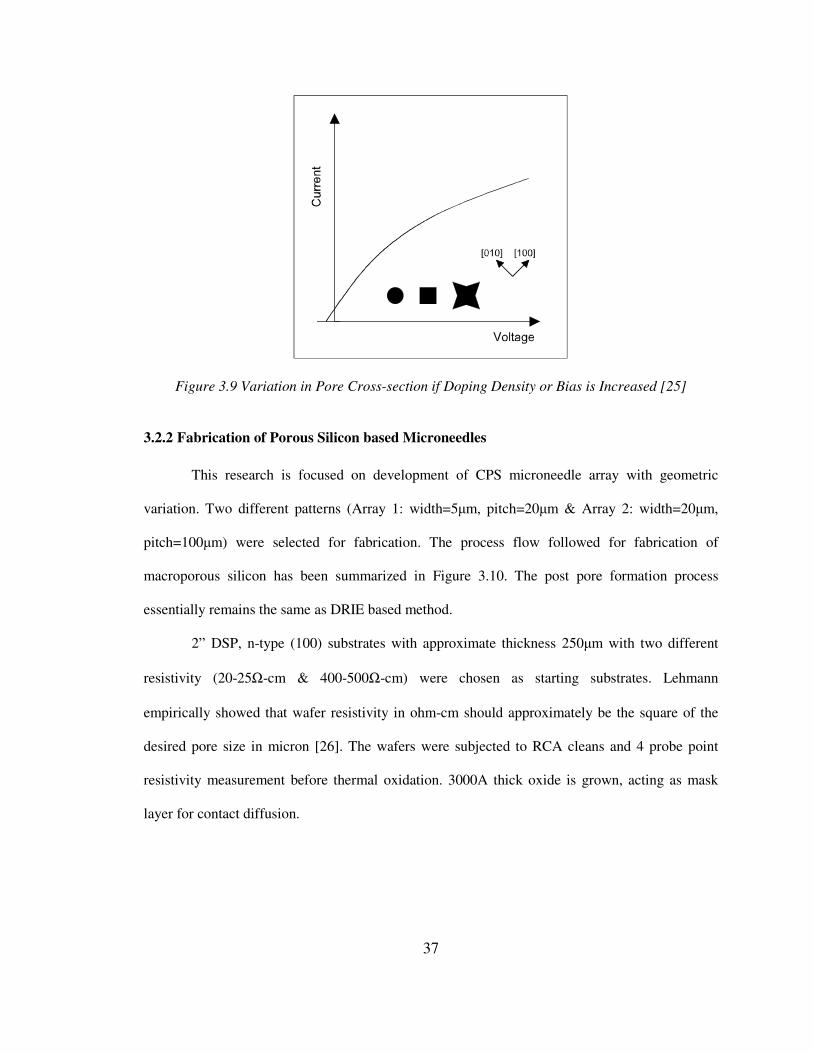
pores varies from circle to branched state as shown in Figure 3.9. Branching of pores can be
corrected by increasing the current density. The fill factor also plays an important role in uniform
cross-section of pores at constant current density under homogenous backside illumination. Stable
pore formation is predicted for fill factors ranging from 0.01 to 1[27].
37
Figure 3.9 Variation in Pore Cross-section if Doping Density or Bias is Increased [25]
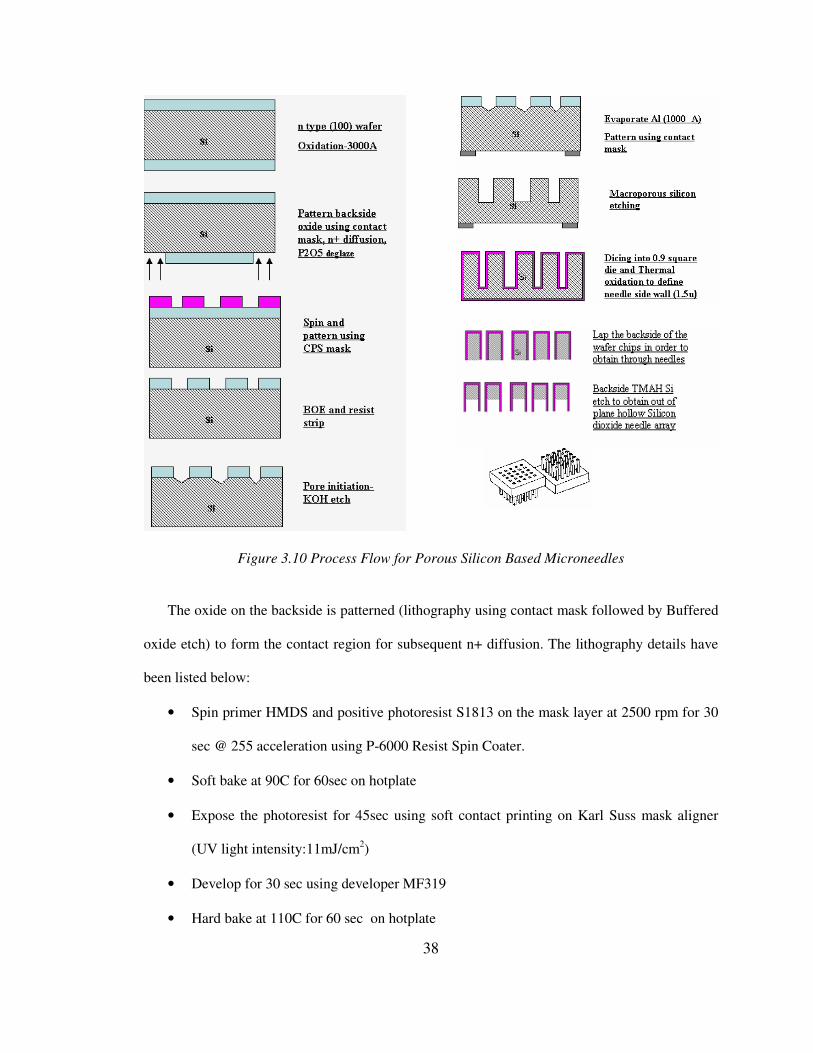
3.2.2 Fabrication of Porous Silicon based Microneedles
This research is focused on development of CPS microneedle array with geometric
variation. Two different patterns (Array 1: width=5µm, pitch=20µm & Array 2: width=20µm,
pitch=100µm) were selected for fabrication. The process flow followed for fabrication of
macroporous silicon has been summarized in Figure 3.10. The post pore formation process
essentially remains the same as DRIE based method.
2” DSP, n-type (100) substrates with approximate thickness 250µm with two different
resistivity (20-25Ω-cm & 400-500Ω-cm) were chosen as starting substrates. Lehmann
empirically showed that wafer resistivity in ohm-cm should approximately be the square of the
desired pore size in micron [26]. The wafers were subjected to RCA cleans and 4 probe point
resistivity measurement before thermal oxidation. 3000A thick oxide is grown, acting as mask
layer for contact diffusion.
38
Figure 3.10 Process Flow for Porous Silicon Based Microneedles
The oxide on the backside is patterned (lithography using contact mask followed by Buffered
oxide etch) to form the contact region for subsequent n+ diffusion. The lithography details have
been listed below:
• Spin primer HMDS and positive photoresist S1813 on the mask layer at 2500 rpm for 30
sec @ 255 acceleration using P-6000 Resist Spin Coater.
• Soft bake at 90C for 60sec on hotplate
• Expose the photoresist for 45sec using soft contact printing on Karl Suss mask aligner
(UV light intensity:11mJ/cm2)
• Develop for 30 sec using developer MF319
• Hard bake at 110C for 60 sec on hotplate
39
• Frontside protection: spin HMDS and PR 1813
• BOE etch for 10 min (observed BOE etch rate =400µm/min)
• Photoresist strip
The wafers are now subjected to solid state Phosphorus diffusion which ensures the ohmic
contact essential for electrochemical etching. The n/n+ junction creates a built-in field, forcing
the holes towards the pores and reduces the recombination at the semiconductor surface. The
P2O5 formed after diffusion is deglazed by BOE dip for 5minutes with front side resist protection.
Two 4” masks (Mask one: square patterns 5µm wide and 25µm pitch & Mask two: square
pattern 20µm wide and 100µm pitch) were designed in Coventorware. Lithography was
performed on the front side with similar parameters as discussed above in step b to define the
pores on the wafer. The exposed oxide is etched using BOE. Pore initiation through wet etching:
Anisotropic KOH etching is performed on the front side wafer supported in place in a Teflon jig
at 90C for 13 minutes in order to obtain V grooves. These 15µm inverted pyramids act as pore
initiation sites. 1000 A of Aluminum is e-beam evaporated on the backside of Si wafer. The metal
is then patterned to form contact electrode (lithography using contact mask followed by exposed
Al etch using PNA) on the n+ diffused region.
The next step involves Macro porous Silicon etching to form micromachined pores in bulk
Silicon. The experimental setup for porous silicon etching has been illustrated in Figure 3.11. The
wafer with pore initiation sites is placed in a cylindrical etching jig containing the electrolyte
covered by a metal plate on one side. The plate has an opening to illuminate the wafer backside
using the Oriel lamp source as shown in Figure 3.12. The wafer is sealed to the jig using rubber
O-rings and screws. The wafer serves as the anode while the platinum electrode placed on top of
the jig constitutes the cathode. The etching jig, the power supply and the lamp box are interfaced
to the computer controlling the etching current via Lab view program. The lamp intensity is
varied till the actual etch current follows the calculated value (Changing the lamp intensity varies
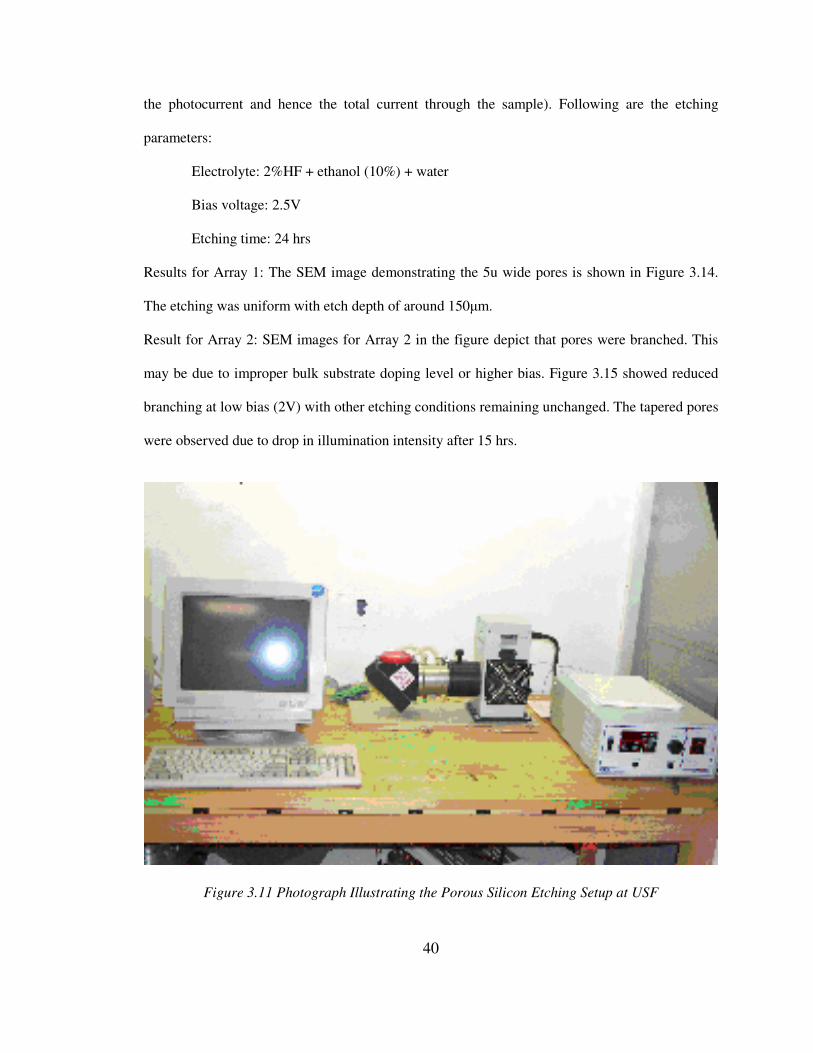
40
the photocurrent and hence the total current through the sample). Following are the etching
parameters:
Electrolyte: 2%HF + ethanol (10%) + water
Bias voltage: 2.5V
Etching time: 24 hrs
Results for Array 1: The SEM image demonstrating the 5u wide pores is shown in Figure 3.14.
The etching was uniform with etch depth of around 150µm.
Result for Array 2: SEM images for Array 2 in the figure depict that pores were branched. This
may be due to improper bulk substrate doping level or higher bias. Figure 3.15 showed reduced
branching at low bias (2V) with other etching conditions remaining unchanged. The tapered pores
were observed due to drop in illumination intensity after 15 hrs.
Figure 3.11 Photograph Illustrating the Porous Silicon Etching Setup at USF
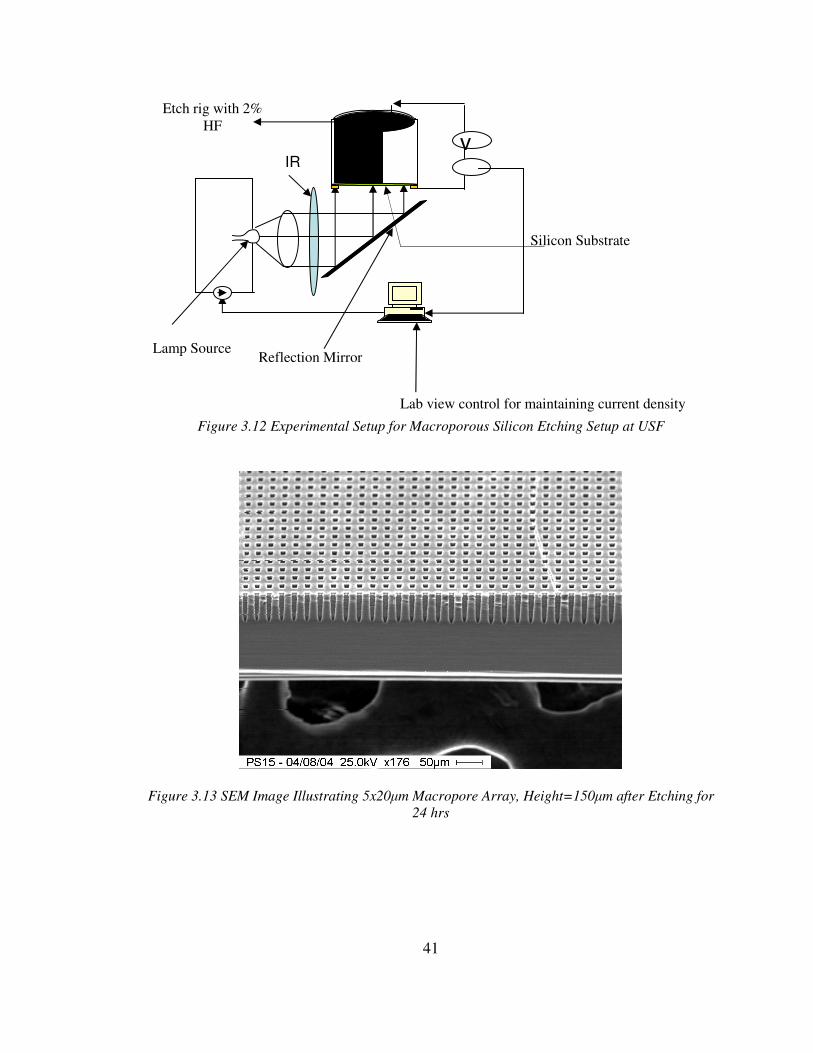
41
Figure 3.12 Experimental Setup for Macroporous Silicon Etching Setup at USF
Figure 3.13 SEM Image Illustrating 5x20µm Macropore Array, Height=150µm after Etching for
24 hrs
A
H
F v
Etch rig with 2%
HF
IR Filter
Reflection Mirror Lamp Source
Silicon Substrate
Lab view control for maintaining current density
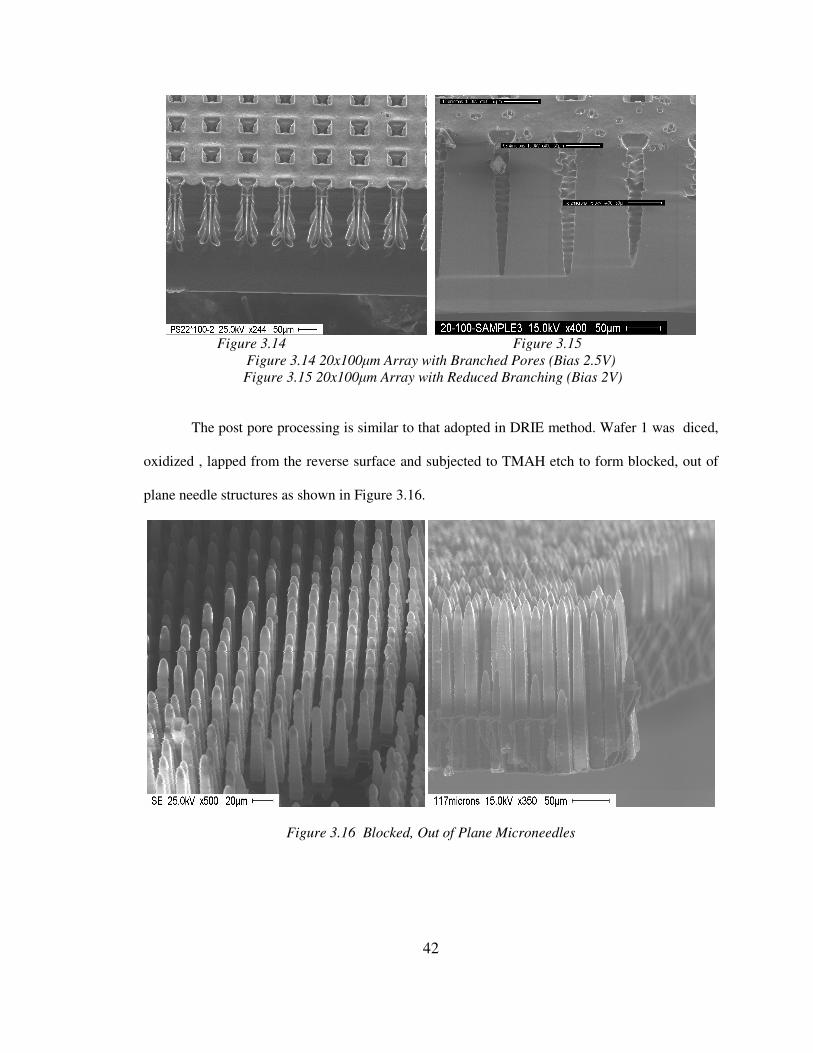
42
Figure 3.14 Figure 3.15
Figure 3.14 20x100µm Array with Branched Pores (Bias 2.5V)
Figure 3.15 20x100µm Array with Reduced Branching (Bias 2V)
The post pore processing is similar to that adopted in DRIE method. Wafer 1 was diced,
oxidized , lapped from the reverse surface and subjected to TMAH etch to form blocked, out of
plane needle structures as shown in Figure 3.16.
Figure 3.16 Blocked, Out of Plane Microneedles

43
3.3 DRIE Vs. Porous Silicon Based Microneedle Fabrication Process
Table 3.4 Comparison of Porous Silicon and DRIE Processes
DRIE based microneedle fabrication Porous Silicon based microneedle fabrication
Different microneedle design chips can be
obtained from one single wafer since they
are lithographically defined
Single pattern obtained from one wafer since
pore dimension is a function of %HF, etching
current, substrate doping levels, bias etch
Ease in fabrication, single lithography step
Complex fabrication process involving three
lithography steps
Higher etch rate Time consuming process with low etch rates
DRIE etch independent of wafer
specifications
Substrate specification like type, direction and
resistivity are crucial for pore formation
Pores necessarily occupy entire wafer. No
space for additional features.
Selective etching is possible in certain areas as
per requirement.
No disposal of dangerous acids and solvents
involved. However process involves use of
toxic etch gas composition
Hazardous acids and solvents need to be
disposed.
Loading effect due to selective etching
No loading effect, all pores are approximately
etched to same depth
44
CHAPTER 4 BIO-MECHANICAL CHARACTERISATION
4.1 Introduction
DRIE based SiO2 microneedle arrays were employed for experimental testing to examine
the significance of geometry on transdermal testing. This scheme was adopted due to ease in
usage and speedy fabrication of desired patterns from a single wafer as compared to porous
silicon based etching. Reliability testing based on measurement of buckling force and skin
penetration force was performed before confirming use of the needles for applications like drug
delivery and fluid extraction. Measurement was carried out by an in-house developed testing
module utilizing an accurate load transducer and real time viewing capability. Preliminary
characterization was established on skin like polymer before real time experimentation on excised
split skin samples. Mechanical tests were also performed on the polymer to correlate its
properties with skin.
4.2 Experimental Setup
The experimental setup was designed to house two basic modules: skin loading block and
needle attachment block as shown in Figure 4.1. The skin is mounted on a 2cm x 4cm aluminum
block using double sided sticky tape. The penetration force was measured using a sensitive
tension-compression load cell (LCFA-500gF sensing capacity, Omega Co.) attached to the skin
mounting fixture. The internal construction of these load cells consists of a full four-arm
Wheatstone bridge, capable of producing repeatable measurements.
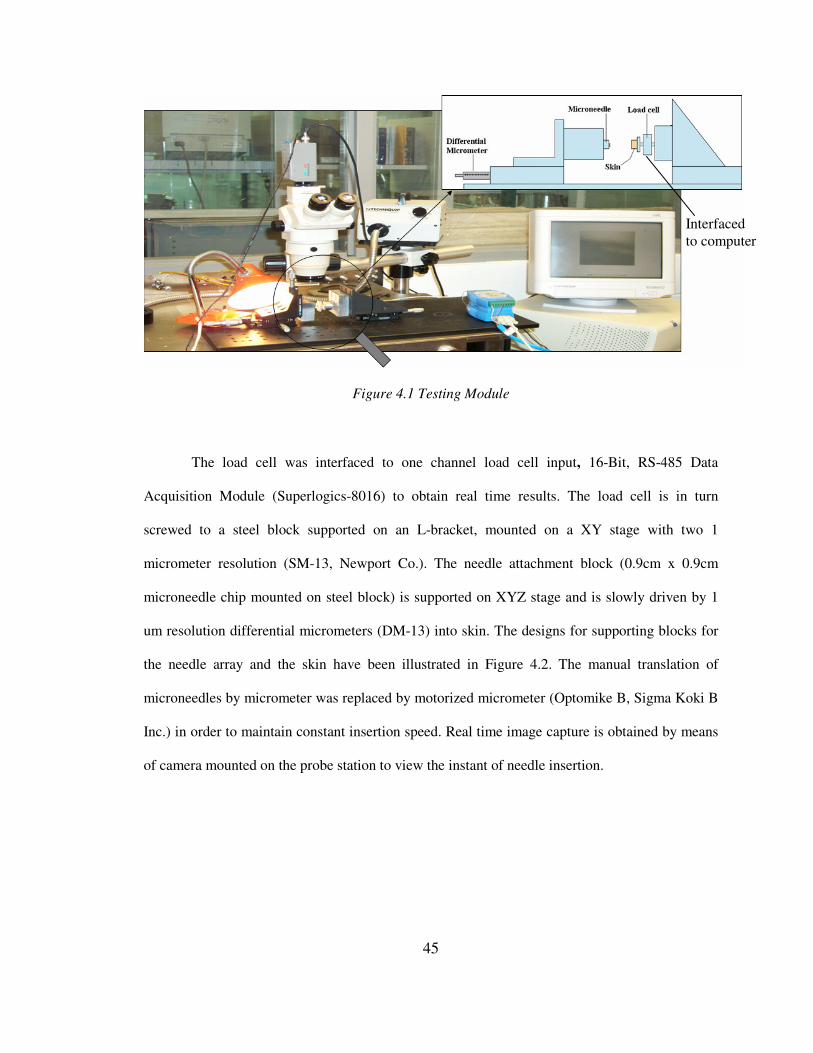
45
Figure 4.1 Testing Module
The load cell was interfaced to one channel load cell input, 16-Bit, RS-485 Data
Acquisition Module (Superlogics-8016) to obtain real time results. The load cell is in turn
screwed to a steel block supported on an L-bracket, mounted on a XY stage with two 1
micrometer resolution (SM-13, Newport Co.). The needle attachment block (0.9cm x 0.9cm
microneedle chip mounted on steel block) is supported on XYZ stage and is slowly driven by 1
um resolution differential micrometers (DM-13) into skin. The designs for supporting blocks for
the needle array and the skin have been illustrated in Figure 4.2. The manual translation of
microneedles by micrometer was replaced by motorized micrometer (Optomike B, Sigma Koki B
Inc.) in order to maintain constant insertion speed. Real time image capture is obtained by means
of camera mounted on the probe station to view the instant of needle insertion.
Interfaced
to computer

46
(a)
Figure 4.2(a) Load Cell Block (Top) (b) Microneedle Block ( Bottom)
(b)
One through hole
-diameter 7 mm hole thru
-diameter 11 mm hole with
depth 7 mm
33
25
60
10
Block with
microneedles
Front view
Top view
16.5
11
7
One through slot
- Inner diameter 7 mm thru
hole
-diameter 11 mm hole with
depth 7.5 mm
11
7 60
60
15 15
7 23
60
60
15 15
7 23
17
10 7
Back side
Top view
front
Front view
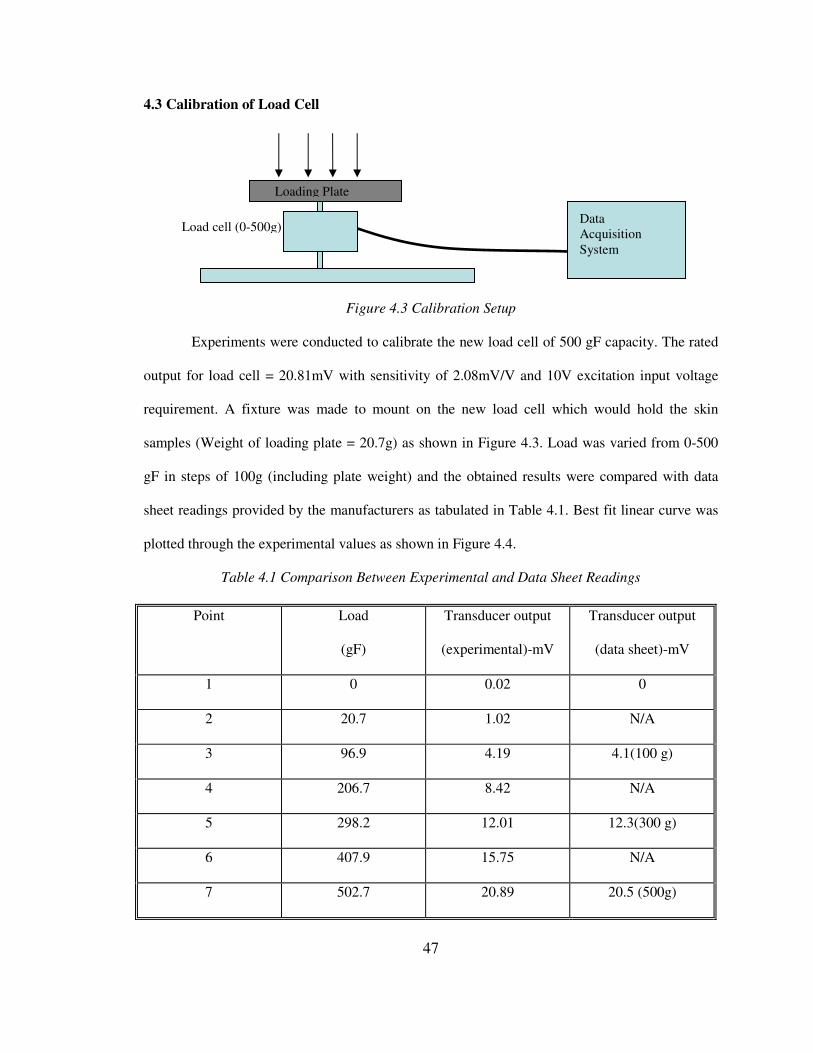
47
4.3 Calibration of Load Cell
Figure 4.3 Calibration Setup
Experiments were conducted to calibrate the new load cell of 500 gF capacity. The rated
output for load cell = 20.81mV with sensitivity of 2.08mV/V and 10V excitation input voltage
requirement. A fixture was made to mount on the new load cell which would hold the skin
samples (Weight of loading plate = 20.7g) as shown in Figure 4.3. Load was varied from 0-500
gF in steps of 100g (including plate weight) and the obtained results were compared with data
sheet readings provided by the manufacturers as tabulated in Table 4.1. Best fit linear curve was
plotted through the experimental values as shown in Figure 4.4.
Table 4.1 Comparison Between Experimental and Data Sheet Readings
Point Load
(gF)
Transducer output
(experimental)-mV
Transducer output
(data sheet)-mV
1 0 0.02 0
2 20.7 1.02 N/A
3 96.9 4.19 4.1(100 g)
4 206.7 8.42 N/A
5 298.2 12.01 12.3(300 g)
6 407.9 15.75 N/A
7 502.7 20.89 20.5 (500g)
Loading Plate
Load cell (0-500g) Data
Acquisition
System
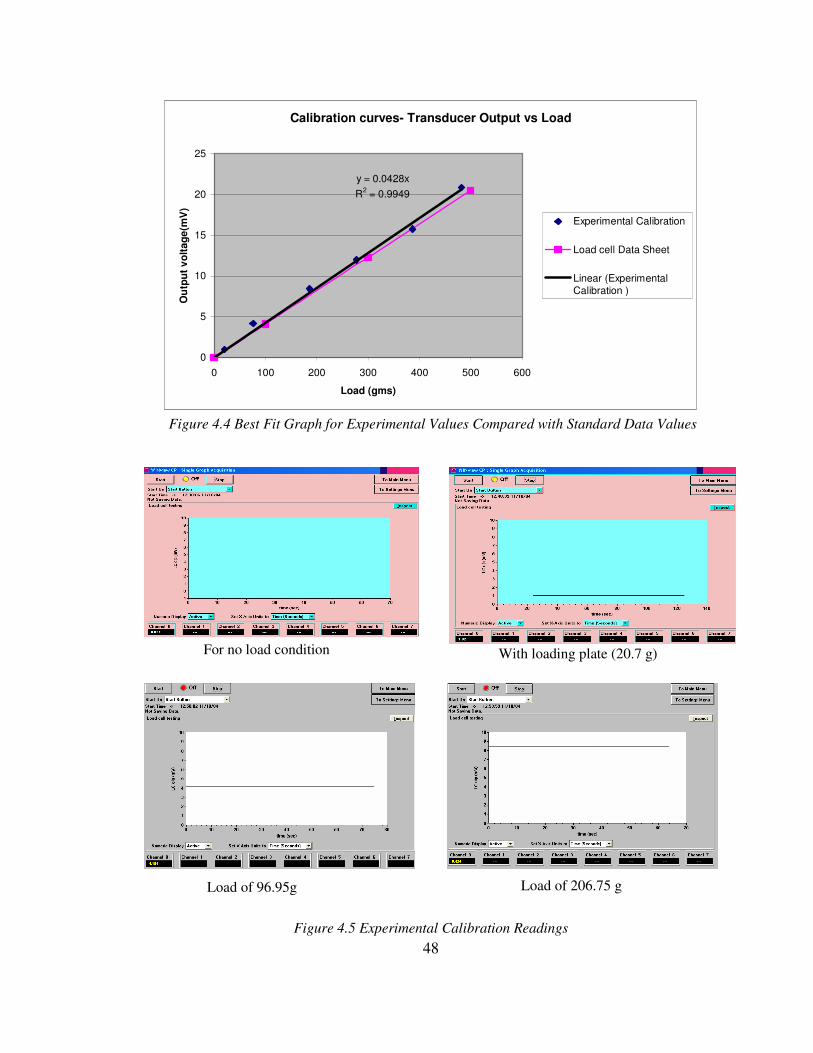
48
Calibration curves- Transducer Output vs Load
y = 0.0428x
R2 = 0.9949
0
5
10
15
20
25
0 100 200 300 400 500 600
Load (gms)
Ou
tpu
t v
olt
ag
e(m
V)
Experimental Calibration
Load cell Data Sheet
Linear (ExperimentalCalibration )
Figure 4.4 Best Fit Graph for Experimental Values Compared with Standard Data Values
Figure 4.5 Experimental Calibration Readings
For no load condition With loading plate (20.7 g)
Load of 96.95g Load of 206.75 g
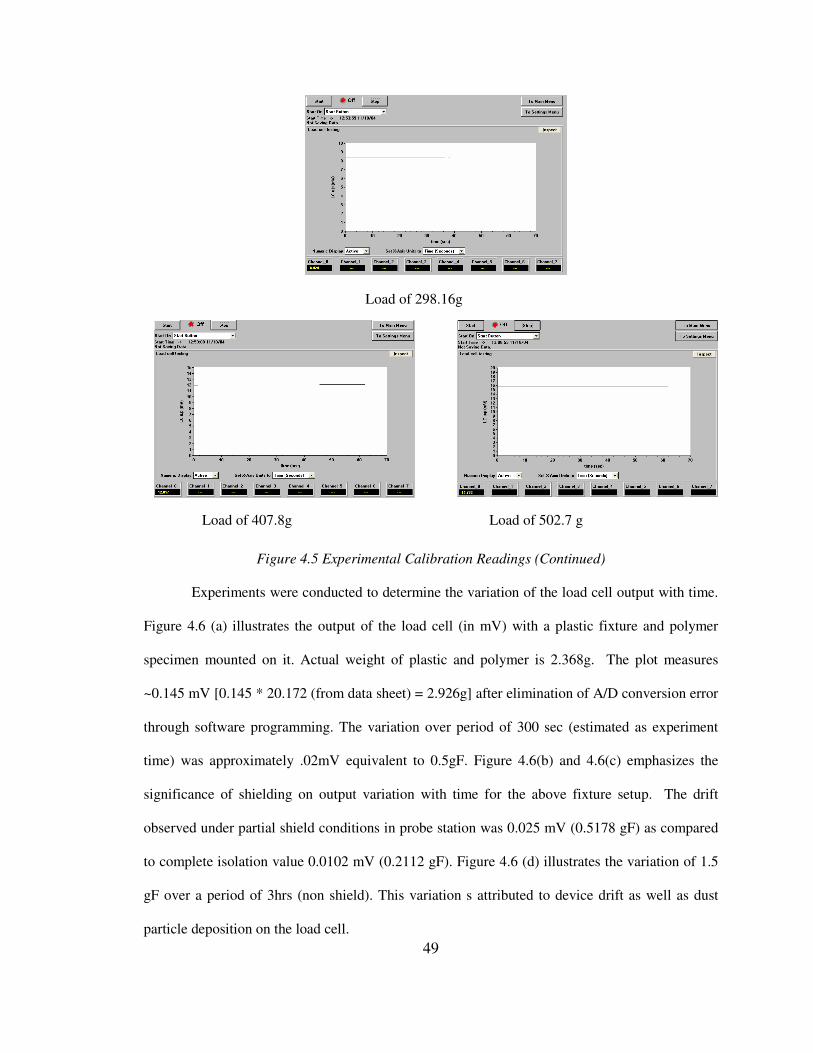
49
Figure 4.5 Experimental Calibration Readings (Continued)
Experiments were conducted to determine the variation of the load cell output with time.
Figure 4.6 (a) illustrates the output of the load cell (in mV) with a plastic fixture and polymer
specimen mounted on it. Actual weight of plastic and polymer is 2.368g. The plot measures
~0.145 mV [0.145 * 20.172 (from data sheet) = 2.926g] after elimination of A/D conversion error
through software programming. The variation over period of 300 sec (estimated as experiment
time) was approximately .02mV equivalent to 0.5gF. Figure 4.6(b) and 4.6(c) emphasizes the
significance of shielding on output variation with time for the above fixture setup. The drift
observed under partial shield conditions in probe station was 0.025 mV (0.5178 gF) as compared
to complete isolation value 0.0102 mV (0.2112 gF). Figure 4.6 (d) illustrates the variation of 1.5
gF over a period of 3hrs (non shield). This variation s attributed to device drift as well as dust
particle deposition on the load cell.
Load of 298.16g
Load of 407.8g Load of 502.7 g
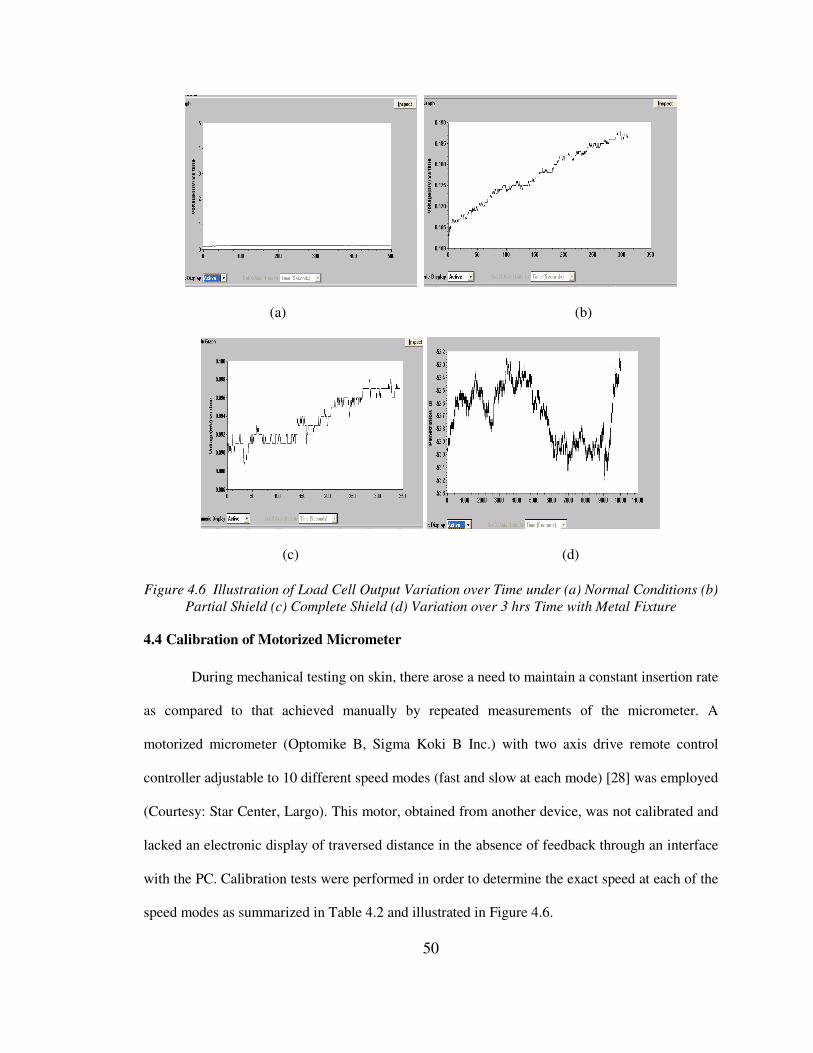
50
(a) (b)
(c) (d)
Figure 4.6 Illustration of Load Cell Output Variation over Time under (a) Normal Conditions (b)
Partial Shield (c) Complete Shield (d) Variation over 3 hrs Time with Metal Fixture
4.4 Calibration of Motorized Micrometer
During mechanical testing on skin, there arose a need to maintain a constant insertion rate
as compared to that achieved manually by repeated measurements of the micrometer. A
motorized micrometer (Optomike B, Sigma Koki B Inc.) with two axis drive remote control
controller adjustable to 10 different speed modes (fast and slow at each mode) [28] was employed
(Courtesy: Star Center, Largo). This motor, obtained from another device, was not calibrated and
lacked an electronic display of traversed distance in the absence of feedback through an interface
with the PC. Calibration tests were performed in order to determine the exact speed at each of the
speed modes as summarized in Table 4.2 and illustrated in Figure 4.6.
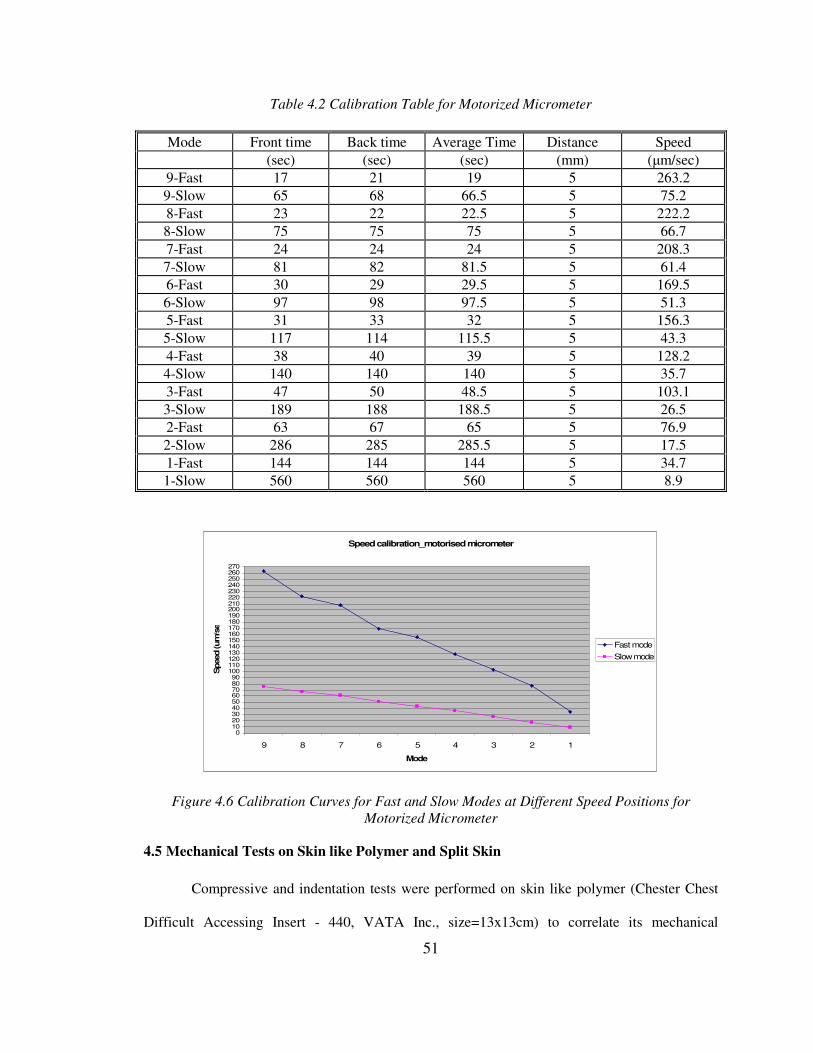
51
Table 4.2 Calibration Table for Motorized Micrometer
Mode Front time Back time Average Time Distance Speed
(sec) (sec) (sec) (mm) (µm/sec)
9-Fast 17 21 19 5 263.2
9-Slow 65 68 66.5 5 75.2
8-Fast 23 22 22.5 5 222.2
8-Slow 75 75 75 5 66.7
7-Fast 24 24 24 5 208.3
7-Slow 81 82 81.5 5 61.4
6-Fast 30 29 29.5 5 169.5
6-Slow 97 98 97.5 5 51.3
5-Fast 31 33 32 5 156.3
5-Slow 117 114 115.5 5 43.3
4-Fast 38 40 39 5 128.2
4-Slow 140 140 140 5 35.7
3-Fast 47 50 48.5 5 103.1
3-Slow 189 188 188.5 5 26.5
2-Fast 63 67 65 5 76.9
2-Slow 286 285 285.5 5 17.5
1-Fast 144 144 144 5 34.7
1-Slow 560 560 560 5 8.9
Speed calibration_motorised micrometer
0102030405060708090
100110120130140150160170180190200210220230240250260270
9 8 7 6 5 4 3 2 1
Mode
Speed (um
/sec)
Fast mode
Slow mode
Figure 4.6 Calibration Curves for Fast and Slow Modes at Different Speed Positions for
Motorized Micrometer
4.5 Mechanical Tests on Skin like Polymer and Split Skin
Compressive and indentation tests were performed on skin like polymer (Chester Chest
Difficult Accessing Insert - 440, VATA Inc., size=13x13cm) to correlate its mechanical
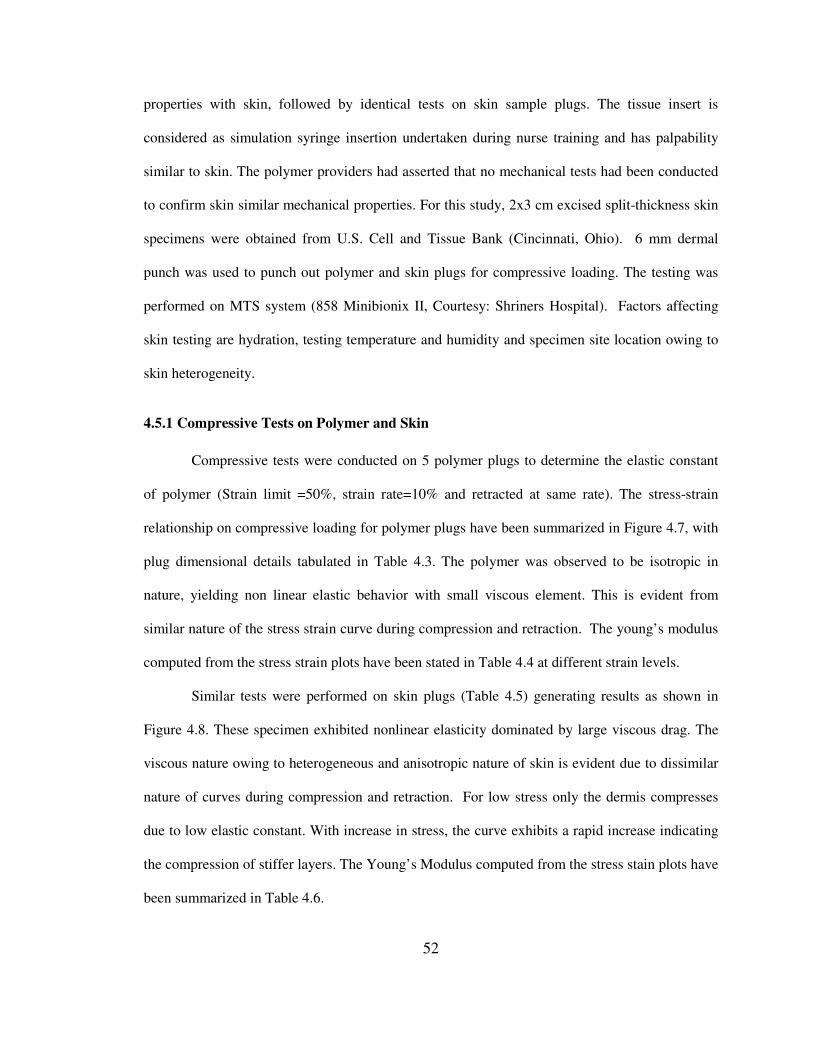
52
properties with skin, followed by identical tests on skin sample plugs. The tissue insert is
considered as simulation syringe insertion undertaken during nurse training and has palpability
similar to skin. The polymer providers had asserted that no mechanical tests had been conducted
to confirm skin similar mechanical properties. For this study, 2x3 cm excised split-thickness skin
specimens were obtained from U.S. Cell and Tissue Bank (Cincinnati, Ohio). 6 mm dermal
punch was used to punch out polymer and skin plugs for compressive loading. The testing was
performed on MTS system (858 Minibionix II, Courtesy: Shriners Hospital). Factors affecting
skin testing are hydration, testing temperature and humidity and specimen site location owing to
skin heterogeneity.
4.5.1 Compressive Tests on Polymer and Skin
Compressive tests were conducted on 5 polymer plugs to determine the elastic constant
of polymer (Strain limit =50%, strain rate=10% and retracted at same rate). The stress-strain
relationship on compressive loading for polymer plugs have been summarized in Figure 4.7, with
plug dimensional details tabulated in Table 4.3. The polymer was observed to be isotropic in
nature, yielding non linear elastic behavior with small viscous element. This is evident from
similar nature of the stress strain curve during compression and retraction. The young’s modulus
computed from the stress strain plots have been stated in Table 4.4 at different strain levels.
Similar tests were performed on skin plugs (Table 4.5) generating results as shown in
Figure 4.8. These specimen exhibited nonlinear elasticity dominated by large viscous drag. The
viscous nature owing to heterogeneous and anisotropic nature of skin is evident due to dissimilar
nature of curves during compression and retraction. For low stress only the dermis compresses
due to low elastic constant. With increase in stress, the curve exhibits a rapid increase indicating
the compression of stiffer layers. The Young’s Modulus computed from the stress stain plots have
been summarized in Table 4.6.
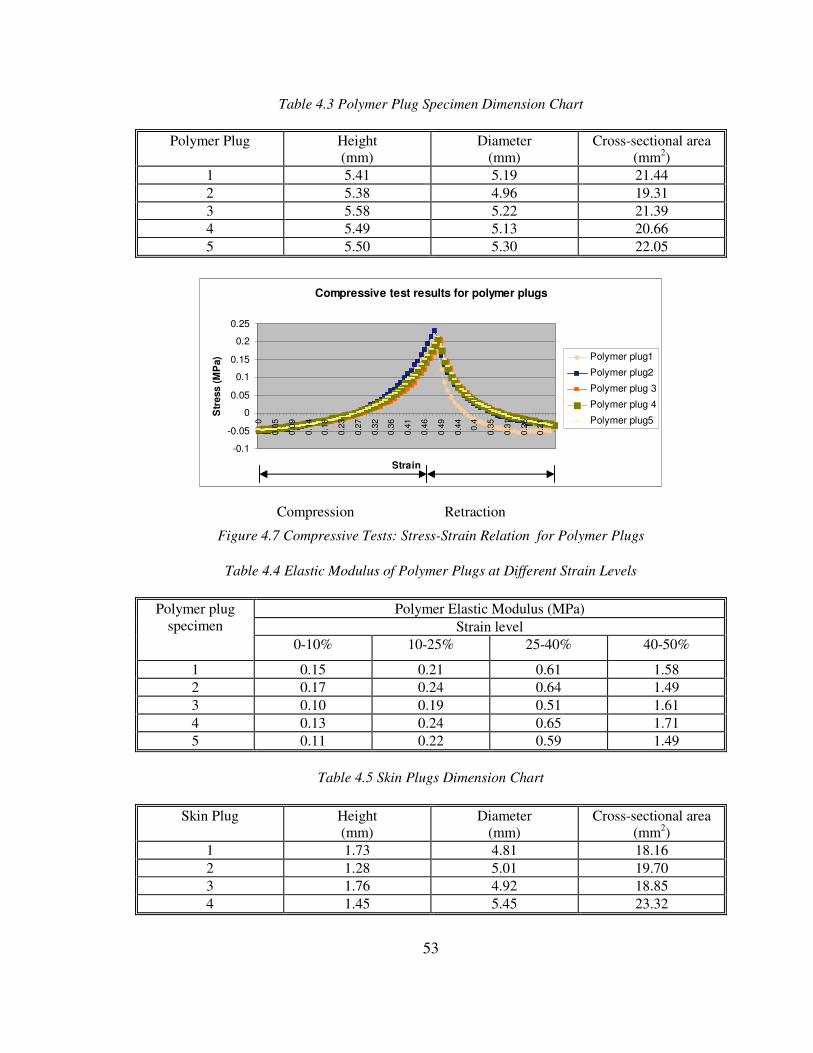
53
Table 4.3 Polymer Plug Specimen Dimension Chart
Polymer Plug Height
(mm)
Diameter
(mm)
Cross-sectional area
(mm2)
1 5.41 5.19 21.44
2 5.38 4.96 19.31
3 5.58 5.22 21.39
4 5.49 5.13 20.66
5 5.50 5.30 22.05
Figure 4.7 Compressive Tests: Stress-Strain Relation for Polymer Plugs
Table 4.4 Elastic Modulus of Polymer Plugs at Different Strain Levels
Polymer Elastic Modulus (MPa)
Strain level
Polymer plug
specimen
0-10% 10-25% 25-40% 40-50%
1 0.15 0.21 0.61 1.58
2 0.17 0.24 0.64 1.49
3 0.10 0.19 0.51 1.61
4 0.13 0.24 0.65 1.71
5 0.11 0.22 0.59 1.49
Table 4.5 Skin Plugs Dimension Chart
Skin Plug Height
(mm)
Diameter
(mm)
Cross-sectional area
(mm2)
1 1.73 4.81 18.16
2 1.28 5.01 19.70
3 1.76 4.92 18.85
4 1.45 5.45 23.32
Compressive test results for polymer plugs
-0.1
-0.05
0
0.05
0.1
0.15
0.2
0.25
0
0.0
5
0.0
9
0.1
4
0.1
8
0.2
3
0.2
7
0.3
2
0.3
6
0.4
1
0.4
6
0.4
9
0.4
4
0.4
0.3
5
0.3
1
0.2
6
0.2
1
Strain
Str
ess (
MP
a) Polymer plug1
Polymer plug2
Polymer plug 3
Polymer plug 4
Polymer plug5
Compression Retraction

54
Skin plug 1- Compressive loading
-0.2
0
0.2
0.4
0.6
0.8
1
1.2
1.4
0
0.0
3
0.0
6
0.0
9
0.1
2
0.1
5
0.1
8
0.2
1
0.2
4
0.2
7
0.3
0.3
3
0.3
6
0.3
9
0.4
2
0.4
5
0.4
8
0.3
4
strain
Str
ess (
MP
a)
Skin plug 2 -compressive loading
-0.1
0
0.1
0.2
0.3
0.4
0.5
0
0.0
3
0.0
6
0.0
9
0.1
2
0.1
5
0.1
8
0.2
1
0.2
4
0.2
7
0.3
0.3
3
0.3
6
0.3
9
0.4
2
0.4
5
0.4
8
0.2
9
Strain
Str
ess (
MP
a)
Skin plug 3-Compressive loading
-0.20
0.20.4
0.60.8
11.2
1.41.6
0
0.05
6492
0.11
4679
0.17
0025
0.22
71631
0.28
45784
0.34
24057
0.39
91125
0.45
42392
0.51
26801
0.56
82767
0.62
50727
0.68
13244
0.61
43977
Strain
Str
ess (
MP
a)
Skin plug 4-Compressive loading
-0.5
0
0.5
1
1.5
2
2.5
0
0.06
98138
0.13
82338
0.20
79138
0.27
57
0.34
48959
0.41
44759
0.48
29248
0.55
20945
0.62
17269
0.68
94497
0.76
0511
0.82
72759
0.74
35814
Strain
Str
ess(M
Pa)
Figure 4.8 Stress-Strain Relation for Skin Plugs on Compressive Loading
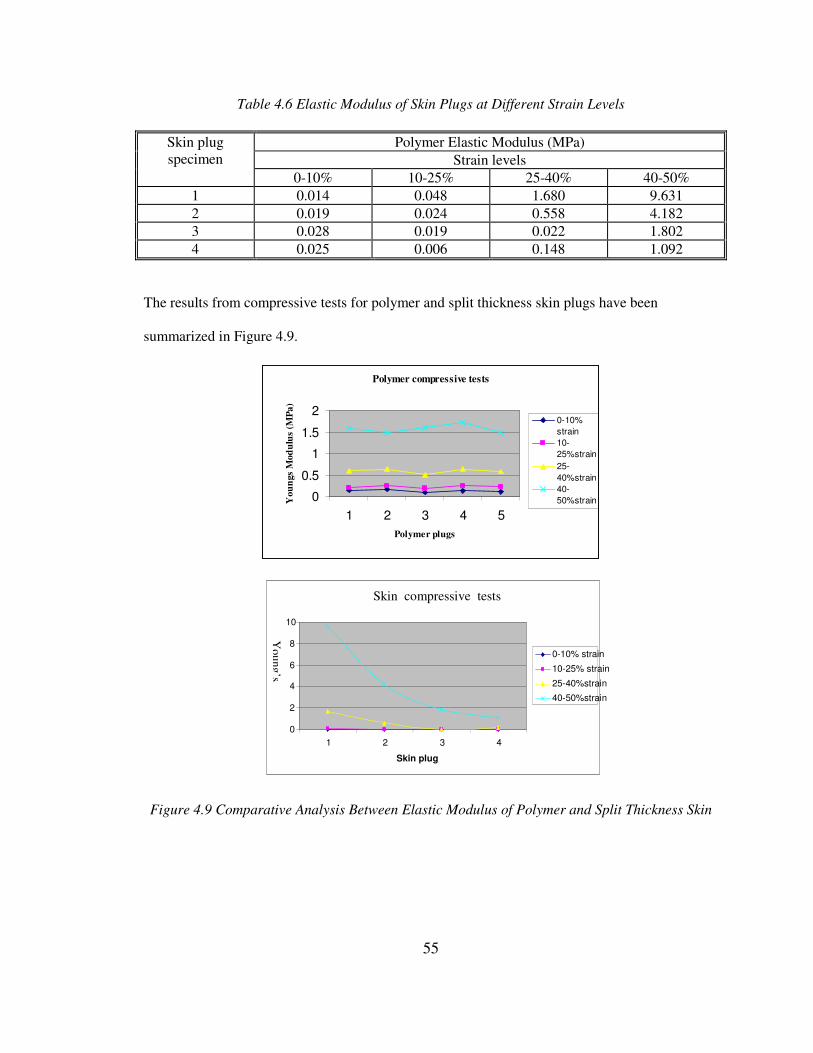
55
Table 4.6 Elastic Modulus of Skin Plugs at Different Strain Levels
Polymer Elastic Modulus (MPa)
Strain levels
Skin plug
specimen
0-10% 10-25% 25-40% 40-50%
1 0.014 0.048 1.680 9.631
2 0.019 0.024 0.558 4.182
3 0.028 0.019 0.022 1.802
4 0.025 0.006 0.148 1.092
The results from compressive tests for polymer and split thickness skin plugs have been
summarized in Figure 4.9.
Polymer compressive tests
0
0.5
1
1.5
2
1 2 3 4 5
Polymer plugs
Yo
un
gs
Mod
ulu
s (M
Pa
)
0-10%
strain
10-
25%strain
25-
40%strain
40-
50%strain
Figure 4.9 Comparative Analysis Between Elastic Modulus of Polymer and Split Thickness Skin
Skin compressive tests
0
2
4
6
8
10
1 2 3 4 Skin plug
0-10% strain 10-25% strain 25-40%strain 40-50%strain
Yo
ung
’s
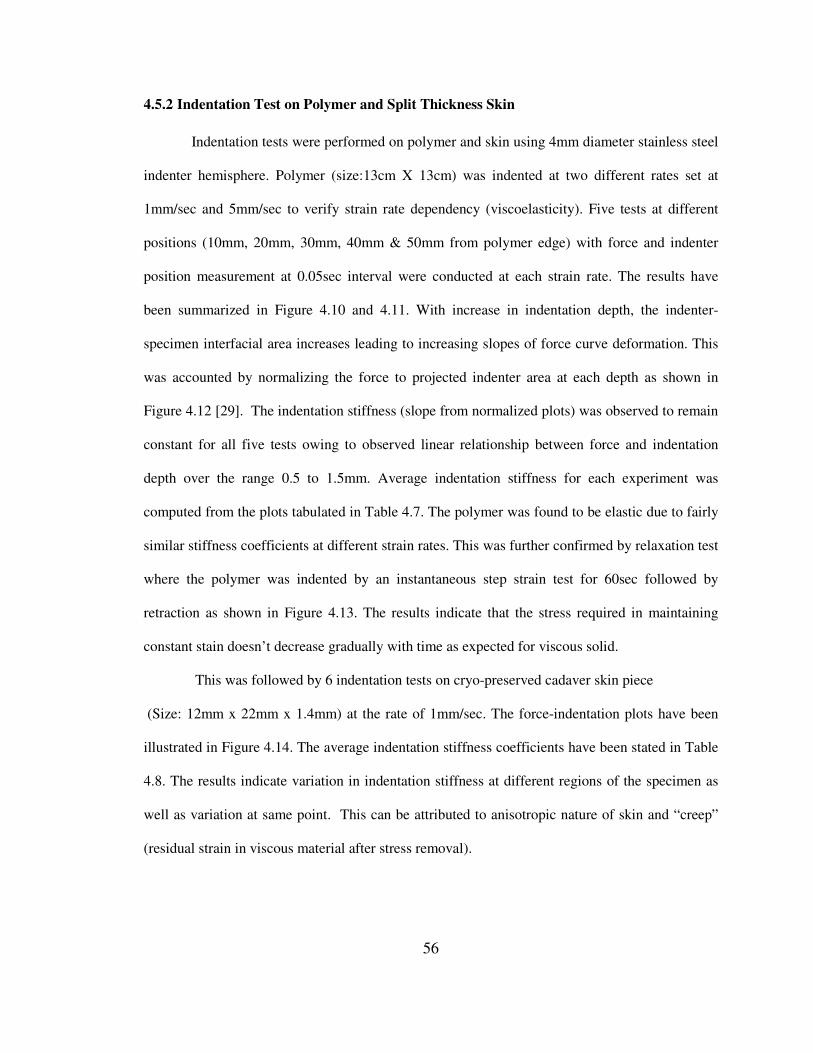
56
4.5.2 Indentation Test on Polymer and Split Thickness Skin
Indentation tests were performed on polymer and skin using 4mm diameter stainless steel
indenter hemisphere. Polymer (size:13cm X 13cm) was indented at two different rates set at
1mm/sec and 5mm/sec to verify strain rate dependency (viscoelasticity). Five tests at different
positions (10mm, 20mm, 30mm, 40mm & 50mm from polymer edge) with force and indenter
position measurement at 0.05sec interval were conducted at each strain rate. The results have
been summarized in Figure 4.10 and 4.11. With increase in indentation depth, the indenter-
specimen interfacial area increases leading to increasing slopes of force curve deformation. This
was accounted by normalizing the force to projected indenter area at each depth as shown in
Figure 4.12 [29]. The indentation stiffness (slope from normalized plots) was observed to remain
constant for all five tests owing to observed linear relationship between force and indentation
depth over the range 0.5 to 1.5mm. Average indentation stiffness for each experiment was
computed from the plots tabulated in Table 4.7. The polymer was found to be elastic due to fairly
similar stiffness coefficients at different strain rates. This was further confirmed by relaxation test
where the polymer was indented by an instantaneous step strain test for 60sec followed by
retraction as shown in Figure 4.13. The results indicate that the stress required in maintaining
constant stain doesn’t decrease gradually with time as expected for viscous solid.
This was followed by 6 indentation tests on cryo-preserved cadaver skin piece
(Size: 12mm x 22mm x 1.4mm) at the rate of 1mm/sec. The force-indentation plots have been
illustrated in Figure 4.14. The average indentation stiffness coefficients have been stated in Table
4.8. The results indicate variation in indentation stiffness at different regions of the specimen as
well as variation at same point. This can be attributed to anisotropic nature of skin and “creep”
(residual strain in viscous material after stress removal).
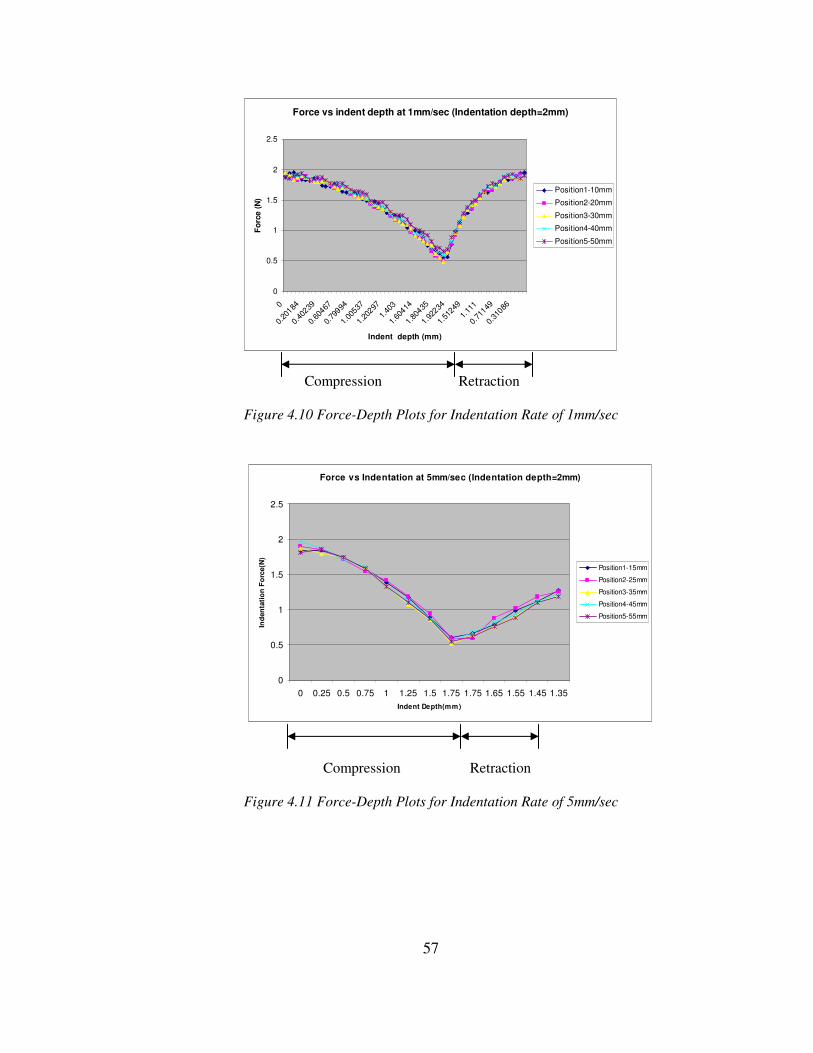
57
Force vs indent depth at 1mm/sec (Indentation depth=2mm)
0
0.5
1
1.5
2
2.5
0
0.20
184
0.40
239
0.60
467
0.79
994
1.00
537
1.20
297
1.40
3
1.60
414
1.80
435
1.92
234
1.51
249
1.11
1
0.71
149
0.31
086
Indent depth (mm)
Fo
rce (
N)
Position1-10mm
Position2-20mm
Position3-30mm
Position4-40mm
Position5-50mm
Compression Retraction
Figure 4.10 Force-Depth Plots for Indentation Rate of 1mm/sec
Compression Retraction
Figure 4.11 Force-Depth Plots for Indentation Rate of 5mm/sec
Force vs Indentation at 5mm/sec (Indentation depth=2mm)
0
0.5
1
1.5
2
2.5
0 0.25 0.5 0.75 1 1.25 1.5 1.75 1.75 1.65 1.55 1.45 1.35
Indent Depth(mm)
Ind
en
tati
on
Fo
rce(N
)
Position1-15mm
Position2-25mm
Position3-35mm
Position4-45mm
Position5-55mm

58
Normalised force vs depth (indentation at 1mm/sec)
0
0.05
0.1
0.15
0.2
0.25
0.3
0.35
0.5
0.5
5
0.6
0.6
5
0.7
0.7
5
0.8
0.8
5
0.9
0.9
5
1.0
1
1.0
5
1.1
1.1
5
1.2
1.2
5
1.3
1.3
5
1.4
1.4
5
1.5
Indentation depth (mm)
No
rma
lis
ed
Fo
rce
(M
pa
)
Position1-10mm
Indentation
stiffnes=0.2064 Mpa
per mm
Increasing depth
Figure 4.12 Force Normalization for Stiffness Calculation at Position 1-10mm
Table 4.7 Indentation Stiffness at 1mm/sec and 5mm/sec Indentation Rates
Indentation rate =5mm/sec
Test Position-
Edge distance
Slope
(indent depth=0.5-1.5mm)
Position1-15mm 0.232
Position 2-25mm 0.224
Position3-35mm 0.238
Position4-45mm 0.233
Position 5-55mm 0.235
Average 0.232
Indentation rate =1mm/sec
Test Position-
Edge Distance
Slope
(indent depth=0.5-1.5mm)
Position1-10mm 0.206
Position 2-20mm 0.210
Position3-30mm 0.214
Position4-40mm 0.212
Position 5-50mm 0.210
Average 0.210
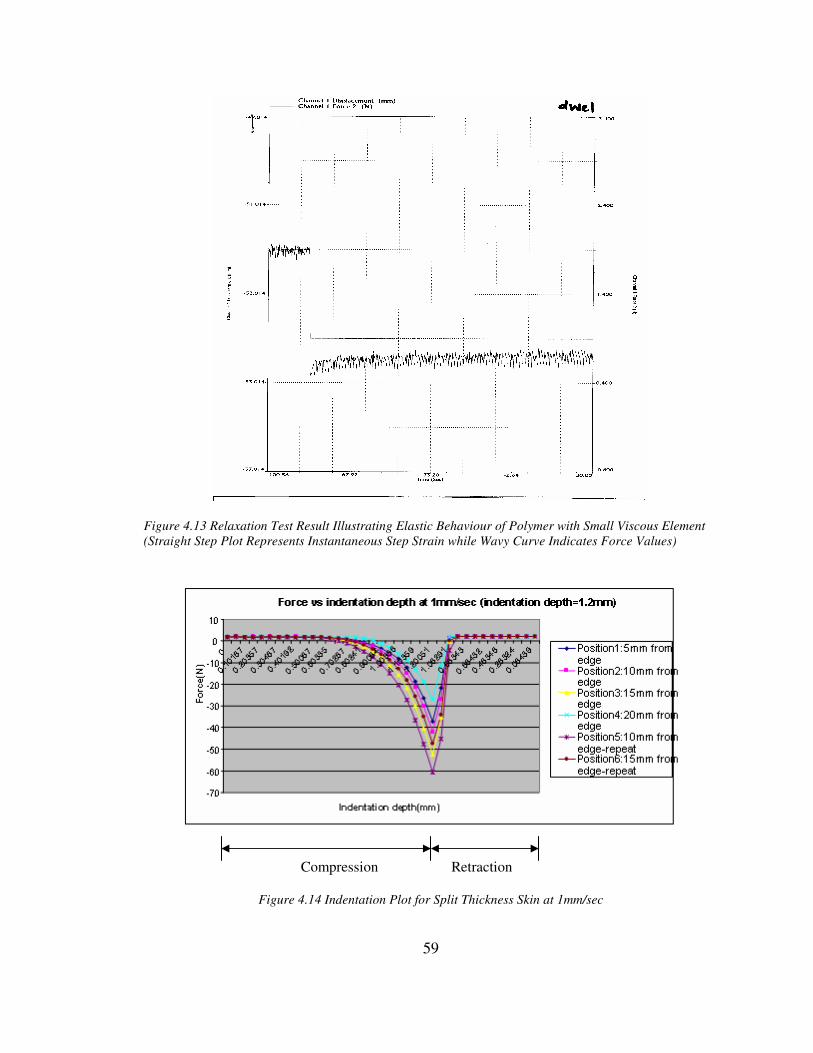
59
Figure 4.13 Relaxation Test Result Illustrating Elastic Behaviour of Polymer with Small Viscous Element
(Straight Step Plot Represents Instantaneous Step Strain while Wavy Curve Indicates Force Values)
Compression Retraction
Figure 4.14 Indentation Plot for Split Thickness Skin at 1mm/sec
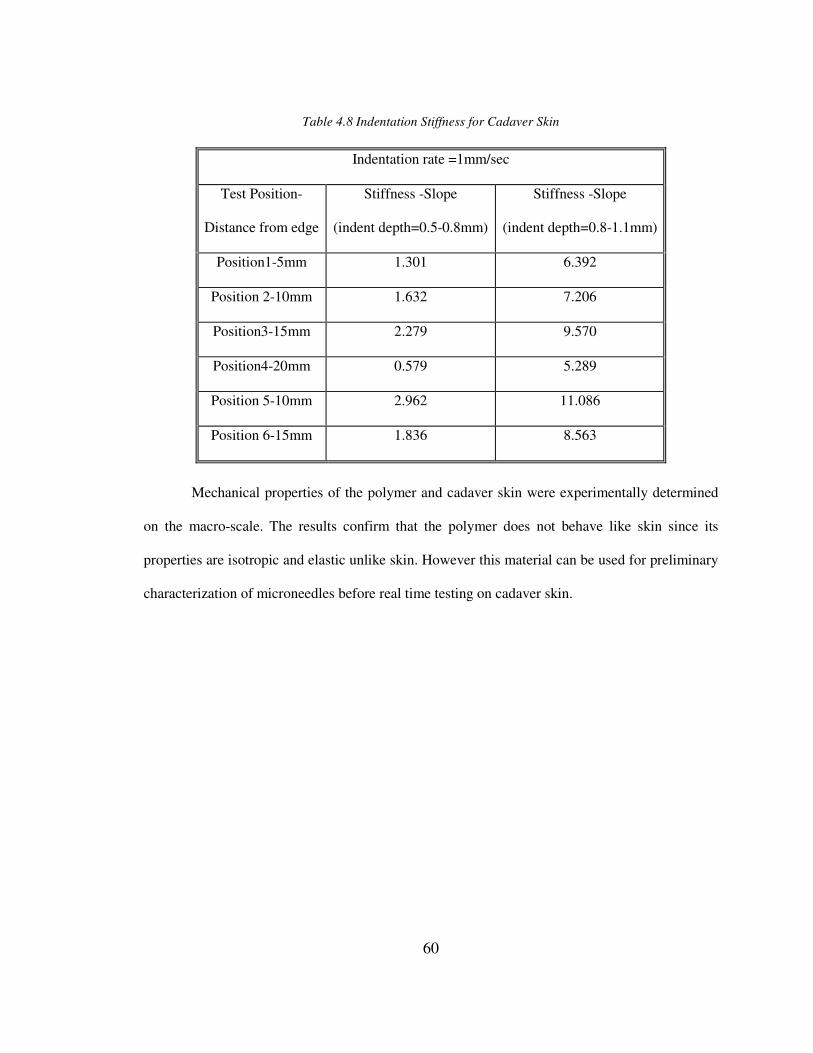
60
Table 4.8 Indentation Stiffness for Cadaver Skin
Mechanical properties of the polymer and cadaver skin were experimentally determined
on the macro-scale. The results confirm that the polymer does not behave like skin since its
properties are isotropic and elastic unlike skin. However this material can be used for preliminary
characterization of microneedles before real time testing on cadaver skin.
Indentation rate =1mm/sec
Test Position-
Distance from edge
Stiffness -Slope
(indent depth=0.5-0.8mm)
Stiffness -Slope
(indent depth=0.8-1.1mm)
Position1-5mm 1.301 6.392
Position 2-10mm 1.632 7.206
Position3-15mm 2.279 9.570
Position4-20mm 0.579 5.289
Position 5-10mm 2.962 11.086
Position 6-15mm 1.836 8.563
61
CHAPTER 5 FRACTURE AND PENETRATION TESTING
This chapter discusses experimental fracture force measurement and detailed failure
analysis for fabricated SiO2 microneedles. Preliminary test results utilizing skin like polymer to
validate the ability of the microneedles to penetrate skin have been presented. The chapter also
elaborates on real time insertion tests on split thickness skin and isolated stratum corneum using
both manual and motorized micrometer at constant rate, quantifying the penetration force.
5.1 Measurement of Fracture Force
5.1.1 Experimental Plan
In plane fracture tests were performed on 1 × 1 array to observe the effect of needle
geometry (shape, width and height) on fracture force. The axial force required to fracture silicon
dioxide needle column was experimentally measured by compressing the chip (mounted using
double sided sticky tape) at rate of 1µm/sec against the load cell mounting screw. The point of
fracture was visually captured by the camera (change in intensity) with the data acquisition
system displaying a sharp peak in force-time graph, interpreted as “needle failure point”. Once
this peak was achieved, the needles were retracted at the same rate. The microneedle parametric
dimensional variation has been tabulated in Table 5.1. Since it was difficult to fabricate and view
single needle, 5x5 microneedle array chips were manipulated with probe tips to obtain chips with
1- 3 needles.
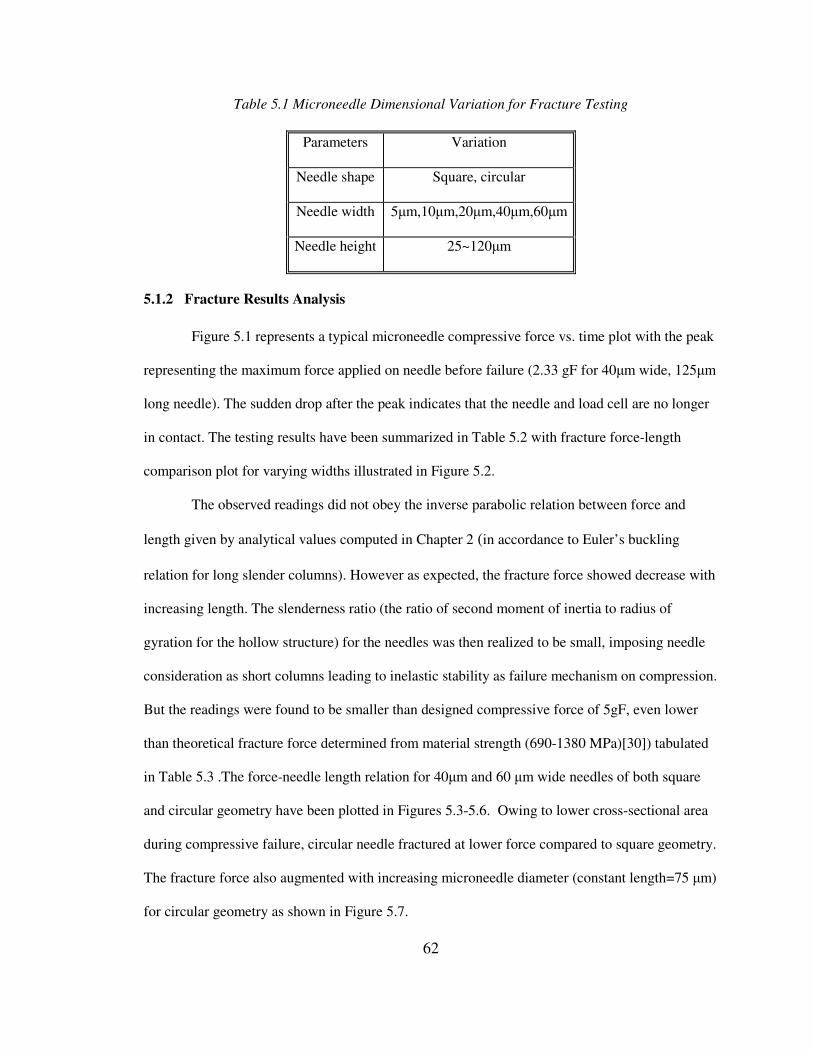
62
Table 5.1 Microneedle Dimensional Variation for Fracture Testing
Parameters Variation
Needle shape Square, circular
Needle width 5µm,10µm,20µm,40µm,60µm
Needle height 25~120µm
5.1.2 Fracture Results Analysis
Figure 5.1 represents a typical microneedle compressive force vs. time plot with the peak
representing the maximum force applied on needle before failure (2.33 gF for 40µm wide, 125µm
long needle). The sudden drop after the peak indicates that the needle and load cell are no longer
in contact. The testing results have been summarized in Table 5.2 with fracture force-length
comparison plot for varying widths illustrated in Figure 5.2.
The observed readings did not obey the inverse parabolic relation between force and
length given by analytical values computed in Chapter 2 (in accordance to Euler’s buckling
relation for long slender columns). However as expected, the fracture force showed decrease with
increasing length. The slenderness ratio (the ratio of second moment of inertia to radius of
gyration for the hollow structure) for the needles was then realized to be small, imposing needle
consideration as short columns leading to inelastic stability as failure mechanism on compression.
But the readings were found to be smaller than designed compressive force of 5gF, even lower
than theoretical fracture force determined from material strength (690-1380 MPa)[30]) tabulated
in Table 5.3 .The force-needle length relation for 40µm and 60 µm wide needles of both square
and circular geometry have been plotted in Figures 5.3-5.6. Owing to lower cross-sectional area
during compressive failure, circular needle fractured at lower force compared to square geometry.
The fracture force also augmented with increasing microneedle diameter (constant length=75 µm)
for circular geometry as shown in Figure 5.7.
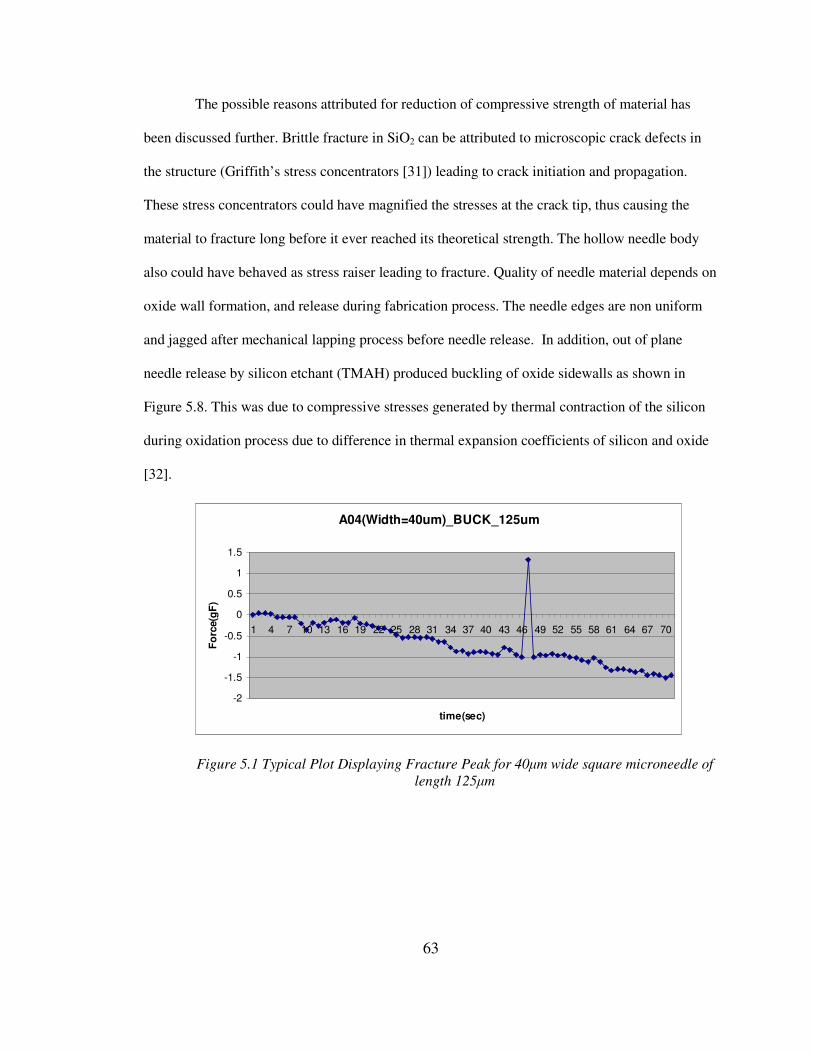
63
The possible reasons attributed for reduction of compressive strength of material has
been discussed further. Brittle fracture in SiO2 can be attributed to microscopic crack defects in
the structure (Griffith’s stress concentrators [31]) leading to crack initiation and propagation.
These stress concentrators could have magnified the stresses at the crack tip, thus causing the
material to fracture long before it ever reached its theoretical strength. The hollow needle body
also could have behaved as stress raiser leading to fracture. Quality of needle material depends on
oxide wall formation, and release during fabrication process. The needle edges are non uniform
and jagged after mechanical lapping process before needle release. In addition, out of plane
needle release by silicon etchant (TMAH) produced buckling of oxide sidewalls as shown in
Figure 5.8. This was due to compressive stresses generated by thermal contraction of the silicon
during oxidation process due to difference in thermal expansion coefficients of silicon and oxide
[32].
A04(Width=40um)_BUCK_125um
-2
-1.5
-1
-0.5
0
0.5
1
1.5
1 4 7 10 13 16 19 22 25 28 31 34 37 40 43 46 49 52 55 58 61 64 67 70
time(sec)
Fo
rce(g
F)
Figure 5.1 Typical Plot Displaying Fracture Peak for 40µm wide square microneedle of
length 125µm
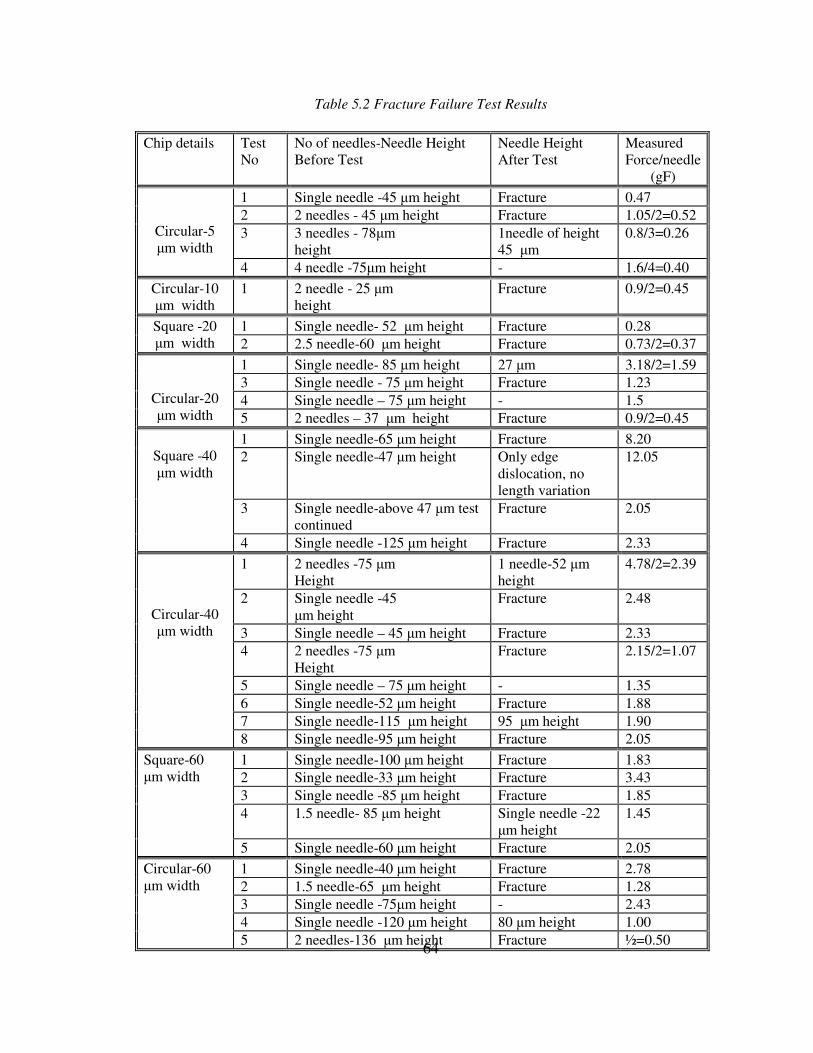
64
Table 5.2 Fracture Failure Test Results
Chip details Test
No
No of needles-Needle Height
Before Test
Needle Height
After Test
Measured
Force/needle
(gF)
1 Single needle -45 µm height Fracture 0.47
2 2 needles - 45 µm height Fracture 1.05/2=0.52
3 3 needles - 78µm
height
1needle of height
45 µm
0.8/3=0.26
Circular-5
µm width
4 4 needle -75µm height - 1.6/4=0.40
Circular-10
µm width
1 2 needle - 25 µm
height
Fracture 0.9/2=0.45
1 Single needle- 52 µm height Fracture 0.28 Square -20
µm width 2 2.5 needle-60 µm height Fracture 0.73/2=0.37
1 Single needle- 85 µm height 27 µm 3.18/2=1.59
3 Single needle - 75 µm height Fracture 1.23
4 Single needle – 75 µm height - 1.5
Circular-20
µm width 5 2 needles – 37 µm height Fracture 0.9/2=0.45
1 Single needle-65 µm height Fracture 8.20
2 Single needle-47 µm height Only edge
dislocation, no
length variation
12.05
3 Single needle-above 47 µm test
continued
Fracture 2.05
Square -40
µm width
4 Single needle -125 µm height Fracture 2.33
1 2 needles -75 µm
Height
1 needle-52 µm
height
4.78/2=2.39
2 Single needle -45
µm height
Fracture 2.48
3 Single needle – 45 µm height Fracture 2.33
4 2 needles -75 µm
Height
Fracture 2.15/2=1.07
5 Single needle – 75 µm height - 1.35
6 Single needle-52 µm height Fracture 1.88
7 Single needle-115 µm height 95 µm height 1.90
Circular-40
µm width
8 Single needle-95 µm height Fracture 2.05
1 Single needle-100 µm height Fracture 1.83
2 Single needle-33 µm height Fracture 3.43
3 Single needle -85 µm height Fracture 1.85
4 1.5 needle- 85 µm height Single needle -22
µm height
1.45
Square-60
µm width
5 Single needle-60 µm height Fracture 2.05
1 Single needle-40 µm height Fracture 2.78
2 1.5 needle-65 µm height Fracture 1.28
3 Single needle -75µm height - 2.43
4 Single needle -120 µm height 80 µm height 1.00
Circular-60
µm width
5 2 needles-136 µm height Fracture ½=0.50
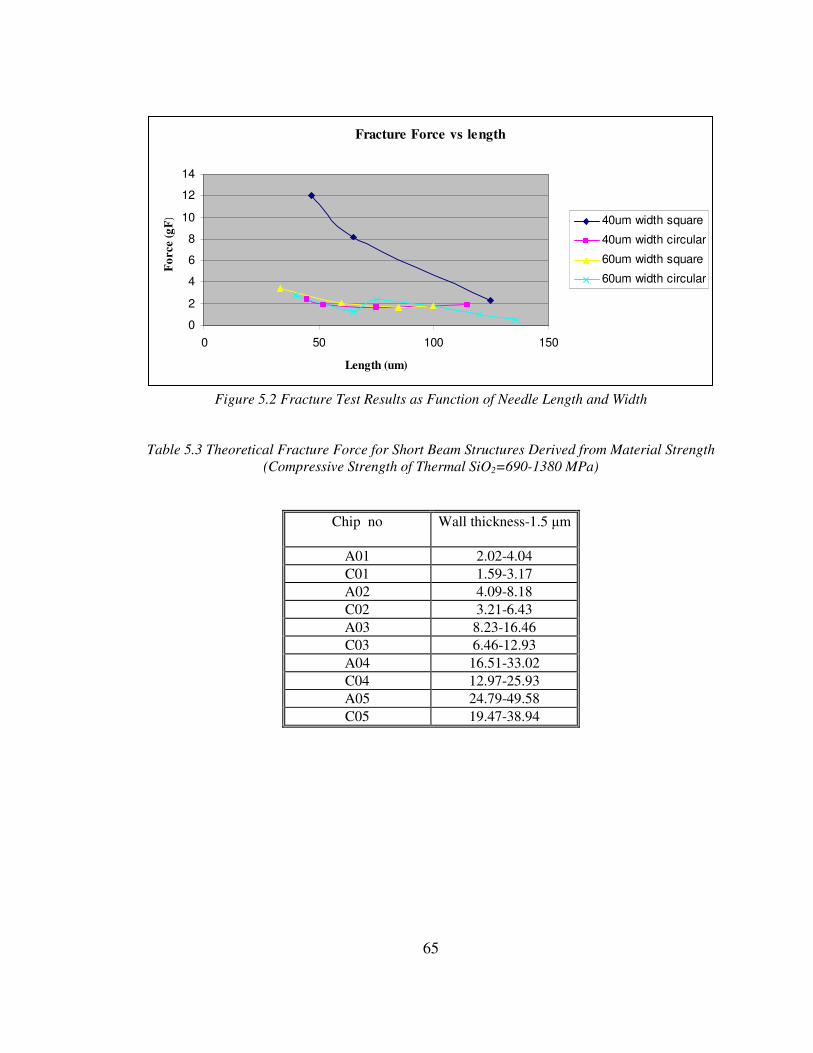
65
Fracture Force vs length
0
2
4
6
8
10
12
14
0 50 100 150
Length (um)
Fo
rce (
gF
) 40um width square
40um width circular
60um width square
60um width circular
Figure 5.2 Fracture Test Results as Function of Needle Length and Width
Table 5.3 Theoretical Fracture Force for Short Beam Structures Derived from Material Strength
(Compressive Strength of Thermal SiO2=690-1380 MPa)
Chip no Wall thickness-1.5 µm
A01 2.02-4.04
C01 1.59-3.17
A02 4.09-8.18
C02 3.21-6.43
A03 8.23-16.46
C03 6.46-12.93
A04 16.51-33.02
C04 12.97-25.93
A05 24.79-49.58
C05 19.47-38.94
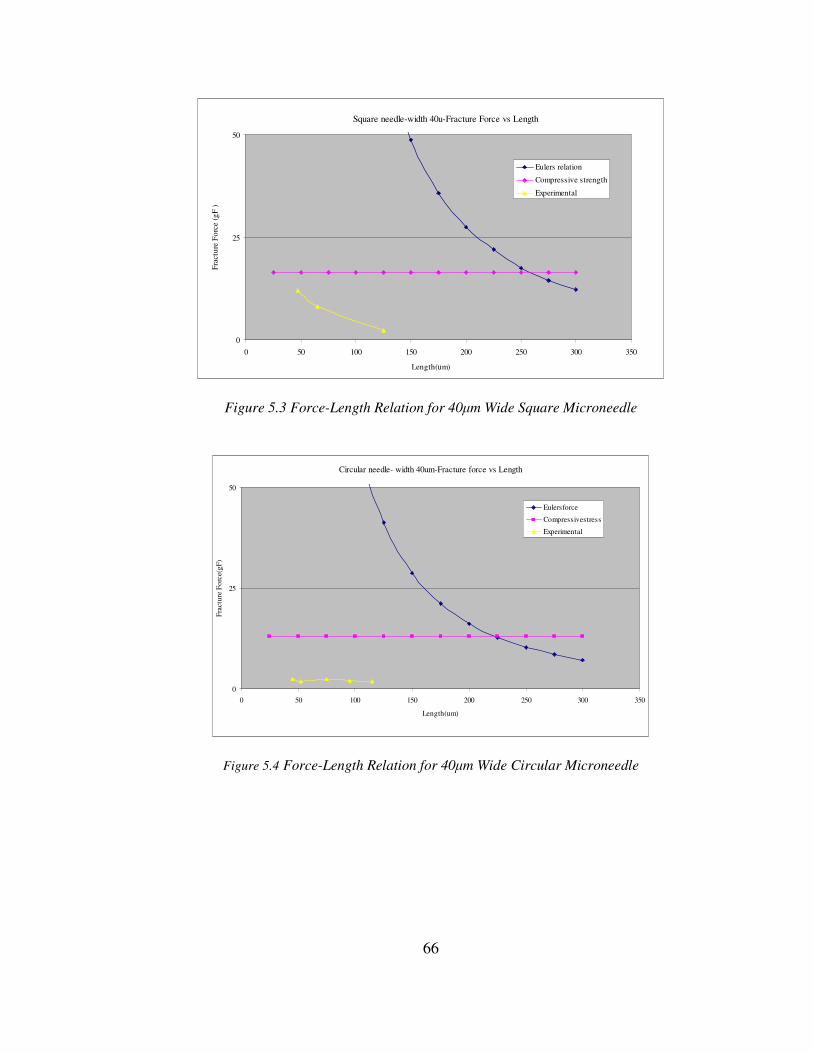
66
Square needle-width 40u-Fracture Force vs Length
0
25
50
0 50 100 150 200 250 300 350
Length(um)
Fra
ctu
re F
orc
e (
gF
)
Eulers relation
Compressive strength
Experimental
Figure 5.3 Force-Length Relation for 40µm Wide Square Microneedle
Circular needle- width 40um-Fracture force vs Length
0
25
50
0 50 100 150 200 250 300 350
Length(um)
Fra
ctu
re F
orc
e(g
F)
Eulersforce
Compressivestress
Experimental
Figure 5.4 Force-Length Relation for 40µm Wide Circular Microneedle
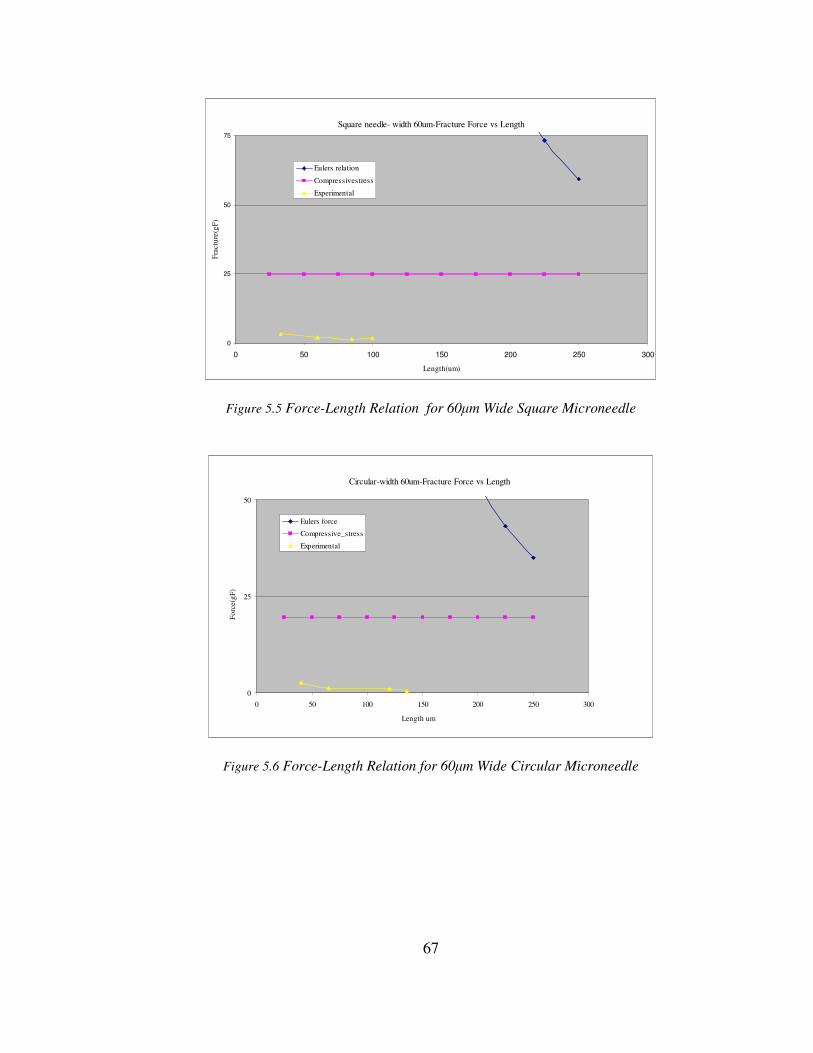
67
Square needle- width 60um-Fracture Force vs Length
0
25
50
75
0 50 100 150 200 250 300
Length(um)
Fra
ctu
re(g
F)
Eulers relation
Compressivestress
Experimental
Figure 5.5 Force-Length Relation for 60µm Wide Square Microneedle
Circular-width 60um-Fracture Force vs Length
0
25
50
0 50 100 150 200 250 300
Length um
Fo
rce(g
F)
Eulers force
Compressive_stress
Experimental
Figure 5.6 Force-Length Relation for 60µm Wide Circular Microneedle

68
Fracture Force vs width (Length=75)
0
0.5
1
1.5
2
2.5
3
0 10 20 30 40 50 60 70
Width(um)
Fo
rce(g
F)
Figure 5.7 Fracture Force vs. Width (Length=constant) for Circular Geometry
Figure 5.8 Wall Buckling after TMAH Etch (10x-Optical Microscope)
5.2 Insertion Tests on Skin like Polymer
Characterized soft polymer (size: 1cmx1cm) was used for preliminary microneedle
insertion testing. The polymer was mounted on the skin holding fixture using double sided sticky
tape. The block holding the microneedle chip was forced into the polymer specimen using manual
micrometer translation (approximate insertion rate of 10µm/sec). Figure 5.9 illustrates the intact
condition of one of the tested 5x5 microneedle array (width 40µm, pitch 150µm and length 75µm)
indicating sturdiness after the insertion test. The needle shaft showed traces of polymer
confirming penetration and not surface indentation. This was further validated by Energy
Dispersive X-ray Spectrum (EDAX) measurement which indicated presence of polymer
constituents.
Buckled edges for 40 µm square
needles

69
Penetration force plot for this array has been illustrated in Figure 5.10 displaying a
discontinuity peak at approximately 0.2gF, however due to lack of automation software for data
acquisition system and motorized micrometer it was difficult to mark this value as penetration
force. However it was difficult to observe any cut marks on the polymer surface. Further testing
with needle arrays reproduced similar results making quantification difficult. Later the
automation software was purchased and data points could then saved and exported into Microsoft
Excel. Figure 5.11 illustrates the penetration plot for a 25x25 array (width=60µm, pitch=150µm,
length=75µm) with 0.8Gf force. However this value could be a rough estimate since the polymer
is isotropic in mechanical properties.
Figure 5.9 Illustrating the Condition of 5x5 Microneedle Array (Width 40µm, Pitch 150µm and
Length 75µm) Before and After Needle Insertion. Needles show Polymer Trace in the Needle
Lumen after insertion
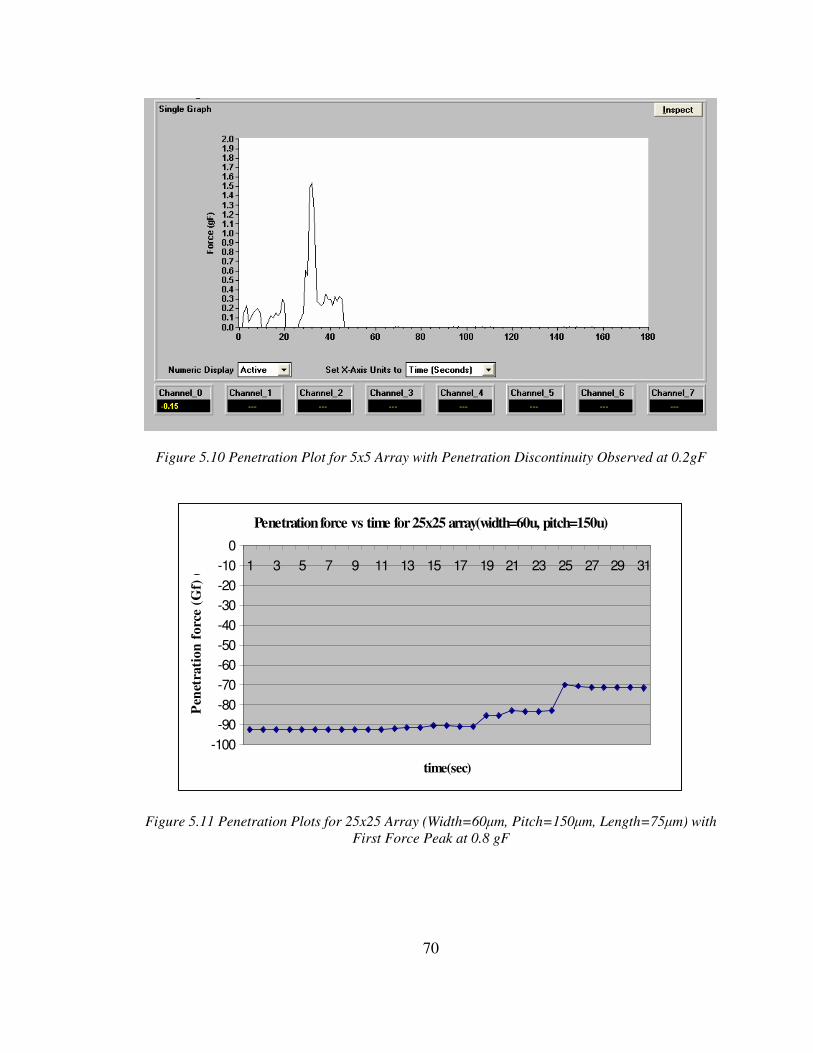
70
Figure 5.10 Penetration Plot for 5x5 Array with Penetration Discontinuity Observed at 0.2gF
Penetration force vs time for 25x25 array(width=60u, pitch=150u)
-100
-90
-80
-70
-60
-50
-40
-30
-20
-10
0
1 3 5 7 9 11 13 15 17 19 21 23 25 27 29 31
time(sec)
Pen
etra
tio
n f
orc
e (G
f) (
gF
)
Figure 5.11 Penetration Plots for 25x25 Array (Width=60µm, Pitch=150µm, Length=75µm) with
First Force Peak at 0.8 gF
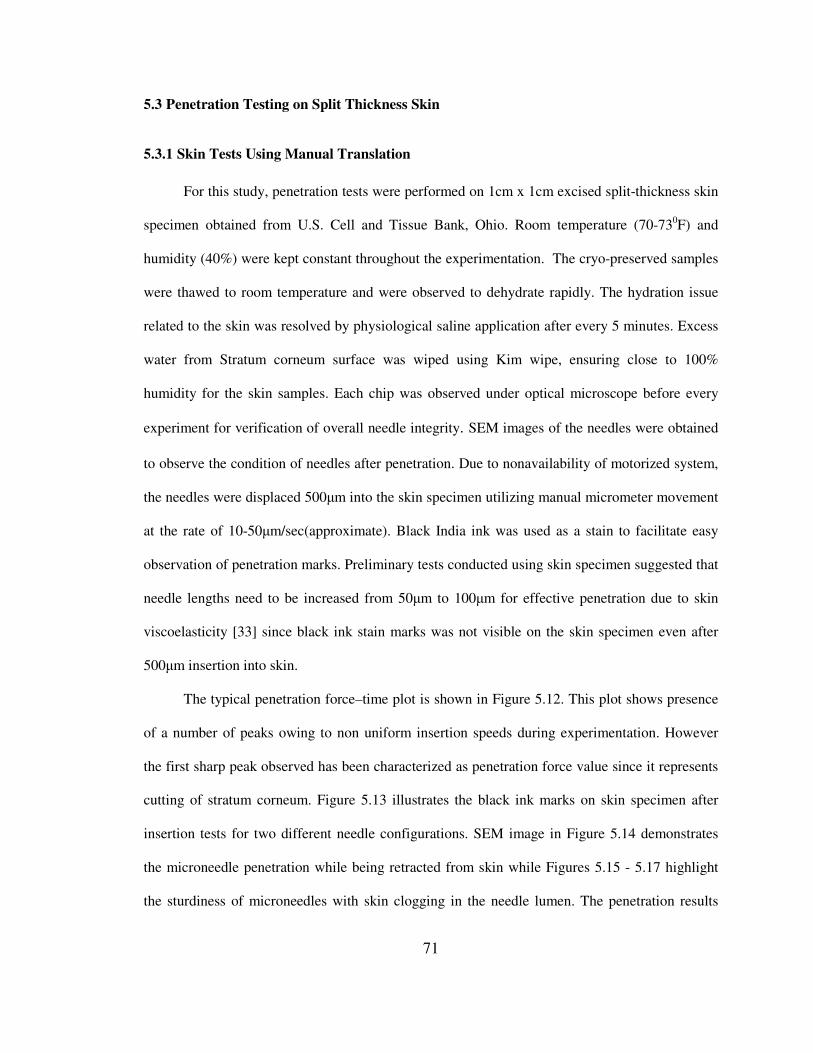
71
5.3 Penetration Testing on Split Thickness Skin
5.3.1 Skin Tests Using Manual Translation
For this study, penetration tests were performed on 1cm x 1cm excised split-thickness skin
specimen obtained from U.S. Cell and Tissue Bank, Ohio. Room temperature (70-730F) and
humidity (40%) were kept constant throughout the experimentation. The cryo-preserved samples
were thawed to room temperature and were observed to dehydrate rapidly. The hydration issue
related to the skin was resolved by physiological saline application after every 5 minutes. Excess
water from Stratum corneum surface was wiped using Kim wipe, ensuring close to 100%
humidity for the skin samples. Each chip was observed under optical microscope before every
experiment for verification of overall needle integrity. SEM images of the needles were obtained
to observe the condition of needles after penetration. Due to nonavailability of motorized system,
the needles were displaced 500µm into the skin specimen utilizing manual micrometer movement
at the rate of 10-50µm/sec(approximate). Black India ink was used as a stain to facilitate easy
observation of penetration marks. Preliminary tests conducted using skin specimen suggested that
needle lengths need to be increased from 50µm to 100µm for effective penetration due to skin
viscoelasticity [33] since black ink stain marks was not visible on the skin specimen even after
500µm insertion into skin.
The typical penetration force–time plot is shown in Figure 5.12. This plot shows presence
of a number of peaks owing to non uniform insertion speeds during experimentation. However
the first sharp peak observed has been characterized as penetration force value since it represents
cutting of stratum corneum. Figure 5.13 illustrates the black ink marks on skin specimen after
insertion tests for two different needle configurations. SEM image in Figure 5.14 demonstrates
the microneedle penetration while being retracted from skin while Figures 5.15 - 5.17 highlight
the sturdiness of microneedles with skin clogging in the needle lumen. The penetration results
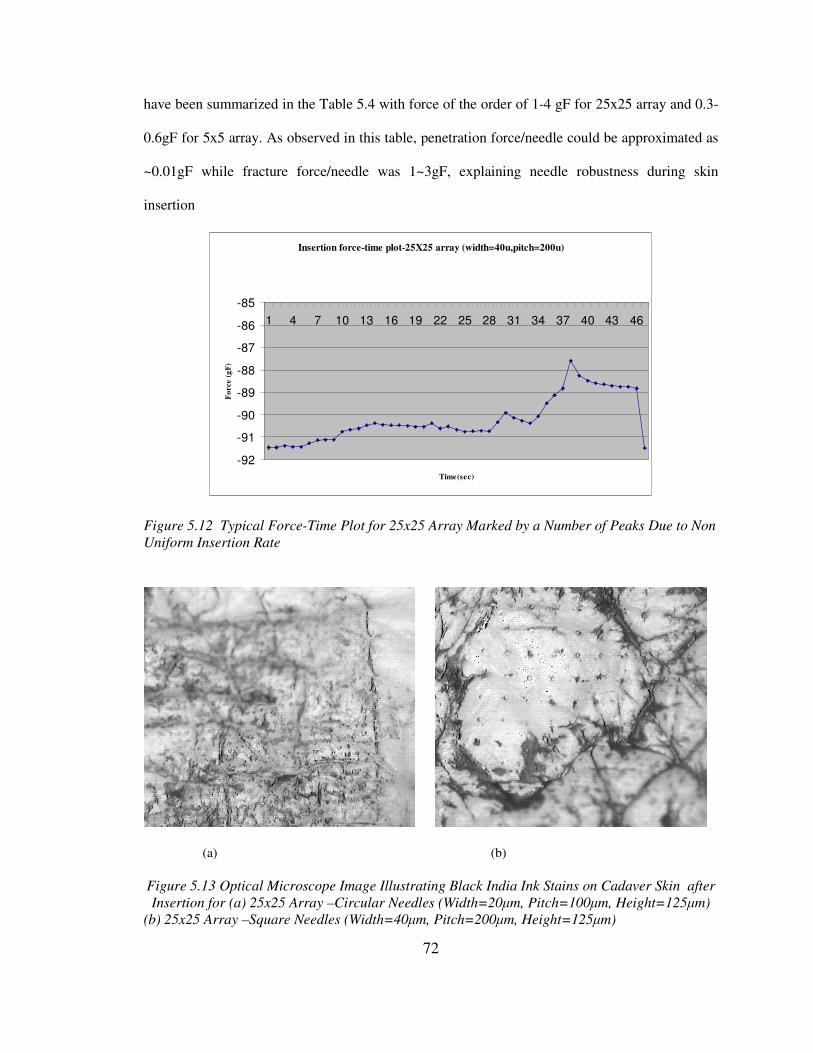
72
have been summarized in the Table 5.4 with force of the order of 1-4 gF for 25x25 array and 0.3-
0.6gF for 5x5 array. As observed in this table, penetration force/needle could be approximated as
~0.01gF while fracture force/needle was 1~3gF, explaining needle robustness during skin
insertion
Insertion force-time plot-25X25 array (width=40u,pitch=200u)
-92
-91
-90
-89
-88
-87
-86
-85
1 4 7 10 13 16 19 22 25 28 31 34 37 40 43 46
Time(sec)
Fo
rce (
gF
)
Figure 5.12 Typical Force-Time Plot for 25x25 Array Marked by a Number of Peaks Due to Non
Uniform Insertion Rate
(a) (b)
Figure 5.13 Optical Microscope Image Illustrating Black India Ink Stains on Cadaver Skin after
Insertion for (a) 25x25 Array –Circular Needles (Width=20µm, Pitch=100µm, Height=125µm)
(b) 25x25 Array –Square Needles (Width=40µm, Pitch=200µm, Height=125µm)
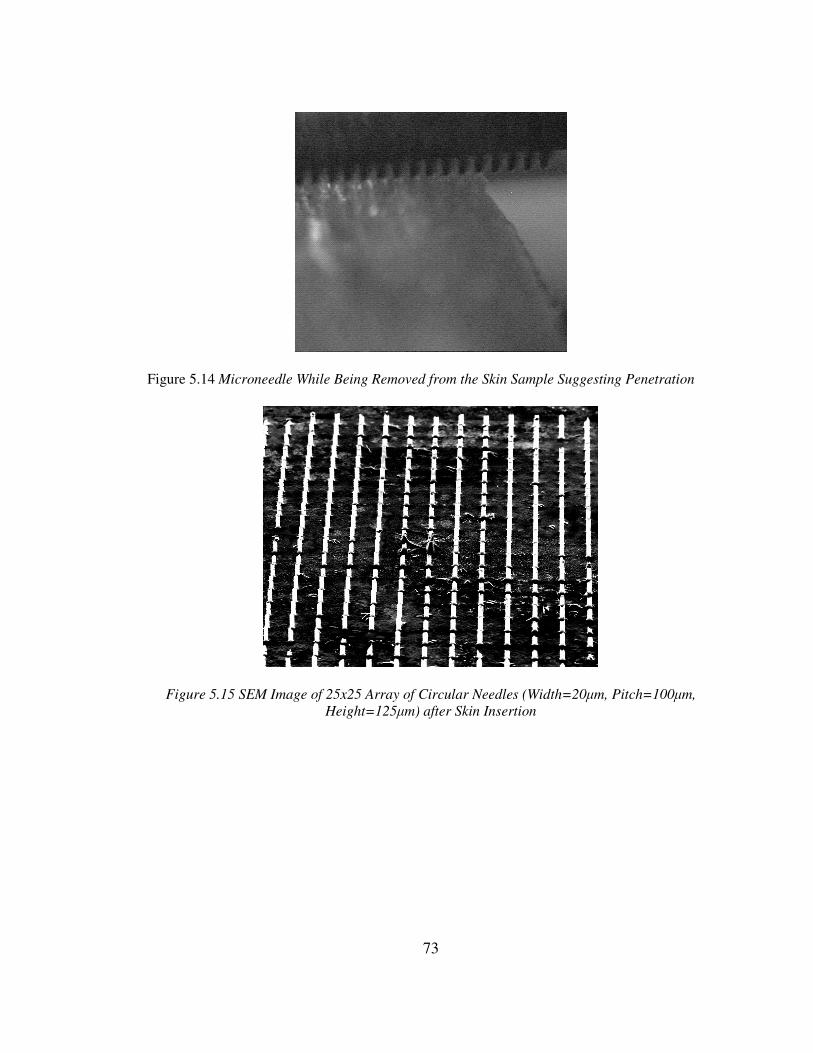
73
Figure 5.14 Microneedle While Being Removed from the Skin Sample Suggesting Penetration
Figure 5.15 SEM Image of 25x25 Array of Circular Needles (Width=20µm, Pitch=100µm,
Height=125µm) after Skin Insertion
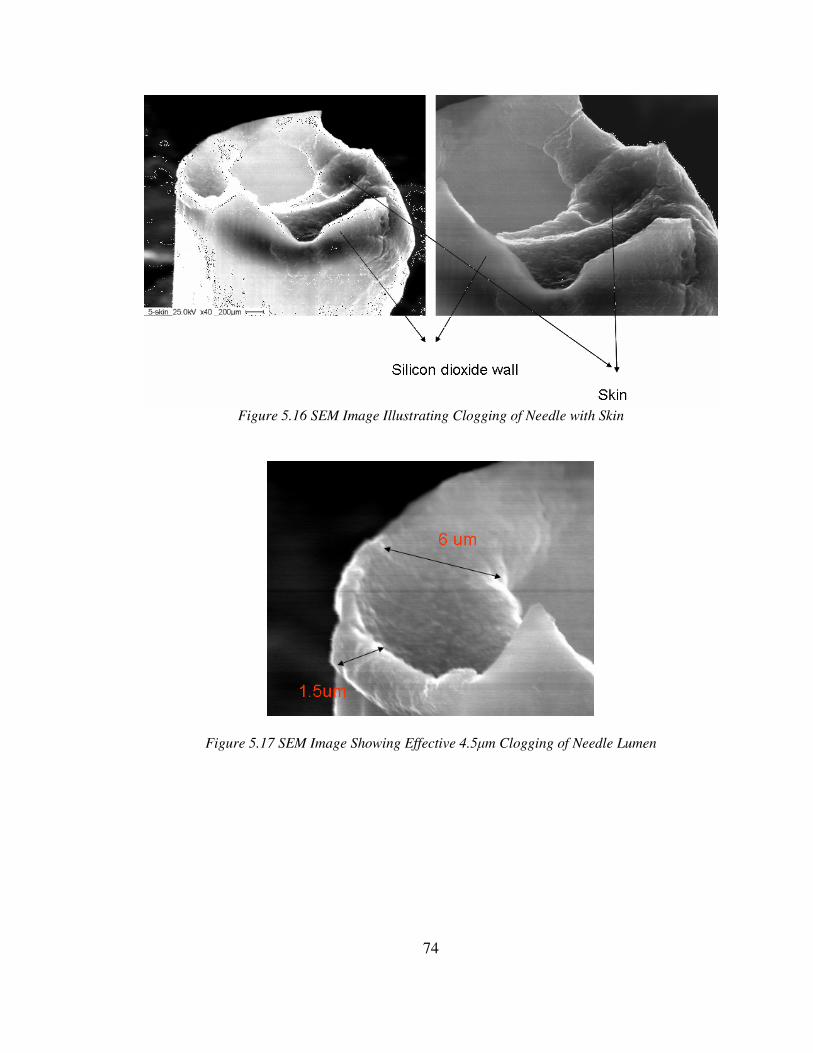
74
Figure 5.16 SEM Image Illustrating Clogging of Needle with Skin
Figure 5.17 SEM Image Showing Effective 4.5µm Clogging of Needle Lumen
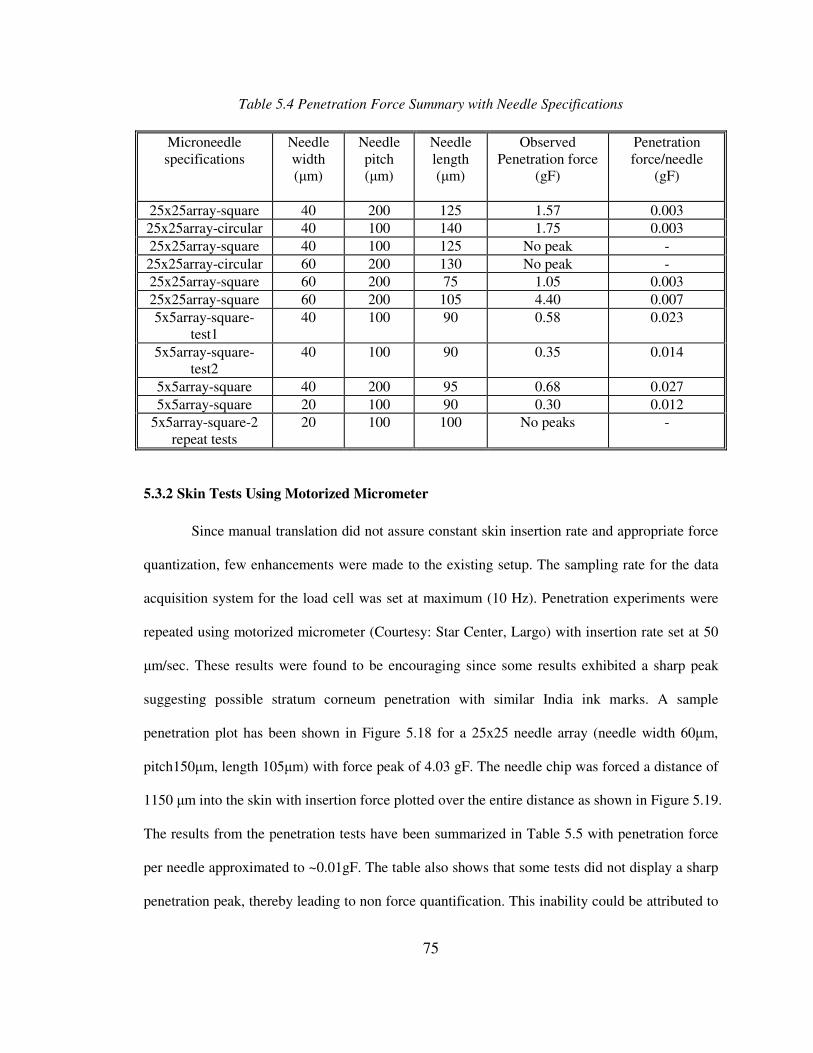
75
Table 5.4 Penetration Force Summary with Needle Specifications
Microneedle
specifications
Needle
width
(µm)
Needle
pitch
(µm)
Needle
length
(µm)
Observed
Penetration force
(gF)
Penetration
force/needle
(gF)
25x25array-square 40 200 125 1.57 0.003
25x25array-circular 40 100 140 1.75 0.003
25x25array-square 40 100 125 No peak -
25x25array-circular 60 200 130 No peak -
25x25array-square 60 200 75 1.05 0.003
25x25array-square 60 200 105 4.40 0.007
5x5array-square-
test1
40 100 90 0.58 0.023
5x5array-square-
test2
40 100 90 0.35 0.014
5x5array-square 40 200 95 0.68 0.027
5x5array-square 20 100 90 0.30 0.012
5x5array-square-2
repeat tests
20 100 100 No peaks -
5.3.2 Skin Tests Using Motorized Micrometer
Since manual translation did not assure constant skin insertion rate and appropriate force
quantization, few enhancements were made to the existing setup. The sampling rate for the data
acquisition system for the load cell was set at maximum (10 Hz). Penetration experiments were
repeated using motorized micrometer (Courtesy: Star Center, Largo) with insertion rate set at 50
µm/sec. These results were found to be encouraging since some results exhibited a sharp peak
suggesting possible stratum corneum penetration with similar India ink marks. A sample
penetration plot has been shown in Figure 5.18 for a 25x25 needle array (needle width 60µm,
pitch150µm, length 105µm) with force peak of 4.03 gF. The needle chip was forced a distance of
1150 µm into the skin with insertion force plotted over the entire distance as shown in Figure 5.19.
The results from the penetration tests have been summarized in Table 5.5 with penetration force
per needle approximated to ~0.01gF. The table also shows that some tests did not display a sharp
penetration peak, thereby leading to non force quantification. This inability could be attributed to

76
following factors: wavy nature of skin, non uniform microneedle edges, low rate sampling rate of
data acquisition system and insufficient load cell sensitivity. Since the cadaver specimen were
wavy and exhibited high surface roughness, all needles must not have penetrated at the same
instant; hence the point loading may be significantly higher than the read out values .
Another approach to analyze the microneedle contribution during chip insertion into the
skin was to test using a plain chip without needles on skin under similar displacement conditions.
Work done by the needles was then related by computing the area between the force–
displacement curves with and without needles. Figure 5.20 illustrates this approach for above
used 25x25 array. However this approach doesn’t confirm the needle penetration or indentation
since penetration peak observed was at low displacement values where no significant difference
between the curves is observed. Also the motorized micrometer employed lacked a feedback
system which could be interfaced with the PC to co-ordinate the needle displacement and
penetration force time intervals. In current measurement setup, this co-ordination was achieved
manually using a stop clock.
Penetration force vs time for 25x25 array_60x150um
55
56
57
58
59
60
61
62
63
0 1 2 3 4 5 6 7 8 9 10 11 12 13 14 15 16 17 18 19 20Time(sec)
Fo
rce(g
F)
Figure 5.18 Magnified Peak in Skin Penetration Force-Time Plot for 25X25 Array (Circular
Needle-Width 60µm, Pitch 150µm, Length 105µm) Indicating 4.03gF as Penetration Force
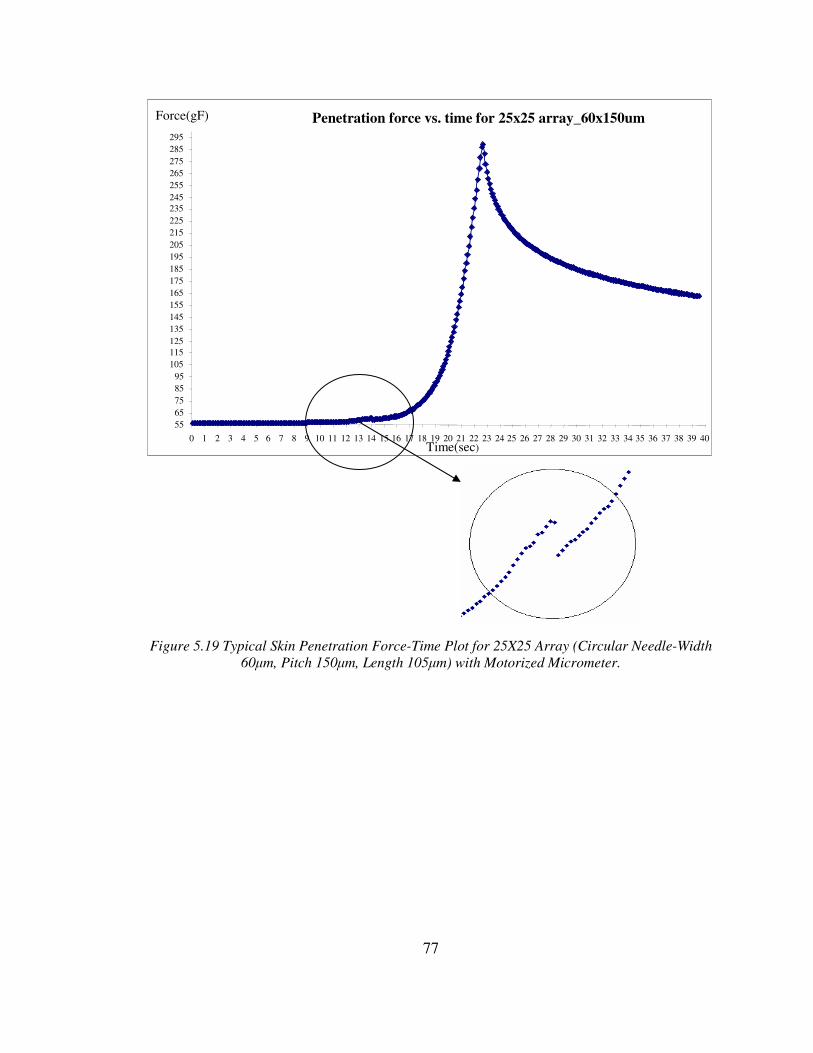
77
Figure 5.19 Typical Skin Penetration Force-Time Plot for 25X25 Array (Circular Needle-Width
60µm, Pitch 150µm, Length 105µm) with Motorized Micrometer.
Penetration force vs. time for 25x25 array_60x150um
55 65 75 85 95
105 115 125 135 145 155 165 175 185 195 205 215 225 235 245 255 265 275 285 295
0 1 2 3 4 5 6 7 8 9 10 11 12 13 14 15 16 17 18 19 20 21 22 23 24 25 26 27 28 29 30 31 32 33 34 35 36 37 38 39 40 Time(sec)
Force(gF)
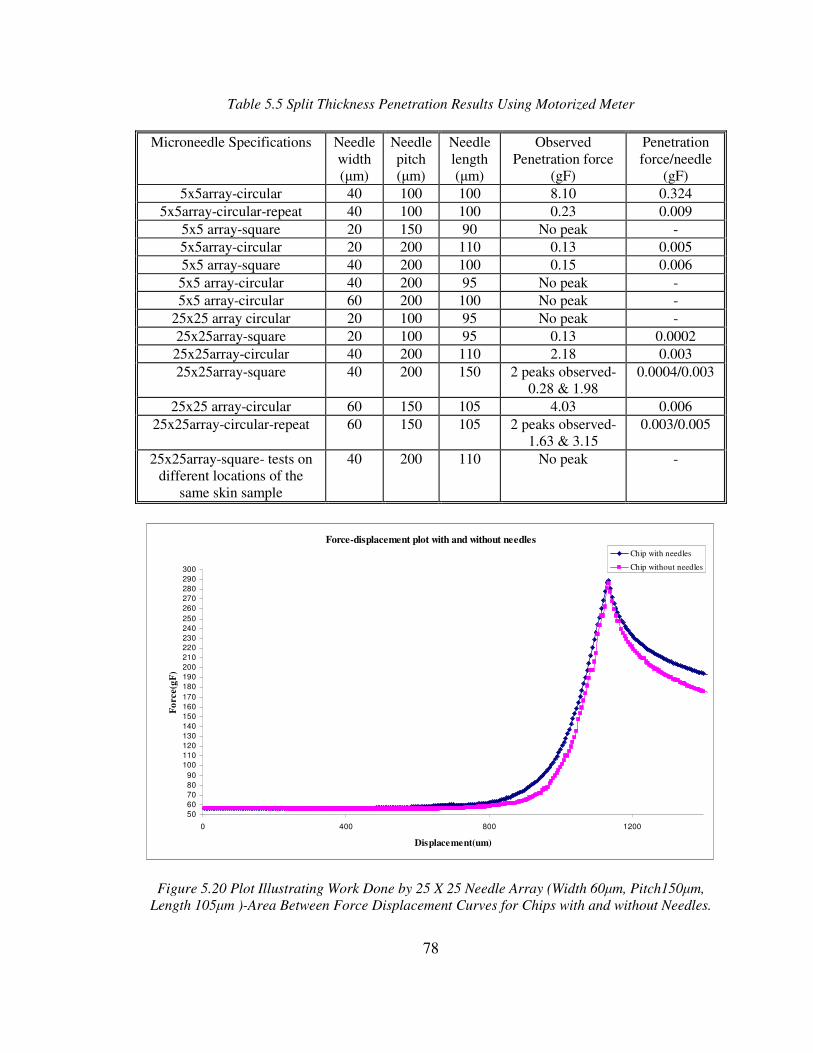
78
Table 5.5 Split Thickness Penetration Results Using Motorized Meter
Microneedle Specifications Needle
width
(µm)
Needle
pitch
(µm)
Needle
length
(µm)
Observed
Penetration force
(gF)
Penetration
force/needle
(gF)
5x5array-circular 40 100 100 8.10 0.324
5x5array-circular-repeat 40 100 100 0.23 0.009
5x5 array-square 20 150 90 No peak -
5x5array-circular 20 200 110 0.13 0.005
5x5 array-square 40 200 100 0.15 0.006
5x5 array-circular 40 200 95 No peak -
5x5 array-circular 60 200 100 No peak -
25x25 array circular 20 100 95 No peak -
25x25array-square 20 100 95 0.13 0.0002
25x25array-circular 40 200 110 2.18 0.003
25x25array-square 40 200 150 2 peaks observed-
0.28 & 1.98
0.0004/0.003
25x25 array-circular 60 150 105 4.03 0.006
25x25array-circular-repeat 60 150 105 2 peaks observed-
1.63 & 3.15
0.003/0.005
25x25array-square- tests on
different locations of the
same skin sample
40 200 110 No peak -
Force-displacement plot with and without needles
50
60
70
80
90
100
110
120
130
140
150
160
170
180
190
200
210
220
230
240
250
260
270
280
290
300
0 400 800 1200
Displacement(um)
Fo
rce(g
F)
Chip with needles
Chip without needles
Figure 5.20 Plot Illustrating Work Done by 25 X 25 Needle Array (Width 60µm, Pitch150µm,
Length 105µm )-Area Between Force Displacement Curves for Chips with and without Needles.
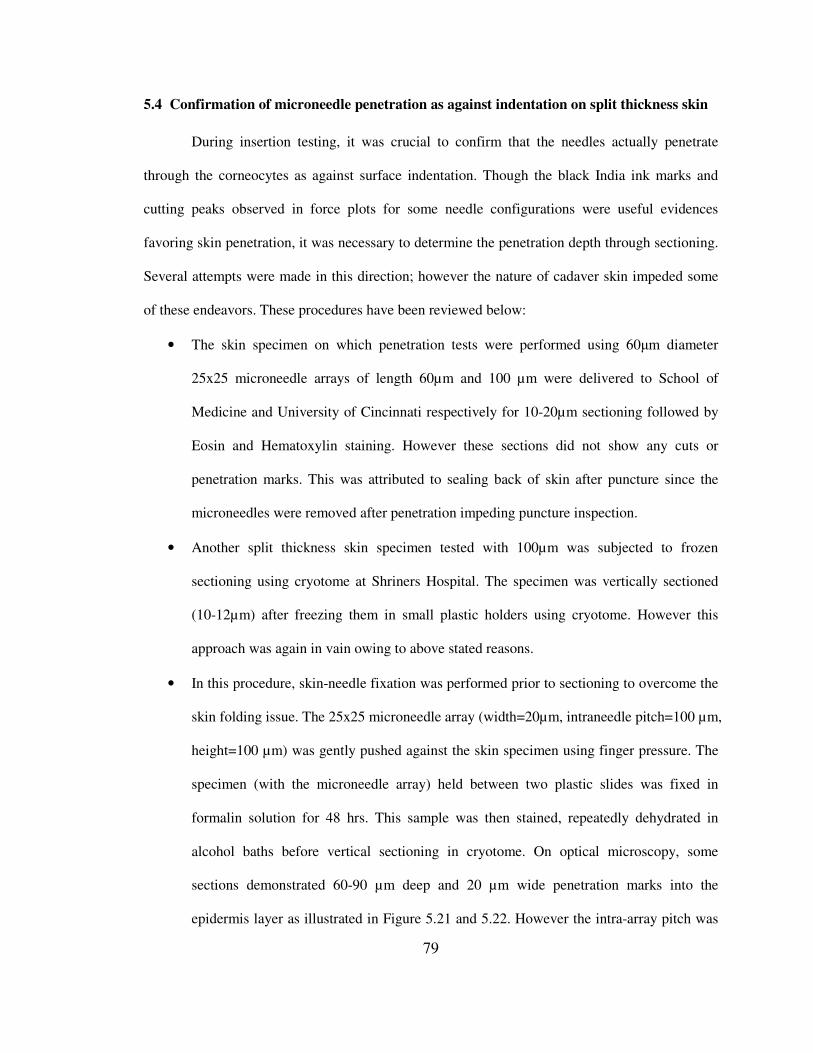
79
5.4 Confirmation of microneedle penetration as against indentation on split thickness skin
During insertion testing, it was crucial to confirm that the needles actually penetrate
through the corneocytes as against surface indentation. Though the black India ink marks and
cutting peaks observed in force plots for some needle configurations were useful evidences
favoring skin penetration, it was necessary to determine the penetration depth through sectioning.
Several attempts were made in this direction; however the nature of cadaver skin impeded some
of these endeavors. These procedures have been reviewed below:
• The skin specimen on which penetration tests were performed using 60µm diameter
25x25 microneedle arrays of length 60µm and 100 µm were delivered to School of
Medicine and University of Cincinnati respectively for 10-20µm sectioning followed by
Eosin and Hematoxylin staining. However these sections did not show any cuts or
penetration marks. This was attributed to sealing back of skin after puncture since the
microneedles were removed after penetration impeding puncture inspection.
• Another split thickness skin specimen tested with 100µm was subjected to frozen
sectioning using cryotome at Shriners Hospital. The specimen was vertically sectioned
(10-12µm) after freezing them in small plastic holders using cryotome. However this
approach was again in vain owing to above stated reasons.
• In this procedure, skin-needle fixation was performed prior to sectioning to overcome the
skin folding issue. The 25x25 microneedle array (width=20µm, intraneedle pitch=100 µm,
height=100 µm) was gently pushed against the skin specimen using finger pressure. The
specimen (with the microneedle array) held between two plastic slides was fixed in
formalin solution for 48 hrs. This sample was then stained, repeatedly dehydrated in
alcohol baths before vertical sectioning in cryotome. On optical microscopy, some
sections demonstrated 60-90 µm deep and 20 µm wide penetration marks into the
epidermis layer as illustrated in Figure 5.21 and 5.22. However the intra-array pitch was
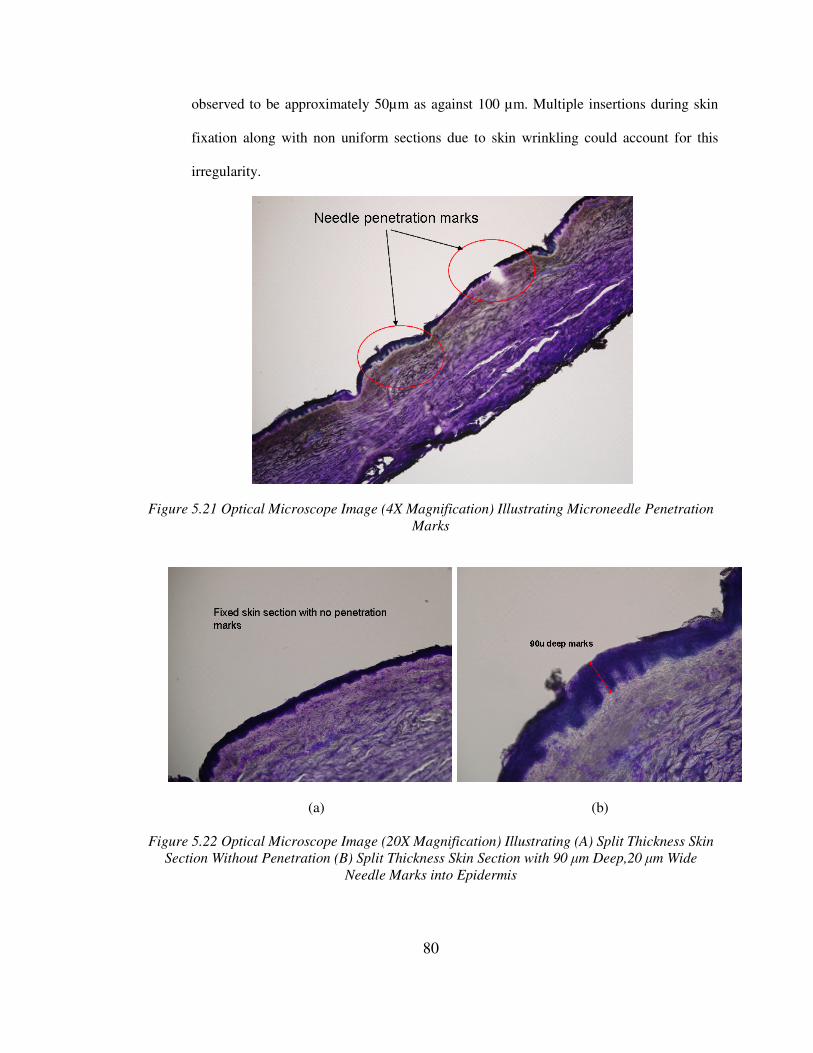
80
observed to be approximately 50µm as against 100 µm. Multiple insertions during skin
fixation along with non uniform sections due to skin wrinkling could account for this
irregularity.
Figure 5.21 Optical Microscope Image (4X Magnification) Illustrating Microneedle Penetration
Marks
(a) (b)
Figure 5.22 Optical Microscope Image (20X Magnification) Illustrating (A) Split Thickness Skin
Section Without Penetration (B) Split Thickness Skin Section with 90 µm Deep,20 µm Wide
Needle Marks into Epidermis
81
5.5 Penetration Tests on Isolated Stratum Corneum
The ability of the microneedles to penetrate enzymatically isolated Stratum Corneum
(obtained from U.S. Cell and Tissue Bank, Ohio) was tested. The specimen received on a filter
paper was initially placed in DI water to determine the stratum corneum side (floating on top).
The SC was positioned on the soft polymer for manual testing. Before testing, a 1.5 µl pipette
drop of 0.9% physiological saline was placed on stratum corneum to avoid excessive dryness
during testing. 25x25 microneedle array (Circular needles-width 40µm, pitch 200µm and length
100µm) was manually pushed onto the specimen uniformly applying tweezer pressure. The
needles made contact with the specimen in certain region and ripped SC layers, leaving behind a
thin layer with holes.
Another SC specimen placed on soft polymer was mounted on the skin holding block and
subjected to manual insertion of India ink stained microneedle array (25x25 square needle array-
width 40µm, pitch150µm, length 100µm). The insertion marks are visible in Figure 5.23. Also the
plots exhibited several non uniformities due to uneven microneedle motion as shown in Figure
5.24. The test results which exhibited sharp penetration peaks have been summarized in Table 5.6.
The graphs as well as the images indicate possible penetration into SC. The large force values are
due to dehydration of SC, transforming into a hard material. Also the stratum corneum specimen
was of smaller dimension as compared to the area occupied by the needle array.
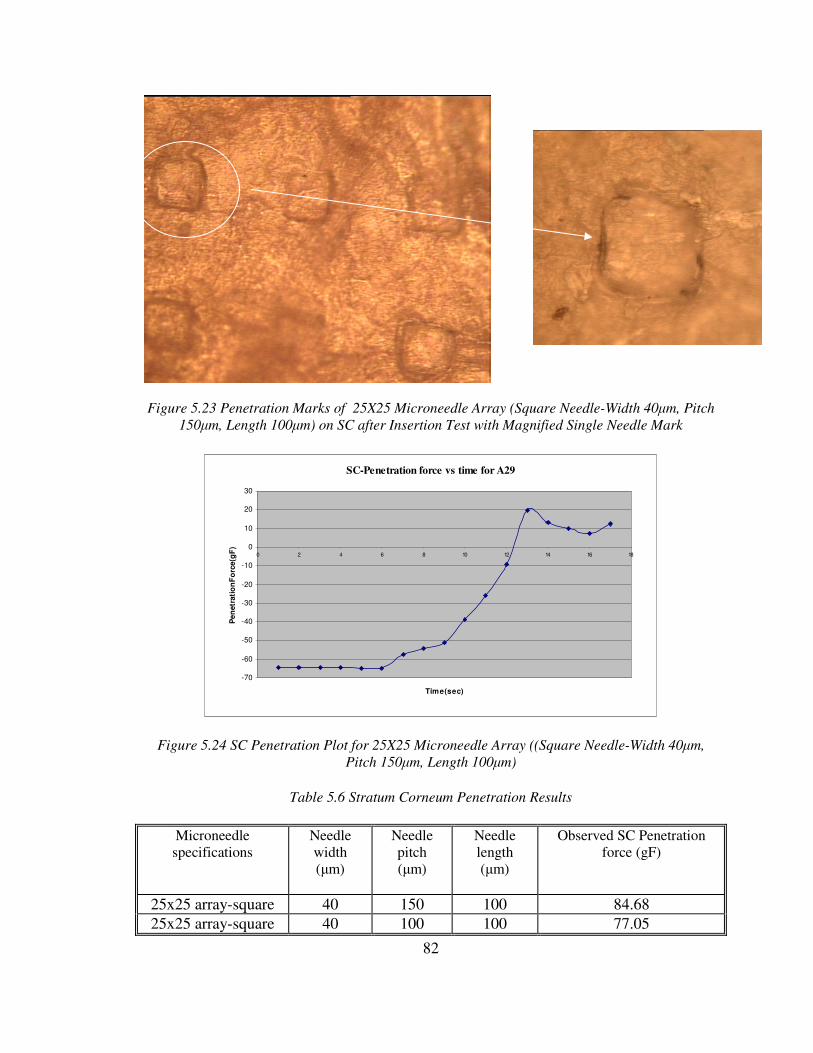
82
Figure 5.23 Penetration Marks of 25X25 Microneedle Array (Square Needle-Width 40µm, Pitch
150µm, Length 100µm) on SC after Insertion Test with Magnified Single Needle Mark
SC-Penetration force vs time for A29
-70
-60
-50
-40
-30
-20
-10
0
10
20
30
0 2 4 6 8 10 12 14 16 18
Time(sec)
Pen
etr
ati
on
Fo
rce(g
F)
Figure 5.24 SC Penetration Plot for 25X25 Microneedle Array ((Square Needle-Width 40µm,
Pitch 150µm, Length 100µm)
Table 5.6 Stratum Corneum Penetration Results
Microneedle
specifications
Needle
width
(µm)
Needle
pitch
(µm)
Needle
length
(µm)
Observed SC Penetration
force (gF)
25x25 array-square 40 150 100 84.68
25x25 array-square 40 100 100 77.05
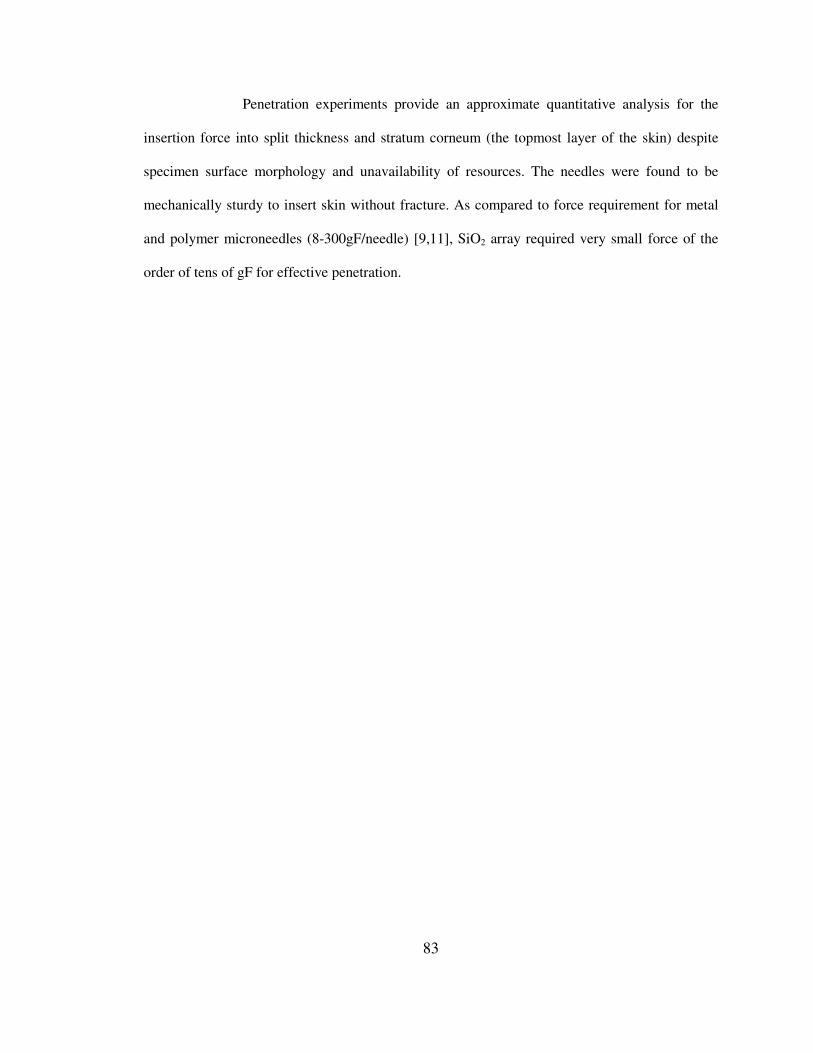
83
Penetration experiments provide an approximate quantitative analysis for the
insertion force into split thickness and stratum corneum (the topmost layer of the skin) despite
specimen surface morphology and unavailability of resources. The needles were found to be
mechanically sturdy to insert skin without fracture. As compared to force requirement for metal
and polymer microneedles (8-300gF/needle) [9,11], SiO2 array required very small force of the
order of tens of gF for effective penetration.

84
CHAPTER 6 CONCLUSIONS AND RECOMMENDATIONS FOR FUTURE WORK
6.1 Conclusions
Hollow biocompatible microneedle arrays were designed, fabricated and mechanically
evaluated for reliability in transdermal applications. Two different bulk micromachining
techniques Coherent Porous Silicon and DRIE technology were successfully implemented to
fabricate sharp SiO2 needles with inherent length controllability feature that potentially enhance
different target applications. The effect of geometry (shape, needle width, intra array pitch and
needle length) on mechanical characterization was studied experimentally on multidimensional
DRIE based needle array chips owing to speedy and reliable fabrication capability of designed
needle patterns from single wafer using the technique. An experimental setup was developed in
house for fracture and skin penetration force measurement. Microneedle reliability was quantified
experimentally by fracture strength. Results suggested that the needle failure did not conform to
Euler’s force-length inverse parabolic relation (design assumption) and fractured at lower values
near material compressive strength due to brittle nature. It was observed that the fracture force
decreased with increasing length at constant widths. The force also increased by 2.25 gF as width
was increased from 10-40µm at constant 75µm micro needle length (circular geometry). Circular
geometry fractured at lower compressive force as compared to square counterparts due to smaller
interfacial micro needle area. The fracture force was observed to be lower than that obtained
theoretically from compressive strength for SiO2. This could be attributed to defects in brittle
85
microstructure leading to crack initiation and propagation and processing issues like non uniform
needle edge and buckling of oxide walls during needle release due to compressive stresses at Si-
SiO2 interface generated during oxidation process. Since the existing setup did not facilitate shear
force measurements, these values were determined analytically using Finite Element analysis.
Compressive and indentation tests on skin substitute polymer confirmed that the polymer
behaved very different unlike skin due to its isotropic, elastic and non viscous nature. Hence this
polymer was used for preliminary characterization and as a soft cushion for stratum Corneum
penetration testing. Real time microneedle insertion tests into cadaver skin and isolated Stratum
Corneum test experimentally highlight the robustness of the needles to penetrate without fracture.
SEM images and sharp peaks observed in the insertion force -time plots suggesting that the
needles go through the corneocytes and don't merely indent them. However confocal microscopy
of fixed skin would give a reasonable estimate of penetration depth. The penetration force could
be quantified only for a few microneedle chips whose force plots displayed a sharp peak
indicating cutting of stratum corneum. The penetration force required for 25x25 array was of the
order of 1-5 gF as compared to 0.25-0.7 gF for 5x5 array indicating nearly no force for skin
insertion. However measured penetration force/needle (~0.01gF) was several magnitudes smaller
compared to fracture force (~1-12gF) supporting microneedle robustness during testing. The
point loading may be significantly higher than the read out values because of skin roughness and
not all needles contacting the same time. The results from other tests could not be analyzed due to
absence of sharp peaks owing to following limitation: low sampling rate of data acquisition
system for load cell, greater sensitivity of load cell, high resolution viewing and motorized
micrometer. However after each penetration test, distinct needle stain marks were observed on the
skin samples hinting needle penetration. This characterization research confirmed mechanical
robustness of SiO2 microneedles for transdermal applications.
86
6.2 Recommendations for Future Work
The ultimate goal for out of plane hollow SiO2 needle fabrication was to investigate their
capability for drug delivery and bio-fluid extraction. For this purpose, initial needle penetration
depth into cadaver split thickness skin needs to be investigated. This can be achieved by injecting
fluorescent dye through hollow needles into cadaver skin and then determine the penetration
depth through confocal microscopy. Investigation of fluid delivery capability of the needles needs
to be explored by performing fluidic studies at different flow rates. Also the needle mechanical
strength needs to be enhanced by biocompatible polymer coating to contain the residue, in case of
in vivo fracture.
87
REFERENCES
1. Cross S. E. and Roberts M.S., “Physical Enhancement of Transdermal Drug Application:
Is Delivery Technology Keeping up with Pharmaceutical Development”, Current Drug
Delivery 2004, 1, pp 81-92.
2. S. P. Davis, B. J. Landis, Z. H. Adams, M. G. Allen, M. R. Prausnitz, “Journal of
Biomechanics”, 2004,Vol. 37, No. 8, pp.1155-1163.
3. Zahn J. ,” Microfabricated Microneedles for minimally Invasive Drug Delivery,
Sampling and Analysis”, PhD Dissertation, 1995.
4. McAllister D., Allen M. and Prausnitz M. ,” Microfabricated Microneedles for Gene and
Drug Delivery”, Annual Review of Biomedical Engineering, 2000,2, pp:289-313.
5. Chen J., Wise K., Hetke J. and Bledsoe S., “A multichannel neural Probe for selective
Chemical Delivery at the Cellular level”, IEEE Transaction on Biomedical Engineering”,
1997, vol. 44, 8, pp 760-769.
6. Henry S., McAllister D., Allen M. and Prausnitz M., “Micromachined needles for
transdermal delivery of drugs”, IEEE MEMS, Germany, 1998, pp 494-498.
7. Chandrasekharan S., Brazzle J. and Frazier A., “Surface Micromachined Metallic
Microneedles”, Journal of Microelectromechanical systems, June 2003, vol. 12, 3,
pp 281-288.
8. Brazzle J., Papautsky I. and Frazier A., “Hollow Metallic Micromacined Needle Arrays”,
Biomedical Microdevices, 2000, 2:3, pp 197-205.
9. Chandrasekharan S. and Frazier A., “Mechanical Characterisation of Surface
Micromachined Microneedle Array”, Journal of Microelectromechanical systems, June
2003, vol 12, 3, pp 289-295.
10. Gardeniers H., Luttge R., Berenschot E., Boer M., Yeshurun S., Hefetz M., Oever R. and
Berg A. , “Silicon Micromechanical Hollow Microneedles for Transdermal Liquid
Transport”, Journal of Microelectromechanical systems, Dec 2003, vol 12, 6, pp 855-
862.
11. Stoeber B. and Liepmann D., “Fluid injection through out-of-plane microneedles”, Proc.
10th International Conference on Solid State Sensors and Actuators,1999, Sendai,Japan.
88
12. Zahn J., Talbot N., Leipmann D. and Pisano A., “Microfabricated Polysilicon
Microneedles for Minimally Invasive Biomedical Devices”, Biomedical Microdevices
2000, 2:4, pp 295-303.
13. Lin L. and Pisano A., “Silicon- Processed Microneedles”, Journal of
Microelectromechanical systems, March 1999, vol 8, 1, pp 78-84.
14. http://www.essentialdayspa.com/Skin_Anathomy_and_Physiology.htm
15. Forslind, Bo; Lindberg, Magnus; Albano, Robert E., “Skin, Hair, and Nails: Structure
and Function, Basic and Clinical Dermatology”, New York Marcel Dekker, Inc., 2004,
ISBN 082474313X.
16. McElhany et al, “Handbook of Human Tolerance”
17. Nordin M. and Frankel V., “Basic Biomechanics of the Musculoskeletal System”
18. IEEE Transactions on electron devices, Vol.ED25, No.10, Oct1978, p.1249
19. http://www.sfu.ca/adm/materials.html
20. Kovacs G., “Micromachined Transducers Sourcebook”, WCB McGraw-Hill, ISBN 0-07-
290722-3, pp 69.
21. Chun K., Haschigushi G.,Toshiyoshi H., Fujita H., Pioufile B., Kikuche Y. , Ishikawa J.,
Murakami Y., Tamiya E., “DNA injection into cell conglomerates by micromachined
hollow microcapillary arrays”, Transducers, 1999, pp 44-47.
22. Canham L., “Porous Silicon as a Theurapeutic biomaterial”, IEEE-EMBS Special talk
Conference on Microtechnologies in Medicine and Biology”, 2000, pp 109-112.
23. Lehmann V., “Porous Silicon- A new material for MEMS”, IEEE Proceedings, 1996,
pp 1-6.
24. Lehmann V., “The Physics of Macropore formation in Low Doped n-type Silicon”,
Journal of Electrochemical Society, October 1993, Vol. 140, No. 10, pp 2836-2843.
25. Brent VanDyke, “Development of Coherent Porous Silicon for use in Biological and
Optical Applications”, M.S Thesis, May 2000, University of Cincinnati.
26. Potluri K., “Multi material micro needle fabrication using porous silicon technology”,
M.S Thesis,April 2003, University of South Florida.
27. Lehmann V. and Gruning U., “The limits of macropore array fabrication”, Thin Solid
Films, 1997, vol. 297, pp 13-17.
28. http://www.sigma-koki.com/english/D/ActuatorSystems/Optmic/OMDC-B!BJ/OMDC-
B!BJ.html
89
29. Pringle D., Koob T. and Kim H., “Indentation properties of growing femoral head
following ischemic necrosis”, Journal of Orthopedic Research, Jan 2004, Vol 22(1), pp
122-130.
30. http://web.mit.edu/6.777/www/matprops/sio2.htm
31. Lawn B., “Fracture of brittle solids”, Cambridge University Press, 1993.
32. Wilmsen C., Thompson E. and Meissner G., “Buckling of Thermally-Grown SiO2 Thin
Films”, IEEE Transaction on Electron Devices, January 1972, pp 122.
33. Teo M., Shearwood C., Ng K., Lu J. and Mocchala Shabbir, ‘In vitro and In vivo
characterization of MEMS Microneedles”, Biomedical Microdevices, 2005, vol. 7:1, pp
47-52.