Investigation of electrode materials for an ...
60
Investigation of Electrode Materials for an Electrochemical Flow Capacitor A Thesis Submitted to the Faculty of Drexel University by Jonathan William Campos in partial fulfillment of the requirements for the degree of Master of Science in Chemical Engineering December 2012
Transcript of Investigation of electrode materials for an ...
Investigation of Electrode Materials for an Electrochemical Flow Capacitor
A Thesis
Submitted to the Faculty
of
Drexel University
by
Jonathan William Campos
in partial fulfillment of the
requirements for the degree
of
Master of Science in Chemical Engineering
December 2012

ii
Dedications
This work is dedicated to my parents Omar de Jesús Campos Arredondo and Eve Lynn
Atkinson and family—they have always supported me. Without the example my socially
conscious father set as someone passionate in his work as a science and language
educator, artist and many other things, I could not have done this work. Without my
mother’s curiosity, deep thinking, openness to new ideas and many other traits, I could
not have done this work.
I have also been truly luck to have spent summers and holidays with my grandparents
growing up. With them, I did things from fishing to home improvement to learning
calculus from my physicist, American folk music playing grandfather, William R.
Atkinson, who worked for Phillips, the National Center for Atmospheric Research, the
National Institute of Standards and Technology (Bureau of Standards in his time) and
several other academic institution. My grandparents set an example of curiosity, deep
thinking and hard work and still do especially when my grandmother shares her extensive
knowledge of nutritional facts.
iii
Acknowledgements
Prof. Yury Gogotsi, my research advisor gave me the opportunity to conduct this research
and helped me reach this point with insightful criticism and encouragement. I also
received support from my co-advisor Prof. Caglan Kumbur and I am grateful for having
Prof. Vibha Kalra as the chair of my committee. I was truly lucky to have had group
meetings and discussions with such sharp minds in the Nanomaterials Group (NMG) and
Electrochemical Flow Capacitor group.
Fellow NMG member Carlos Perez played a major role in my desire to join the group
with a tour of Yury’s lab and through his passion in his research. Once I joined, he
introduced supercapacitor fabrication and electrochemical analysis to me. I also have to
acknowledge Dr. Volker Presser, 2010-2012 NMG member, and Dr. Majid Beidaghi for
help with my development as a researcher.
Dr. Steven Cox, PI of the Bridge to the Doctorate Fellowship which supported my two
years at Drexel, and the board members helped me reach this avenue with guidance and
encouragement. Veniece Keene, Philadelphia Alliance for Minority Participation Project
Coordinator, helped me with the logistics of attending the Gordon Research Conference
on Organic Electronics in Italy.
My fellow graduate student friends Yohan Seepersad, Dr. Fela Odeyemi, David Diaz, Dr.
David Delaine, Dr. Virginia Kocieda, Patrick Kirby, Jefferson Cuadra, Gabe Carryon,
Kamau Wright, Chris Dennison, Kelsey Hatzell, Siamak Nejati, Walter Hinds, and others
also helped me navigate Drexel and graduate school through discussion of technical and
non-technical matters, soccer, and other great times I hope to never forget.
iv
Table of Contents
Table of Contents ............................................................................................................... iv
List of Tables ..................................................................................................................... vi
List of Figures ................................................................................................................... vii
1. Introduction ................................................................................................................. 1
1.1 Supercapacitor and EFC Metrics for Research and Development ......................................... 3
2. Literature Review ........................................................................................................ 4
2.1 Flow Assisted and Supercapacitor Energy Storage Technologies ......................................... 4
2.1 Supercapacitor and Flowable Slurry Static Cell Configuration ............................................. 9
2.1.1 Electrode ....................................................................................................................... 12
2.1.2 Electrolyte ..................................................................................................................... 16
3. Materials and Experimental Methods ........................................................................ 18
3.1 Materials .............................................................................................................................. 18
3.1.1 Porous Carbon Electrodes ............................................................................................. 18
3.1.2 Electrolyte ..................................................................................................................... 19
3.2 Testing System ..................................................................................................................... 20
3.2.1 Static Cell Device ......................................................................................................... 20
3.3 Slurry Preparation ................................................................................................................ 21
3.3.1 Carbon and Electrolyte Mixing ..................................................................................... 21
3.4 Material Characterization ..................................................................................................... 22
3.4.1 Gas Sorption.................................................................................................................. 22
3.4.2 Scanning Electron Microscopy ..................................................................................... 24
3.4.3 Structural Analysis by Raman ....................................................................................... 25
3.4.4 Electrochemistry ........................................................................................................... 27
3.4.5 Rheometry ..................................................................................................................... 29
4. Static Cell Performance and Rheological Properties ................................................. 31
4.1.1 Cyclic Voltammetry ...................................................................................................... 31
4.1.2 Galvanostatic Cycling ................................................................................................... 36
4.1.3 Self Discharge ............................................................................................................... 38
4.1.4 Chronoamperometry ..................................................................................................... 40
4.2 Rheological Properties ......................................................................................................... 40
5. Optimization .............................................................................................................. 43
5.1 Particle Shape and Size ........................................................................................................ 43

v
5.2 Carbon Loading ................................................................................................................... 44
5.3 Electrode Modification ........................................................................................................ 45
5.5 Stable Voltage Window Expansion ..................................................................................... 45
6. Conclusions ............................................................................................................... 46
7. Future Work ............................................................................................................... 47
8. References ................................................................................................................. 49
vi
List of Tables
Table 2.1 Flow System Characteristics ............................................................................... 9
Table 3.1 Physical Characteristics of Porous Carbon Particles ........................................ 23
Table 3.2 Porous Carbon Raman Spectra Values ............................................................. 27
Table 4.1 Power law fitting parameters for various slurries. ............................................ 43
vii
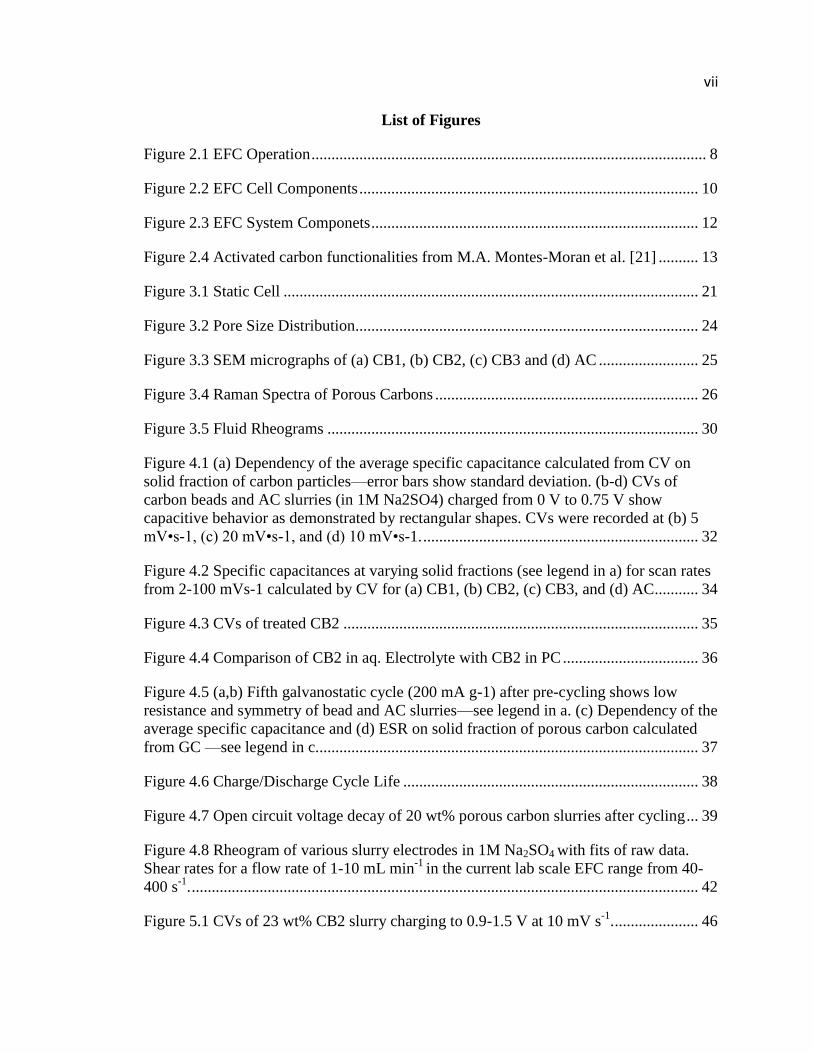
List of Figures
Figure 2.1 EFC Operation ................................................................................................... 8
Figure 2.2 EFC Cell Components ..................................................................................... 10
Figure 2.3 EFC System Componets .................................................................................. 12
Figure 2.4 Activated carbon functionalities from M.A. Montes-Moran et al. [21] .......... 13
Figure 3.1 Static Cell ........................................................................................................ 21
Figure 3.2 Pore Size Distribution...................................................................................... 24
Figure 3.3 SEM micrographs of (a) CB1, (b) CB2, (c) CB3 and (d) AC ......................... 25
Figure 3.4 Raman Spectra of Porous Carbons .................................................................. 26
Figure 3.5 Fluid Rheograms ............................................................................................. 30
Figure 4.1 (a) Dependency of the average specific capacitance calculated from CV on
solid fraction of carbon particles—error bars show standard deviation. (b-d) CVs of
carbon beads and AC slurries (in 1M Na2SO4) charged from 0 V to 0.75 V show
capacitive behavior as demonstrated by rectangular shapes. CVs were recorded at (b) 5
mV•s-1, (c) 20 mV•s-1, and (d) 10 mV•s-1. ..................................................................... 32
Figure 4.2 Specific capacitances at varying solid fractions (see legend in a) for scan rates
from 2-100 mVs-1 calculated by CV for (a) CB1, (b) CB2, (c) CB3, and (d) AC........... 34
Figure 4.3 CVs of treated CB2 ......................................................................................... 35
Figure 4.4 Comparison of CB2 in aq. Electrolyte with CB2 in PC .................................. 36
Figure 4.5 (a,b) Fifth galvanostatic cycle (200 mA g-1) after pre-cycling shows low
resistance and symmetry of bead and AC slurries—see legend in a. (c) Dependency of the
average specific capacitance and (d) ESR on solid fraction of porous carbon calculated
from GC —see legend in c. ............................................................................................... 37
Figure 4.6 Charge/Discharge Cycle Life .......................................................................... 38
Figure 4.7 Open circuit voltage decay of 20 wt% porous carbon slurries after cycling ... 39
Figure 4.8 Rheogram of various slurry electrodes in 1M Na2SO4 with fits of raw data.
Shear rates for a flow rate of 1-10 mL min-1
in the current lab scale EFC range from 40-
400 s-1
. ............................................................................................................................... 42
Figure 5.1 CVs of 23 wt% CB2 slurry charging to 0.9-1.5 V at 10 mV s-1
. ..................... 46
viii
Abstract
Investigation of Electrode Materials for an Electrochemical Flow Capacitor
Jonathan Campos
Advisors: Prof. Yury Gogotsi and Prof. Emin Caglan Kumbur
A recently introduced electrical energy storage concept, the electrochemical flow
capacitor (EFC), holds much promise for grid-scale energy storage applications. The EFC
utilizes the principles behind the operation of flow batteries and supercapacitors, and
enables rapid charging/discharging and decoupled energy/power ratings. Electrical
charge is stored in a flowable carbon slurry composed of low-cost and abundant carbon in
neutral, aqueous electrolyte. Charge storage and transfer is analogous to solid carbon
electrodes in conventional supercapacitors. Here, the effects of carbon particle solid
fraction, shape and size on the electrochemical and flow properties of slurry electrodes
are investigated. A static cell configuration is utilized for studying the electrochemical
properties of the flowable electrodes. The electrochemical properties of the slurry
electrodes tested in a static cell are found to be similar to that of solid electrodes in
conventional supercapacitors for large spherical and commonly used anisometric
activated carbons. Flow properties of the slurry electrodes are obtained for shear rates
corresponding to pumping shear rates by rheometry. The results indicate that
electrochemical and rheological properties of slurries depend on their concentration and
also shape and size of the carbon particles used in the slurries. For a range of
concentrations, slurries based on spherical carbon particles show lower viscosities
compared to anisometric activated carbon based slurries while performing similar
electrochemically.

ix
1
1. Introduction
Electrochemical energy storage (EES) has emerged as one of the key technologies to
address the increasing problems of grid instability and poor reliability that are imposed
by the large scale implementation of renewable energy sources (such as wind or solar) on
the grid. Furthermore, in order to achieve a modest goal of 10% renewable energy
integration, energy storage technologies are necessitated [1]. Recent energy policies have
called for renewable portfolio standards (RPS), which mandate that a fraction of the
electricity supply come from renewable energy sources approaching the modest goal of
10% renewable energy. Grid operators forced to ramp gas turbines to pacify for these
intermittencies. This practice is energy inefficient and costly. According to the Electric
Power Research Institute, it is estimated that cascading power outages create disturbances
on the order of $100 billion dollars annually [2]. This fact reconciles the need for a more
reliable and robust grid system. In the advent of smart grid and distributed generation
systems, grid energy storage technologies offer the opportunity to transform our
electricity system, shave peak loads, and make our grid more resilient.
Current technological solutions for power management, peak shaving, and load
leveling range from mechanical systems such as pumped hydroelectric, compressed air,
and fly wheels to superconducting magnetic energy storage, to name a few. However,
these technologies are less scalable and often more geographically constrained than
modular EES systems. In past decades, there has been significant progress in the
development of EES technologies which has had an immense impact on the consumer
and micro-electronics industries. Most of the progress has been achieved in regards to
batteries [3-5] and electrochemical double layer capacitors (also known as
2 supercapacitors) [6-8]. With the emerging issues of grid stability, finding a viable EES
solution to meet the complex challenges of grid scale energy storage and power
management has only recently attracted significant attention.
One of the main barriers to grid-scale energy storage is the ability to scale a
system’s energy and cost efficiently from ~100 kW to several MW power requirements,
while simultaneously meeting requirements such as longevity, safety, stability, and
reliability. Today, there are several large EES facilities in the Megawatt range around the
world which employ flowable electrochemical systems such as redox flow batteries
(RFBs) [9] or molten salt batteries (primarily Na/S) [10]. The recently reported semisolid
lithium flow cell (SSFC) [11, 12] shows tremendous potential as a scalable technological
solution for grid energy storage. It is characterized by a very high energy density
compared to Na/S or RFB systems. Unlike traditional (i.e., static) batteries, the unique
aspect of flow-assisted systems is the decoupling of energy and power ratings and, thus,
the system energy storage capacity. Supercapacitors show great promise to address load-
leveling, peak-shaving and grid stabilization issues because of their ability to charge and
discharge on the order of seconds. The energy storage mechanism is based on physical
energy storage via ion electrosorption in the electric double layer (EDL) at the interface
between the electrolyte and a solid electrode. Without electrochemical reactions,
supercapacitors provide ~10x higher power-density, ~100x faster charge/discharge rates,
and ~1000x longer lifetimes compared to current lithium ion batteries [13]. Although
using conventional supercapacitors are already considered in wind farms and solar farms
in conjunction with batteries, their high costs and moderate energy density are prohibitive
for widespread grid-scale implementation.
3
Recently, we reported a novel technology called the electrochemical flow
capacitor (EFC) that can overcome some of the major limitations of supercapacitors [14].
The EFC combines the scalable energy capacity of flow batteries with the high power
ratings of supercapacitors and provides decoupled power/energy handling. At the core of
the EFC is the utilization of a flowable capacitive slurry of porous carbon particles
suspended in an electrolyte. During operation, the slurry is charged through an
electrochemical flow cell and positively and negatively polarized slurry is stored in
separate reservoirs. From these reservoirs, the slurry can be reversibly pumped into
another electrochemical cell, where the material can be fully discharged for energy
recovery. It has been shown that the slurry maintains its capacitive energy storage during
pumping. The first prototype system was capable of storing energy with a columbic
efficiency of more than 98% [14]. The results obtained in this study indicate the potential
for significant performance improvements by slurry optimization. In this study, several
flowable capacitive slurry compositions are evaluated using electrochemical
characterization in a static configuration to establish a baseline for EFC operation. The
effects of the capacitive component solid fraction, particle size, and shape on the
electrochemical and rheological properties of the slurries are studied to explore strategies
for identification of an optimum slurry for EFCs.
1.1 Supercapacitor and EFC Metrics for Research and Development
Supercapacitor and EFC metrics involve energy density calculation and cycle life,
efficiency, and self-discharge measurement. In this work, flowable capacitive slurry
compositions are studied using electrochemical characterization in a static configuration
to establish a baseline for EFC operation. The effects of the capacitive component solid
4 fraction, particle size, and shape on the electrochemical and rheological properties of the
slurries are studied to explore strategies for identification of an optimum slurry
composition for EFCs.
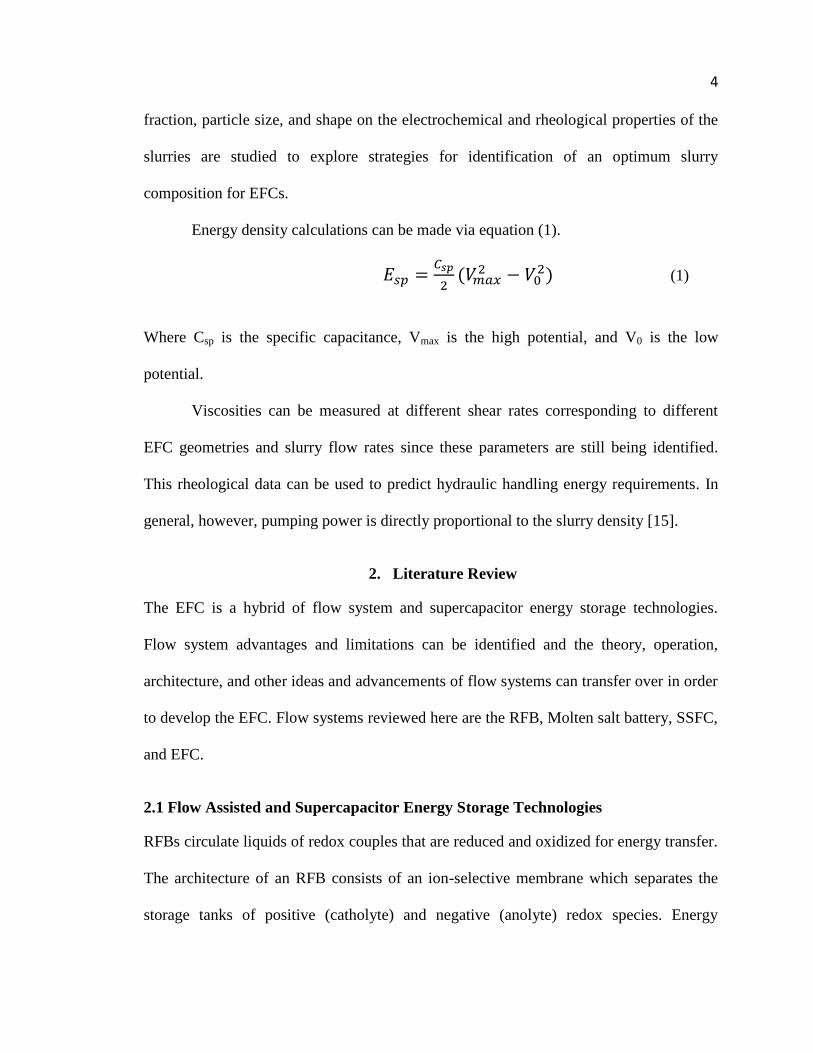
Energy density calculations can be made via equation (1).
(1)
Where Csp is the specific capacitance, Vmax is the high potential, and V0 is the low
potential.
Viscosities can be measured at different shear rates corresponding to different
EFC geometries and slurry flow rates since these parameters are still being identified.
This rheological data can be used to predict hydraulic handling energy requirements. In
general, however, pumping power is directly proportional to the slurry density [15].
2. Literature Review
The EFC is a hybrid of flow system and supercapacitor energy storage technologies.
Flow system advantages and limitations can be identified and the theory, operation,
architecture, and other ideas and advancements of flow systems can transfer over in order
to develop the EFC. Flow systems reviewed here are the RFB, Molten salt battery, SSFC,
and EFC.
2.1 Flow Assisted and Supercapacitor Energy Storage Technologies
RFBs circulate liquids of redox couples that are reduced and oxidized for energy transfer.
The architecture of an RFB consists of an ion-selective membrane which separates the
storage tanks of positive (catholyte) and negative (anolyte) redox species. Energy
5 transfer, a current or load, causes the redox-active ions to reduce or oxidize at the current
collector while counter ions not involved in the reaction (commonly Na+
and H+)
permeate through the membrane to maintain electroneutrality. Bipolar electrode stacks
are arranged and the electrolyte is pumped as needed for energy transfer.
Energy and power are decoupled in RFB systems and the reactions do not involve
electrolyte decomposition, phase transformations, and morphology changes common in
conventional batteries. Disadvantages include the requirement of flow related
infrastructure, solubility limitations, cycle lifetime due to membrane failure, and
economic and environmental costliness due to employing vanadium and zinc/bromine
chemistries [16].
Molten salt batteries have recently been developed as an EES technology from
Ford’s work in the 1960s on solid-state ionics. It was found sodium metal ions are highly
conductive in the liquid metal phase of sodium β-alumina (NaAl11O17), a thermally and
chemically stable solid with low electronic conductivity. Na/S and Na-metal chloride are
used as anode and cathode, respectively, with sodium β-alumina as the Na+
conducting
membrane separator. In discharge of the Na/S chemistry operating near 270 °C, Na is
oxidized at the solid electrolyte interface. Na+ diffuses to the S cathode forming a
polysulfide of Na2S5 in S. To charge, poly- Na2S5 oxidizes into the two phase liquid such
that the S concentration is limited to prevent excessive cell resistance by S deposition at
the electrolyte [17]. In metal chloride chemistries operating near 350 °C, Ni/NiCl2 are
used in the place of Na/S and NaAlCl4 is employed as the secondary electrolyte. A
similar fundamental mechanism allowing operations is based on structural changes
introduced in the electrolyte. Microstructural blocks of Al-O form in the electrolyte
6 forming conduction planes which allow for Na
+ diffusion along the O
2- ions bridging the
Al-O blocks [18].
Commercialization of Na/S has come about in Japan since 2002 for grid scale
applications due to high efficiency, small size, low maintenance requirements, and cycle
life. However, pristine β-alumina ceramic cost effective fabrication required to prevent
device failure has proven difficult. Other challenges involve thermal management and
sealing against highly corrosive S and polysulfides [16].
The recently introduced SSFC stems from solid state lithium battery technologies.
As found in solid state Li batteries, LiCoO2 and Li4Ti5O12 cathode material, carbon anode
material, and LiPF6 in organic solvent as electrolyte are used. However, suspensions of
nano and micro-scale cathode, anode, and conductive additive materials in electrolyte are
employed to make catholyte and anolyte. Intermittent flow operation shows a less than
1% energy discharge from hydraulic handling [12].
As in RFBs, flow infrastructure is required, but the cell channels are narrower due
to the suspension’s low electronic conductance. The concentration of active material in
the SSFC exceeds that of RFBs, but viscosity is likely to become a significant issue as
loading is increased. Advantages of the SSFC include the decoupling of power and
energy, a simpler manufacturing process excluding the film and cell fabrication
infrastructure needed to make conventional batteries, and versatility which could employ
aqueous chemistries. Disadvantages include the slow diffusion kinetics of Li+
in organic
electrolyte, the short cycle life due to phase transformations and side reactions, and the
economic and environmental cost of the components.
7
In a supercapacitor, a commercial name ascribed to various systems that can use
different active materials (carbon, oxides and/or conducting polymers), energy is stored
at the electrolyte–carbon interface through reversible ion adsorption onto the carbon
surface forming the so-called ‘double-layer’ of capacitance. The double-layer capacitance
was first defined by Helmholtz (1879) and later refined by Gouy & Chapman and Stern
& Geary. Capacitance is defined by equation (2)
(2)
where ε is the electrolyte dielectric constant, A the surface area accessible to ions and d
the distance between the center of the ion and the carbon surface. Increasing the electrode
surface area does not necessarily increase the capacitance. Factors such as pore size
distribution, wettability, and electrolyte type affect whether or not the surface area is
used.
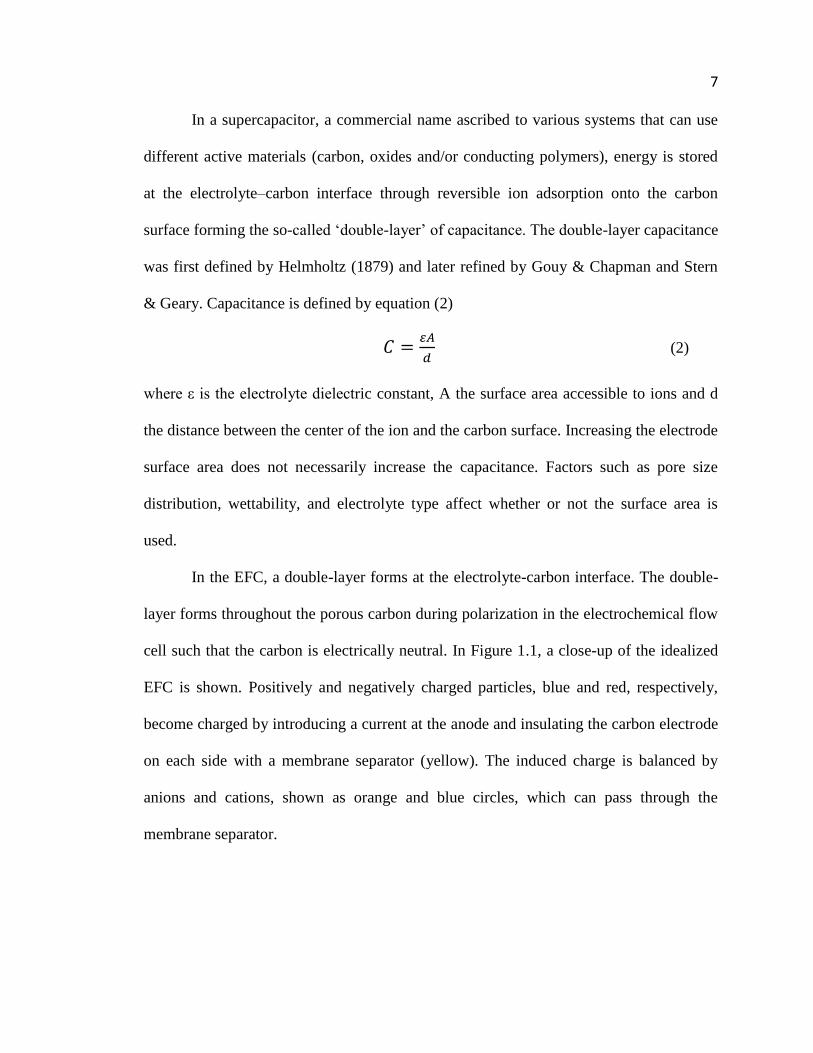
In the EFC, a double-layer forms at the electrolyte-carbon interface. The double-
layer forms throughout the porous carbon during polarization in the electrochemical flow
cell such that the carbon is electrically neutral. In Figure 1.1, a close-up of the idealized
EFC is shown. Positively and negatively charged particles, blue and red, respectively,
become charged by introducing a current at the anode and insulating the carbon electrode
on each side with a membrane separator (yellow). The induced charge is balanced by
anions and cations, shown as orange and blue circles, which can pass through the
membrane separator.
8
Figure 2.1 EFC Operation
The ion adsorption process in the EFC allows for the high power density and long
cycle lifetime, but it limits energy density likely leading to a large EFC size. The EFC,
using materials with low economic and environmental cost has been proposed and
investigated as a supercapacitor concept with an improved energy density.
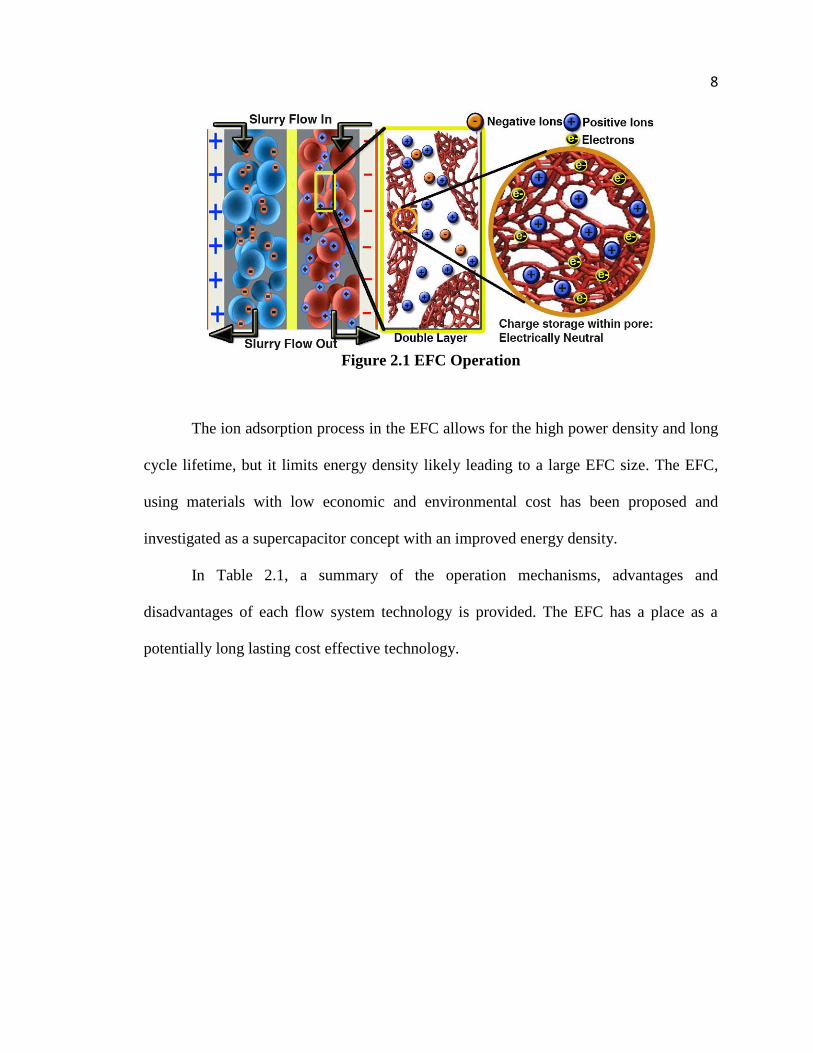
In Table 2.1, a summary of the operation mechanisms, advantages and
disadvantages of each flow system technology is provided. The EFC has a place as a
potentially long lasting cost effective technology.
9
Table 2.1 Flow System Characteristics
RFB Molten Salt SSFC EFC
Mechanism Soluble redox
couple solutions
circulated
through flow
cell with
selective
membrane
Molten metal
anode is
oxidized and
ions diffuse
quickly through
molten ceramic
porous
separator to
reversibly form
an oxide
Lithium
cathode is
reduced causing
lithium to
diffuse through
a membrane
and intercalate
into a carbon
anode
Ions adsorb
onto charged,
separated
carbon
electrodes to
maintain
electroneutrality
Advantages Longer cycle
life than
conventional
batteries
Small size,
long cycle life,
no need for
hydraulic
handling
Small size due
to potential high
concentration of
active material
Long cycle life,
low material
economic and
environmental
cost
Disadvantages Solubility limit
at low temp.,
shorter cycle
life due to
electrolyte
stability and
membrane
failure, and high
economic and
environmental
cost
Manufacturing
pristine
ceramic
membrane,
thermal
management
and sealing
against highly
corrosive
components
Slow diffusion
kinetics of Li+
in organic
electrolyte,
shorter cycle
life, high
material
economic and
environmental
cost
System size is
likely larger
than others due
to lower energy
density
2.1 Supercapacitor and Flowable Slurry Static Cell Configuration
The basic components in a supercapacitor are the 10 to several hundred micron thick
electrodes [19] (interchangeable anode and cathode in symmetric systems), electrolyte,
membrane separator, and current collectors. The electrode in supercapacitors is
commonly carbonaceous while the electrolyte is a mixture of a salt and solvent which has
10 a high ionic and low electronic conductivivity. The membrane separator is, in most
systems, polymeric.
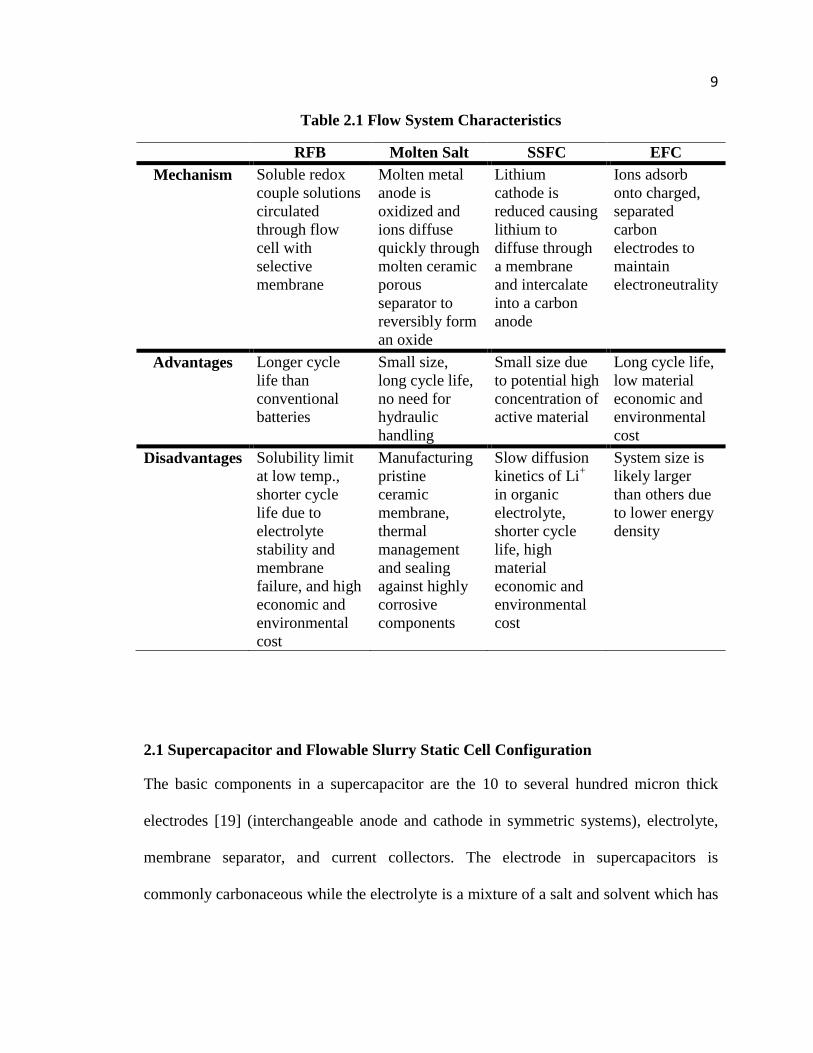
In an EFC, the primary difference is that the electrode and electrolyte are mixed
forming a slurry which can be charged and stored for later discharge as needed. In Figure
2.2 below, the electrodes are shown as spherical particles as are the salt cation and anions
that form the double layer (the exclusion of anions at the anode and cations at the cathode
is an exaggeration, both are present at each electrode but an excess of the oppositely
charged ion at the electrode surface is in the double layer). The electrode thickness in an
EFC is generally larger than in conventional supercapacitors to minimize pumping power.
Figure 2.2 EFC Cell Components
The electrode is charged and discharged by electron transfer. The electrode should
have a low electrical resistance to maximize efficiency by minimizing the shunt current
and remain low in cost. High surface area for ion adsorption and large enough pore size
for quick ion diffusion are needed to increase capacitance and power. Chemical stability

11 of the electrode and wettability in the electrolyte are also important for cycle life and
flow.
The function of the electrolyte is to balance the charge developed in the electrode.
Solubility, ion size, chemical stability, and oxidation state of the salt affect EFC
performance. In addition, ionic conductivity of the salt, electronic conductivity, chemical
stability, viscosity, and cost of the salt media affect EFC performance.
The function of the membrane separator is to insulate the electrodes to prevent
shorting across the electrodes while allowing ions to freely transfer to maintain
electroneutrality. The membrane pore size must allow quick diffusion, but prevent
fouling and particle transport that could form a bridge between electrodes. In an EFC,
membrane separator cost is minimized in comparison to supercapacitor banks with
equivalent energy densities due to the storage of charged electrodes apart from the
electrochemical cell.
The current collector must be conductive to minimize shunt current losses. It must
also be chemically stable in the applied potentials that corrode many conductive metals.
Cost of the current collector is also minimized due to the storage of charged electrodes.
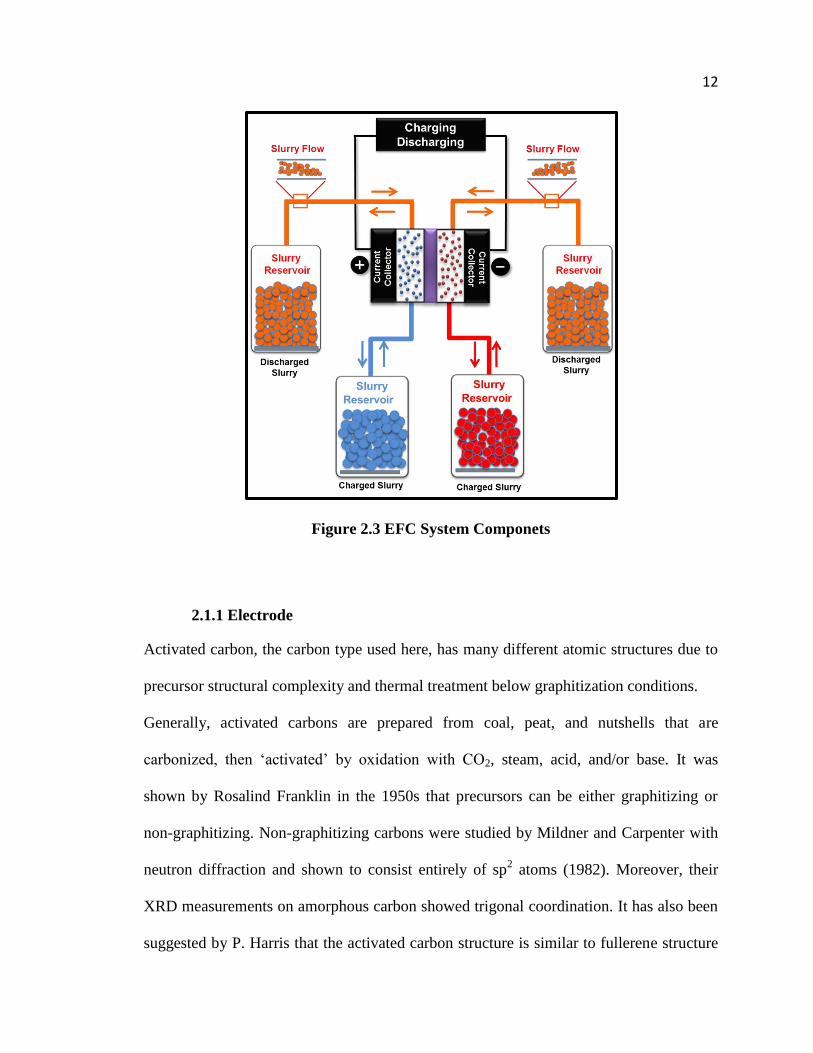
The complete EFC requires hydraulic handling. At least four separate reservoirs
for charged and uncharged slurry, pumps and tubing for slurry flow, valves for slurry
batch charging to prevent shunt currents, and an electrochemical cell with the
components shown in Figure 2.2 are needed by an EFC system type shown in Figure 2.3.
12
Figure 2.3 EFC System Componets
2.1.1 Electrode
Activated carbon, the carbon type used here, has many different atomic structures due to
precursor structural complexity and thermal treatment below graphitization conditions.
Generally, activated carbons are prepared from coal, peat, and nutshells that are
carbonized, then ‘activated’ by oxidation with CO2, steam, acid, and/or base. It was
shown by Rosalind Franklin in the 1950s that precursors can be either graphitizing or
non-graphitizing. Non-graphitizing carbons were studied by Mildner and Carpenter with
neutron diffraction and shown to consist entirely of sp2 atoms (1982). Moreover, their
XRD measurements on amorphous carbon showed trigonal coordination. It has also been
suggested by P. Harris that the activated carbon structure is similar to fullerene structure
13 with curved sheets of carbon in hexagonal and pentagonal rings. This sp
2 structure leaves
electrons in pi bond orbitals perpendicular to the sheet allowing for electrical conduction.
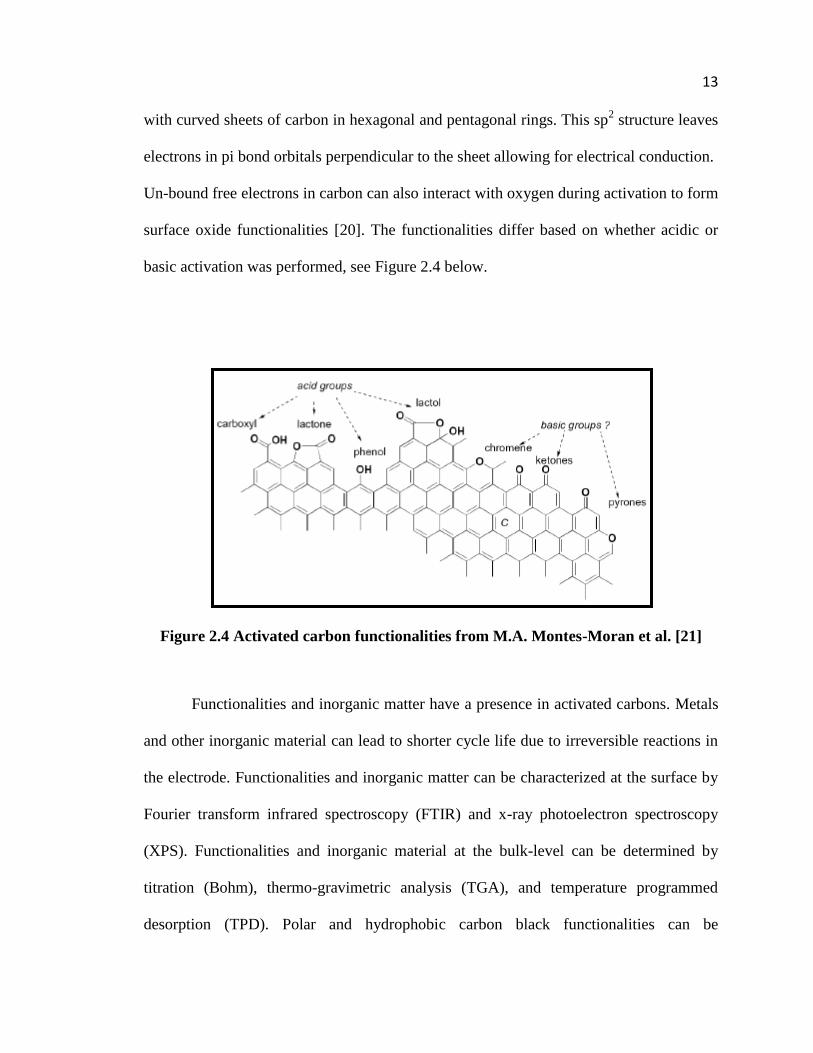
Un-bound free electrons in carbon can also interact with oxygen during activation to form
surface oxide functionalities [20]. The functionalities differ based on whether acidic or
basic activation was performed, see Figure 2.4 below.
Figure 2.4 Activated carbon functionalities from M.A. Montes-Moran et al. [21]
Functionalities and inorganic matter have a presence in activated carbons. Metals
and other inorganic material can lead to shorter cycle life due to irreversible reactions in
the electrode. Functionalities and inorganic matter can be characterized at the surface by
Fourier transform infrared spectroscopy (FTIR) and x-ray photoelectron spectroscopy
(XPS). Functionalities and inorganic material at the bulk-level can be determined by
titration (Bohm), thermo-gravimetric analysis (TGA), and temperature programmed
desorption (TPD). Polar and hydrophobic carbon black functionalities can be
14 characterized by microcalorimetric measurements related to the heat of reaction for
preferential adsorption of n-butanol (polar sites) and n-dotriacotane, C32H66 on carbon in
n-heptane [22].
The pi electrons in activated carbons repel oxygen atoms in water making the
material hydrophobic. However, chemisorbed oxygen introduced from water by the
application of mild heat (below 100 °C) makes carbon hydrophilic, dispersing the
particles in solution. Carboxylic surface group dissociation induces a negative surface
charge also contributing to dispersion. However, surface oxides introduce irreversible
electrochemical redox reactions that reduce supercapacitor lifetime and worsen rate
performance.
Activated carbons can be modified to form oxide functionalities by thermal
oxidation, acid treatment [23], plasma oxidation, and chemical treatments. Oxides
introduce reversible faradaic reactions at the surface increasing energy density and
increased wettability of the electrode. Transition metal oxides such as manganese oxide
can also be introduced by spontaneous redox reactions with oxidants such as potassium
permanganate [24].
Other surface treatments involve growth of polymer films on the carbon surface.
The Li-Chyong Chen group fabricates supercapacitors with PEDOT and polyaniline
(PANI) [25]. PEDOT is deposited electrochemically and polyaniline by CVD on
nitrogen-containing carbon nanotubes (CNxNTs) so that a coaxial nanocomposite forms
with a shell thickness of ~30-50 nm. Increase in capacitance was observed over CNxNTs
without PEDOT due to the pseudocapacitve contribution PEDOT has. C. Lei et al
mechanically blended PEDOT-PSS colloid with activated carbon and saw an increase in
15 capacitance at an optimized weight ratio of 5:100 (10:100 was too high), PEDOT: total
carbon, but increase in internal resistance when PEDOT-PSS substituted PVDF binder in
film EDLCs [26].
Although oxides and polymer films and redox additives increase energy density,
they can decrease rate performance. Adsorption is substituted by chemical bonds which
can lead to increased resistance and shorter cycle life due to the occurrence of irreversible
reactions. Thus, a balance between EFC energy density and cycle life is necessary.
Rheological and electrochemical studies have shown the size, size distribution
and shape of the activated carbon particle affect the viscosity of the EFC slurry and
percolation of current.
2.1.1.1 Anisometric Activated Carbon
The majority of activated carbons used in supercapacitors have no uniform shape at the
micro-scale—they are anisometric. The size of common anisometric carbons can be
catered to minimize slurry viscosity and increase percolation without decreasing
capacitance by simultaneously decreasing surface area.
2.1.1.2 Spherical Activated Carbon
Precursors for spherically shaped carbon vary depending on the synthesis method, but are
generally different from traditional activated carbon synthesis.
The spherical carbons used here are derived from liquid phenol/formaldehyde
resins. They are prepared in an immiscible liquid with an organic template such that heat
from the immiscible liquid suspending the liquid precursor templated in a mesoporous
structure causes the liquid precursor droplets to crosslink into polymer beads. The
16 polymer beads are carbonized and cleaned with an oxidizing gas. Oxidation does not
remove as much carbon due to the presence of mesopores from the templating process.
The precursor can include nitrogen and metal impregnation can be done before
carbonization for even dispersion. Vacuum graphitization followed by activation is
required for conductive activated carbon synthesis, but small particles will more quickly
lose their spherical shape or oxidize into CO and CO2 during activation.
2.1.1.3 Activated Carbon and Redox Additive
Redox active additives can be added to carbon in order to increase electrode capacitance.
Roldan et al have added hydroquinone, one example of a redox active additive, to acidic
electrolyte to increase capacitance by introducing redox reactions in film based devices
[27]. Due to the higher fraction of electrolyte in the EFC, an even greater improvement in
performance is expected. High concentrations are also likely to improve the wettability of
carbon due to its benzyllic structure and polar OH groups.
2.1.2 Electrolyte
Aqueous, organic, ionic liquid, and polymcr based electrolytes can be employed in
supercapacitors. Each type has characteristics which may be favorable for the EFC. The
function of the electrolyte is to balance the charge developed in the electrode. Solubility,
ion size, chemical stability, and oxidation state of the salt affect EFC performance. In
addition, ionic conductivity of the salt, electronic conductivity, chemical stability,
viscosity, and cost of the salt media affect EFC performance.
17
2.1.2.1 Aqueous
Water based electrolyte is attractive due to its low cost, low viscosity, high heat capacity,
neutrality, and ionic conductivity and dissolution ability of sulfate salts. Water has a
limited chemical stability due to the hydrolysis reaction. Because energy density is
related to the square of the potential by equation (2), chemical stability is a significant
issue. Fic et al have identified sulfates able to increase the stable potential window of
water beyond the electrolysis potential of 1.23 V [28].
Sulfuric acid is also used for its high ionic conductivity, but its use is not practical
for the EFC due to the corrosiveness and toxicity of the large quantities that would be
needed in an EFC.
2.1.2.2 Organic
Organic electrolytes such as tetra-ethyl ammonium tetra-fluoro-borate (TEA-BF4) in
propylene carbonate and/or acetonitrile are used in commercial supercapacitors. Both
propylene carbonate and acetonitrile have a larger stable potential window than aqueous
systems (up to 2.7 V) and carbon easily dissolves into organic phases, but both solvents
are costly. A controlled atmosphere devoid of oxygen and water at the ppm level is
required for slurry mixing and the EFC must be completely sealed to maintain cycle life
since water and oxygen lead to irreversible reactions in these chemistries. Moreover, the
low ionic conductivity and high viscosity of propylene carbonate is likely unfavorable for
the EFC. Acetonitrile is also unfavorable due to its toxicity and flammability despite its
much higher ionic conductivity and lower viscosity than propylene carbonate.
18
2.1.2.3 Ionic Liquid
Ionic liquids such as 1-ethyl-3-methyl imidazolium bis(trifluoro-methyl-sulfonyl)-imide
(EMIM-TFSI) have been used as a liquid phase salt electrolyte without the solvent [29].
Potential stability windows are even greater for ionic liquids (up to 5 V) and EFC
operation could be possible in extreme temperatures from -50-100 °C with ionic liquid
mixtures that prevent phase change from liquid to solid by halting crystallization [30].
However, current ionic liquid production volume is too low and the cost is too high for
use in the EFC.
3. Materials and Experimental Methods
3.1 Materials
Porous activated carbons were used as the electrode material. Several sizes and shapes of
porous carbons were used and the effects of acid treatment and thermal oxidation were
studied. Aqueous (main electrolyte type studied), organic, and ionic liquids were
employed as electrolyte.
3.1.1 Porous Carbon Electrodes
Phenolic resin derived spherical porous carbon particles (activated carbon beads, Mast
Carbon, UK) and activated carbon (YP-50F, Kuraray Chemical Company, USA) were
used as the active capacitive material in the slurry electrodes. Carbon beads (referred to
as CB) with three different particle size distributions were tested, namely; MAST micro
beads (CB1; average particle size: 9±4 µm), MAST 125/250 (CB2; average particle size:
161±35 µm) and MAST 250/500 (CB3; average particle size: 385±53 µm). The micro-
particulate anisometric activated carbon (AC; particle size 5-20 µm) was used to enable
19 comparison of the tested slurries with a commonly used, inexpensive material for
conventional supercapacitors. Carbon black (100% compressed; Alfa Aesar, USA) was
also used as conductive additive in the tested slurries.
3.1.1.1 Electrode modification
CB2 porous carbon was thermally oxidized and treated with acid to introduce oxide
functionalities at the surface. Oxides at the surface increase energy density and
wettability.
Thermally oxidized CB2 was obtained through heating in air to 500 °C for 5 hours.
Acid treated CB2 was obtained by reflux in strong acid and rinsing with deionized (DI)
water. Specifically, immersion of CB2 into a 20 mL H2SO4/HNO3 (1:1) solution in a
round-bottomed glass flask was done. Followed by the immersion was evaporation of
water by heating to 110 °C then washing with DI water until a neutral pH was reached.
Finally, the modified CB2 was dried at 90 °C for 12 h.
3.1.2 Electrolyte
Aqueous based electrolyte consisted of sodium sulfate (Sigma) in DI water (the main
electrolyte type studied). This electrolyte type has high ionic conductivity, capability of
operating in a large potential window and low economic and environmental cost making
it an EFC electrolyte candidate. TEA-BF4 in propylene carbonate (Sigma), the organic
electrolyte studied, has a large potential window but low conductivity and high economic
and environmental cost.
20 Sodium sulfate aqueous electrolyte was combined with varying concentrations of
redox additive hydroquinone (Sigma). Care was taken to prevent decomposition in water
due to exposure to light and heat.
3.2 Testing System
A non-optimized static cell consisting of the components shown in Figure 2.1 was
employed. The electrode thickness in the static cell used is greater than the electrode
thickness in conventional supercapacitors. In addition, the solid fraction was much lower
since the electrode is flowable. Various flowable solid fractions were tested.
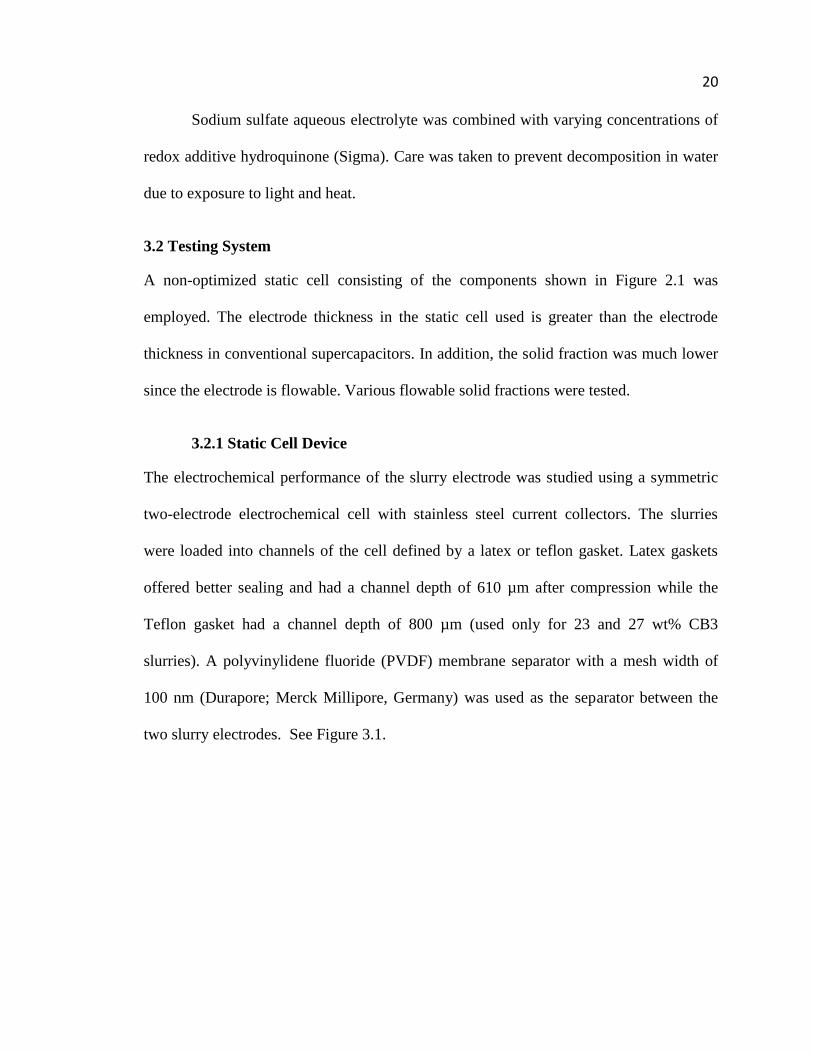
3.2.1 Static Cell Device
The electrochemical performance of the slurry electrode was studied using a symmetric
two-electrode electrochemical cell with stainless steel current collectors. The slurries
were loaded into channels of the cell defined by a latex or teflon gasket. Latex gaskets
offered better sealing and had a channel depth of 610 µm after compression while the
Teflon gasket had a channel depth of 800 µm (used only for 23 and 27 wt% CB3
slurries). A polyvinylidene fluoride (PVDF) membrane separator with a mesh width of
100 nm (Durapore; Merck Millipore, Germany) was used as the separator between the
two slurry electrodes. See Figure 3.1.
21
Figure 3.1 Static Cell
The carbon content in the cells varied between 24-41 mg per electrode for solid
fractions of 16-27 wt% due to density differences between slurries with different carbon
loadings. However, the carbon content was made the same among the different porous
carbon particles at each solid fraction.
3.3 Slurry Preparation
The porous carbon and a conductive additive were mixed with electrolyte to obtain a
slurry electrode. For aqueous slurries, bubbling was necessitated.
3.3.1 Carbon and Electrolyte Mixing
To prepare the slurries, the selected porous carbon particles were first mixed with carbon
black at a ratio of 9:1.
Current collector
610 µm thick gasket
(1 cm2
inset)
Membrane separator
Current collector
610 µm thick gasket
(1 cm2
inset)
22
For aqueous electrolyte, 1 M Na2SO4 was added to achieve the desired solid
fraction. The mixture was mildly heated and stirred to achieve homogenous slurries with
solid fractions varying from 16 to 27 wt%. To remove dissolved oxygen, slurries were
bubbled with argon gas for two hours before electrochemical testing. During all
preparation steps the solid fraction of the slurry was kept constant by addition of DI water
as needed.
For organic electrolyte, the components were handled in an argon filled glove
box. TEA-BF4 was added to propylene carbonate to make a 1 M solution. Carbon was
then added to make a 26 wt% CB2 slurry and 19 and 26 wt% CB1 slurry.
3.4 Material Characterization
Material characterization was carried out using gas sorption for surface area and pore
analysis, scanning electron microscopy (SEM) for qualitative shape and quantitative size
analysis, and Raman spectroscopy for structural analysis. Slurry electrodes were
characterized using electrochemical and rheological techniques. Gas sorption was carried
out in a Quadrasorb gas sorption instrument (Quantachrome, USA), SEM with a Zeiss
Supra 50VP scanning electron microscope (Carl Zeiss AG, Germany), and Raman
spectra of porous carbons were taken using a Renishaw 2000 Raman microspectrometer
with an Ar ion laser (514.5-nm excitation wavelength).
3.4.1 Gas Sorption
Gas sorption was done with nitrogen gas to determine the specific surface area (SSA) and
pore size distribution. Volume-weighted pore size was derived from the cumulative pore
23 volume via assuming slit-shaped pores and quenched-solid density functional theory
(QSDFT) deconvolution of N2-sorption isotherms (-196 °C) [31].
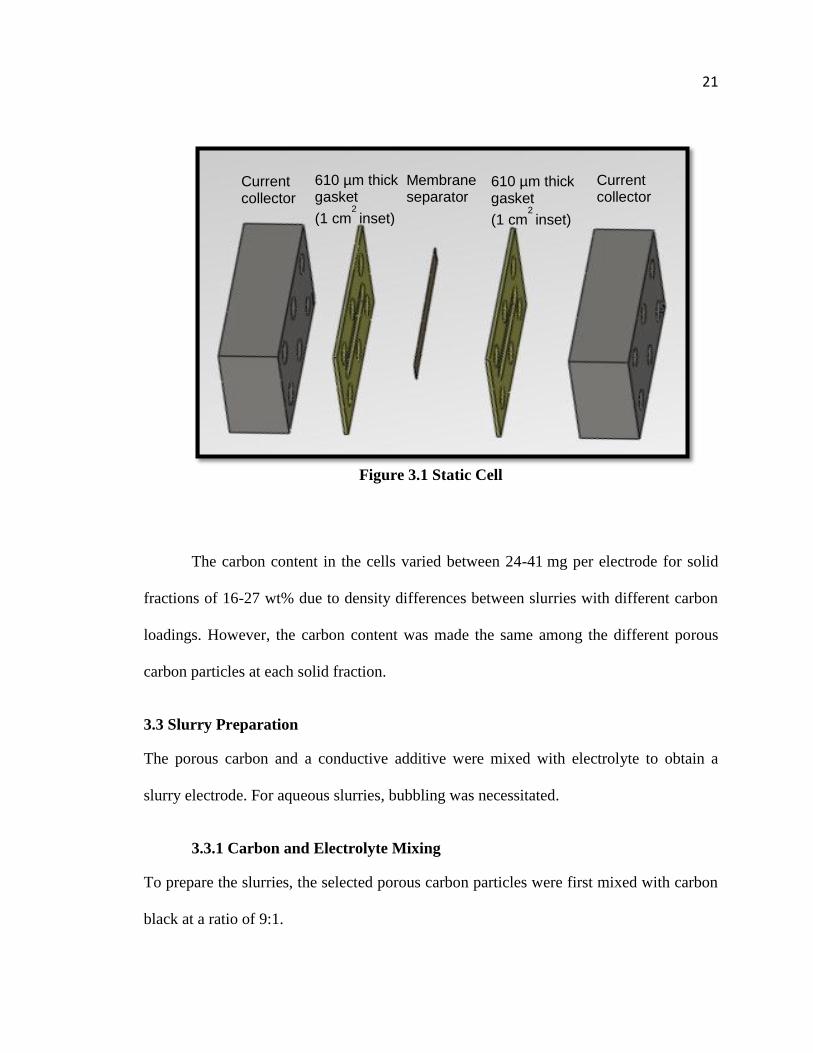
The Brunauer-Emmett-Teller (BET) method was used to derive the specific
surface area (SSA) [32]. The average pore size calculated was the volume-weighted, 50%
of the total pore volume is associated with pores either smaller or larger than this value.
CB1 has a BET SSA of 1127 m2 g
-1 (Table 3.1) and an average volume-weighted pore
size of 7.8 nm. CB2 has a slightly larger BET SSA of 1576 m2 g
-1 and an average
volume-weighted pore size of 4.7 nm. CB3 has a slightly lower BET SSA than CB2,
1219 m² g-1
and an average volume-weighted pore size of 6.5 nm. AC had a BET surface
area of 1472 m² g-1
average volume-weighted pore size of 1.26 nm.
Table 3.1 Physical Characteristics of Porous Carbon Particles
Porous
carbon
BET SSA
(m2 g-1)
DFT SSA
(m2 g-1)
ØPore
(nm)
ØParticle
(µm)
CB1 1127 1122 7.8 9 ± 4
CB2 1576 1542 4.7 161 ± 35
CB3 1219 1195 6.5 385 ± 53
AC 1472 1323 1.3 5-20
The pore diameter distribution is similar for all CB carbon particles with micro
and mesopores (Figure 3.2). However, CB2 shows a slightly higher peak for small
diameters than CB1 and CB3. AC does not have a significant distribution of mesopores.
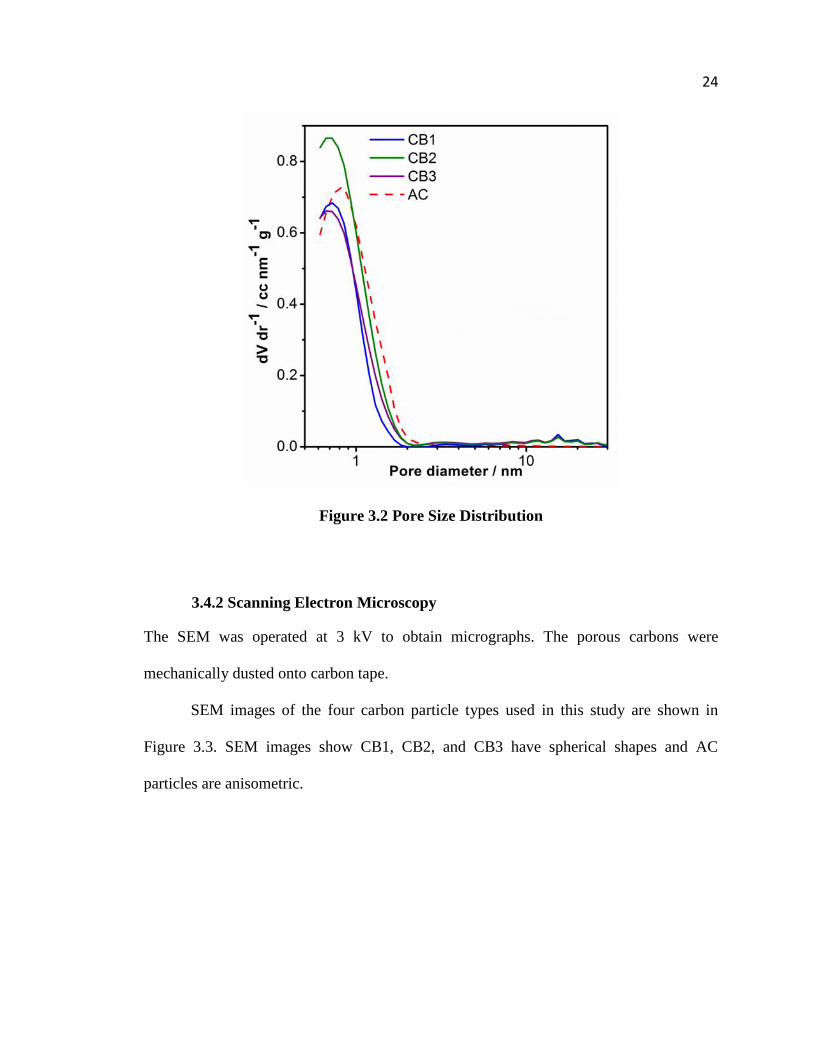
24
Figure 3.2 Pore Size Distribution
3.4.2 Scanning Electron Microscopy
The SEM was operated at 3 kV to obtain micrographs. The porous carbons were
mechanically dusted onto carbon tape.
SEM images of the four carbon particle types used in this study are shown in
Figure 3.3. SEM images show CB1, CB2, and CB3 have spherical shapes and AC
particles are anisometric.
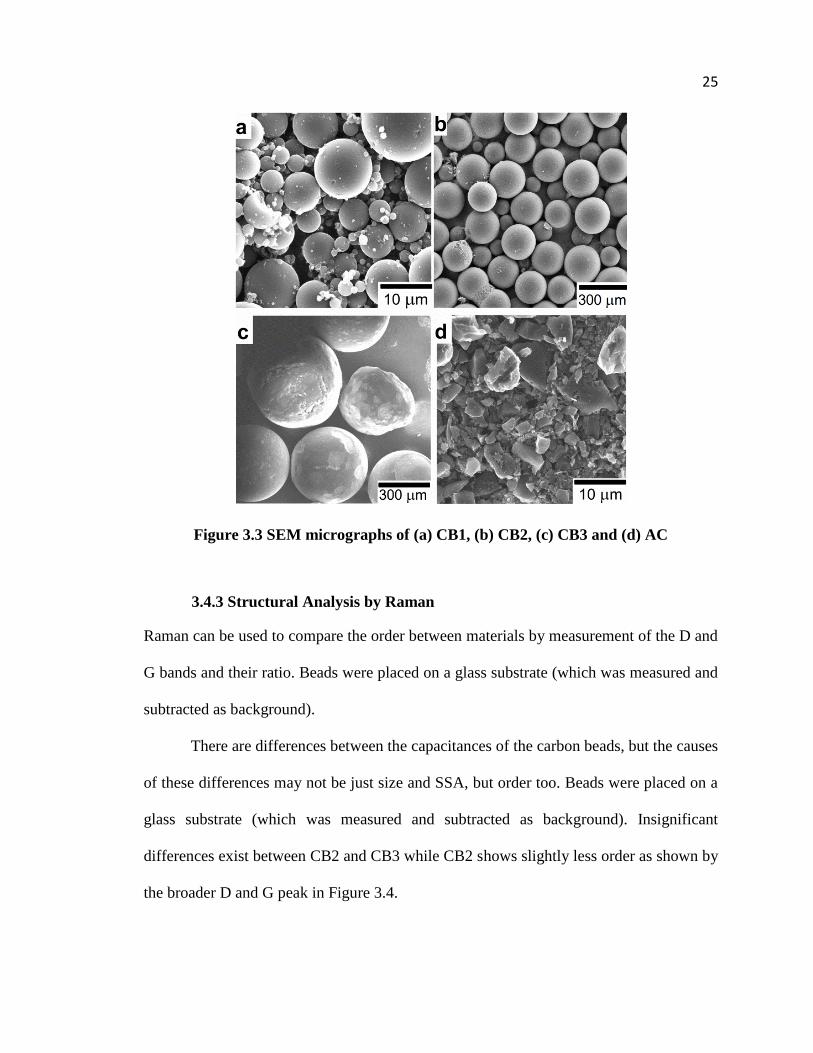
25
Figure 3.3 SEM micrographs of (a) CB1, (b) CB2, (c) CB3 and (d) AC
3.4.3 Structural Analysis by Raman
Raman can be used to compare the order between materials by measurement of the D and
G bands and their ratio. Beads were placed on a glass substrate (which was measured and
subtracted as background).
There are differences between the capacitances of the carbon beads, but the causes
of these differences may not be just size and SSA, but order too. Beads were placed on a
glass substrate (which was measured and subtracted as background). Insignificant
differences exist between CB2 and CB3 while CB2 shows slightly less order as shown by
the broader D and G peak in Figure 3.4.
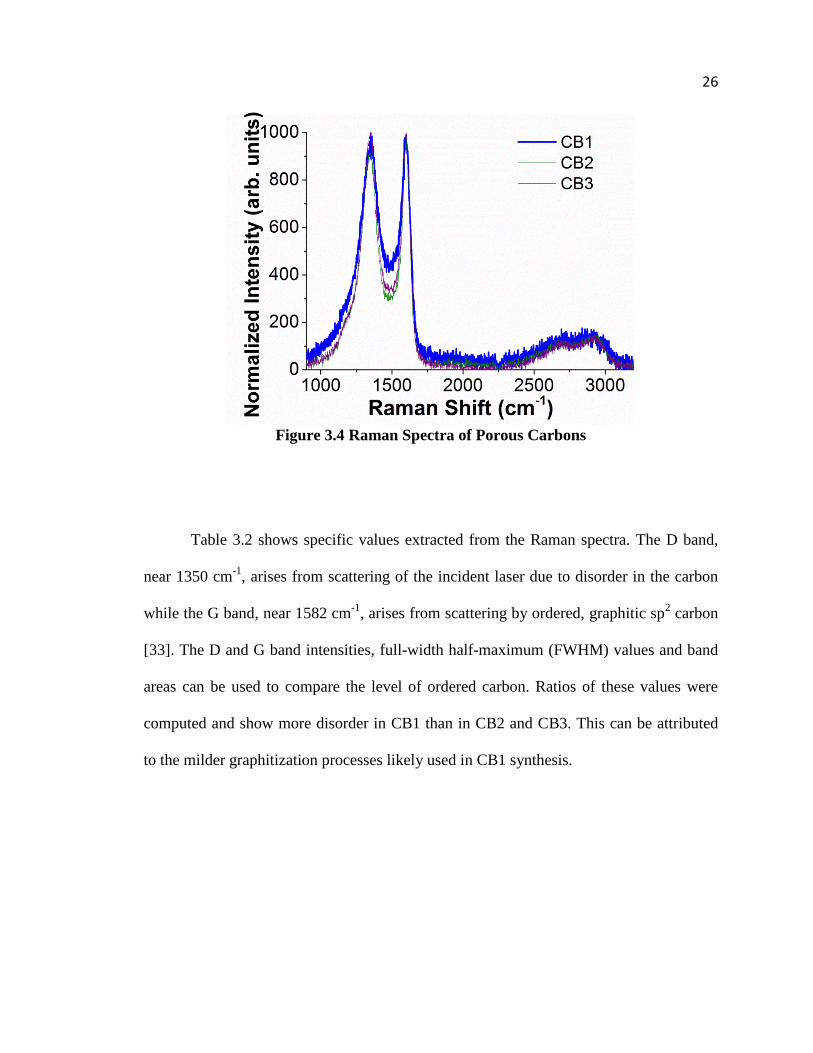
26
Figure 3.4 Raman Spectra of Porous Carbons
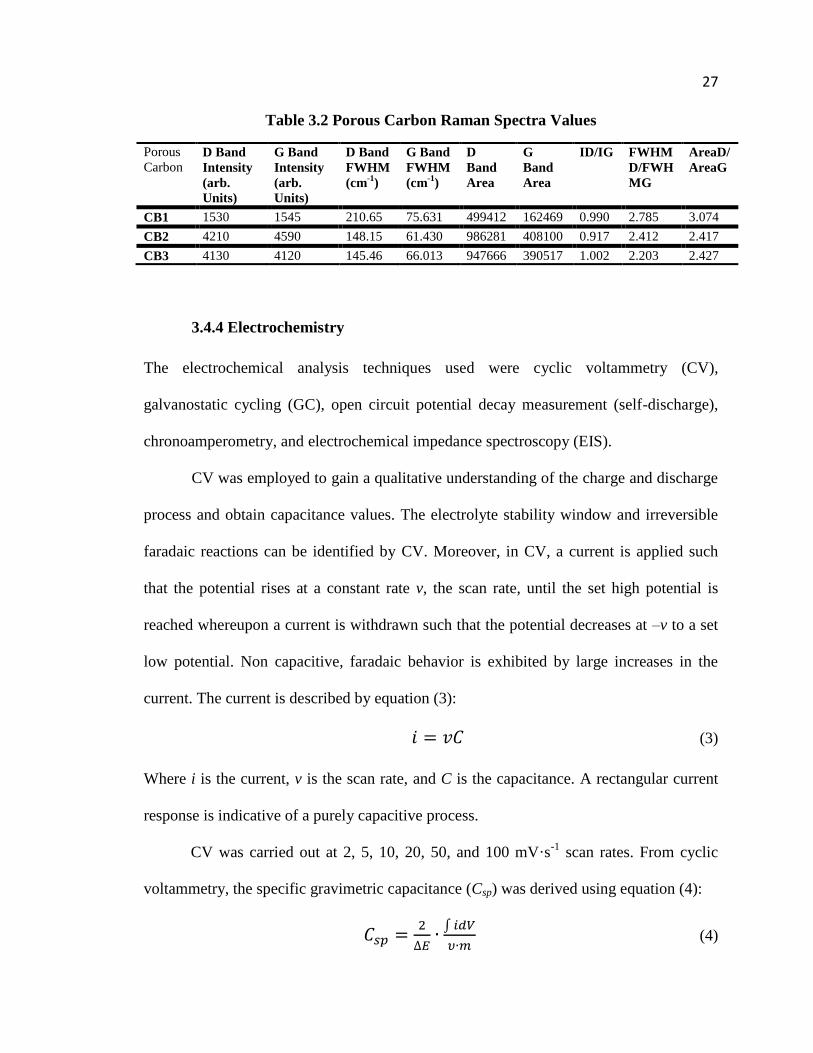
Table 3.2 shows specific values extracted from the Raman spectra. The D band,
near 1350 cm-1
, arises from scattering of the incident laser due to disorder in the carbon
while the G band, near 1582 cm-1
, arises from scattering by ordered, graphitic sp2 carbon
[33]. The D and G band intensities, full-width half-maximum (FWHM) values and band
areas can be used to compare the level of ordered carbon. Ratios of these values were
computed and show more disorder in CB1 than in CB2 and CB3. This can be attributed
to the milder graphitization processes likely used in CB1 synthesis.
27
Table 3.2 Porous Carbon Raman Spectra Values
Porous
Carbon D Band
Intensity
(arb.
Units)
G Band
Intensity
(arb.
Units)
D Band
FWHM
(cm-1
)
G Band
FWHM
(cm-1
)
D
Band
Area
G
Band
Area
ID/IG FWHM
D/FWH
MG
AreaD/
AreaG
CB1 1530 1545 210.65 75.631 499412 162469 0.990 2.785 3.074
CB2 4210 4590 148.15 61.430 986281 408100 0.917 2.412 2.417
CB3 4130 4120 145.46 66.013 947666 390517 1.002 2.203 2.427
3.4.4 Electrochemistry
The electrochemical analysis techniques used were cyclic voltammetry (CV),
galvanostatic cycling (GC), open circuit potential decay measurement (self-discharge),
chronoamperometry, and electrochemical impedance spectroscopy (EIS).
CV was employed to gain a qualitative understanding of the charge and discharge
process and obtain capacitance values. The electrolyte stability window and irreversible
faradaic reactions can be identified by CV. Moreover, in CV, a current is applied such
that the potential rises at a constant rate v, the scan rate, until the set high potential is
reached whereupon a current is withdrawn such that the potential decreases at –v to a set
low potential. Non capacitive, faradaic behavior is exhibited by large increases in the
current. The current is described by equation (3):
(3)
Where i is the current, v is the scan rate, and C is the capacitance. A rectangular current
response is indicative of a purely capacitive process.
CV was carried out at 2, 5, 10, 20, 50, and 100 mV·s-1
scan rates. From cyclic
voltammetry, the specific gravimetric capacitance (Csp) was derived using equation (4):
∫
(4)
28 where ΔE is the width of the voltage window, i is the discharge current, V is the voltage,
and m is the mass of carbon in one electrode. The factor of 2 accounts for the two
electrode setup, where the charge is evenly distributed between two capacitors in series
[19].
The Csp was also calculated from GC, a more quantitative method due to its
galvanostatic character similar to that required in applications, using equation (4):
(4)
where dV/dt is the slope of the discharge curve starting from the bottom of the IR drop to
half of the high potential, Vmax [19]. The equivalent series resistance (ESR) of the cell is
determined by dividing the total change in voltage of the IR drop in a GC with the total
change in current.
All values for the capacitance were normalized by the weight of the carbon
material, not the total slurry mass, to enable a direct comparison with conventional
supercapacitor electrodes (which are also normalized to the content of active material).
Self-discharge measurement was done after pre-cycling, discharging by applying
a potential of 0 V for 5 min followed by applying a current until the desired potential was
reached and holding at that potential for a certain time. After this potentiostatic,
galvanostatic, and second potentiostatic treatment, no load was applied except for voltage
probing. The voltage decays depending on the RC constant due to ion redistribution.
Chronoamperometry was employed to obtain an equilibrated capacitance [34].
After a discharge period, the cell was charged to a certain cell potential for a given time
and then discharged to for an equivalent time on the order of 5 min. While the current
29 that was measured during charging was superimposed by the leakage current of the
system, integration of the discharge curve directly yielded the charge of the two-electrode
setup. The capacitance was extracted from the discharge curves via equation (5).
∫
(5)
EIS was performed by applying a 10 mV RMS sine wave at frequencies
increasing from 10 kHz to 100 mHz. The signal response can be separated into a real (Z’)
in phase impedance corresponding to the resistance part of the reactance and imaginary
(Z”) impedance, which is 90º out of phase with the applied signal. Resistance can be
obtained from high frequency while low frequency data can be used to understand slower
processes such as ionic diffusion in small pores.
3.4.5 Rheometry
Flow characteristics of different fluids are described with Newton’s law and other
modified Newtonian models with:
(6)
(7)
(8)
(9)
Where τ is the shear stress, μN is the Newtonian viscosity—the ratio of stress to shear
rate—and du/dr is the shear rate. For pseudoplastic and dilatant fluids described by (7), K
and n are material constants. For n<1, the fluid is pseudoplastic and for n>1, it is dilatant.
30 For Bingham plastic fluids, described by (8), and for Hershel-Bulkley fluids described by
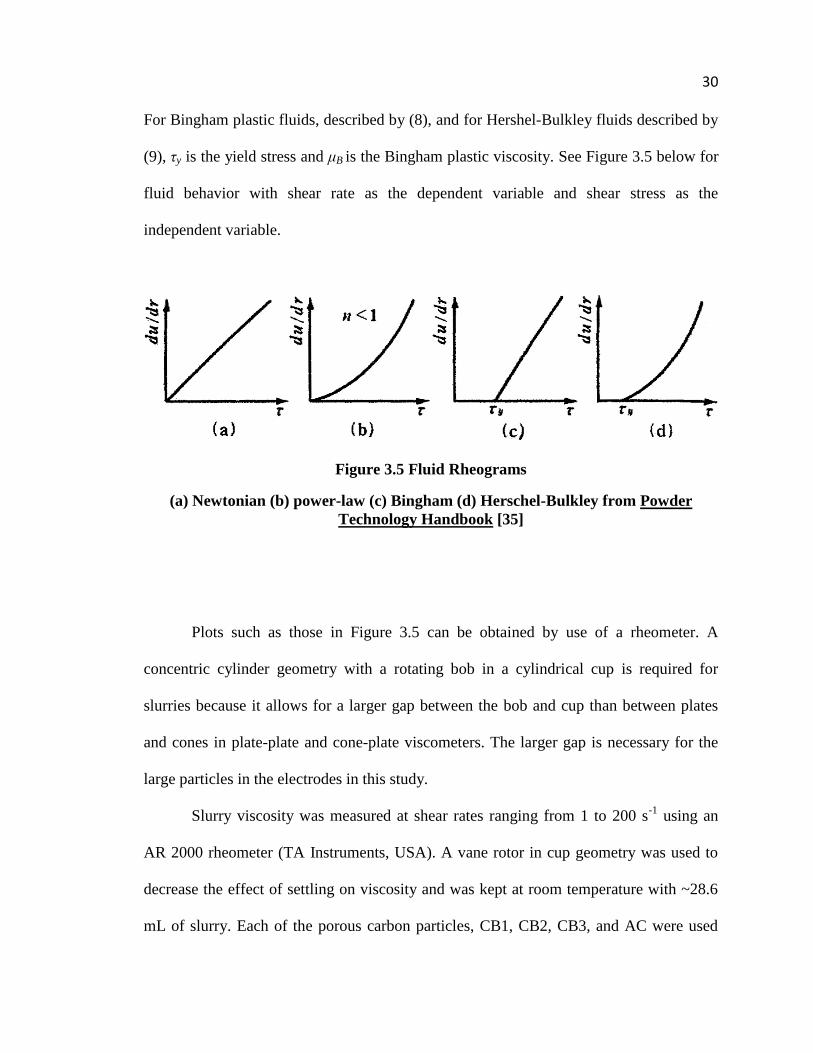
(9), τy is the yield stress and μB is the Bingham plastic viscosity. See Figure 3.5 below for
fluid behavior with shear rate as the dependent variable and shear stress as the
independent variable.
Figure 3.5 Fluid Rheograms
(a) Newtonian (b) power-law (c) Bingham (d) Herschel-Bulkley from Powder
Technology Handbook [35]
Plots such as those in Figure 3.5 can be obtained by use of a rheometer. A
concentric cylinder geometry with a rotating bob in a cylindrical cup is required for
slurries because it allows for a larger gap between the bob and cup than between plates
and cones in plate-plate and cone-plate viscometers. The larger gap is necessary for the
large particles in the electrodes in this study.
Slurry viscosity was measured at shear rates ranging from 1 to 200 s-1
using an
AR 2000 rheometer (TA Instruments, USA). A vane rotor in cup geometry was used to
decrease the effect of settling on viscosity and was kept at room temperature with ~28.6
mL of slurry. Each of the porous carbon particles, CB1, CB2, CB3, and AC were used
31 with carbon black and sodium sulfate electrolyte to make slurries with solid fractions of
20 and 23 wt%. CB2 slurry viscosities with 16 and 27 wt% solid were also measured for
the same shear rate range.
4. Static Cell Performance and Rheological Properties
All electrochemical measurements were performed at room temperature with a VMP3 or
VSP potentiostat galvanostat (BioLogic, France).
4.1.1 Cyclic Voltammetry
Cyclic voltammetry (CV) was employed to examine the electrochemical
performance of the cells with different carbon particle compositions. Fig. 4.1a shows the
specific capacitance of slurry electrodes from the different carbon particles and for
different weight fractions of carbon. For CB, the specific capacitance of the electrodes
increases with increasing weight fraction of carbon with a maximum at 23 wt%. At these
compositions, slurries with all three sizes of spherical carbon beads show comparable
specific capacitances (between 83 and 92 F•g-1) with CB2 slurries showing the highest
average specific capacitance of 92 ± 10 F•g-1. The specific capacitances of AC slurry
electrodes are also shown in Fig. 4.1a for comparison. Slurries based on carbon beads
show a similar specific capacitance to AC, a common electrode material for commercial
supercapacitors. Within the statistical scatter of the recorded values, there is a minor
change in the capacitance trend for the entire studied range of solid fractions. Typical CV
curves of cells with slurry electrodes of different carbon particles at 23 wt% are shown in
Fig. 4.1b-d. At the low scan rate of 5 mVs-1, CV curves of slurries consisting of all four
types of carbon particles show near-rectangular shapes, indicating highly capacitive
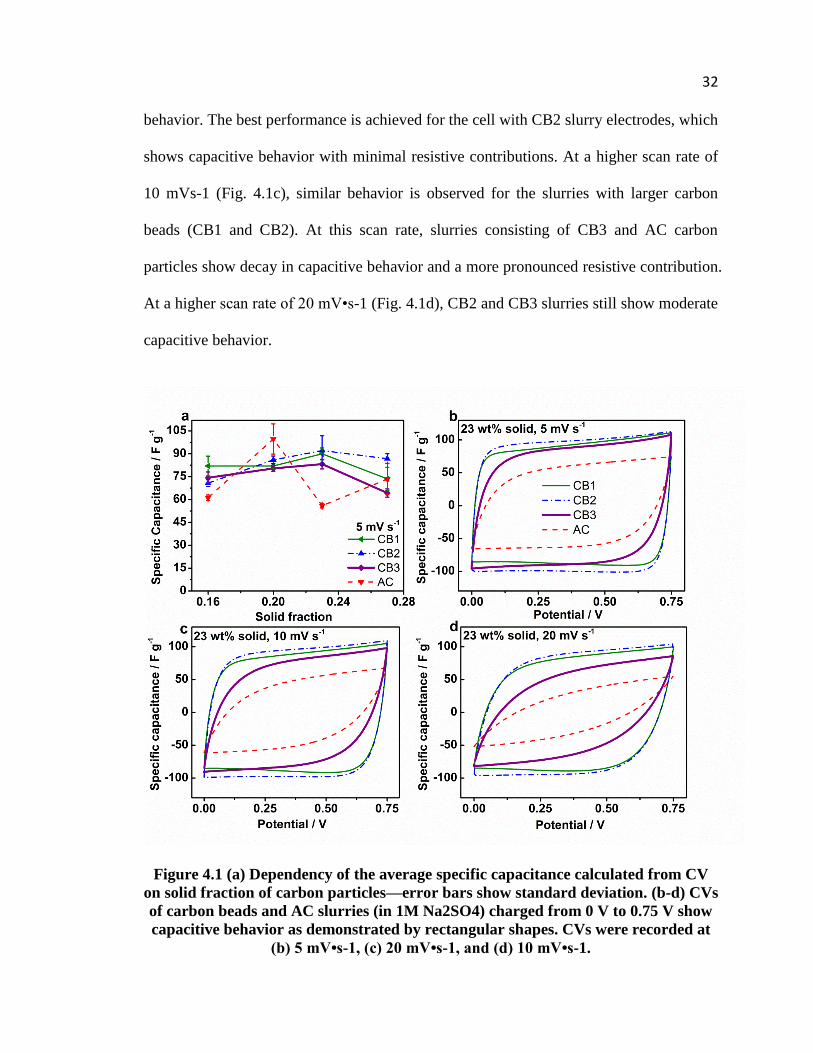
32 behavior. The best performance is achieved for the cell with CB2 slurry electrodes, which
shows capacitive behavior with minimal resistive contributions. At a higher scan rate of
10 mVs-1 (Fig. 4.1c), similar behavior is observed for the slurries with larger carbon
beads (CB1 and CB2). At this scan rate, slurries consisting of CB3 and AC carbon
particles show decay in capacitive behavior and a more pronounced resistive contribution.
At a higher scan rate of 20 mV•s-1 (Fig. 4.1d), CB2 and CB3 slurries still show moderate
capacitive behavior.
Figure 4.1 (a) Dependency of the average specific capacitance calculated from CV
on solid fraction of carbon particles—error bars show standard deviation. (b-d) CVs
of carbon beads and AC slurries (in 1M Na2SO4) charged from 0 V to 0.75 V show
capacitive behavior as demonstrated by rectangular shapes. CVs were recorded at
(b) 5 mV•s-1, (c) 20 mV•s-1, and (d) 10 mV•s-1.
33
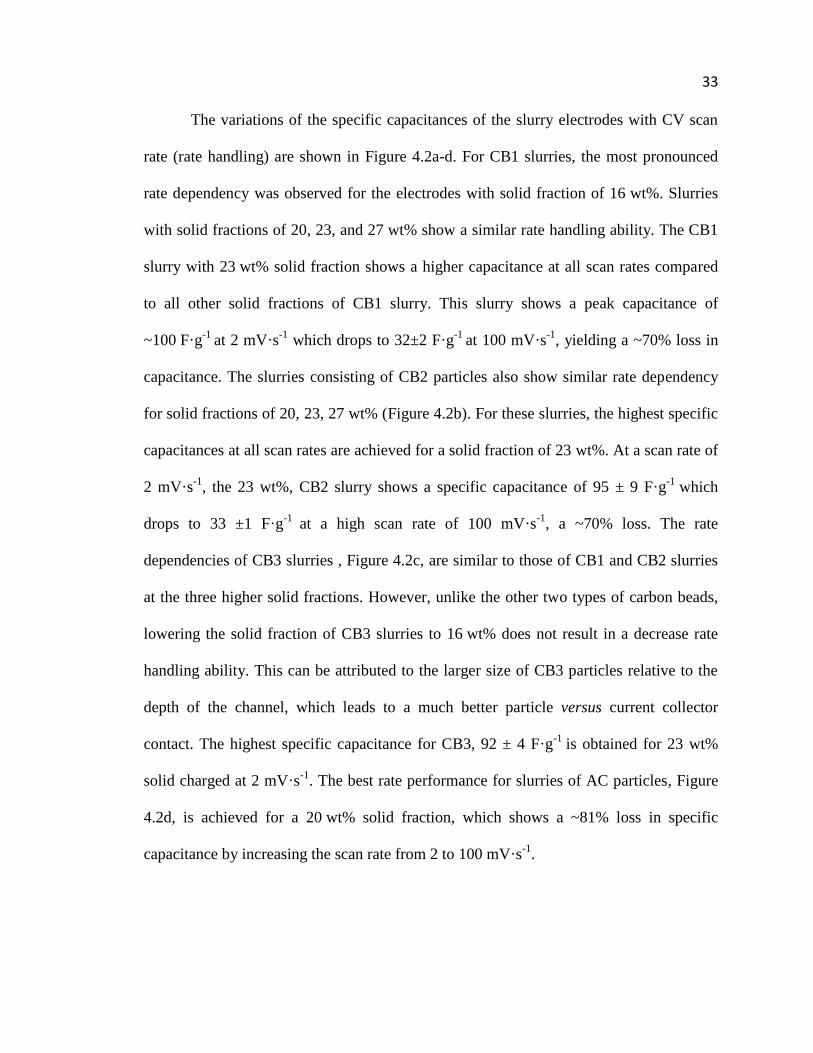
The variations of the specific capacitances of the slurry electrodes with CV scan
rate (rate handling) are shown in Figure 4.2a-d. For CB1 slurries, the most pronounced
rate dependency was observed for the electrodes with solid fraction of 16 wt%. Slurries
with solid fractions of 20, 23, and 27 wt% show a similar rate handling ability. The CB1
slurry with 23 wt% solid fraction shows a higher capacitance at all scan rates compared
to all other solid fractions of CB1 slurry. This slurry shows a peak capacitance of
~100 F·g-1
at 2 mV·s-1
which drops to 32±2 F·g-1
at 100 mV·s-1
, yielding a ~70% loss in
capacitance. The slurries consisting of CB2 particles also show similar rate dependency
for solid fractions of 20, 23, 27 wt% (Figure 4.2b). For these slurries, the highest specific
capacitances at all scan rates are achieved for a solid fraction of 23 wt%. At a scan rate of
2 mV·s-1
, the 23 wt%, CB2 slurry shows a specific capacitance of 95 ± 9 F·g-1
which
drops to 33 ±1 F·g-1
at a high scan rate of 100 mV·s-1
, a ~70% loss. The rate
dependencies of CB3 slurries , Figure 4.2c, are similar to those of CB1 and CB2 slurries
at the three higher solid fractions. However, unlike the other two types of carbon beads,
lowering the solid fraction of CB3 slurries to 16 wt% does not result in a decrease rate
handling ability. This can be attributed to the larger size of CB3 particles relative to the
depth of the channel, which leads to a much better particle versus current collector
contact. The highest specific capacitance for CB3, 92 ± 4 F·g-1
is obtained for 23 wt%
solid charged at 2 mV·s-1
. The best rate performance for slurries of AC particles, Figure
4.2d, is achieved for a 20 wt% solid fraction, which shows a ~81% loss in specific
capacitance by increasing the scan rate from 2 to 100 mV·s-1
.
34
Figure 4.2 Specific capacitances at varying solid fractions (see legend in a) for scan
rates from 2-100 mVs-1 calculated by CV for (a) CB1, (b) CB2, (c) CB3, and (d) AC.
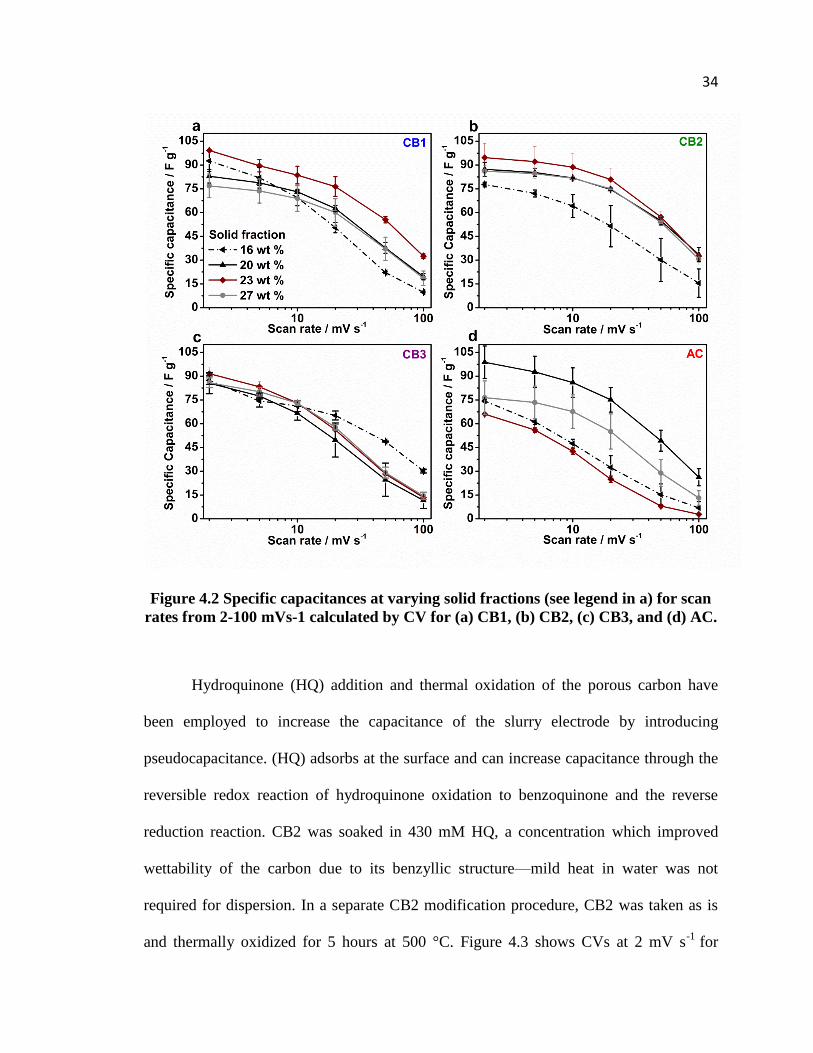
Hydroquinone (HQ) addition and thermal oxidation of the porous carbon have
been employed to increase the capacitance of the slurry electrode by introducing
pseudocapacitance. (HQ) adsorbs at the surface and can increase capacitance through the
reversible redox reaction of hydroquinone oxidation to benzoquinone and the reverse
reduction reaction. CB2 was soaked in 430 mM HQ, a concentration which improved
wettability of the carbon due to its benzyllic structure—mild heat in water was not
required for dispersion. In a separate CB2 modification procedure, CB2 was taken as is
and thermally oxidized for 5 hours at 500 °C. Figure 4.3 shows CVs at 2 mV s-1
for
35 thermally oxidized CB2, HQ soaked and untreated CB2 and Csp’s of 120, 118, and 95 F
g-1
. The porous carbons can be easily modified to increase capacitance by greater than
25%.
Figure 4.3 CVs of treated CB2
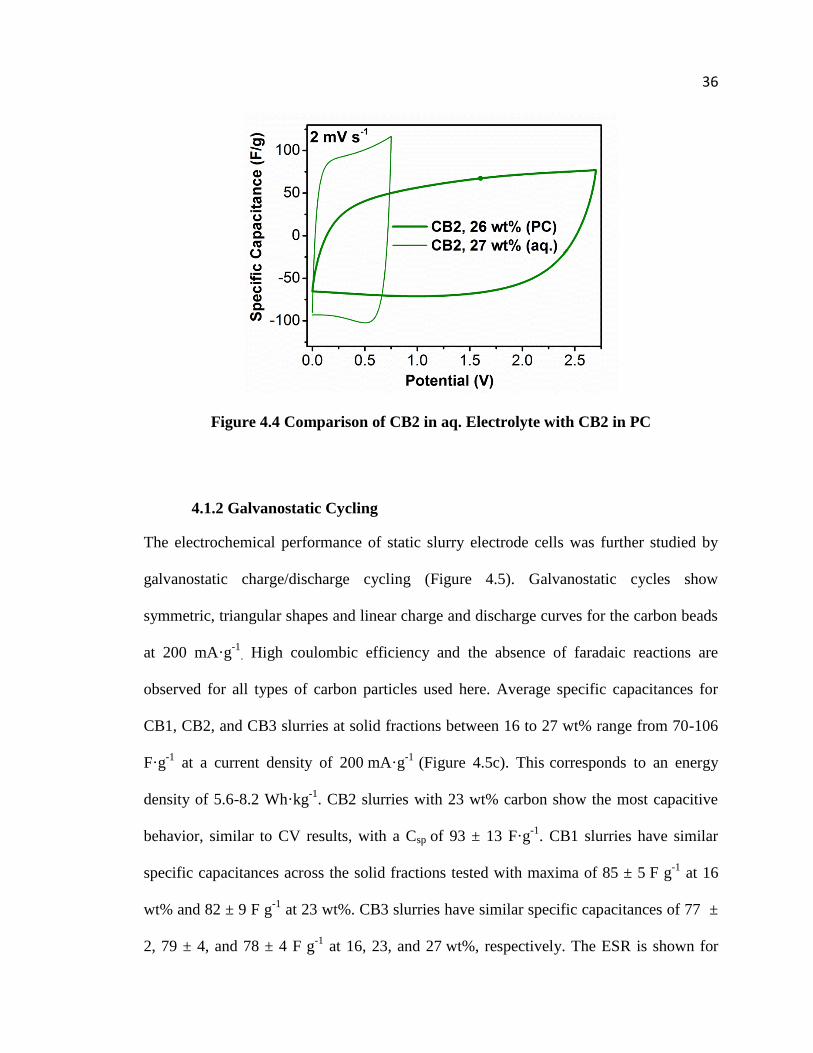
1M TEA-BF4 in propylene carbonate (PC) was employed as organic electrolyte.
CB2 easily dissolved into the organic phase PC. The low ionic conductivity of PC is
exhibited by the lower capacitance in comparison to aqueous CB2 at a similar solid
fraction. However, the larger stable potential window of PC is also shown in Figure 4.4.
By inspection of equation (1), the energy density of CB2 in PC would be greater than that
of CB2 in aqueous electrolyte since energy scales with the square of voltage.
36
Figure 4.4 Comparison of CB2 in aq. Electrolyte with CB2 in PC
4.1.2 Galvanostatic Cycling
The electrochemical performance of static slurry electrode cells was further studied by
galvanostatic charge/discharge cycling (Figure 4.5). Galvanostatic cycles show
symmetric, triangular shapes and linear charge and discharge curves for the carbon beads
at 200 mA·g-1
. High coulombic efficiency and the absence of faradaic reactions are
observed for all types of carbon particles used here. Average specific capacitances for
CB1, CB2, and CB3 slurries at solid fractions between 16 to 27 wt% range from 70-106
F·g-1
at a current density of 200 mA·g-1
(Figure 4.5c). This corresponds to an energy
density of 5.6-8.2 Wh·kg-1
. CB2 slurries with 23 wt% carbon show the most capacitive
behavior, similar to CV results, with a Csp of 93 ± 13 F·g-1
. CB1 slurries have similar
specific capacitances across the solid fractions tested with maxima of 85 ± 5 F g-1
at 16
wt% and 82 ± 9 F g-1
at 23 wt%. CB3 slurries have similar specific capacitances of 77 ±
2, 79 ± 4, and 78 ± 4 F g-1
at 16, 23, and 27 wt%, respectively. The ESR is shown for
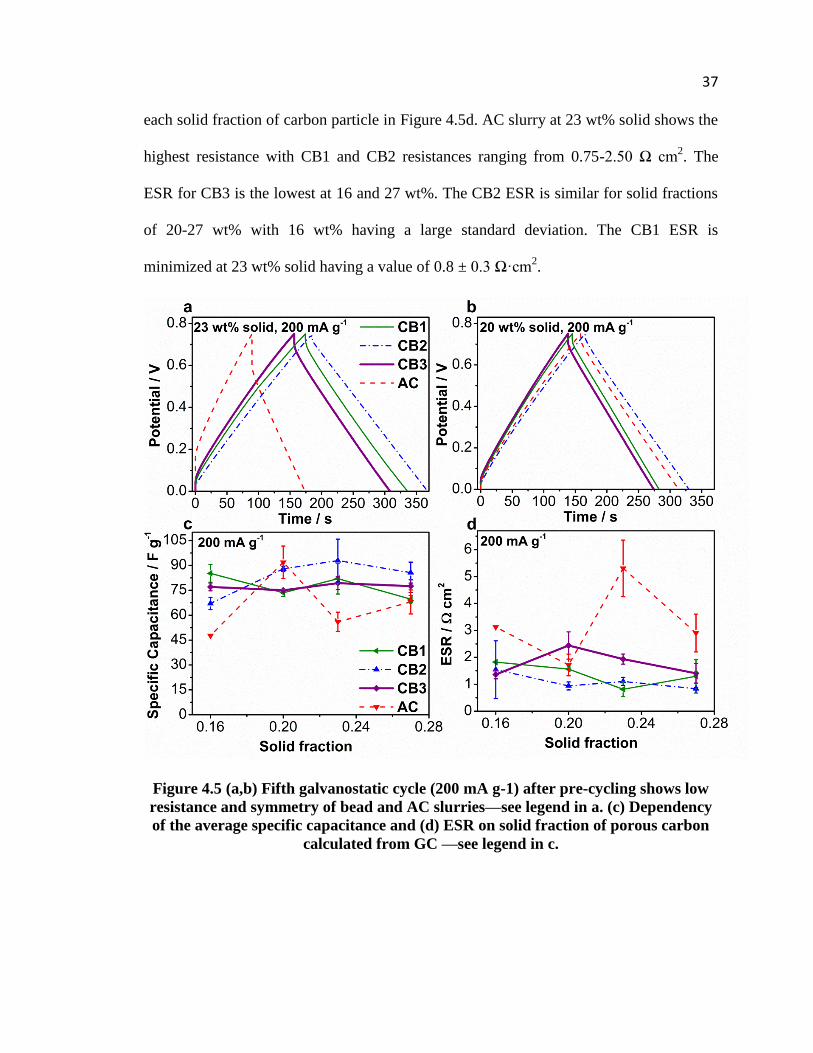
37 each solid fraction of carbon particle in Figure 4.5d. AC slurry at 23 wt% solid shows the
highest resistance with CB1 and CB2 resistances ranging from 0.75-2.50 Ω cm2. The
ESR for CB3 is the lowest at 16 and 27 wt%. The CB2 ESR is similar for solid fractions
of 20-27 wt% with 16 wt% having a large standard deviation. The CB1 ESR is
minimized at 23 wt% solid having a value of 0.8 ± 0.3 Ω·cm2.
Figure 4.5 (a,b) Fifth galvanostatic cycle (200 mA g-1) after pre-cycling shows low
resistance and symmetry of bead and AC slurries—see legend in a. (c) Dependency
of the average specific capacitance and (d) ESR on solid fraction of porous carbon
calculated from GC —see legend in c.
38
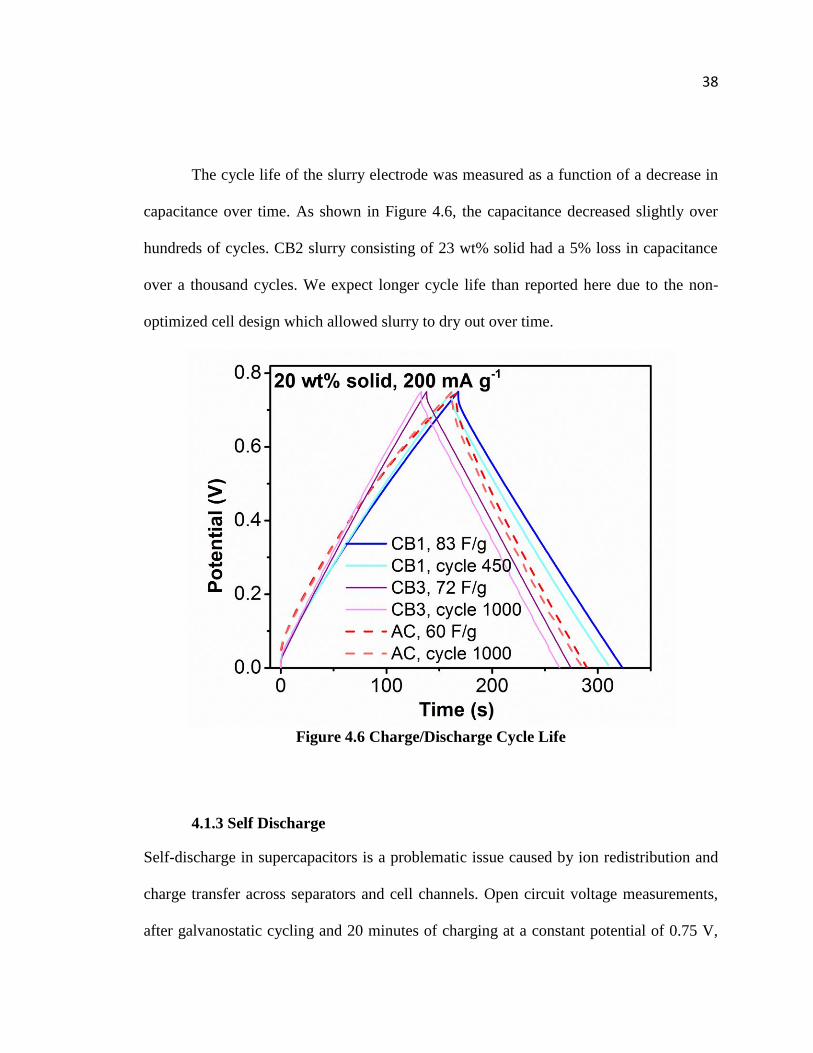
The cycle life of the slurry electrode was measured as a function of a decrease in
capacitance over time. As shown in Figure 4.6, the capacitance decreased slightly over
hundreds of cycles. CB2 slurry consisting of 23 wt% solid had a 5% loss in capacitance
over a thousand cycles. We expect longer cycle life than reported here due to the non-
optimized cell design which allowed slurry to dry out over time.
Figure 4.6 Charge/Discharge Cycle Life
4.1.3 Self Discharge
Self-discharge in supercapacitors is a problematic issue caused by ion redistribution and
charge transfer across separators and cell channels. Open circuit voltage measurements,
after galvanostatic cycling and 20 minutes of charging at a constant potential of 0.75 V,
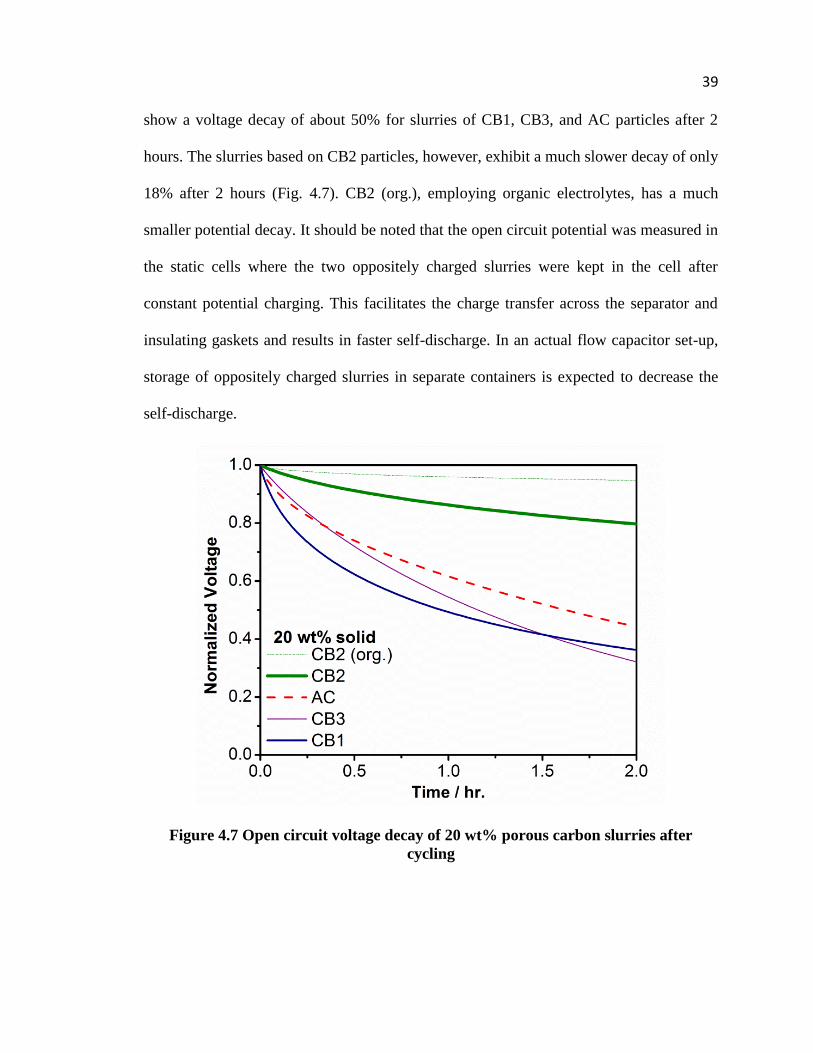
39 show a voltage decay of about 50% for slurries of CB1, CB3, and AC particles after 2
hours. The slurries based on CB2 particles, however, exhibit a much slower decay of only
18% after 2 hours (Fig. 4.7). CB2 (org.), employing organic electrolytes, has a much
smaller potential decay. It should be noted that the open circuit potential was measured in
the static cells where the two oppositely charged slurries were kept in the cell after
constant potential charging. This facilitates the charge transfer across the separator and
insulating gaskets and results in faster self-discharge. In an actual flow capacitor set-up,
storage of oppositely charged slurries in separate containers is expected to decrease the
self-discharge.
Figure 4.7 Open circuit voltage decay of 20 wt% porous carbon slurries after
cycling
40
4.1.4 Chronoamperometry
CV and GC yield a specific capacitance which is rate-dependent (i.e., depends on scan
rate or current density). This can be attributed to the dynamic effects associated with
transport resistance inside micro- and mesopores of the carbon particles, and across the
separator. Chronoamperometry provides an intrinsic equilibrium capacitance comparable,
yet higher, to the capacitance derived from the rate-dependent methods (aqueous:
~+22%, organic: ~+9%). When compensating for the leakage current, the coulombic
efficiency (εc) of the EFC prototype was observed to be 98.5% which is in a very good
agreement with the coulombic efficiency derived from galvanostatic charge/discharge
(≈ 99%).
4.2 Rheological Properties
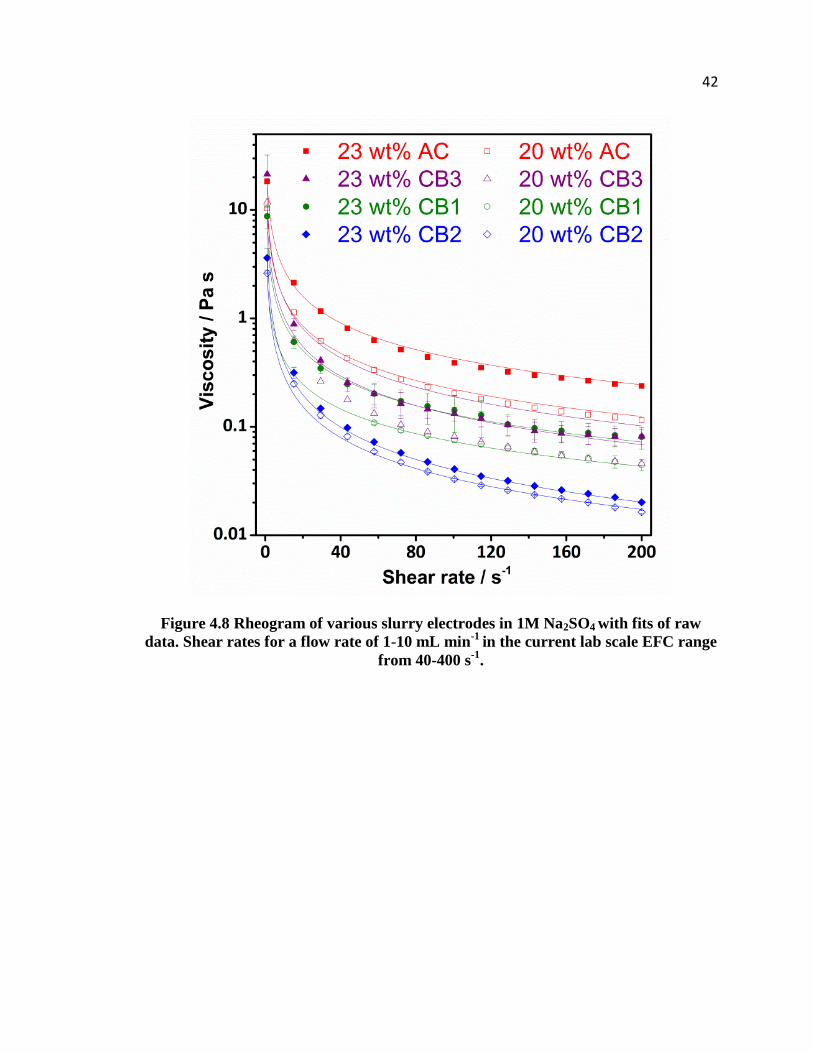
Macroscopic flow with shear-thinning characteristics has been investigated and
shown for all slurries in Fig. 4.8. The rheological behavior follows the power law model
as other shear thinning pseudoplastic fluids with equation (10):
(10)
where η is viscosity, k is the consistency index, γ is the shear rate, and n is the shear
thinning index (see fitting parameters in Table 4.1) [36]. The slurry viscosity increases
with increasing solid concentration. All slurries with a 23 wt% solid fraction are more
viscous than 20 wt% slurries with the same carbon particle type. AC slurries have a
greater viscosity for the same solid fraction of CB slurries. This observation is likely due
to the irregular shape of AC particles with corners and edges catching on neighboring
particles causing higher resistance to flow, and the irregular particle shape causing more
41 frequent particle-particle interactions than corner-less and edge-less CB particles.
Microparticulate coal-water slurries (CWS), nearly analogous to the EFC slurry in terms
particle size and carbon content exhibit gravitational effects due to the large particle size.
These gravitational effects yield settling within the slurry affect the viscosity of the slurry
but they are outside the scope of this study. The rheological analysis shows that for
various particle sizes, concentrations, and shapes similar results have been achieved by
other reported studies on spherical particles in literature [37]. From prior work, slurries
with larger particles have shown lower viscosities than smaller particles at the same solid
fraction. In addition, slurries with more uniform size distributions and greater sphericity
have shown lower viscosities than those with wide size distributions and anisometric
particles which agree with our findings. Our results show that CB2 has the lowest
viscosities. We ascribe this to its larger particle size than CB1 and more uniform size
distribution than CB3.
42
Figure 4.8 Rheogram of various slurry electrodes in 1M Na2SO4 with fits of raw
data. Shear rates for a flow rate of 1-10 mL min-1
in the current lab scale EFC range
from 40-400 s-1
.

43
Table 4.1 Power law fitting parameters for various slurries.
Porous
carbon
Solid
fraction
Consistency
Index k
Shear
thinning
Index n
Fit error—R-
Square
(COD)
AC 0.20 10.4 0.166 0.9999
0.23 18.4 0.185 0.9999
CB1 0.20 2.38 0.244 0.9850
0.23 6.33 0.156 0.9793
CB2 0.20 2.63 0.052 0.9966
0.23 5.00 0.040 0.9716
CB3 0.20 11.8 0.103 0.9967
0.23 8.29 0.095 0.9716
5. Optimization
The experimental results indicate that solid fraction, particle shape, and particle size
influence the electrochemical and rheological properties of the EFC slurry electrode. The
electrochemical properties of carbon slurries show that electron transport in these
electrodes is achieved by the formation of a three dimensional (3D) network of
interconnected particles [14]. This 3D network directly affects the slurry’s physical
properties in terms of electrical conductivity and electrode capacity. CV studies show that
the formation of the 3D network of carbon particles depends on the size and shape of the
carbon particles as well as the solid fraction of the slurries.
5.1 Particle Shape and Size
The shape of the carbon particles is an important factor affecting the optimum solid
fraction for capacitance maximization. Our results indicate that anisometric-shaped AC
slurries do not follow the behavior of spherically shaped carbon bead particles. Unlike
slurries of CB particles, the maximum specific capacitance for AC slurry electrodes was
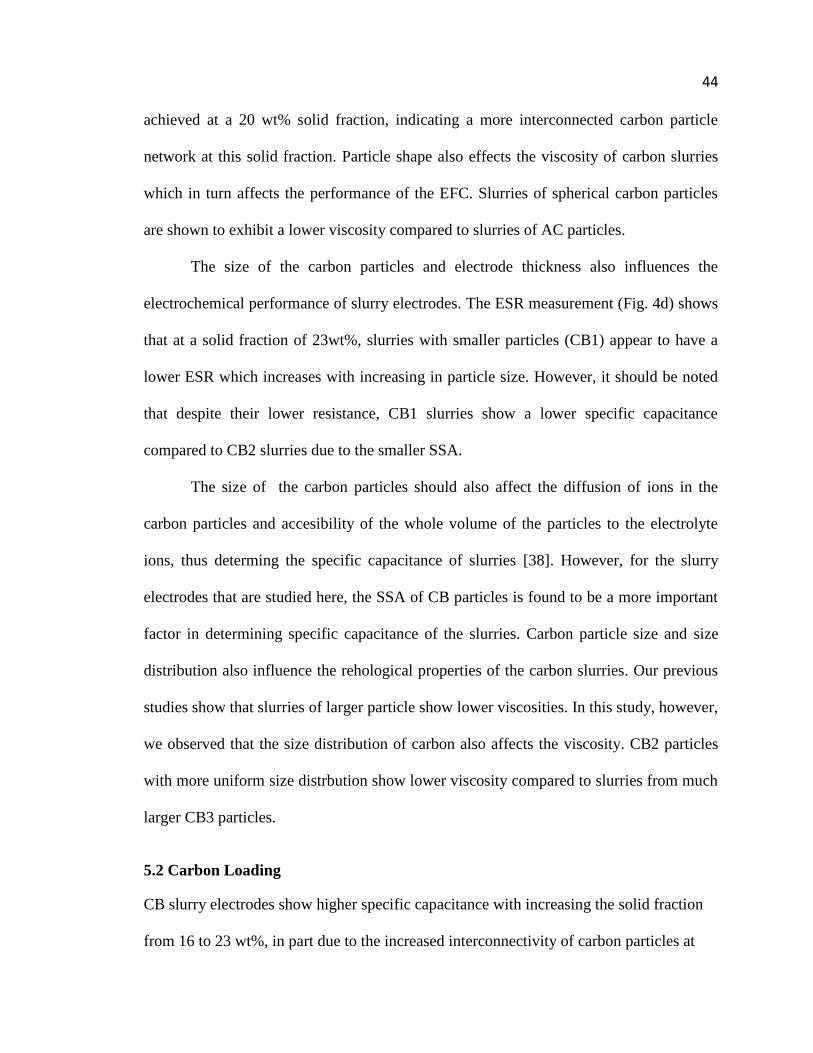
44 achieved at a 20 wt% solid fraction, indicating a more interconnected carbon particle
network at this solid fraction. Particle shape also effects the viscosity of carbon slurries
which in turn affects the performance of the EFC. Slurries of spherical carbon particles
are shown to exhibit a lower viscosity compared to slurries of AC particles.
The size of the carbon particles and electrode thickness also influences the
electrochemical performance of slurry electrodes. The ESR measurement (Fig. 4d) shows
that at a solid fraction of 23wt%, slurries with smaller particles (CB1) appear to have a
lower ESR which increases with increasing in particle size. However, it should be noted
that despite their lower resistance, CB1 slurries show a lower specific capacitance
compared to CB2 slurries due to the smaller SSA.
The size of the carbon particles should also affect the diffusion of ions in the
carbon particles and accesibility of the whole volume of the particles to the electrolyte
ions, thus determing the specific capacitance of slurries [38]. However, for the slurry
electrodes that are studied here, the SSA of CB particles is found to be a more important
factor in determining specific capacitance of the slurries. Carbon particle size and size
distribution also influence the rehological properties of the carbon slurries. Our previous
studies show that slurries of larger particle show lower viscosities. In this study, however,
we observed that the size distribution of carbon also affects the viscosity. CB2 particles
with more uniform size distrbution show lower viscosity compared to slurries from much
larger CB3 particles.
5.2 Carbon Loading
CB slurry electrodes show higher specific capacitance with increasing the solid fraction
from 16 to 23 wt%, in part due to the increased interconnectivity of carbon particles at
45 higher solid fractions. Our results show that an increase in solid fraction to 27 wt%
results in a slight decrease in capacitance, presumably due to the limited access of
electrolyte ions to carbon particles at the higher solid fraction in the thick electrode.
5.3 Electrode Modification
The capacitances of thermally oxidized CB2 and HQ soaked CB2 were increased by
greater than 25% (Fig. 4.3). A further increase in CB2 capacitance with HQ is likely
possible in an acidic solvent since the redox reaction is more favorable with excess
protons in solution.
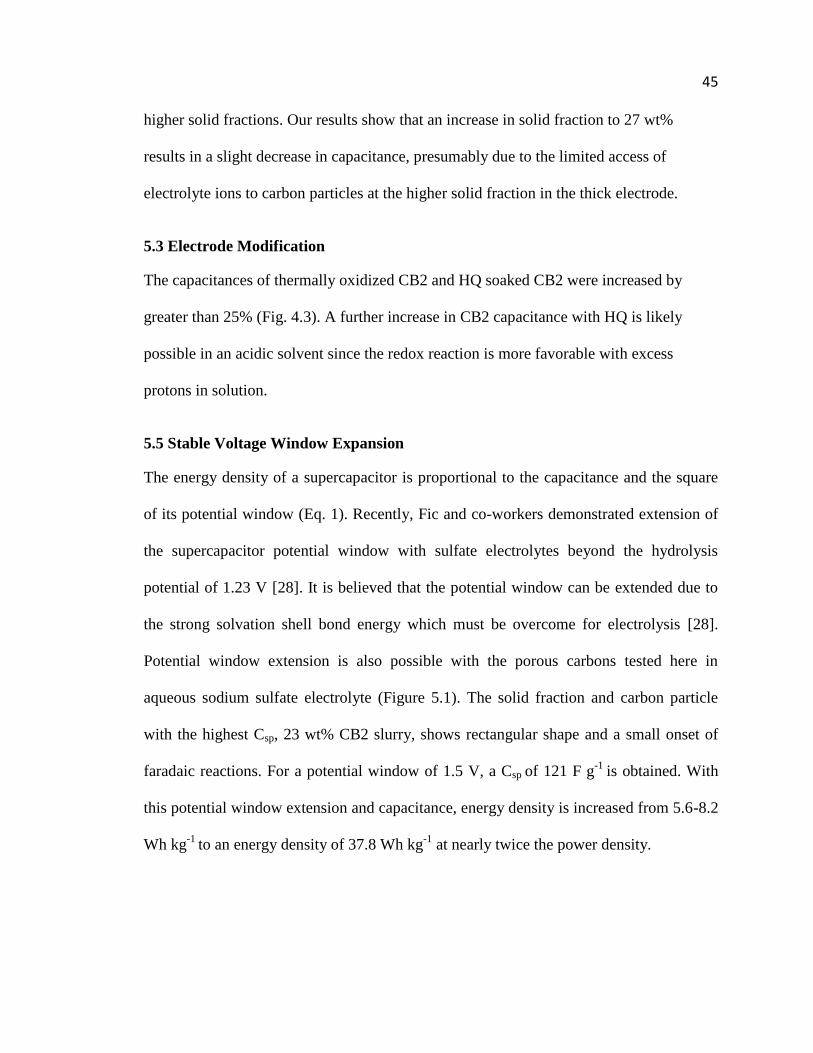
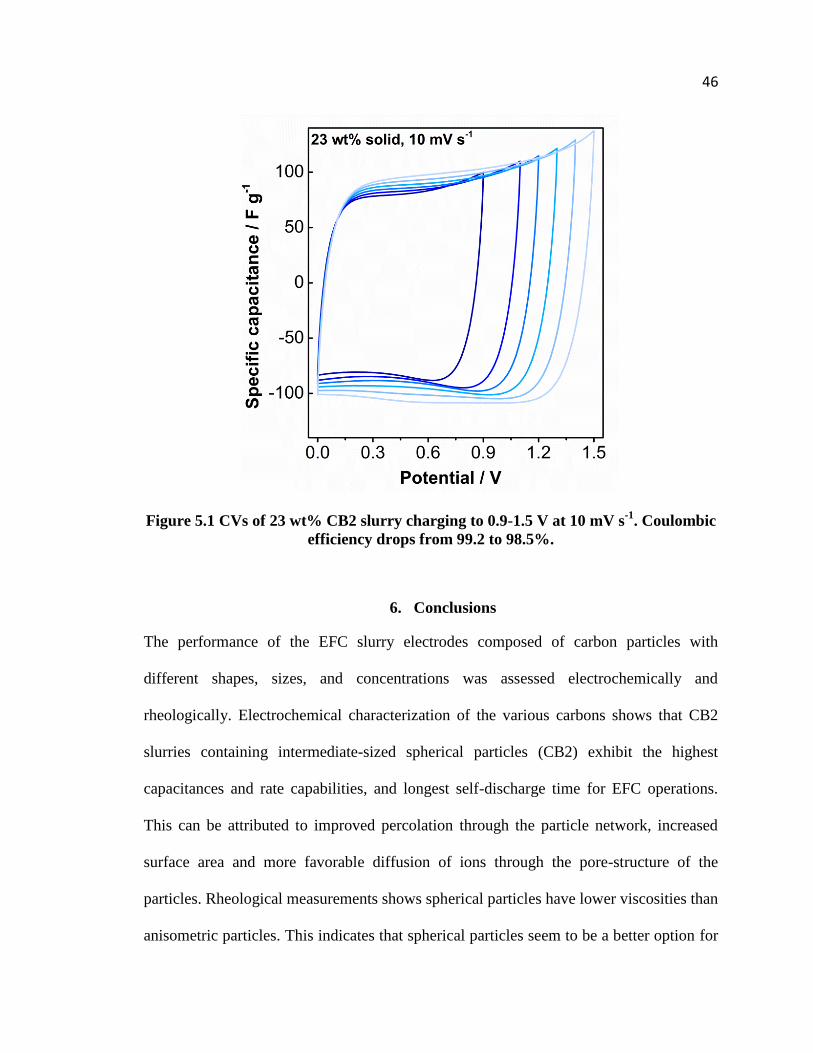
5.5 Stable Voltage Window Expansion
The energy density of a supercapacitor is proportional to the capacitance and the square
of its potential window (Eq. 1). Recently, Fic and co-workers demonstrated extension of
the supercapacitor potential window with sulfate electrolytes beyond the hydrolysis
potential of 1.23 V [28]. It is believed that the potential window can be extended due to
the strong solvation shell bond energy which must be overcome for electrolysis [28].
Potential window extension is also possible with the porous carbons tested here in
aqueous sodium sulfate electrolyte (Figure 5.1). The solid fraction and carbon particle
with the highest Csp, 23 wt% CB2 slurry, shows rectangular shape and a small onset of
faradaic reactions. For a potential window of 1.5 V, a Csp of 121 F g-1
is obtained. With
this potential window extension and capacitance, energy density is increased from 5.6-8.2
Wh kg-1
to an energy density of 37.8 Wh kg-1
at nearly twice the power density.
46
Figure 5.1 CVs of 23 wt% CB2 slurry charging to 0.9-1.5 V at 10 mV s-1
. Coulombic
efficiency drops from 99.2 to 98.5%.
6. Conclusions
The performance of the EFC slurry electrodes composed of carbon particles with
different shapes, sizes, and concentrations was assessed electrochemically and
rheologically. Electrochemical characterization of the various carbons shows that CB2
slurries containing intermediate-sized spherical particles (CB2) exhibit the highest
capacitances and rate capabilities, and longest self-discharge time for EFC operations.
This can be attributed to improved percolation through the particle network, increased
surface area and more favorable diffusion of ions through the pore-structure of the
particles. Rheological measurements shows spherical particles have lower viscosities than
anisometric particles. This indicates that spherical particles seem to be a better option for
47 an EFC: the pumping power is minimized while energy density is increased. After
assessment of three spherical particles at varying diameters, CB2 (161 ± 35 µm) was
observed to be the least viscous. Furthermore, weight percentages of each carbon particle
was varied to determine the viscosity and gravimetric capacitance of each composition
since design parameters such as total slurry capacitance (volumetric) and viscosity are
important for EFC design. A balance of low viscosity (best for low solid fractions) and
charge transfer efficiency should be identified. Here, charge transfer is not necessarily
best for high solid fractions, 23 wt% as opposed to 27 wt% was found to have the highest
gravimetric capacitance.
7. Future Work
Particle stability in the suspension was not studied. Particle stability in solution can be
measured as the Zeta potential with dynamic light scattering (DLS). However, solutions
to be tested need to be transparent, well suspended for 1 hour, and particle sizes should
not exceed 1 μm.
A conductive polymer such as poly(3,4-ethylenedioxythiophene)- poly(styrene
sulfonic acid) (PEDOT-PSS) would decrease resistance while remaining stable in water
and potentially stabilizing graphitic activated carbon particles with its hydrophobic
carbon chain and benzyllic components. More review is needed to determine the viability
of using water soluble polymer in the EFC, but the results of several groups show there is
potential for improved performance with use of PEDOT-PSS.

48
The present work provides a baseline for the performance of slurry electrodes for
EFC systems as well as guidance for future slurry optimization studies. A complete
understanding of the effects of carbon particle type, shape, and size on the performance
of slurries needs further study via extensive modeling and experimental studies.
49
8. References
1. Whittingham, M.S., History, Evolution, and Future Status of Energy Storage.
Proceedings of the IEEE, 2012. 100(Special Centennial Issue): p. 1518-1534.
2. Communication, L.S., The Smart Grid: An Introduction, D.o. Energy, Editor 2010.
3. Bruce, P.G., B. Scrosati, and J.-M. Tarascon, Nanomaterials for Rechargeable
Lithium Batteries. Angew. Chem., Int. Ed., 2008. 47(16): p. 2930-2946.
4. Armand, M. and J.M. Tarascon, Building better batteries. Nature, 2008.
451(7179): p. 652-657.
5. Long, J.W., et al., Three-Dimensional Battery Architectures. Chem. Rev., 2004.
104(10): p. 4463-4492.
6. Simon, P. and Y. Gogotsi, Materials for electrochemical capacitors. Nat. Mater.,
2008. 7: p. 845 - 854.
7. Brezesinski, T., et al., Ordered mesoporous -MoO3 with iso-oriented
nanocrystalline walls for thin-film pseudocapacitors. Nat. Mat., 2010. 9(2): p.
146-151.
8. Pell, W.G. and B.E. Conway, Analysis of power limitations at porous
supercapacitor electrodes under cyclic voltammetry modulation and dc charge. J.
Power Sources, 2001. 96(1): p. 57 - 67.
9. Nguyen, T. and R.F. Savinell, Flow Batteries. Electrochem. Soc. Interface, 2010.
19(3): p. 54 - 56.
10. Oshima, T., M. Kajita, and A. Okuno, Development of Sodium-Sulfur Batteries.
Int. J. Appl. Ceram. Technol., 2004. 1(3): p. 269-276.
11. Chiang, Y.-M., et al., High energy density redox flow device, 2009: US
2010/0047671.
12. Duduta, M., et al., Semi-Solid Lithium Rechargeable Flow Battery. Adv. Energy
Mater., 2011. 1(4): p. 511-516.
13. Pandolfo, A.G. and A.F. Hollenkamp, Carbon properties and their role in
supercapacitors. Journal of Power Sources, 2006. 157(1): p. 11-27.
14. Presser, V., et al., The Electrochemical Flow Capacitor: A New Concept for
Rapid Energy Storage and Recovery. Advanced Energy Materials, 2012. 2(7): p.
895-902.
50 15. Addie, G., A. Roudnev, and A. Sellgren, The new ANSI/HI centrifugal slurry
pump standard. Journal of the South African Institute of Mining and Metallurgy,
2007. 107(6): p. 403.
16. Dunn, B., H. Kamath, and J.-M. Tarascon, Electrical Energy Storage for the
Grid: A Battery of Choices. Science, 2011. 334(6058): p. 928-935.
17. Lu, X., et al., Advanced materials for sodium-beta alumina batteries: Status,
challenges and perspectives. Journal of Power Sources, 2010. 195(9): p. 2431-
2442.
18. Farrington, G.C. and J.L. Briant, Fast Ionic Transport in Solids. Science, 1979.
204(4400): p. 1371-1379.
19. Stoller, M.D. and R.S. Ruoff, Best practice methods for determining an electrode
material's performance for ultracapacitors. Energy Environ. Sci., 2010. 3(9): p.
1294-1301.
20. Zhou, P., et al., Local Structure and Vibrational Spectroscopy of Disordered
Carbons for Li Batteries: Neutron Scattering Studies. Journal of The
Electrochemical Society, 1997. 144(5): p. 1744-1750.
21. Montes-Morán, M.A., et al., On the nature of basic sites on carbon surfaces: an
overview. Carbon, 2004. 42(7): p. 1219-1225.
22. Groszek, A.J., Graphitic and polar surface sites in carbonaceous solids. Carbon,
1987. 25(6): p. 717-722.
23. Osswald, S., M. Havel, and Y. Gogotsi, Monitoring oxidation of multiwalled
carbon nanotubes by Raman spectroscopy. Journal of Raman Spectroscopy, 2007.
38(6): p. 728-736.
24. Peng, Y., et al., Hierarchical manganese oxide/carbon nanocomposites for
supercapacitor electrodes. Nano Research, 2011. 4(2): p. 216-225.
25. Horng, Y.-Y., et al., Flexible supercapacitor based on polyaniline
nanowires/carbon cloth with both high gravimetric and area-normalized
capacitance. Journal of Power Sources, 2010. 195(13): p. 4418-4422.
26. Lei, C., P. Wilson, and C. Lekakou, Effect of poly(3,4-ethylenedioxythiophene)
(PEDOT) in carbon-based composite electrodes for electrochemical
supercapacitors. Journal of Power Sources, 2011. 196(18): p. 7823-7827.
27. Roldán, S., et al., Towards a Further Generation of High-Energy Carbon-Based
Capacitors by Using Redox-Active Electrolytes. Angewandte Chemie
International Edition, 2011. 50(7): p. 1699-1701.
51 28. Fic, K., et al., Novel insight into neutral medium as electrolyte for high-voltage
supercapacitors. Energy & Environmental Science, 2012. 5(2): p. 5842-5850.
29. Lin, R., et al., Solvent effect on the ion adsorption from ionic liquid electrolyte
into sub-nanometer carbon pores. Electrochimica Acta, 2009. 54(27): p. 7025-
7032.
30. Lin, R., et al., Capacitive Energy Storage from −50 to 100 °C Using an Ionic
Liquid Electrolyte. The Journal of Physical Chemistry Letters, 2011. 2(19): p.
2396-2401.
31. Gor, G.Y., et al., Quenched solid density functional theory method for
characterization of mesoporous carbons by nitrogen adsorption. Carbon, 2012.
50(4): p. 1583-1590.
32. Brunauer, S., P.H. Emmett, and E. Teller, Adsorption of Gases in Multimolecular
Layers. Journal of the American Chemical Society, 1938. 60(2): p. 309-319.
33. Pimenta, M.A., et al., Studying disorder in graphite-based systems by Raman
spectroscopy. Physical Chemistry Chemical Physics, 2007. 9(11): p. 1276-1290.
34. Brogioli, D., R. Zhao, and P.M. Biesheuvel, A prototype cell for extracting energy
from a water salinity difference by means of double layer expansion in
nanoporous carbon electrodes. Energy Environ. Sci. , 2011. 4: p. 772 - 777.
35. Masuda, H., K. Higashitani, and H. Yoshida, Powder Technology Handbook,
Third Edition2006: Taylor & Francis.
36. Tadros, T.F., Rheology of Dispersions: Principles and Applications2011: John
Wiley & Sons.
37. Thomas, D.G., Transport characteristics of suspension: VIII. A note on the
viscosity of Newtonian suspensions of uniform spherical particles. Journal of
Colloid Science, 1965. 20(3): p. 267-277.
38. Portet, C., G. Yushin, and Y. Gogotsi, Effect of Carbon Particle Size on
Electrochemical Performance of EDLC. Journal of The Electrochemical Society,
2008. 155(7): p. A531-A536.