
Investigation of dual layer hollow fiber mixed matrix ...
53
Investigation of dual layer hollow fiber mixed matrix membranes characteristics for toxin removal from blood Ricardo Miguel Morais de Sousa Thesis to obtain the Master of Science Degree in Biological Engineering Examination Committee Chairperson: Prof. Arsénio do Carmo Sales Mendes Fialho Supervisors: Profª Marília Clemente Velez Mateus Prof. Dimitrios Stamatialis Member of the committee: Prof. Duarte Miguel de França Teixeira dos Prazeres November 2012
Transcript of Investigation of dual layer hollow fiber mixed matrix ...

Investigation of dual layer hollow fiber mixed matrix
membranes characteristics for toxin removal from blood
Ricardo Miguel Morais de Sousa
Thesis to obtain the Master of Science Degree in
Biological Engineering
Examination Committee
Chairperson: Prof. Arsénio do Carmo Sales Mendes Fialho Supervisors: Profª Marília Clemente Velez Mateus
Prof. Dimitrios Stamatialis Member of the committee: Prof. Duarte Miguel de França Teixeira dos Prazeres
November 2012

This dissertation was done under the supervision of Dr. Dimitrios Stamatialis and with the
orientation of Marlon Tijink at the University of Twente.

i
Resumo
Neste trabalho uma nova membrana com características inovadoras foi estudada para um
possível futuro uso em tratamentos de pacientes em estágio final da doença renal. Estas
membranas são fibras ocas de dupla camada com partículas de carvão activado incorporadas
no interior da membrana da camada exterior.
Algumas simulações foram realizadas em COMSOL para comparar o desempenho das
membranas de fibra oca de dupla camada de matriz mista com membranas mais finas e sem
adsorventes incorporados. Foi demonstrado que a taxa de remoção nas membranas de matriz
mista é dependente no grau de saturação do carvão activado e da sua capacidade de adsorção.
De qualquer forma, foi concluído que é possível melhorar a remoção de toxinas devido à
reacção de adsorção.
Palavras-chave: membrana de matriz mista, carvão activado, creatinina, adsorção.

ii
Abstract
In this work a new membrane with novel characteristics was studied for a possible future
use in the treatment of patients with end-stage renal disease. These particular membranes are
dual layer hollow fibers with activated carbon particles incorporated inside the exterior layer
membrane.
Some simulations were performed in COMSOL to compare the performance of the dual
layer hollow fiber mixed matrix membrane with a thinner membrane without any sorbent. It
was demonstrated that the removal rate in the mixed matrix membranes is highly dependent
on the saturation level of the activated carbon and on its capacity of adsorption. It was
concluded that is possible to improve the removal of uremic toxins with the adsorption
reaction.
Keywords: mixed matrix membrane, activated carbon, creatinine, adsorption.

iii
Contents
Resumo ........................................................................................................................................... i
Abstract ......................................................................................................................................... ii
Contents ....................................................................................................................................... iii
List of abbreviations ...................................................................................................................... v
Index of figures ............................................................................................................................. vii
1. Introduction .......................................................................................................................... 1
1.1 Kidney failure ................................................................................................................ 1
1.2 Uremic toxins ................................................................................................................ 1
1.2.1 Small water-soluble molecules ............................................................................. 1
1.2.2 Middle molecular solutes ...................................................................................... 2
1.2.3 Protein-bound uremic toxins ................................................................................ 2
1.3 Treatments for end-stage renal disease ....................................................................... 3
1.3.1 Hemodialysis ......................................................................................................... 3
1.3.2 Hemofiltration ....................................................................................................... 4
1.3.3 Hemodiafiltration .................................................................................................. 4
1.3.4 High flux dialysis .................................................................................................... 5
1.3.5 Hemoperfusion ...................................................................................................... 6
1.4 Mixed Matrix Membrane .............................................................................................. 6
2. Experimental ......................................................................................................................... 7
2.1 COMSOL modeling ........................................................................................................ 7
2.1.1 Blood domain ...................................................................................................... 11
2.1.2 Dialysate domain ................................................................................................. 11
2.1.3 Inner membrane layer domain ........................................................................... 12
2.1.4 Mixed matrix membrane layer domain .............................................................. 12
2.2 COMSOL simulations ................................................................................................... 13
2.2.1 Small water-soluble molecules simulations ........................................................ 14
iv
2.2.2 Middle molecules simulations ............................................................................. 15
2.2.3 Protein-bound toxins simulations ....................................................................... 15
3. Results and discussion ......................................................................................................... 17
3.1 Small water-soluble molecules simulation ................................................................. 17
3.2 Middle molecules simulation ...................................................................................... 19
3.3 Protein-bound toxins simulations ............................................................................... 20
4. Conclusions ......................................................................................................................... 23
Bibliografia .................................................................................................................................. 25
Appendix ..................................................................................................................................... 27
v
List of abbreviations
AC – Activated carbon
Albumin0 – Total albumin concentration in the blood solution
c – Creatinine concentration (mg mL-1)
cads – Concentration of adsorbed toxin (mol m-3)
ct – Concentration of a toxin (mol m-3)
CFU – Colony-formation units
crt – Creatinine
Ctotal – Concentration of the toxin’s free fraction and bound fraction together (mol m3)
D – Diffusion coefficient (m2 s-1)
ESRD – End-stage renal disease
EU – Endotoxins units
FB – Blood’s flow rate (m3 s-1)
FD – Dialysate’s flow rate (m3 s-1)
J – Flux (mol m-2 s-1)
K – Dissociation constant of the adsorption reaction (mg mL-1)
ka – Specific adsorption rate (mL mg-1 s-1)
kd – Specific desorption rate (s-1)
Keq – Equilibrium constant (m3 mol-1)
MW – Molecular weight
r – Distance from the center of the hollow fiber
R1 – Inner radius of the hollow fiber (m)
R2 – Inner radius plus the inner layer thickness of the hollow fiber (m)
R3 – Outer radius of the hollow fiber (m)
R4 – Inner radius of the tube that contains the hollow fiber (m)
t – Time (s)
vi
TMP – Transmembrane pressure
[tox]bin – Concentration of toxins at the entrance of the blood domain (mol m-3)
[tox]bout – Concentration that leaves the blood domain (mol m-3)
v – Velocity of the fluid (m s-1)
V – Volume of the solution (mL)
Vb – Blood’s volume (m3)
vblood – Velocity of the blood (m s-1)
vdialysate – Velocity of the dialysate (m s-1)
vmaxblood - Maximum velocity of the blood (m s-1)
vmaxdialysate - Maximum velocity of the dialysate (m s-1)
W – Mass of activated carbon (g)

vii
Index of figures
Figure 1 - Representation of the dual layer hollow fiber mixed matrix membranes for blood
purification. ................................................................................................................................... 7
Figure 2 - Diagram of the hollow fiber module. The harrows represent the velocity profile of
the blood and dialysate and the gray region shows the model domains. R1 is the inner radius,
R2 is the inner radius plus the inner layer thickness, R3 is the outer radius and R4 is the inner
radius of the tube that contains the hollow fiber. ........................................................................ 9
Figure 3 - Simulation with adsorption of toxins. Domains represented from left to right: Blood,
inner membrane, mixed matrix membrane and dialysate. ........................................................ 13
Figure 4 - Simulation without adsorption of toxins. Domains represented from left to right:
Blood, inner membrane and dialysate. ....................................................................................... 14
Figure 5 - Creatinine clearance values obtained over time for the studied mixed matrix
membrane hollow fiber and for a thinner membrane without sorbents (‘’conventional’’
membrane). ................................................................................................................................. 18
Figure 6 - Saturation level over time of the activated carbon in the mixed matrix membrane
simulation for the creatinine....................................................................................................... 18
Figure 7 - Middle molecule toxin clearance values obtained over time for the studied mixed
matrix membrane hollow fiber and for a thinner membrane without sorbents (‘’conventional’’
membrane). ................................................................................................................................. 19
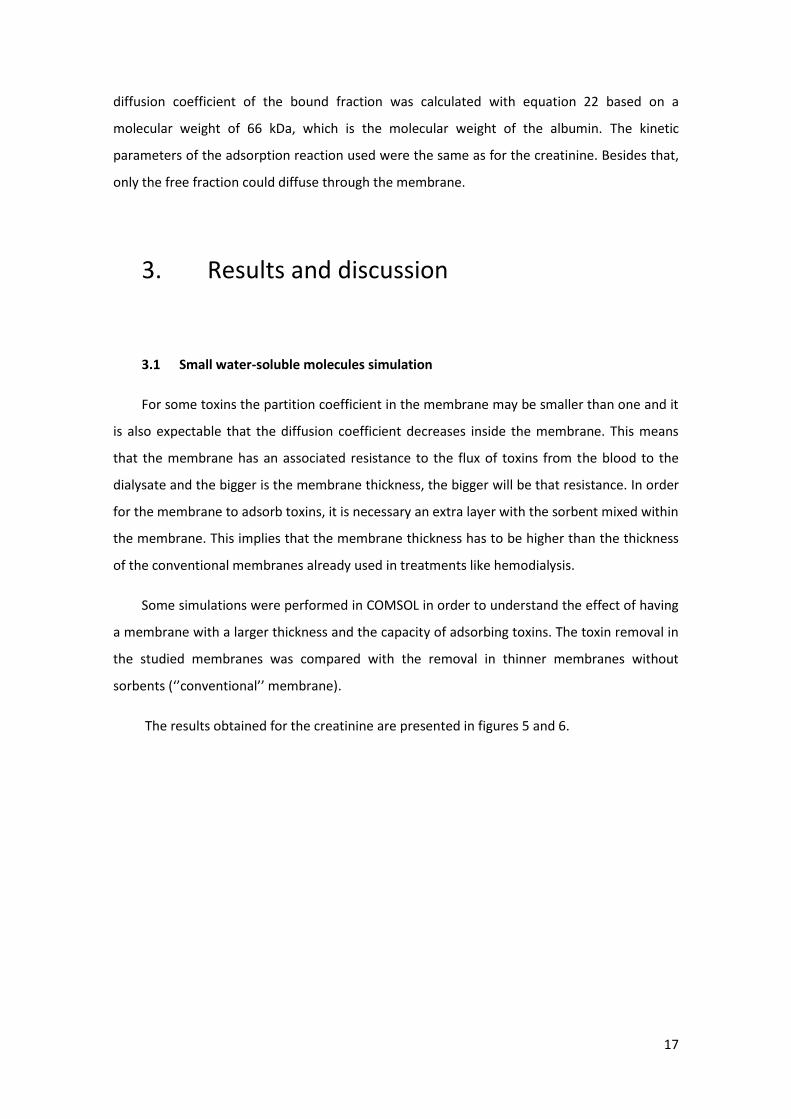
Figure 8 - Saturation level over time of the activated carbon in the mixed matrix membrane
simulation for the middle molecules. ......................................................................................... 20
Figure 9 - Protein-bound toxins clearance values obtained over time for the studied mixed
matrix membrane hollow fiber and for a thinner membrane without adsorbents
(‘’conventional’’ membrane)....................................................................................................... 21
Figure 10 - Saturation level over time of the activated carbon in the mixed matrix membrane
simulation for the protein-bound toxins. .................................................................................... 21
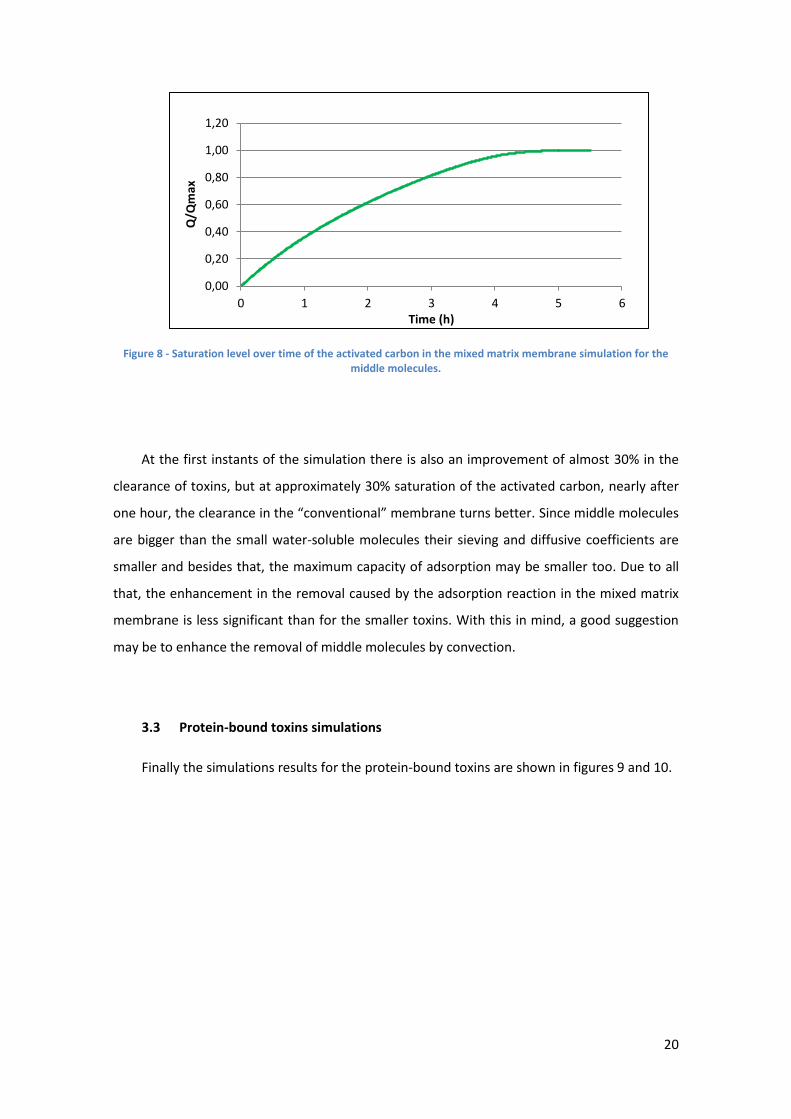
Figure 11 - Free protein-bound toxin concentration profile in the simulation with the mixed
matrix membrane hollow fiber at time 1800 seconds. ............................................................... 22

viii
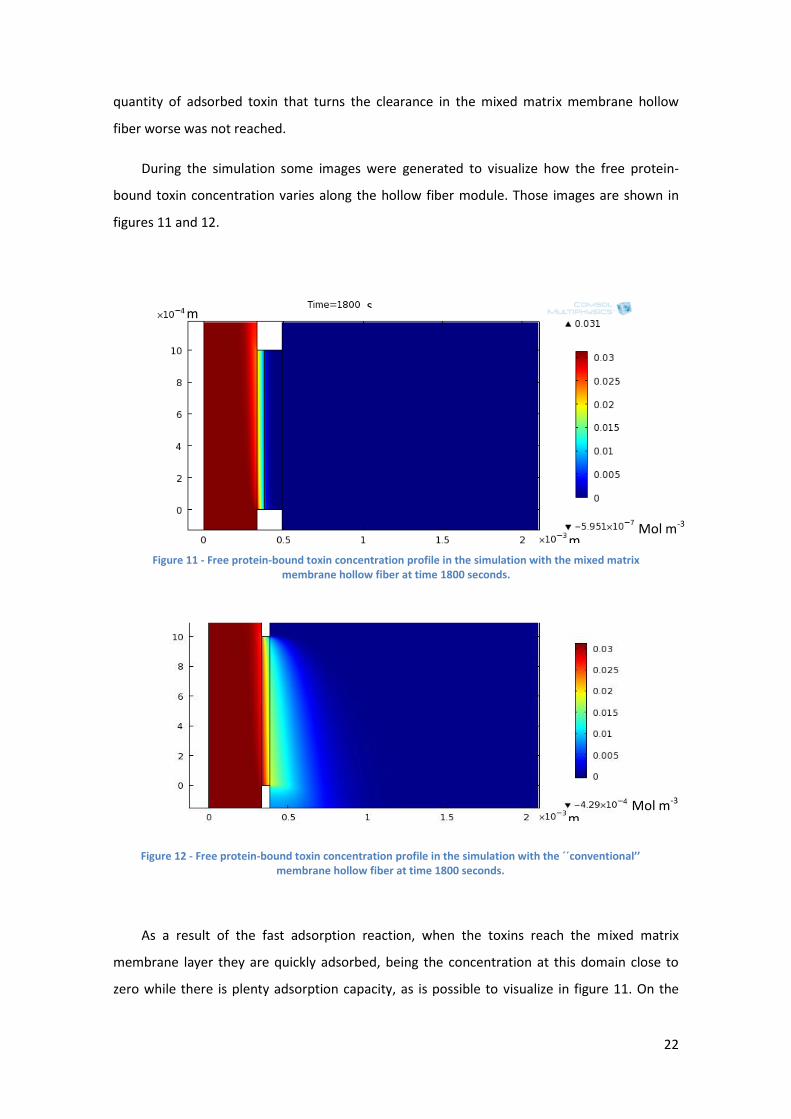
Figure 12 - Free protein-bound toxin concentration profile in the simulation with the
´´conventional’’ membrane hollow fiber at time 1800 seconds. ................................................ 22

ix
Index of tables
Table 1 – Average dimensions and activated carbon loading in the dual layer hollow fiber
mixed matrix membranes with the respective standard deviation. ............................................. 8
1
1. Introduction
1.1 Kidney failure
The kidneys are two organs with the average size of a fist located in the abdominal cavity.
Their main function is to remove excess water and waste products of metabolism, such as
nitrogen products like urea, creatinine (crt), among others. Besides that, also maintain the
homeostasis of electrolytes removing several salts and regulate the acid-base balance. In
addition, human kidneys perform a few endocrine and metabolic functions, such as production
of the hormone erythropoietin and conversion of vitamin D to its active form [1].
Kidney failure can be due to a trauma, poisoning or caused by a degenerative process
instigated by diabetes, high blood pressure or other diseases [1]. In 2008 there were reported
approximately 535000 patients under end-stage renal disease (ESRD) in the USA [2]. In order
to survive, these patients need a kidney transplant or periodical treatments to remove the
excess of water and uremic toxins in the blood.
1.2 Uremic toxins
After kidney failure there is a progressive retention of molecules in the blood that interact
negatively with normal biological functions. These molecules are called uremic toxins and can
be classified in three groups based on their physiochemical proprieties that influence their
dialytic removal. The classification is made based in the molecular weight (MW) or in the
ability to bind to proteins like albumin. Uremic toxins with MW inferior to 500 Da are classified
as small water-soluble molecules, while molecules with MW from 500 Da to approximately
15000 Da are called middle molecules. Independently of the MW, if a uremic toxin is capable
of binding to a protein it belongs to the category of protein-bound toxins [1] and [3].
1.2.1 Small water-soluble molecules
These are the most common uremic toxins and in higher concentrations [4]. These
molecules are removed easily by diffusion [1], since they pass without difficulties the

2
membrane pores and smaller molecules have higher diffusive coefficients by the Stokes-
Einstein equation for the diffusion.
The most known small water-soluble molecules are urea (MW = 60 Da) and creatinine
(MW = 113 Da), because they are the most concentrated uremic toxins. These two molecules
are usually measured to test the conditions of the kidneys, although their biologic activity is
limited [4]. In membranes processes, their clearance may be measured to estimate the
performance of that treatment, even though the clearance of urea or creatinine can only
correlate with the clearance of other small water-soluble molecules [5].
1.2.2 Middle molecular solutes
This class of toxins is essentially peptides or cytokines [4]. The removal of these molecules
is more difficult, since the clearance by diffusion decreases with the increase of the molecular
weight. This way, their removal should be enhanced by convection, using high-flux membranes
and applying transmembrane pressure. One other possibility is to increase the internal
filtration. Internal filtration consists in the total water flux across the membrane, where some
water passes from the blood to the dialysate close to the blood inlet and returns to the blood
near the blood outlet (back filtration). This can be induced increasing the length or decreasing
the diameter of the fibers, or increasing the pressure drop in the dialysate [1]. In this case, is
important to mention that the dialysate should not be the standard-quality dialysis fluid, but
an ultrapure dialysis fluid, in order to be safe for the patient in terms of endotoxin
contamination risk [6].
1.2.3 Protein-bound uremic toxins
In a review done in 2003 where 90 molecules identified as uremic toxins were classified,
27,8% of all molecules were protein-bound toxins, having most of them a MW inferior to 500
Da [4]. Since then, more protein-bound toxins have been identified as well as their toxic
effects. These compounds were documented being involved in the progression of chronic
kidney disease and in generation of cardiovascular disease [3] and [7].
Protein-bound toxins associate with blood proteins like albumin, which molecular weight is
66 kDa. Since blood proteins should be retained during any treatment, the removal of protein-
bound toxins is very difficult and limited to the free fraction of those toxins [1] and [8].

3
However, the binding reaction of albumin is reversible, thus existing an equilibrium between
the free and bounded toxin concentrations. This way, the removal is inversely related to the
affinity constant of these toxins with albumin [7].
Meyer et al. (2004) showed that the clearance of this class of toxins can be improved
increasing the dialyzer mass transfer area coefficient, dialysate flow rate or adding a sorbent in
the dialysate [9]. Other possibility that should be investigated is to stimulate the dissociation of
these toxins with albumin using chronic acidosis or hypoalbuminemia as example [7]. Some
diets or the consumption of sorbents orally may also inhibit the intestinal absorption of these
toxins or its precursors [7].
1.3 Treatments for end-stage renal disease
There are several treatments for end-stage renal disease which allow extending the life of
the patients in some years, being the best one the kidney transplant [2]. However, this option
is limited to the number of kidney available and the compatibility with the donor. This way,
other treatments have to be done, where the function of the kidneys is mimicked artificially.
1.3.1 Hemodialysis
Hemodialysis is the most common treatment for ESRD, with nearly 1,4 million uretic
patients treated worldwide in 2004 [10].
In this treatment the blood is pumped out of the body to the dialyzer, where flows in the
lumen of hollow fibers membranes (0,4 - 2,6 m2 surface area), while the dialysate flows in the
dialyzer shell counter currently. The hollow fiber membrane acts as a barrier that retains blood
proteins and cells, while removing low molecular weight waste metabolites from the blood to
the dialysate. The toxins removal is based on their diffusivity in the membrane, which is
dependent on their molecular weight. This way, to prevent the depletion of the blood’s
electrolytes, the dialysate should contain a similar concentration of electrolytes, which also
equalize the transmembrane osmolarity. The blood’s flow rate is limited by the quality of the
vascular accesses, but with an average of 400 mL/min. On the other hand, the flow rate of the
dialysate should be between 1,5 – 2 times higher than the blood’s flow rate [1] and [10].
4
Hemodialysis is very effective removing small uremic toxins, but for larger toxins the
removal is lower, due to the sieving proprieties of the membrane [10]. The elimination of
protein-bounded toxins is equally low, because only the small fraction of unbound toxins can
diffuse through the membrane. For the filtration of the excess water, a transmembrane
pressure difference can be applied, controlling easily the amount of water removed [10].
This treatment is normally done three times per week with an average duration of 3,5 h
[1] and [10].
1.3.2 Hemofiltration
In this technique, blood is removed to a hemofilter, where plasma water and toxins are
filtered. Hemofiltration as like other convective treatments was developed with the purpose to
remove middle molecular weight toxins. In this treatment molecules up to 15 kDa are
eliminated from the blood thought ultrafiltration-membranes by a convection mechanism
triggered by an applied transmembrane pressure. These membranes are usually 10 times more
permeable to plasma water then the membranes from hemodialysis. However, they should be
as well capable of retaining the blood proteins and cells [10].
Since that the main mechanism of removal is convection, the small molecules are just
dragged from the water flux, being the concentration at the filtrate similar to the plasma
concentration. This implies that the removal of small molecules is not as efficient as in the
hemodialysis [10].
Due to the higher plasma water loss, the ultrafiltrate produced has to be replaced
completely or partially by a replacement fluid with electrolytes. The replacement fluid can be
introduced in the blood upstream (pre-dilution), downstream (post-dilution) or in both at the
same time [10] and [11].
1.3.3 Hemodiafiltration
Hemodiafiltration is a combination of the treatments hemodialysis and hemofiltration [6].
To improve the poor removal of low molecular weight solutes in hemofiltration, a dialysate
fluid is circulated in the shell of a hemofilter couter currently, causing a concentration gradient
that provokes the diffusion of small molecular weight molecules out of the blood [1]. On the

5
other hand, the convective flow imposed in this method results in a better deduction of the
excess water and the higher molecular weight molecules [6].
As applied in hemofiltration, a replacement fluid may be needed. This substitution fluid
can also be administered either before, after or both before and after the filter. Whenever a
substitute fluid is needed, the standard-quality dialysis fluid should be replaced by a ultrapure
dialysis fluid characterized by having a bacterial count in colony-formation units (CFU) inferior
to 0,1 CFU/mL and an endotoxin count in endotoxins units (EU) inferior to 0,05 EU/mL [6].
A study showed that post-dilution hemodiafiltration removes more β2-microglobulin, a
middle molecule, than the pre-dilution mode [12]. However, in patients with high hematocrit
levels or blood protein concentration, pre-dilution proved to be better [6]. Pre-dilution has the
disadvantage of diluting the blood toxins, reducing their clearances, but has the advantage of
diminish the blood’s viscosity and hemoconcentration, preventing clottings in the membrane
[13]. Besides that, dilution might also increase the removal of protein-bound toxins by
augmenting the free fraction available for removal [12].
The high-flux membrane used in hemodiafiltration may cause some albumin loss that may
result in the clearance of more protein-bound toxins, though it is unclear how beneficial this
albumin loss may be [6]. Nevertheless, the removal of protein-bound toxins still poor in this
treatment.
The treatments hemodiafiltration and hemofiltration have typically the same duration and
frequency as the hemodialysis [1].
1.3.4 High flux dialysis
Hemodialysis using high flux membranes allows the removal of a larger range of toxins by
convective transport [14] and [15]. These membranes have a larger hydraulic permeability
coefficient which results in higher amounts of ultrafiltration produced during the treatment
[14] and [15].
Although that in hemodiafiltration the removal of middle molecular weight molecules is
higher, high flux dialysis may not need a replacement fluid [15]. This is achieved promoting
internal filtration [1], [14] and [15]. Internal filtration consists in the total water flux across the
membrane, where some water passes from the blood to the dialysate close to the blood inlet
and returns to the blood near the blood outlet (back filtration) [1] and [6]. This can be induced

6
increasing the length or decreasing the diameter of the fibers, or increasing the pressure drop
in the dialysate [1], [14] and [15]. Since that part of the dialysate fluid is back filtrated to the
blood, the dialysate should be ultrapure dialysis fluid.
1.3.5 Hemoperfusion
In this treatment the blood is pumped to an adsorption column, where several uremic
toxins are adsorbed. The most common adsorbers are resins and activated carbon (AC), due to
their adsorptive capacity and ability to remove harmful molecules. However, there are some
concerns due to the possible release of particles to the blood, lack of biocompatibility or poor
homogeneity. To improve the safety of this treatment, the sorbents should be coated with a
biocompatible polymer [16].
Hemoperfusion alone is not a very efficient treatment for uremic patients, because of its
limited removal of some toxins like urea and since there is not removal of the excess water
these patients accumulate [16]. However, when combined with other treatments like
hemodialysis the removal of middle molecules and protein-bound toxins is increased,
improving the patient’s conditions and reducing the weekly treatment time [16] and [17].
Unfortunately, hemodialysis-hemoperfusion treatment is more expensive and complex [16].
1.4 Mixed Matrix Membrane
Based on the advantages of the hemodialysis-hemoperfusion treatment, came the idea of
using mixed matrix membranes, in an attempt of combining diffusion and adsorption of uremic
toxins in only one step [2]. This way the removal of toxins in the hemodialysis treatment could
be improved and some limitations in the conventional hemoperfusion like inhomogeneous
blood flow distribution, stagnation phenomena within the column or high pressure drop could
be overcome [16].
Meyer et all demonstrated in 2007 that having an adsorbent in suspension in the dialysate
increases the clearance of protein-bound toxins [9]. This way is expectable that having an
adsorbent incorporated in the membrane may have a similar effect, continuing to have a
simple treatment.
7
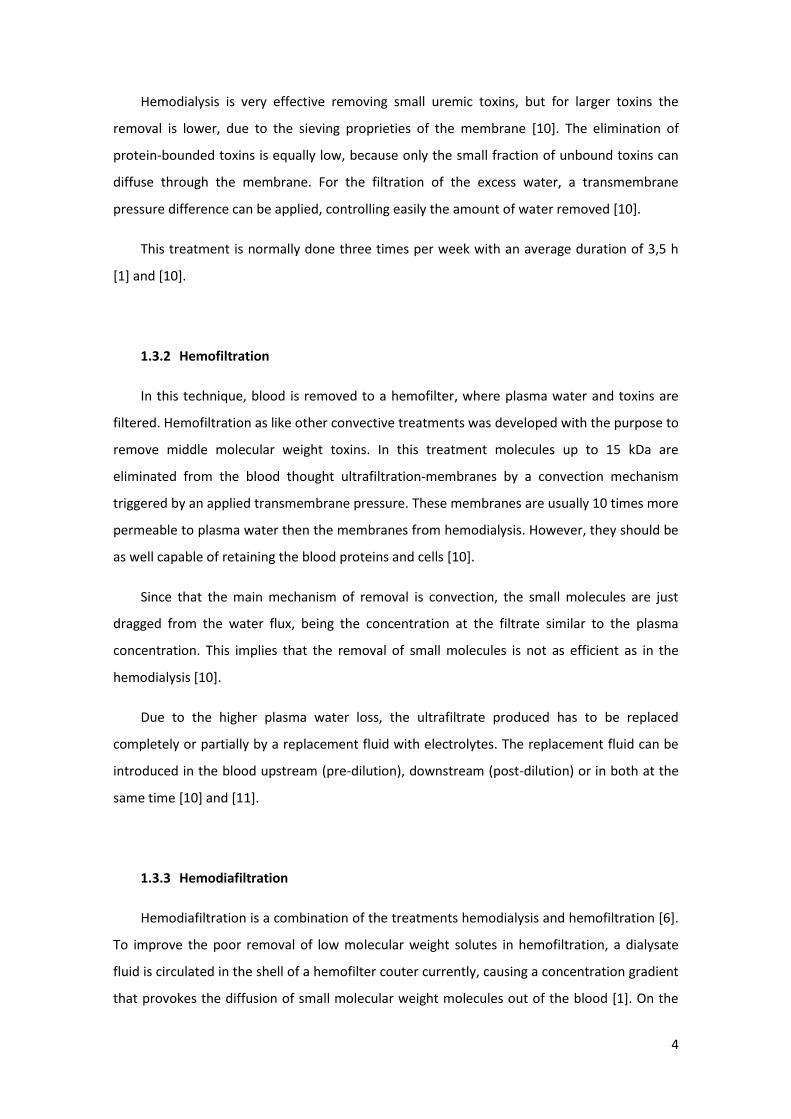
The hollow fiber mixed matrix membranes should be composed by two layers: a macro-
porous membrane layer with adsorptive particles incorporated and an extra particle-free inner
membrane layer on the blood-contacting side [2]. In Erro! A origem da referência não foi
encontrada. is illustrated the lateral view of this hollow fiber membranes, showing the two
membrane layers.
The particle-free inner membrane layer is very important to prevent particle release into
the blood and to improve membrane hemocompatibility, since that the blood should not be in
direct contact with the activated carbon [2].
Figure 1 - Representation of the dual layer hollow fiber mixed matrix membranes for blood purification.
2. Experimental
2.1 COMSOL modeling
A dialysis process was modeled using the software COMSOL. This model was based on a
similar one presented as example in the COMSOL website (appendix 1).

8
For this work a dual layer hollow fiber mixed matrix membrane with the dimensions
presented on table 1 and a length of 25 cm was modeled inside a tube with 8 mm diameter.
Table 1 – Average dimensions and activated carbon loading in the dual layer hollow fiber mixed matrix membranes with the respective standard deviation.
Outer diameter (μm) 984 11
Inner diameter (μm) 669 9
Inner layer thickness (μm) 49 5
Mixed matrix layer thickness (μm) 111 4
In the lumen of the hollow fiber was simulated the passage of a toxin dissolved in water
(blood solution), while outside the hollow fiber circulates only water (dialysate).
In figure 2 is described the different components of the model.

9
Figure 2 - Diagram of the hollow fiber module. The harrows represent the velocity profile of the blood and dialysate and the gray region shows the model domains. R1 is the inner radius, R2 is the inner radius plus the
inner layer thickness, R3 is the outer radius and R4 is the inner radius of the tube that contains the hollow fiber.
Due to the symmetry in the r axis of the hollow fiber module, it is possible to describe it
using a 2D model in COMSOL for only half of the entire module, as it is shown by the light grey
region in figure 2. This means that this model is composed by 4 domains: blood, inner
membrane, mixed matrix membrane layer and dialysate.
This model should be able to predict the total flux of a toxin inside each domain and this
way, predict the removal from the blood solution. In equation 1 is shown the differential
equation for the total flux.
Equation 1
Model domains
Symmetry axis
Blo
od
Dialysate H
ollo
w f
iber
Tub
e
R1 R2 R3 R4
10
Here is the differential operator in the coordinates that define this system, J is the flux
(mol m-2 s-1), D is the diffusion coefficient of the toxin (m2 s-1), ct is the concentration of the
toxin (mol m-3) and v is the velocity of the fluid (m s-1).
The total flux has a convective and a diffusive component. The convective component
( ) will only take place at the blood’s and dialysate’s domain. On the other hand, the
diffusive component ( ) will be calculated in all domains, but with a different value for
the diffusion coefficient inside the membranes.
COMSOL solves the differential equations by numeric methods. This means that these
equations are solved by iterations doing small increments of time and space and predicting the
next values based on the previous ones. In order to do this, a time step has to be defined and
also all domains are fragmented in small portions. Then the flux in each fragment is calculated
based on the flux in the previous fragments.
Besides the equation for the total flux is also necessary an equation to define the flux in
the boundaries between different domains. For this purpose was used an empirical equation
(equation 2).
Equation 2
In which ci and cj are the concentrations at different domains (mol m-3), K is the partition
coefficient, which should be only multiplied by the concentration at the blood’s and dialysate’s
domain and M is a nonphysical velocity (m s-1) that defines how fast the equilibrium in the
boundary is reach.
Equation 2 is only applied for the fragments of the 2 domains in contact with the
boundary that separate them. Due to the proximity, the concentrations in those fragments
should be in equilibrium very fast. This way the value of M should be high enough to ensure
this equilibrium and a continuous flux across the interfaces. The chosen value was 10000 m s-1.
The partition coefficient was admitted to be equal to 1, because tests performed with clean
water showed that these membranes have high clean-water permeance, which means that
creatinine is very small compared with the pore size of these membranes [2].
To avoid an excessive amount of calculations this model was scaled in the z-coordinate. So
in order to do that, this coordinate was divided by a scale factor of 250. This affected the
length of the membrane module, the velocity of the blood and dialysate and also the diffusion
in the z axis.

11
2.1.1 Blood domain
For the convective component of the total flux is necessary to define an equation for the
blood’s velocity inside the hollow fiber. Based on the flow rates used during the experiments
and the inner radius of the hollow fiber, it was possible to calculate the Reynod’s number and
verify that the blood solution is in laminar flow regime. This way, for a fully developed laminar
flow, de equation obtained for the blood’s velocity (vblood) in the z-coordinate was:
( (
) ) Equation 3
In which R1 is the inner radius, r is the distance from the center of the hollow fiber and
vmaxblood is the maximum velocity of the blood obtained for r=0. The vmaxblood parameter was
obtained based on the equations 4 and 5.
∬ Equation 4
In equation 4 FB is the blood’s flow rate, which means that knowing this flow rate and
solving the double integral it is possible to obtain an expression for the vmaxblood (Equation 5).
Equation 5
Due to the scale done the final expression for the velocity must be divided by the scale
factor of 250.
For the diffusion component it was introduced the diffusion coefficient of the toxin
presented. However this coefficient cannot be isotropic, because the z axis was scaled. Since in
equation 1 the concentration is differentiated twice in the diffusion term, the diffusion
coefficient in the z-coordinate must be divided by the square of the scale factor.
In all simulations the flow rate of the blood was 6,667E-8 m3 s-1.
2.1.2 Dialysate domain
In this domain was also necessary to calculate an equation for the dialysate’s velocity
between the hollow fiber and the tube. The equation obtained in the z-coordinate for the
stationary state and laminar flow is presented on equation 6.
12
( (
)
) Equation 6
In this equation R3 is the outer radius, R4 is the radius of the tube that contains the
hollow fiber, r is the distance from the center of the hollow fiber and vmaxdialysate is the
maximum velocity of the dialysate obtained for r =
. The vmaxdialysate is multiplied by a
minus signal, because the dialysate flows in the opposite direction of the blood. This
parameter was obtained applying equation 15 for the dialysate’s velocity and flow rate and the
result is equation 7.
Equation 7
In which FD is the dialysate’s flow rate (m3 s-1).
The final expression of the dialysate’s velocity was also divided by the scale factor and the
diffusion coefficient was the same as for the blood, being the diffusion coefficient in the z-
coordinate divided by the square of the scale factor as well.
In all simulations the dialysate’s flow rate was 5,333E-7 m3 s-1.
2.1.3 Inner membrane layer domain
In this layer there is only diffusion of toxins. This way was defined a diffusion coefficient
for the toxin inside the membrane, which was divided by the square of the scale factor for the
z-coordinate.
2.1.4 Mixed matrix membrane layer domain
In this domain there is an adsorption reaction. Equations 8 and 9 were used to calculate
the concentration of the free and bound toxin.
Equation 8

13
Equation 9
In these equations c is the concentration of free toxin (mol m-3), ka is the specific
adsorption rate (m3 mol-1 s-1), kd is the specific desorption rate (s-1), cmax is the maximum
adsorption capacity per volume of mixed matrix membrane (mol m-3) and cads is the
concentration of adsorbed toxin (mol m-3).
Only the free toxin can diffuse and its diffusion coefficient was the same as for the inner
membrane layer.
2.2 COMSOL simulations
After defining the model and all the relevant parameter, two simulations were performed
for each type of uremic toxins. One simulation was done with the four domains previously
described, while the other simulation was performed without the mixed matrix membrane
domain. Figures 3 and 4 illustrate the difference between the models of the two simulations.
m
m
Figure 3 - Simulation with adsorption of toxins. Domains represented from left to right: Blood, inner membrane, mixed matrix membrane and dialysate.

14
Both axis display the dimensions of the domains. In the horizontal axis is shown the
dimensions from table 1 plus the 4 mm radius of the tube where flows the dialysate and from
the vertical axis is possible to verify that the length of the membrane domain is 1 mm. This
happens because the average length admitted was 25 cm, but this length was reduced 250
times due to the scale performed.
For both blood and dialysate was simulated a single pass. This means that the
concentration of toxins in the inlet of both domains is constant.
To compare the removal obtained in each pair of simulations, it was calculated the
clearance of toxins from the blood. Equation 10 demonstrates how the clearance was
calculated.
Equation 10
In which [tox]bin is the concentration of toxins at the entrance of the blood domain,
[tox]bout is the concentration that leaves the blood domain and FB is the blood’s flow rate.
2.2.1 Small water-soluble molecules simulations
The diffusion coefficient inside the membrane and the kinetic parameters of adsorption
were calculated for the creatinine in some experiments performed. The value of the diffusion
coefficient admitted inside the membrane was 3,14E-10 m2 s-1 and the values of ka, kd and cmax
m
m
Figure 4 - Simulation without adsorption of toxins. Domains represented from left to right: Blood, inner membrane and dialysate.

15
calculated in these hollow fiber membranes were 9,87E-3 m3 mol-1 s-1, 0 s-1 and 101 mol m-3,
respectively.
The diffusion coefficient of creatinine in the solutions was 9,8E-10 m2 s-1 [19].
The concentration of creatinine admitted for the blood’s inlet was 0,1 mg/mL, which is
equivalent to 0,884 mol m-3. The concentration at the dialysate’s inlet was equal to 0 mol m-3
in all simulations.
2.2.2 Middle molecules simulations
The initial concentrations were the same as for the small water-soluble molecules (0,884
mol m-3). However, since these molecules have a higher molecular weight their partition and
diffusive coefficient should be smaller. It was not possible to calculate those coefficients for a
middle molecule, so it was admitted some values. The partition coefficient used was 0,7 and
the diffusion coefficient in the solutions and in the membrane was calculated based on the
values for the creatinine, admitting a molecular weight of 1000 Da for the toxin and knowing
that the diffusion coefficient is proportional to the inverse of the molecular weight elevated to
one third [18]. In equation 11 is shown how the diffusion coefficient was calculated.
(
)
⁄
Equation 11
Besides the diffusion and partition coefficient, also the maximum capacity of adsorption
was decreased to half the maximum capacity of adsorption of the creatinine. The remainder
kinetic parameters of the adsorption reaction used were the same as for the creatinine.
2.2.3 Protein-bound toxins simulations
For these two simulations a new reaction was implemented in the blood domain, where
the toxin could bind to albumin. That reaction is shown in the next equation.
Equation 12
In the last equation k1 is the constant rate for the complex formation and k-1 is the
constant rate of the dissociation of the complex.
k-1
k1

16
Based on equation 12, it was calculated the differential equations for the variation of the
concentration of the free and bound toxin in time.
Equation 13
Equation 14
In both equations Albumin0 is the total albumin concentration in the blood solution.
The rate of complex formation divided by the rate of complex dissociation gives the
equilibrium constant. To simulate a toxin with a considerable binding affinity it was used an
equilibrium constant equal to 1000 m3 mol-1. The values for k1 and k-1 were valued based on
the equilibrium constant and with the aim of making the reaction represented in equation 12
fast, in order to reach the equilibrium quickly. This way the value for k1 was 10000 m3 mol-1 s-1
and the value for k-1 was 10 s-1.
The concentration of the free and bound fraction at the inlet of the blood was calculated
admitting that at the entrance of the blood the concentrations are at equilibrium. Equations 15
and 16 are the expressions for those concentrations.
√(
)
Equation 15
√(
)
Equation 16
In which Ctotal is the concentration of the free fraction and the bound fraction together
(mol m3) and Keq is the equilibrium constant (m3 mol-1).
The value of Ctotal used was 1 mol m-3 and the concentration of Albumin at the inlet of the
blood domain was also 1 mol m-3. Based on these values and on the equilibrium constant, the
free fraction obtained was almost 3% of the total toxin concentration.
Once that most of the protein-bound toxins have a molecular weight smaller than 500 Da,
the values for the diffusion coefficients and for the partition coefficient used for the free
fraction were the same as for the creatinine [4]. On the other hand, the value admitted for the
17
diffusion coefficient of the bound fraction was calculated with equation 22 based on a
molecular weight of 66 kDa, which is the molecular weight of the albumin. The kinetic
parameters of the adsorption reaction used were the same as for the creatinine. Besides that,
only the free fraction could diffuse through the membrane.
3. Results and discussion
3.1 Small water-soluble molecules simulation
For some toxins the partition coefficient in the membrane may be smaller than one and it
is also expectable that the diffusion coefficient decreases inside the membrane. This means
that the membrane has an associated resistance to the flux of toxins from the blood to the
dialysate and the bigger is the membrane thickness, the bigger will be that resistance. In order
for the membrane to adsorb toxins, it is necessary an extra layer with the sorbent mixed within
the membrane. This implies that the membrane thickness has to be higher than the thickness
of the conventional membranes already used in treatments like hemodialysis.
Some simulations were performed in COMSOL in order to understand the effect of having
a membrane with a larger thickness and the capacity of adsorbing toxins. The toxin removal in
the studied membranes was compared with the removal in thinner membranes without
sorbents (‘’conventional’’ membrane).
The results obtained for the creatinine are presented in figures 5 and 6.

18
Figure 5 - Creatinine clearance values obtained over time for the studied mixed matrix membrane hollow fiber and for a thinner membrane without sorbents (‘’conventional’’ membrane).
Figure 6 - Saturation level over time of the activated carbon in the mixed matrix membrane simulation for the creatinine.
Since the membrane polarization and fouling were not taken in account in all simulations,
the clearance correspondent to the ‘’conventional’’ membrane is constant during all
simulation time. On the other hand, the clearance in the mixed matrix membrane hollow fiber
is highly dependent on the saturation level of the activated carbon, varying in time until it gets
totally saturated. This also shows that the clearance will be reliant on the adsorption capacity
of the activated carbon to the toxins, meaning that if a toxin is not adsorbed then the
0,00
0,02
0,04
0,06
0,08
0,10
0,12
0,14
0 1 2 3 4 5 6
Cle
aran
ce (
mL/
min
)
Time (h)
''Conventional''membrane
Mixed matrixmembrane
0
0,2
0,4
0,6
0,8
1
1,2
0 1 2 3 4 5 6
Q/Q
max
Time (h)

19
clearance will be most likely worse with the mixed matrix membrane during all treatment
time.
At the beginning of the simulation there is an improvement in the removal of creatinine in
almost 50% for the mixed matrix membrane hollow fiber, but as the saturation level of the
activated carbon increases, the clearance decreases, until that it turns worse at almost 70%
saturation of the activated carbon. When the activated carbon gets more saturated, the
adsorption reaction turns slower and the creatinine has to diffuse more through the
membrane to get adsorbed. Because of that, the effect of having a membrane with a higher
thickness turns more pronounced and the clearance decreases.
3.2 Middle molecules simulation
The same comparison was done for the middle molecules using reasonable parameters
for this class of uremic toxins.
The simulation results are presented in figures 7 and 8.
Figure 7 - Middle molecule toxin clearance values obtained over time for the studied mixed matrix membrane hollow fiber and for a thinner membrane without sorbents (‘’conventional’’ membrane).
0
0,005
0,01
0,015
0,02
0,025
0,03
0 1 2 3 4 5 6
Cle
aran
ce (
mL/
min
)
Time (h)
''Conventional''membrane
Mixed matrixmembrane
20
Figure 8 - Saturation level over time of the activated carbon in the mixed matrix membrane simulation for the middle molecules.
At the first instants of the simulation there is also an improvement of almost 30% in the
clearance of toxins, but at approximately 30% saturation of the activated carbon, nearly after
one hour, the clearance in the “conventional” membrane turns better. Since middle molecules
are bigger than the small water-soluble molecules their sieving and diffusive coefficients are
smaller and besides that, the maximum capacity of adsorption may be smaller too. Due to all
that, the enhancement in the removal caused by the adsorption reaction in the mixed matrix
membrane is less significant than for the smaller toxins. With this in mind, a good suggestion
may be to enhance the removal of middle molecules by convection.
3.3 Protein-bound toxins simulations
Finally the simulations results for the protein-bound toxins are shown in figures 9 and 10.
0,00
0,20
0,40
0,60
0,80
1,00
1,20
0 1 2 3 4 5 6
Q/Q
max
Time (h)

21
Figure 9 - Protein-bound toxins clearance values obtained over time for the studied mixed matrix membrane hollow fiber and for a thinner membrane without adsorbents (‘’conventional’’ membrane).
Figure 10 - Saturation level over time of the activated carbon in the mixed matrix membrane simulation for the protein-bound toxins.
Due to the initial concentrations of protein-bound toxins, albumin and the binding
equilibrium constant assumed, the free fraction in the blood solution is only 3% of the total
toxin concentration. This is the reason why the clearance is so low in both simulations.
Comparing this two simulations, the clearance in the membrane with activated carbon
starts to be almost 60% higher than the clearance in the ‘’conventional’’ membrane, but as
seen before, as the activated carbon gets more saturated the removal decreases.
At the end of the 6 hours only 20% of the activated carbon is saturated. The amount of
protein-bound toxins being removed is low and that is why at the end of the simulation the
0
0,0005
0,001
0,0015
0,002
0,0025
0,003
0,0035
0,004
0,0045
0 1 2 3 4 5 6
Cle
aran
ce (
mL/
min
)
Time (h)
''Conventional''membrane
Mixed matrixmembrane
0
0,05
0,1
0,15
0,2
0,25
0 1 2 3 4 5 6
Q/Q
max
Time (h)
22
quantity of adsorbed toxin that turns the clearance in the mixed matrix membrane hollow
fiber worse was not reached.
During the simulation some images were generated to visualize how the free protein-
bound toxin concentration varies along the hollow fiber module. Those images are shown in
figures 11 and 12.
As a result of the fast adsorption reaction, when the toxins reach the mixed matrix
membrane layer they are quickly adsorbed, being the concentration at this domain close to
zero while there is plenty adsorption capacity, as is possible to visualize in figure 11. On the
m
m Mol m-3
s
m
m Mol m-3
Figure 11 - Free protein-bound toxin concentration profile in the simulation with the mixed matrix membrane hollow fiber at time 1800 seconds.
Figure 12 - Free protein-bound toxin concentration profile in the simulation with the ´´conventional’’ membrane hollow fiber at time 1800 seconds.
s

23
other hand, when the toxins diffuse to the dialysate, they take more time to diffuse away from
the membrane.
In figure 12 there is a higher change in the concentration at the dialysate than in the
blood. This happens because only the concentration of the free fraction of toxins is shown and
some of the free toxins that are removed from the blood are replaced for others that were
bounded to albumin.
Jonh Patzer explained that close to the blood outlet/dialysate inlet some free protein-
bound toxins are able to cross the membrane. However, this flux elevates the toxin
concentration in the dialysate to values close to the concentration of the free fraction in the
blood, reducing the driving force for the removal over much of the membrane [8]. This means
that only a small fraction of the membrane has a good performance in the conventional
membranes. Yet in the mixed matrix membrane hollow fibers, the quick adsorption reaction
maximizes the driving force across the entire membrane, while the activated carbon is not
saturated.
As was shown in all simulations, if the toxin is adsorbed by the activated carbon is possible
to improve its removal. However is important to keep in mind that after the activated carbon
gets saturated the removal gets worse. To avoid this, the treatments using mixed matrix
membrane hollow fibers should be done with an excess of hollow fibers to make sure that
during the treatment time the activated carbon never gets saturated enough to turn the
clearance worse.
4. Conclusions
As an attempt to improve the removal of protein-bound toxins, yet keeping a simple
process, came the idea of using dual layer hollow fiber mixed matrix membranes combining
the removal by diffusion/convection and adsorption in only one step.
A model was created in COMSOL in order to compare the removal of toxins in the mixed
matrix membrane hollow fibers with thinner membranes without sorbents. With the
simulations performed in COMSOL it was concluded that the clearance is highly depended on
the adsorption capacity of the activated carbon and on its saturation level, decreasing as the
24
activated carbon gets more saturated. If the toxin can be adsorbed, the adsorption reaction
can overcomes the extra resistance promoted by the larger thickness of the mixed matrix
membrane, but after the activated carbon gets more saturated the clearance gets worse. On
the other hand, if a toxin is not adsorbed the removal will be worse with the mixed matrix
membrane during all treatment time. The same extra resistance also affects more molecules
with higher molecular weight, which means that the mixed matrix membrane may have a
better effect for small toxins then for the middle molecules. For the protein-bound toxins, the
adsorption reaction increases the efficiency of the membrane, maximizing the driving force for
the removal across the entire membrane, improving the removal of these toxins.
In conclusion, the dual layer hollow fiber mixed matrix membrane may be a promising
way to improve the removal of uremic toxin.

25
Bibliografia
[1] Ofsthun NJ, Karoor S, Suzuki M. Hemodialysis membranes. Advanced membrane
technology and application 2008;519-539.
[2] Tijink MSL, Wester M, Sun J, et al. A novel approach for blood purification: Mixed-
matrix membranes combining diffusion and adsorption in one step. Acta Biomaterialia 2012;
2279-2287.
[3] Liabeuf S, Drüeke TB, Massy ZA. Protein-Bound Uremic Toxins: New Insight from Clinical
Studies. Toxins 2011;3:911-919.
[4] Vanholder R, De Smet R, Glorieux G, et al. Review on uremic toxins: Classification,
concentration, and interindividual variability. Kidney International 2003, vol. 63;1934-1943.
[5] Vanholder R, De Smet R, Lameire N. Protein-bound uremic solutes: The forgotten
toxins. Kidney International, Supplement 2001;59:S266-S70.
[6] Fischbach M, Fothergill H, Zaloszyc A, Seuge L. Hemodiafiltration: the addition of
convective flow to hemodialysis. Pediatr Nephrol 2012;27:351-356.
[7] Jourde-Chiche N, Dou L, Cerini C, Dignat-George F, Vanholder R, Brunet P. Protein-
Bound Toxins—Update 2009. Seminars in Dialysis 2009, vol. 22;334.339.
[8] Patzer J. Principles of Bound Solute Dialysis. Therapeutic apheresis and dialysis
2006;10:118-124.
[9] Meyer TW, Peattie JWT, Miller JD, Dinh DC, Recht NS, Walther JL, Hostetter TH.
Increasing the clearance of protein-bound solutes by addition of a sorbent to the dialysate.
Journal of the American Society of Nephrology 2007;18:868-874.
[10] Catapano G, Vienken J. Biomedical applications of membranes. Advanced membrane
technology and application 2008;489-517.
[11] Shaheen I, Harvey B, Watson AR. Haemofiltration therapy. Paediatrics and Child
Health 2009; vol. 9:121-126.

26
[12] Meert N, Eloot S, Waterloos MA, Van Landschoot M, Dhondt A, Glorieux G, Ledebo I,
Vanholder R. Effective removal of protein-bound uraemic solutes by different convective
strategies: a prospective trial. Nephrol Dial Transplant 2009;24:562-570.
[13] Tiranathanagul K, Susantitaphong P, Keomany C, Mahatanan N, Praditpornsilpa K,
Eiam-Ong S. Long-Term Efficacy of Pre- and Post-Dilution Online Hemodiafiltration with
Dialyzer Reuse. Journal of the Medical Association of Thailand 2012, vol. 95.
[14] Ronco C, Orlandini G, Brendolan A, Lupi A, La Greca G. Enhancement of convective
transport by internal filtration in a modified experimental hemodialyzer. Kidney International
1998;54:979-985.
[15] Ronco C, Brendolan A, Lupi A, Metry G, Levin NW. Effects of a reduced inner diameter
of hollow fibers in hemodialyzers. Kidney International 2000;58:809-817.
[16] Saiful. Mixed matrix membrane adsorbers for protein and blood purification.
Enschede: University of Twente; 2007.
[17] Chen SJ, Jiang GR, Shan JP, Lu W, Huang HD, Ji G, Wu P, Wu GF, Wang W, Zhu C, Bian
F. Combination of maintenance hemodialysis with hemoperfusion: A safe and effective model
of artificial kidney. The International Journal of Artificial Organs 2011;34:339-347.
[18] Dellanna F, Wuepper A, Baldamus CA. Internal Filtration – Advantage in
haemodialysis. Nephrol Dial Transplant 1996;11:83-86.
[19] Bunim JJ, Smith WW, Smith HW. The diffusion coefficient of Inulin and other
substances of interest in renal physiology. The journal of biological chemistry 1937;118:667-
677

27
Appendix

28

29

30
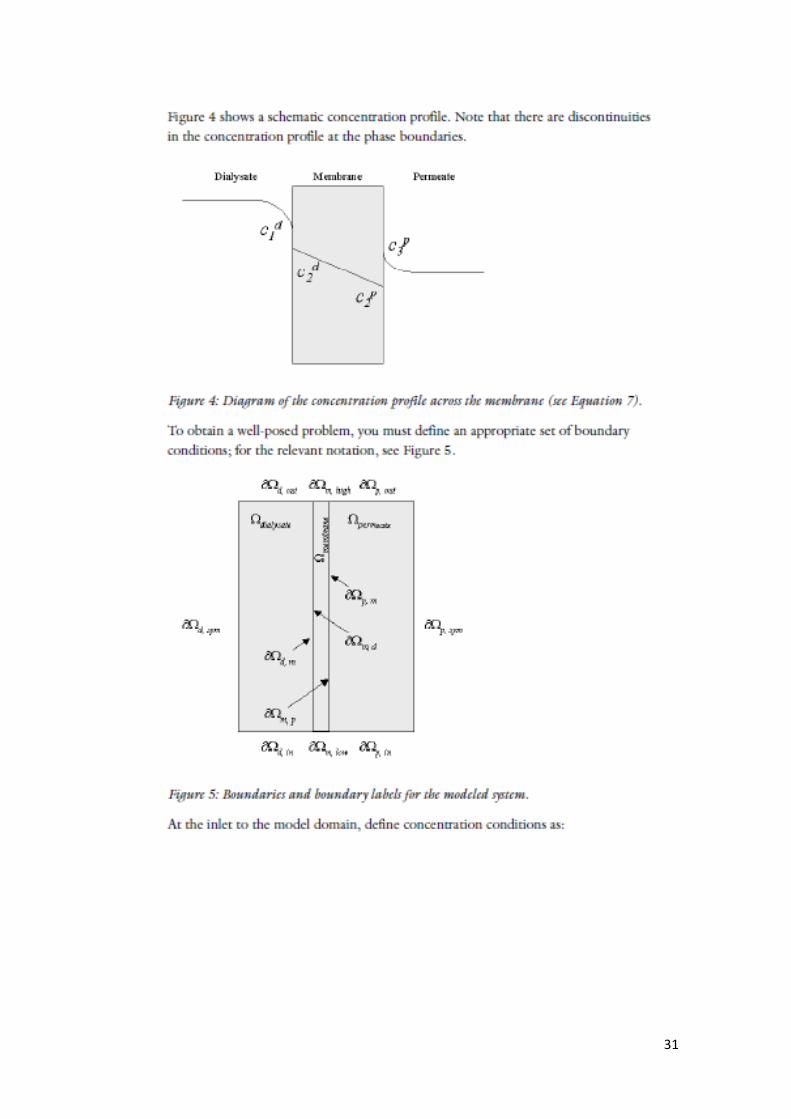
31
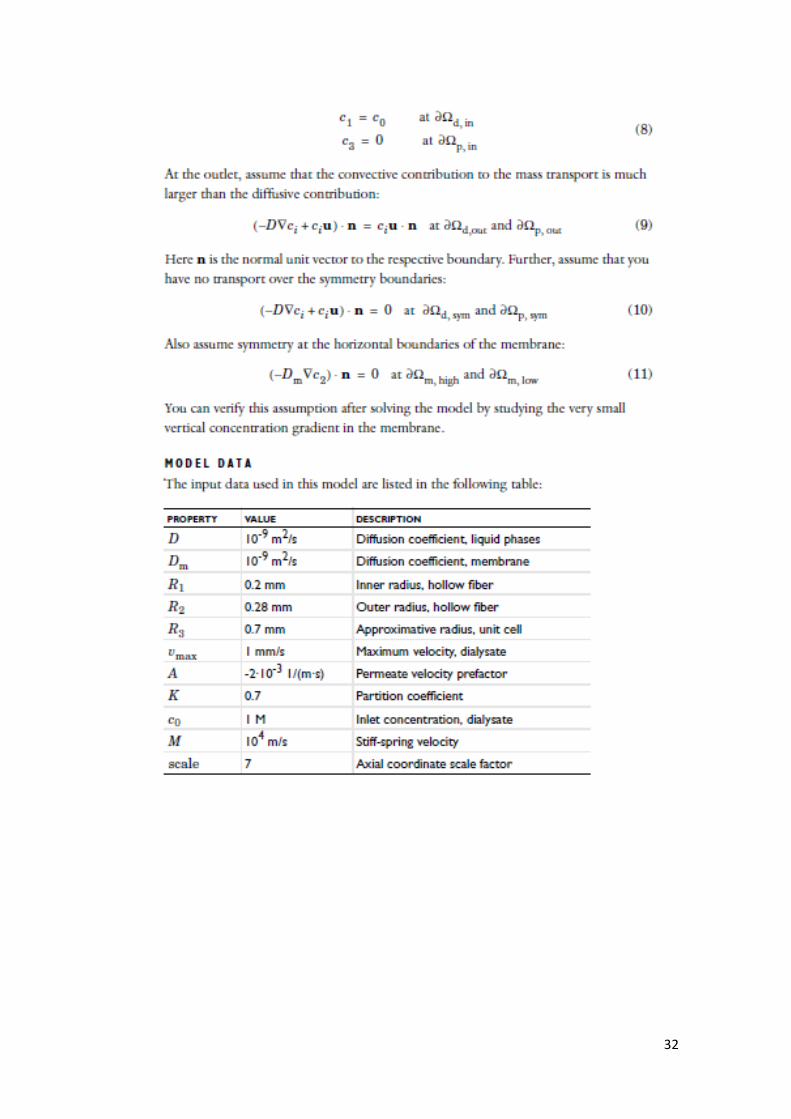
32

33

34

35
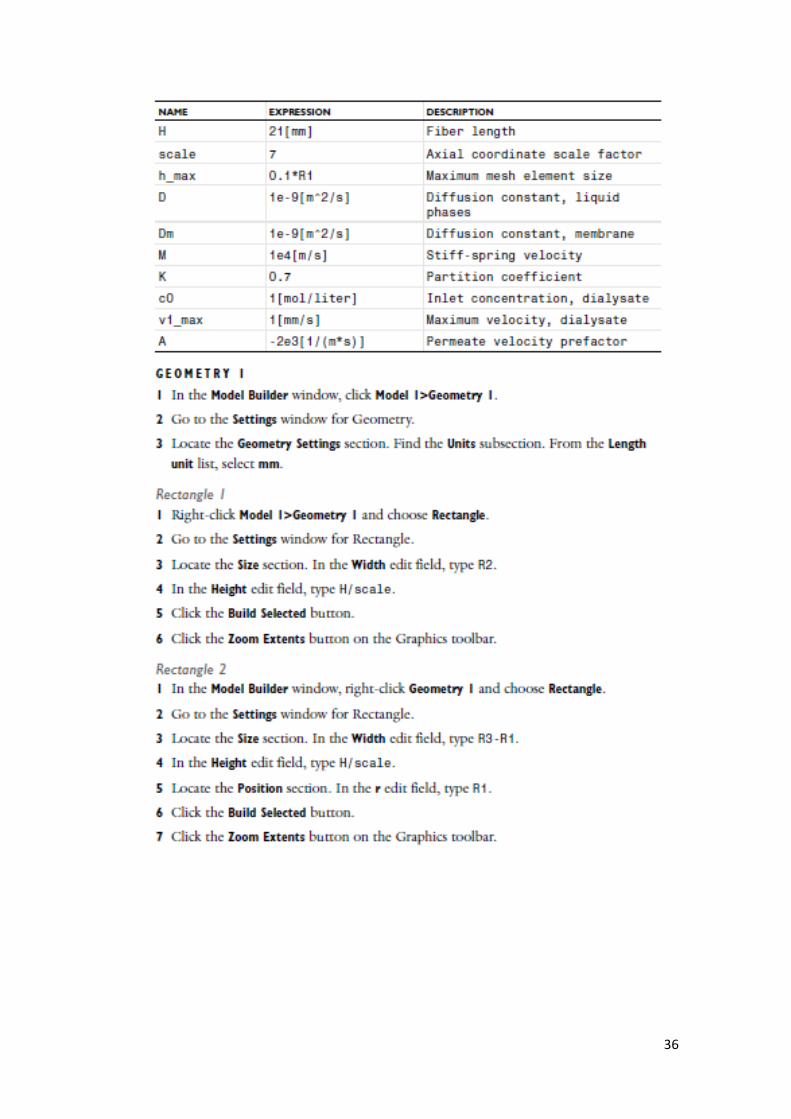
36
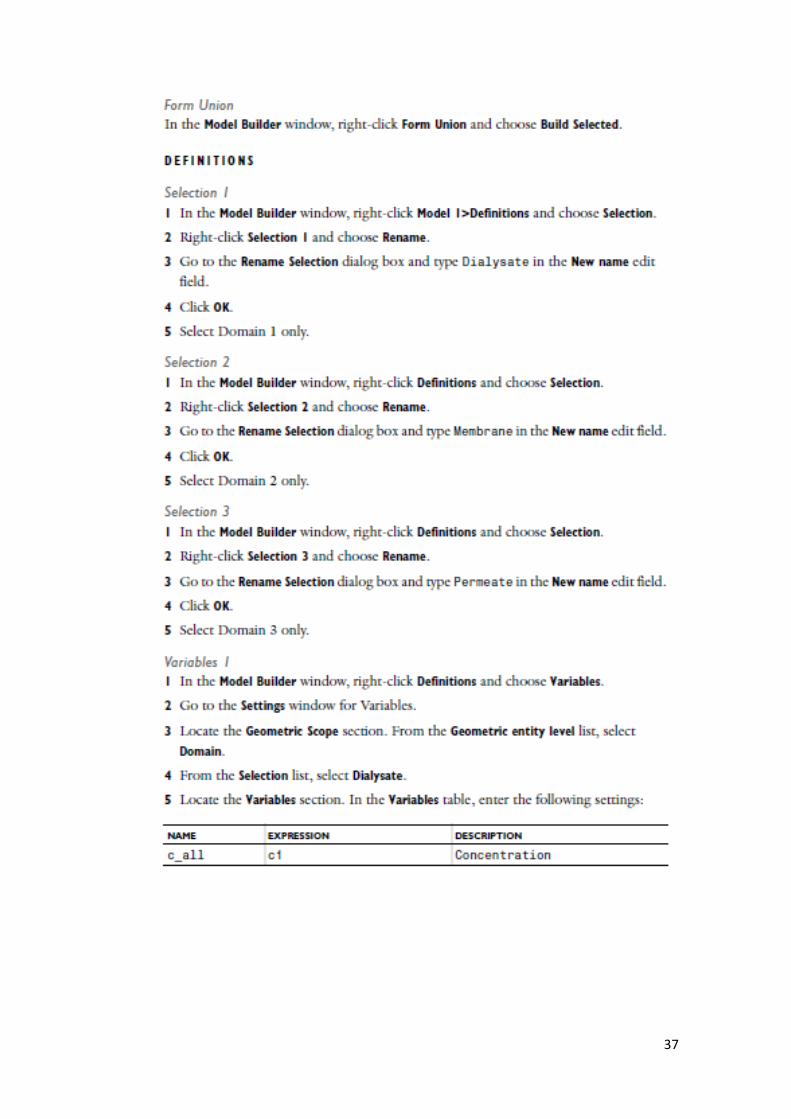
37

38

39
40

41

42


