Investigation of detectors for border traffic counts 5 th Bi-Annual Border to Border Transportation...
20
Investigation of detectors for border traffic counts 5 th Bi-Annual Border to Border Transportation Conference Project sponsor—Center for International Intelligent Transportation Research Dan Middleton, Ph.D., P.E.
-
Upload
lindsay-short -
Category
Documents
-
view
216 -
download
0
Transcript of Investigation of detectors for border traffic counts 5 th Bi-Annual Border to Border Transportation...
Investigation of detectors for border traffic counts
5th Bi-Annual Border to BorderTransportation Conference
Project sponsor—Center for International Intelligent Transportation Research
Dan Middleton, Ph.D., P.E.

Outline
• Justification• Background• Study Methodology• Detector selection• Results• Conclusions

Justification
• Existing Sources of Vehicle Count Data– CBP– TxDOT– Ports of Entry
• Why these sources are not sufficient– Permission not always granted– Granularity not sufficient– No control over quality of data

Background
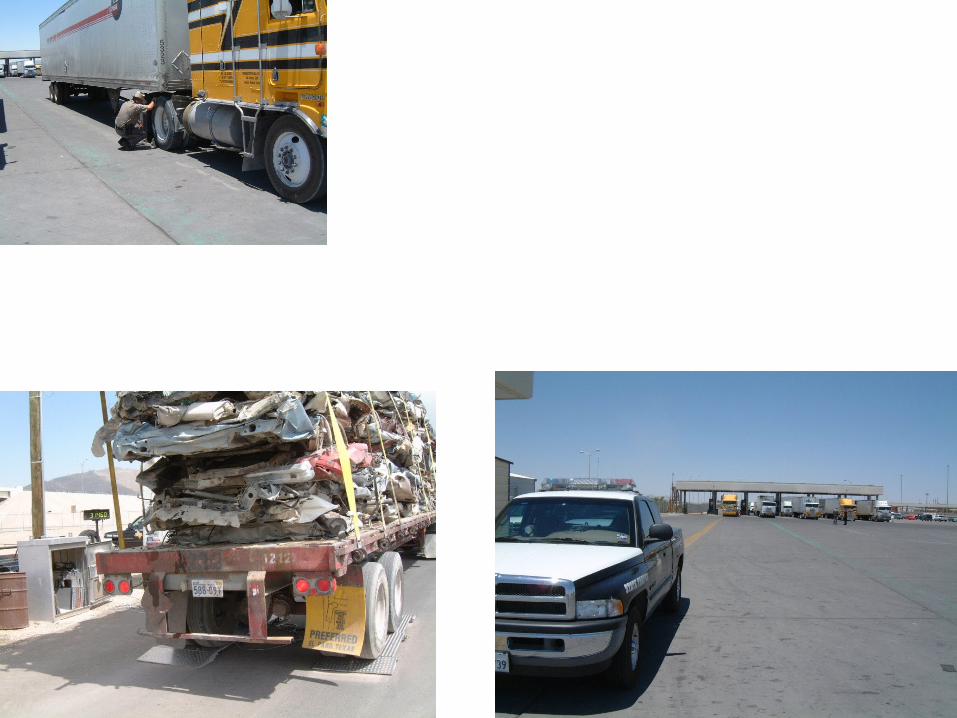
• Tests conducted earlier– TAMU Riverside campus– Local streets in College Station– Bridge of the Americas– Ysleta/Zaragoza

Study Methodology
• Task 1. Investigate latest detectors• Task 2. Conduct initial field tests• Task 3. Conduct final field tests• Task 4. Produce deliverables
Detector Selection
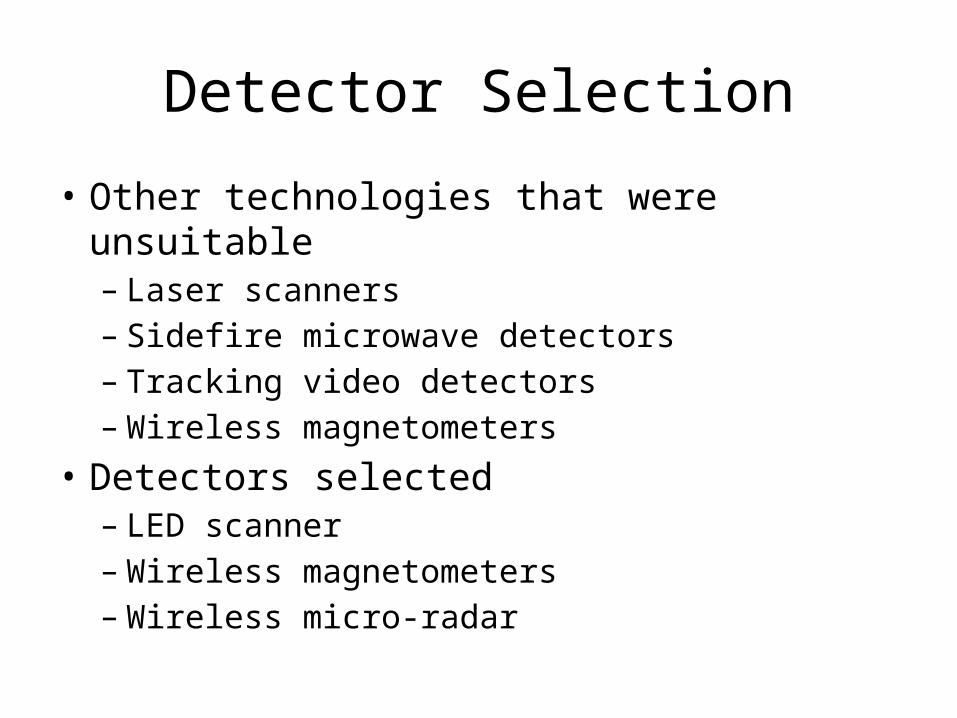
• Other technologies that were unsuitable– Laser scanners– Sidefire microwave detectors– Tracking video detectors– Wireless magnetometers
• Detectors selected– LED scanner– Wireless magnetometers– Wireless micro-radar

LED Scanner
• Easy to integrate• 16 independent segments (zones)• 45-degree beam• 0 to 50 meter range• Rapid data acquisition rate (50 Hz)• Weather resistant enclosure

Wireless Magnetometers
• Range up to 6 ft• Moderate to high speed• Drill 4-inch diameter hole• Communicates with roadside• Designed for larger vehicles • Battery life about 10 years• Omni-directional
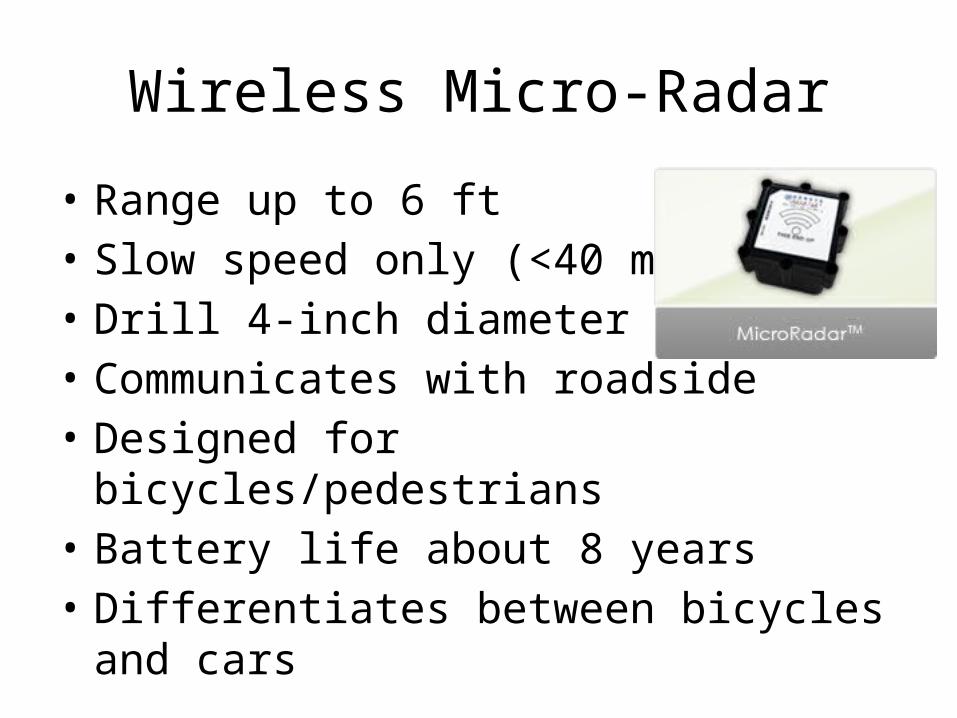
Wireless Micro-Radar
• Range up to 6 ft• Slow speed only (<40 mph)• Drill 4-inch diameter hole• Communicates with roadside• Designed for bicycles/pedestrians • Battery life about 8 years• Differentiates between bicycles and cars

Leddar IS16 SensorLanes 5 and 6
SN Micro-RadarLanes 2 and 3
SN Micro-RadarLane 2
Leddar IS16 Sensor
YSLETA Car Entrance

Ysleta TRUCK SITE
Leddar IS16 Sensor
SN Micro-Radar
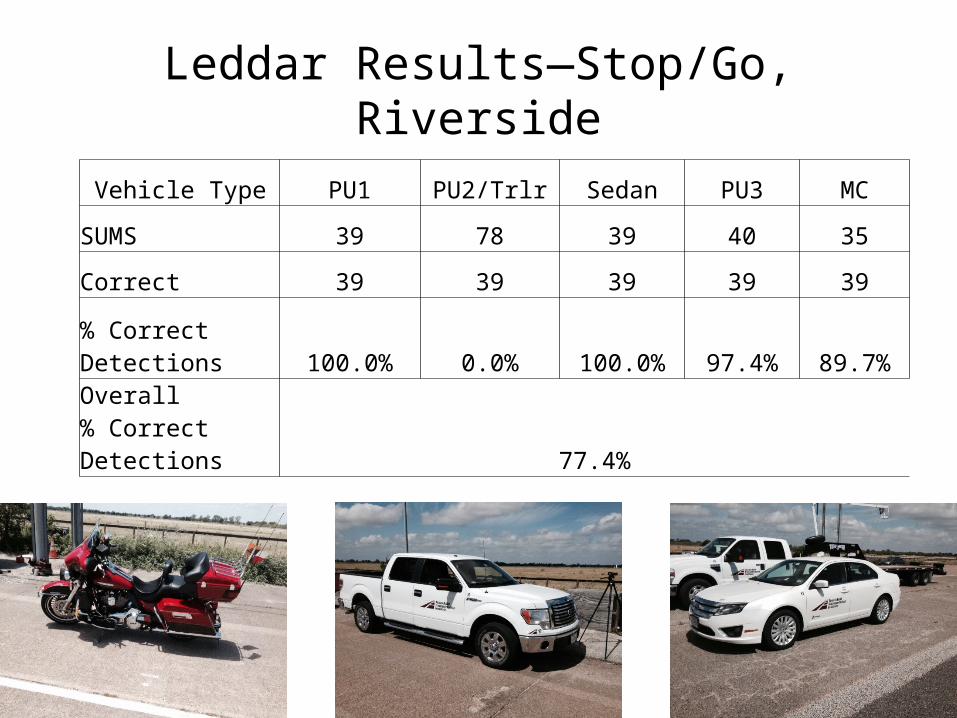
Leddar Results—Stop/Go, Riverside Vehicle Type PU1 PU2/Trlr Sedan PU3 MC
SUMS 39 78 39 40 35
Correct 39 39 39 39 39
% Correct Detections 100.0% 0.0% 100.0% 97.4% 89.7%Overall % Correct Detections 77.4%

SN Magnetometer Results – Constant Speed, Riverside
IntervalStart
GroundTruth
Magnetometers
NB1S2 NBS1 NB1S313:22 6 10 8 113:23 4 9 8 813:24 7 12 12 1213:25 9 15 13 1613:26 7 15 14 1413:27 8 14 13 1313:28 8 13 14 1513:29 8 12 13 1313:30 9 14 14 1413:31 7 13 15 1713:32 8 12 13 1413:33 8 14 15 1613:34 6 8 8 713:35 8 15 15 1513:36 8 12 13 1513:37 8 16 15 17
SUMS 119 204 203 207% Error 41.7% 41.2% 43.1%
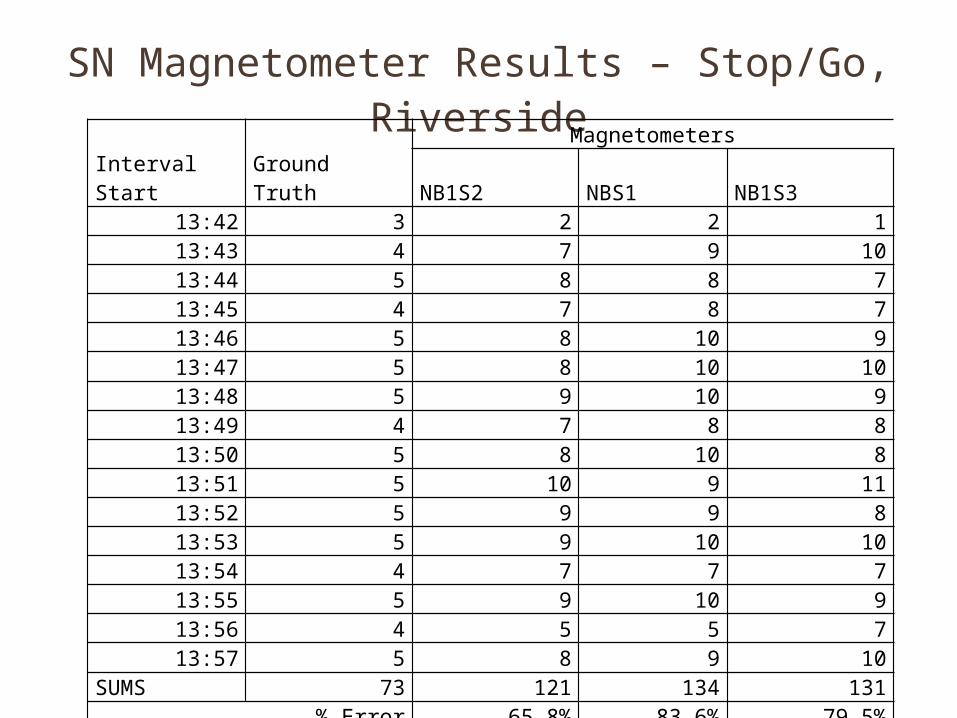
SN Magnetometer Results – Stop/Go, RiversideIntervalStart
GroundTruth
Magnetometers
NB1S2 NBS1 NB1S313:42 3 2 2 113:43 4 7 9 1013:44 5 8 8 713:45 4 7 8 713:46 5 8 10 913:47 5 8 10 1013:48 5 9 10 913:49 4 7 8 813:50 5 8 10 813:51 5 10 9 1113:52 5 9 9 813:53 5 9 10 1013:54 4 7 7 713:55 5 9 10 913:56 4 5 5 713:57 5 8 9 10
SUMS 73 121 134 131% Error 65.8% 83.6% 79.5%

SN Micro-Radar at Constant Speed,Ysleta Truck Site
Time Period GT Video SN #1 % Diff. SN #2 % Diff.
14:30–14:45 27 26 −3.7% 26 −3.7%
14:45–15:00 19 5 −73.7% 5 −73.7%
15:00–15:15 38 37 −2.6% 37 −2.6%
15:15–15:30 32 31 −3.1% 32 0.0%
15:30–15:45 35 36 2.9% 36 2.9%
15:45–16:00 33 30 −9.1% 30 −9.1%
16:00–16:15 19 21 10.5% 21 10.5%
16:15–16:30 22 21 −4.5% 22 0.0%
16:30–16:45 23 22 −4.3% 24 4.3%
16:45–17:00 24 21 −12.5% 23 −4.2%
17:00–17:15 7 7 0.0% 7 0.0%
SUMS 322 297 307
% Error: −7.8% % Error −4.7%

SN Micro-Radar Stop/Go, Ysleta Car Entrance
Time Period GT Video Lane 2 % Diff. GT Video Lane 3 % Diff.
14:45–15:00 27 27 0.0%
15:00–15:15 19 20 5.3%
15:15–15:30 15 14 –6.7%
15:30–15:45 37 35 –5.4%
15:45–16:00 25 26 4.0%
16:00–16:15 38 37 –2.6%
16:15–16:30 36 31 −13.9% 43 41 −4.7%
16:30–16:45 34 29 −14.7% 43 41 −4.7%
16:45–17:00 29 25 −13.8% 37 37 0.0%
17:00–17:15 39 34 −12.8% 51 44 −13.7%
17:15–17:30 39 34 −12.8% 57 52 −8.8%
SUMS 177 153 231 215
% Error −13.6% % Error −4.6%

Summary of Recent Ysleta Tests
Date/Location Detector Vehicle Type Primary Motion % Error
June 16Pole Mast Arm
LeddarNon-Trucks Constant Speed
Faulty Video
Micro-Radar Not Tested
June 17Car Tollbooth
LeddarNon-Trucks Stop-and-Go
0.0%
Micro-Radar Not Tested
June 18DPS Truck Site
LeddarTrucks Constant Speed
0.0%
Micro-Radar −3.6% and −0.3%a
June 19Car Tollbooth
LeddarNon-Trucks Stop-and-Go
Not Tested
Micro-Radar −13.6% and −4.6%

RECOMMENDATIONS
• Leddar IS16 exhibited best performance• Minor software enhancements needed• Micro-radar appropriate where overhead
mounts not practical• Longer term tests
– Test both detectors 3-4 mo– Select variety of environments—both trucks and
non-trucks

Dan Middleton, Ph.D., P.E. Texas A&M Transportation Institute 2929 Research Parkway College Station, TX 77843-3135 Phone: (979) 845-7196 Fax: (979) 845-9873 Email: [email protected]