Investigation of Cross-Frequency Phase-Amplitude...
4
Abstract— Cross-frequency phase-amplitude coupling (PAC) within large neuronal populations is hypothesized to play a functional role in information processing in a range of cognitive tasks. The goal of our study was to examine the putative role of PAC in the brain networks that mediate continuous visuomotor control. We estimated the cortical activity that mediates visuomotor control via magnetoencephalography (MEG) recordings in 15 healthy volunteers. We extracted the cortical signal amplitudes and phases at the frequencies of interest by means of band-pass filtering followed by Hilbert transforms. To quantify task-related changes of PAC, we implemented a technique based on the Kullback-Leibler divergence. The choice of this technique among others was based on the results of comparisons performed on simulations of coupled sources in various noise conditions. The application of PAC to the MEG data revealed a significant task-related increase in coupling between the phase of delta (2-5 Hz) and the amplitude of high- gamma (60-90 Hz) oscillations in the occipital and parietal cortices as well as in the cerebellum. Remarkably, when comparing PAC in the early trials to PAC recorded towards the end of the experiment we found a significant increase in delta-high-gamma coupling over time in the superior parietal lobule, possibly reflecting visuomotor adaptation processes. Our results suggest that, in addition to power modulations, cross-frequency interactions play a key role in visuomotor behavior. I. INTRODUCTION Phase-amplitude coupling (PAC) of electrophysiological signals, which occurs for instance when amplitudes of faster oscillations are modulated by phases of slower rhythms, is a phenomenon that has been attracting increasing interest among neuroscience researchers. Cross-frequency PAC has been reported using both invasive and non-invasive recordings, and has been studied not only in tests for local cross-frequency interactions, but also in the analysis of long- range coupling [1]. Since high-frequency oscillations are usually related to localized cortical information processing, whereas low-frequency rhythms can be modulated across brain regions by both internal cognitive processing and external sensory inputs, it is believed that PAC phenomena might reflect the transfer of information from distributed brain networks, which operate at the timescales of typical behavioral processes, to the faster localized cortical processing units, which perform the actual computation and *Research supported in part by the Foundation pour la Recherche Medicale (FRM). J.L.P. Soto is with the Telecommunications and Control Engineering Department, University of Sao Paulo, Sao Paulo, Brazil (corresponding author, phone: +55-11-3091-5142; e-mail: [email protected]). K. Jerbi is with the Brain Dynamics and Cognition Team, Lyon Neuroscience Research Center (INSERM U1028, CNRS UMR5292, University Lyon I), Lyon, France (e-mail: [email protected]). synaptic transmission of information [2]. In humans, PAC has been detected in regions such as the hippocampus [3], the basal ganglia [4] and the neocortex [5], and has been linked to memory maintenance [3], decision making [6], reward processing [4], and visuomotor learning [7], among other cognitive tasks. In this study, our goal was to investigate task-modulated changes in local PAC between low-frequency phase and high-frequency amplitude of cortical activity across the brain using magnetoencephalography (MEG) signals acquired during a visuomotor (VM) control experiment. In particular, we focused on the phase of the delta frequency band (2-5 Hz) and the amplitude of the high-gamma frequency band (60-90 Hz). The motivation for this stems from observations of an increase in cortical power at these frequency bands around the contralateral motor cortex during a visuomotor task [8], suggesting a possible functional role for cross-frequency interaction in these bands. We converted MEG measurements into estimated current densities with a linear minimum-norm inverse solution, and obtained their delta phase and high-gamma amplitude representations by means of band-pass filtering followed by Hilbert transforms. As there are several methods available to estimate cross-frequency PAC, we compared the performance of five different techniques using an ROC analysis and simulated cross-frequency coupling between synthetic cortical time series. Once we identified the most robust PAC modulation detection method, we analyzed real multi-subject MEG data, looking for PAC modulations between the VM task and rest condition. Additionally, we also examined the putative modulations of PAC between the early phase and late phase of the VM experiment to test for a putative role of PAC in visuomotor adaptation. II. METHODS A. Phase-Amplitude Coupling Let us consider a time series x(t) and narrowband signals x L (t) and x H (t), which are obtained by band-pass filtering x(t) at low- and high-frequency bands B L and B H , respectively. There is phase-amplitude coupling between B L and B H for this time series if the amplitude of x H (t), which we call a H (t), and the phase of x L (t), which we call φ L (t), are correlated. We can obtain a H (t) and φ L (t) by applying the Hilbert transform to the narrowband signals x H (t) and x L (t), respectively. In this work, we used Kaiser windowing and filtering in both forward and reverse directions, to avoid phase distortion. A number of methods to estimate the degree of coupling between a H (t) and φ L (t) has been proposed. The PAC methods we analyzed are presented in table I (see [9, 10] and Investigation of Cross-Frequency Phase-Amplitude Coupling in Visuomotor Networks using Magnetoencephalography* Juan L.P. Soto and Karim Jerbi, Member, IEEE
Transcript of Investigation of Cross-Frequency Phase-Amplitude...
Abstract— Cross-frequency phase-amplitude coupling (PAC) within large neuronal populations is hypothesized to play a functional role in information processing in a range of cognitive tasks. The goal of our study was to examine the putative role of PAC in the brain networks that mediate continuous visuomotor control. We estimated the cortical activity that mediates visuomotor control via magnetoencephalography (MEG) recordings in 15 healthy volunteers. We extracted the cortical signal amplitudes and phases at the frequencies of interest by means of band-pass filtering followed by Hilbert transforms. To quantify task-related changes of PAC, we implemented a technique based on the Kullback-Leibler divergence. The choice of this technique among others was based on the results of comparisons performed on simulations of coupled sources in various noise conditions. The application of PAC to the MEG data revealed a significant task-related increase in coupling between the phase of delta (2-5 Hz) and the amplitude of high-gamma (60-90 Hz) oscillations in the occipital and parietal cortices as well as in the cerebellum. Remarkably, when comparing PAC in the early trials to PAC recorded towards the end of the experiment we found a significant increase in delta-high-gamma coupling over time in the superior parietal lobule, possibly reflecting visuomotor adaptation processes. Our results suggest that, in addition to power modulations, cross-frequency interactions play a key role in visuomotor behavior.
I. INTRODUCTION
Phase-amplitude coupling (PAC) of electrophysiological signals, which occurs for instance when amplitudes of faster oscillations are modulated by phases of slower rhythms, is a phenomenon that has been attracting increasing interest among neuroscience researchers. Cross-frequency PAC has been reported using both invasive and non-invasive recordings, and has been studied not only in tests for local cross-frequency interactions, but also in the analysis of long-range coupling [1]. Since high-frequency oscillations are usually related to localized cortical information processing, whereas low-frequency rhythms can be modulated across brain regions by both internal cognitive processing and external sensory inputs, it is believed that PAC phenomena might reflect the transfer of information from distributed brain networks, which operate at the timescales of typical behavioral processes, to the faster localized cortical processing units, which perform the actual computation and
*Research supported in part by the Foundation pour la Recherche Medicale (FRM).
J.L.P. Soto is with the Telecommunications and Control Engineering Department, University of Sao Paulo, Sao Paulo, Brazil (corresponding author, phone: +55-11-3091-5142; e-mail: [email protected]).
K. Jerbi is with the Brain Dynamics and Cognition Team, Lyon Neuroscience Research Center (INSERM U1028, CNRS UMR5292, University Lyon I), Lyon, France (e-mail: [email protected]).
synaptic transmission of information [2]. In humans, PAC has been detected in regions such as the hippocampus [3], the basal ganglia [4] and the neocortex [5], and has been linked to memory maintenance [3], decision making [6], reward processing [4], and visuomotor learning [7], among other cognitive tasks.
In this study, our goal was to investigate task-modulated changes in local PAC between low-frequency phase and high-frequency amplitude of cortical activity across the brain using magnetoencephalography (MEG) signals acquired during a visuomotor (VM) control experiment. In particular, we focused on the phase of the delta frequency band (2-5 Hz) and the amplitude of the high-gamma frequency band (60-90 Hz). The motivation for this stems from observations of an increase in cortical power at these frequency bands around the contralateral motor cortex during a visuomotor task [8], suggesting a possible functional role for cross-frequency interaction in these bands.
We converted MEG measurements into estimated current densities with a linear minimum-norm inverse solution, and obtained their delta phase and high-gamma amplitude representations by means of band-pass filtering followed by Hilbert transforms. As there are several methods available to estimate cross-frequency PAC, we compared the performance of five different techniques using an ROC analysis and simulated cross-frequency coupling between synthetic cortical time series. Once we identified the most robust PAC modulation detection method, we analyzed real multi-subject MEG data, looking for PAC modulations between the VM task and rest condition. Additionally, we also examined the putative modulations of PAC between the early phase and late phase of the VM experiment to test for a putative role of PAC in visuomotor adaptation.
II. METHODS
A. Phase-Amplitude Coupling Let us consider a time series x(t) and narrowband signals
xL(t) and xH(t), which are obtained by band-pass filtering x(t) at low- and high-frequency bands BL and BH, respectively. There is phase-amplitude coupling between BL and BH for this time series if the amplitude of xH(t), which we call aH(t), and the phase of xL(t), which we call φL(t), are correlated. We can obtain aH(t) and φL(t) by applying the Hilbert transform to the narrowband signals xH(t) and xL(t), respectively. In this work, we used Kaiser windowing and filtering in both forward and reverse directions, to avoid phase distortion.
A number of methods to estimate the degree of coupling between aH(t) and φL(t) has been proposed. The PAC methods we analyzed are presented in table I (see [9, 10] and
Investigation of Cross-Frequency Phase-Amplitude Coupling in Visuomotor Networks using Magnetoencephalography*
Juan L.P. Soto and Karim Jerbi, Member, IEEE

references therein). Although there is evidence that KLD has the best performance under a variety of signal conditions, not only in the detecting but also in the quantifying of the amount of PAC [9], no method has yet been chosen as the gold standard for detection of task-based changes in PAC.
B. Simulated Data To find which PAC implementation among those
described above (see Table 1) provides the most accurate and robust detection of task-based changes in PAC, we use an ROC (receiver operating characteristic) analysis. This analysis is based on creating several realizations of the synthetic time series y(t), according to the expression:
y(t) = sin(2πfLt) + [p(t) × sin(2πfHt)] + n(t), (1)
where fL = 3 Hz, fH = 70 Hz, n(t) is zero-mean Gaussian noise with variance σ2, and p(t) is given by
p(t) = 0.5[(1−χ)sin(2πfLt)+1+χ], (2)
thus creating the coupling between sin(2πfLt) and sin(2πfHt) [9]. The parameter χ ∈ [0, 1] controls the degree of coupling: maximum coupling is obtained for χ = 0, while χ = 1 represents no coupling at all.
We create 100 datasets, divided in two 50-dataset groups, each dataset consisting of 100 realizations of y(t). In the datasets of the first group, the first 50 realizations of y(t) have coupling (χ < 1), while the last 50 realizations have no coupling (χ = 1); in the datasets of the second group, χ = 1 for all realizations. With one of the presented methods, and at each dataset, we obtain from each realization an estimate of the coupling between the delta and high-gamma bands, and then perform a t-test on the 100 computed PAC estimates to test for differences between the first 50 realizations and the last 50; we obtain p-values associated with these tests by means of resampling methods, in which surrogate PAC estimates were computed by randomly reordering the realizations [11]. This gives us 50 p-values for each group:
the p-values of the first group are used to compute the true positive fraction (TPF) for a given confidence level, while
Figure 1. Values of the area under the ROC curve computed from the 100 datasets of simulated signals and with the six PAC methods presented above, for varying parameters of χ, σ, the period of y(t), and the sampling frequency of the signal.
TABLE I. METHODS FOR ESTIMATION OF PAC
Method Mathematical expression Mean vector length (MVL) M1(t) = |Σt {aH(t) × exp[jφL(t)]}| Normalized MVL (MVLN) M2(t) = M1(t) / Σt |aH(t)|2 General linear model (GLM)a M3(t) = [SS(aH)−SS(e)]/SS(aH) Phase synchrony (PS) b M4(t) = exp{j[φH(t)−φL(t)]} Kullback-Leibler divergence (KLD) c M5(t) = Σn f(n) × log{f(n)/g(n)}
Heights ratio (HR) d M6(t) = (fmax − fmin)/ fmax a. The linear model is represented by the expression aH = Xβ + e, where vector aH
contains aH(t) for all t, X is a 2-column matrix where each row contains the real and imaginary components of exp[jφL(t)], β is the vector of regression
coefficients, and e is the error vector. SS means sum of squares.
b. φH(t) is found by applying the Hilbert transform on aH(t) and taking the phase of the resulting signal.
c. f(n) is the probability density of aH(t) as a function of φL(t), and g(n) is the probability density of the uniform distribution.
d. fmax − fmin are, respectively, the maximum and minimum values of f(n).
with the p-values of the second group we get the false positive fraction (FPF). By varying the confidence level, we find our ROC curve for these datasets.
In fig. 1 we present the results of the ROC analysis, for different values of χ, σ, the period of y(t), and the sampling frequency of the signal. We tested the PAC methods mentioned above: MVL, MVLN, GLM, PS, KLD, and HR. In these plots, the y-axis represents the area under the ROC curve (AUC), which varies between 0 and 1, 1 indicating perfect discrimination performance. We can see from these graphs that, except for non-normalized MVL, all methods had good performance under non-extreme noise conditions, and that the KLD method appears to be slightly better than the others. Based on this, we chose KLD to perform the subsequent analysis on real MEG data. Basically, this method compares the probability distribution of aH(t) and φL(t) (obtained empirically from the time series) with the uniform distribution; the greater the disparity between these two distributions, the stronger the PAC.
C. Visuomotor Data After finding the best method to detect task-based
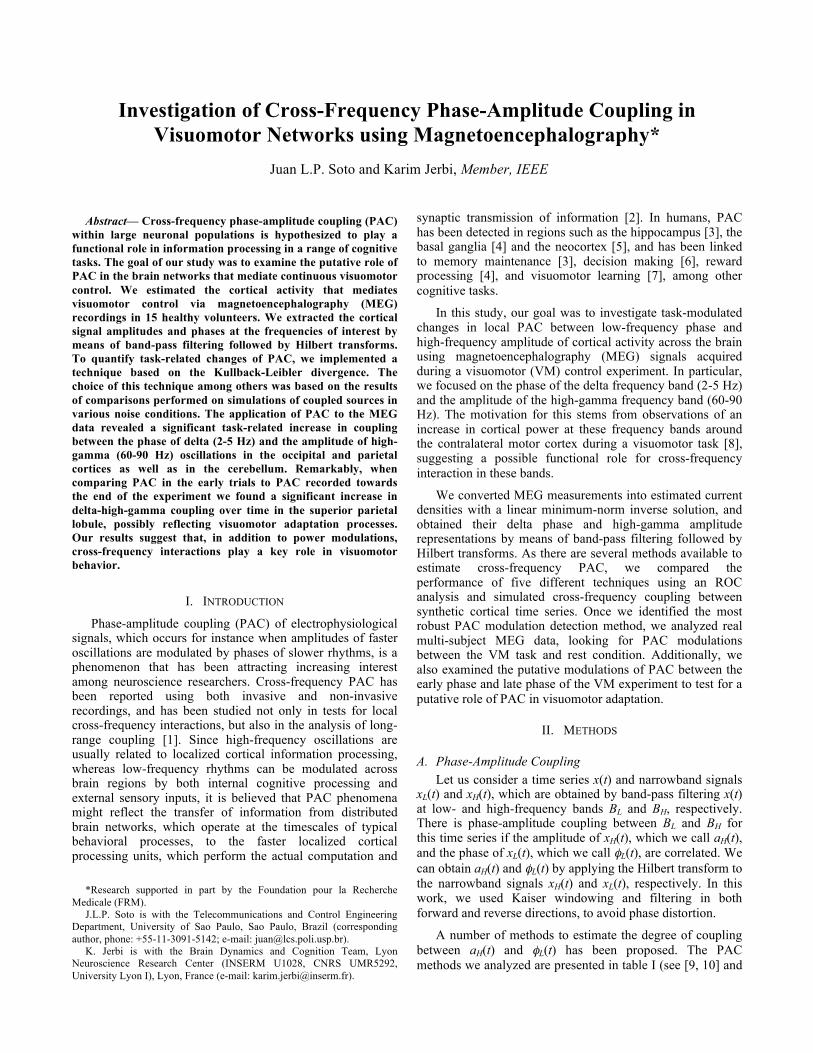
changes in PAC, we proceeded to the analysis of MEG data acquired during a visuomotor coordination study [12]. Signals were recorded from 15 subjects while they were under two conditions: the visuomotor task (VM), where they watched a randomly rotating cube on a screen in front of them and had to prevent its rotation by operating a trackball with their right hand; and rest (R), where they looked at a still cube without performing any activity. Data were acquired for several repetitions of the experiment for both conditions, and the trial duration was 1s. The experimental setting is shown in fig. 2.
The MEG recordings from all subjects were converted into current density maps on the cortical surface by means of a minimum-norm inverse solution [13, 12], combined with a co-registration procedure that mapped the anatomical information from all subjects onto a common brain atlas [12]. We then applied band-pass filters followed by Hilbert transforms to the current density time series, to obtain the delta phases and high-gamma amplitudes at each spatial location. Finally, we estimated PAC between delta and high-gamma with the KLD approach.
For a given subject, this procedure gave us, at each brain location, several PAC estimates for VM and R (one for each repetition of the experiment), which we call qVM(s,i,j) and qR(s,i,j), respectively (s is the index for subject, i is the index for location, and j is the index for repetition). We used the qVM(s,i,j) and qR(s,i,j) to run a multi-subject statistical analysis [14], which consisted of the following steps: first, we calculated the mean change in PAC at the subject level, according to the equation:
r(s,i) = Ej{ qVM(s,i,j) } − Ej{ qR(s,i,j) }, (3)
where Ej{} is the mean (over repetitions) of all PAC estimates for the given location and subject. Afterwards, the mean PAC changes served as inputs to a group-level general linear model:
r(s,i) = u(i) + ε(s,i), (4)
where u(i) is the group regression parameter and ε(s,i) is an error term. The significance of each u(i) was assessed with t-tests, but since the null distribution was not known, we found it empirically with resampling methods: surrogate versions of the estimated u(i) were calculated by randomly selecting some of the r(s,i) and changing their signs. To take into account the multiple comparison problem, we implemented a procedure that controls the false discovery rate [15].
III. RESULTS
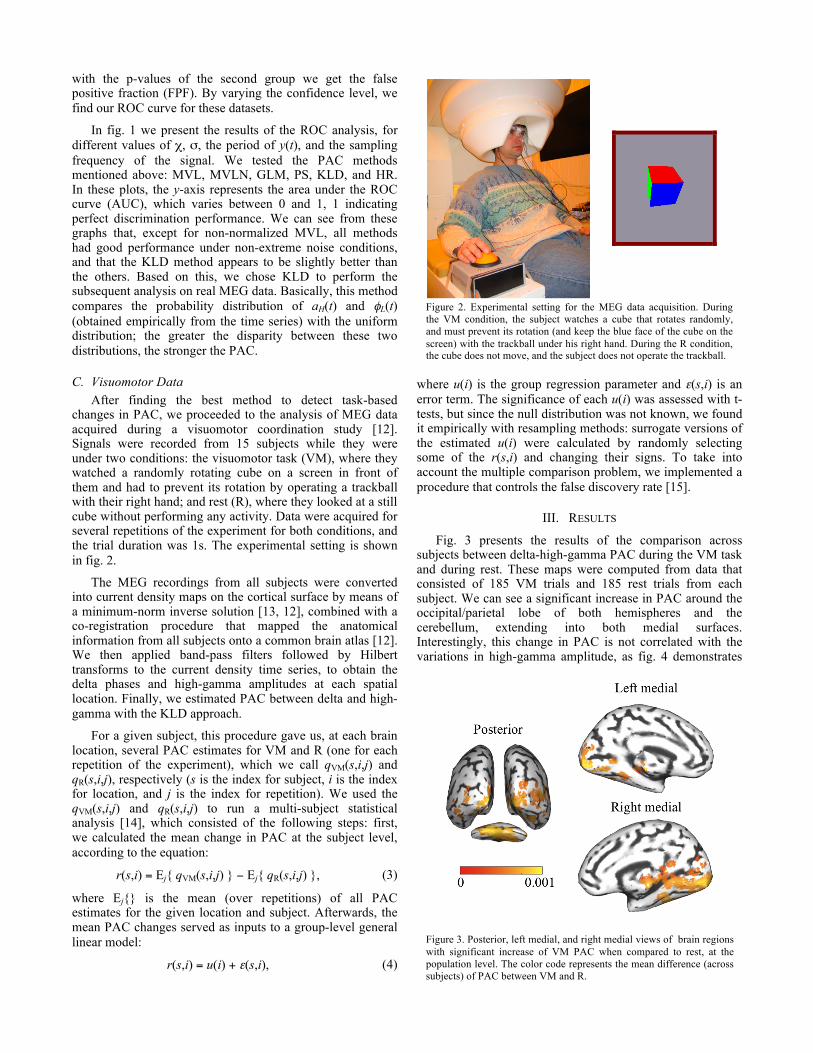
Fig. 3 presents the results of the comparison across subjects between delta-high-gamma PAC during the VM task and during rest. These maps were computed from data that consisted of 185 VM trials and 185 rest trials from each subject. We can see a significant increase in PAC around the occipital/parietal lobe of both hemispheres and the cerebellum, extending into both medial surfaces. Interestingly, this change in PAC is not correlated with the variations in high-gamma amplitude, as fig. 4 demonstrates
Figure 2. Experimental setting for the MEG data acquisition. During the VM condition, the subject watches a cube that rotates randomly, and must prevent its rotation (and keep the blue face of the cube on the screen) with the trackball under his right hand. During the R condition, the cube does not move, and the subject does not operate the trackball.
Figure 3. Posterior, left medial, and right medial views of brain regions with significant increase of VM PAC when compared to rest, at the population level. The color code represents the mean difference (across subjects) of PAC between VM and R.

that if we run the same multi-subject statistical analysis as described above, but use high-gamma signal power instead of delta-high-gamma PAC as inputs, we only find strong increases around the left motor cortex (contralateral to the moving right hand). Even if we perform more lenient statistical tests by not correcting for multiple comparisons, no significant high-gamma power changes in the occipital cortex or in the cerebellum are found.
Next, we compared PAC during the VM task between trials at the beginning of the experiment and trials at the end in order to monitor possible PAC modulations across the time course of the experiment. The resulting brain maps (Fig. 5) reveal small regions in the superior parietal lobule, extending into the medial surfaces of both hemispheres, where PAC is higher at the end of the experiment than at beginning. This increase might be the consequence of a task learning or adaptation process taking place in the brain over the course of the continuous visuomotor tracking experiment.
IV. CONCLUSION In this study we investigated task-related modulations of
cross-frequency coupling between delta and high-gamma rhythms in the brain, using MEG data acquired during a visuomotor task. We found changes in PAC between delta phase and high-gamma amplitude to be enhanced in the VM condition compared to the rest condition in the parietal and in the visual cortex. Although primary motor areas did not show an increase in delta/high-gamma PAC, further investigations across other frequencies, and using cross-regional coupling, will be needed to fully address the question of whether PAC mechanisms also operate in the motor cortex. We also intend to continue studying in more detail the link between PAC and visuomotor learning. Finally, in order to single out the specific role of PAC in VM control and adaptation, a topic for further analysis is a comparison between visuomotor and other experimental conditions, such as purely visual, purely motor, or uncoordinated visual-motor behavior.
REFERENCES [1] A.B.L. Tort, M.A. Kramer, C. Thorn, D.J. Gibson, Y. Kubota, A.M. Graybiel
and N.J. Kopell, “Dynamic cross-frequency couplings of local field potential oscillations in rat striatum and hippocampus during performance of a T-maze task”, Proc. Natl. Acad. Sci., vol. 105(51), pp. 20517-20522, 2008.
[2] R.T. Canolty and R.T. Knight, “The functional role of cross-frequency coupling”, Trends Cogn. Sci., vol. 14(11), pp. 506-511, 2010.
[3] N. Axmacher, M.N. Henseler, O. Jensen, I. Weinreich, C.E. Elger and J. Fell, “Cross-frequency coupling supports multi-item working memory in the human hippocampus”, Proc. Natl. Acad. Sci., vol. 107(7), 3228-3233, 2010.
[4] M.X. Cohen, N. Axmacher, D. Lenartz, C.E. Elger, V. Sturm and T.E. Schlaepfer, “Good vibrations: cross-frequency coupling in the human nucleus accumbens during reward processing”, J. Cogn. Neurosci., vol. 21(5), pp. 875-889, 2009.
[5] R.T. Canolty, E. Edwards, S.S. Dalal, M. Soltani, S.S. Nagarajan, H.E. Kirsch, M.S. Berger, N.M. Barbaro and R.T. Knight, “High-gamma power is phase-locked to theta oscillations in human neocortex”, Science, vol. 313(5793), pp. 1626-1628, 2006.
[6] M.X. Cohen, C.E. Elger and J. Fell, “Oscillatory activity and phase-amplitude coupling in the human medial frontal cortex during decision making”, J. Cogn. Neurosci., vol. 21(2), 380-402, 2009.
[7] B. Perfetti, C. Moisello, E.C. Landsness, S. Kvint, S. Lanzafame, M. Onofri, A. Di Rocco, G. Tononi and M.F. Ghilardi, “Modulation of gamma and theta spectral amplitude and phase synchronization is associated with the development of visuo-motor learning”, J. Neurosci., vol 31(41), pp. 14810-14819, 2011.
[8] K. Jerbi, J.-P. Lachaux, J. Vidal, J.L.P. Soto, H. Hui, D. Pantazis, L. Garnero, R.M. Leahy, O. Bertrand, S. Baillet, “Does long-range alpha-band coupling mediate visually guided motor control?”, presented at the 2010 Annual Meeting of the Organization for Human Brain Mapping, Barcelona, Spain.
[9] A.B.L. Tort, R. Komorowski, H. Eichenbaum and N. Kopell, “Measuring phase-amplitude coupling between neuronal oscillations of different frequencies”, J. Neurophysiol., vol. 104, pp. 1195-1210, 2010.
[10] T.E. Ozkurt and A. Schnitzler, “A critical note on the definition of phase-amplitude cross-frequency coupling”, J. Neurosci. Methods, vol. 201(2), pp. 438-443, 2011.
[11] T.E. Nichols and A.P. Holmes, “Nonparametric permutation tests for functional neuroimaging: a primer with examples”, Hum. Brain Mapp., vol. 15, pp. 1-25, 2001.
[12] K. Jerbi, J.-P. Lachaux, K. N’Diaye, D. Pantazis, R.M. Leahy, L. Garnero and S. Baillet, “Coherent neural representation of hand speed in humans revealed by MEG imaging”, Proc. Natl. Acad. Sci., vol. 104(18), pp. 7676-7681, 2007.
[13] S. Baillet, J.C. Mosher and R.M. Leahy, “Electromagnetic brain mapping”, IEEE Signal Processing Magazine, vol. 18(6), pp. 14-30, 2001.
[14] J.A. Mumford and T.E. Nichols, “Modeling and inference of multisubject fMRI data”, IEEE Eng. Med. Biol. Magazine, vol. 25(2), pp. 42-51, 2006.
[15] C.R. Genovese, N.A. Lazar and T. Nichols, “Thresholding of statistical maps in functional neuroimaging using the false discovery rate”, NeuroImage, vol. 15(4), pp. 870-878, 2002.
Figure 5. Left and right medial views of brain regions where there is a significant increase in PAC at the later trials when compared to earlier ones.
Figure 4. Posterior and superior views of brain regions where there is a significant group-level increase in high-gamma (60-90 Hz) signal power during VM compared to rest. Green locations are significant only if no correction for multiple comparisons is performed, while red locations are significant if false discovery rate (FDR) control is applied.