Investigation of Color Removal by Chemical Oxidation for ... · Investigation of Color Removal by...
64
Investigation of Color Removal by Chemical Oxidation for Three Reactive Textile Dyes and Spent Textile Dye Wastewater Jessica C. Edwards Thesis submitted to the faculty of Virginia Polytechnic Institute and State University in partial fulfillment of the requirements for the degree of MASTER OF SCIENCE in ENVIRONMENTAL SCIENCE AND ENGINEERING John T. Novak, Chair Robert C. Hoehn Clifford W. Randall July 18, 2000 Blacksburg, Virginia Keywords: Ultraviolet light, Hydrogen Peroxide, Chlorine Dioxide, Textile dyes, Wastewater effluent, AOP
Transcript of Investigation of Color Removal by Chemical Oxidation for ... · Investigation of Color Removal by...
Investigation of Color Removal by Chemical Oxidation forThree Reactive Textile Dyes and Spent Textile Dye Wastewater
Jessica C. Edwards
Thesis submitted to the faculty of Virginia Polytechnic Institute and State University inpartial fulfillment of the requirements for the degree of
MASTER OF SCIENCE
in
ENVIRONMENTAL SCIENCE AND ENGINEERING
John T. Novak, ChairRobert C. Hoehn
Clifford W. Randall
July 18, 2000
Blacksburg, Virginia
Keywords: Ultraviolet light, Hydrogen Peroxide, Chlorine Dioxide, Textile dyes,Wastewater effluent, AOP
ii
Investigation of Color Removal by Chemical Oxidation for Three Reactive TextileDyes and Spent Textile Dye Wastewater
Jessica Corinne EdwardsThe Charles E. Via, Jr. Department of Civil and Environmental Engineering
ABSTRACT
This research investigated the efficacy of chlorine dioxide (ClO2), ultraviolet
(UV) irradiation, UV in combination with chlorine dioxide (UV/ClO2), and UV in
combination with hydrogen peroxide (UV/H2O2) for decolorizing three reactive azo dyes
(sultan red, indigo blue and cypress green) and treated textile-manufacturing wastewater.
The objective was to determine the best treatment for reducing color to the Virginia
Pollutant Discharge Elimination System (VPDES) permit level of 300 American Dye
Manufacturers Institute (ADMI) units. The effects of the three chemical oxidation
treatments provided color reduction for all three dyes. The results suggested UV/H2O2
and UV/ClO2 treatments provided maximum color reduction of the red and blue dyes, and
UV/H2O2 was the most effective for maximum reduction of the green dye.
A research goal was to provide predictive models of the wastewater effluent for
the treatment processes, including the UV exposure time required to reach the 300 ADMI
permit value and the effective ClO2 dose necessary to achieve the 300 units. The results
of the investigations regarding the effluent indicated that UV/H2O2 and UV/ClO2 (5
mg/L) provided reduction to 300 units in less than 10 minutes UV exposure when the
initial effluent color was less than 500 ADMI units. Without the addition of oxidant,
contact times longer than 10 minutes were required for UV to decolorize these effluents
to 300 ADMI units. Chlorine dioxide dosages between 10 and 30 mg/L both with and
without UV irradiation achieved the same results.
iii
ACKNOWLEDGEMENTS
I wish to express my sincere appreciation to Dr. John Novak, chairperson of my
committee, for his guidance, insight and patience with this research project and my
education at Virginia Tech. I would also like to express my sincere appreciation to Dr.
Robert Hoehn for his guidance, patience, kindness and wisdom with this research project,
as well as all other important aspects of my time spent at Virginia Tech. I would
additionally like to thank Dr. Clifford Randall for serving on my committee.
Acknowledgements go to the Department of Civil and Environmental
Engineering for financial support. Additional acknowledgements go to Severn Trent and
the Lower Smith WWTP for their financial contribution and furnishing of equipment and
effluent and to Mr. Andy Lash for his assistance with the spectrophotometric program. I
would also like to acknowledge CDG Technologies, Inc. (Allentown, PA) for their
ongoing generosity in donating the chlorine dioxide generator and for their technical
support.
Thanks to Julie Petruska and Jody Smiley for their willingness to help in all
aspects of my research project. Thanks to Betty Wingate for all her secretarial assistance.
I would like to extend eternal gratitude to my two favorite mentors, Brian Brazil
and Dave Holbrook – Thanks also to Trevor Wallace, Jenna Worley, Amanda Dalecky
and Becky Cheadle for making the lab a fun place to be.
Lastly, I would like to express my sincerest appreciation my parents, sister and all
of my extended family for their everlasting support and encouragement.
iv
TABLE OF CONTENTS
ABSTRACT...................................................................................................................ii
ACKNOWLEDGEMENTS .........................................................................................iii
TABLE OF CONTENTS ............................................................................................. iv
LIST OF FIGURES .....................................................................................................vi
LIST OF TABLES .....................................................................................................viii
CHAPTER 1: INTRODUCTION................................................................................ 1
CHAPTER 2: LITERATURE REVIEW .................................................................... 3
Introduction......................................................................................................... 3Textile Dye Characteristics.................................................................................. 4Ultraviolet Lamp and Reactor Characteristics ...................................................... 4UV/H2O2 and Factors that affect Efficiency ......................................................... 5Hydrogen Peroxide Effects on Color Removal..................................................... 7UV Effects on Color Removal ............................................................................. 7Chlorine Dioxide ................................................................................................. 7
CHAPTER 3: MATERIALS AND METHODS ......................................................... 9
Introduction......................................................................................................... 9Chemicals............................................................................................................ 9Glassware ............................................................................................................ 9Dye Solutions ...................................................................................................... 9Wastewater Characteristics ................................................................................ 10ADMI Spectrophotometric Color Analysis Method ........................................... 10Chlorine Dioxide Generation ............................................................................. 10Chlorine Dioxide Analysis by Amperometric Titration ...................................... 11Sample Preservation .......................................................................................... 12Ultraviolet Lamp Unit........................................................................................ 12Treatment by ClO2............................................................................................. 12Treatment by UV/ClO2 ...................................................................................... 12Treatment by H2O2 ............................................................................................ 13Treatment by UV/H2O2...................................................................................... 13
CHAPTER 4: RESULTS ........................................................................................... 14
Effects of UV and UV/H2O2 on Dyes and Wastewater Effluent Color................ 14Effect of ClO2 and UV/ClO2 on Dyes and Wastewater Effluent Color ............... 26
v
Comparison of Oxidant Treatments of Dyes and Wastewater Effluent Color ..... 27
CHAPTER 5: DISCUSSION ..................................................................................... 38
CHAPTER 6: SUMMARY AND CONCLUSIONS.................................................. 43
LITERATURE CITED............................................................................................... 45
APPENDIX.................................................................................................................. 47
VITA............................................................................................................................ 56
vi
LIST OF FIGURES
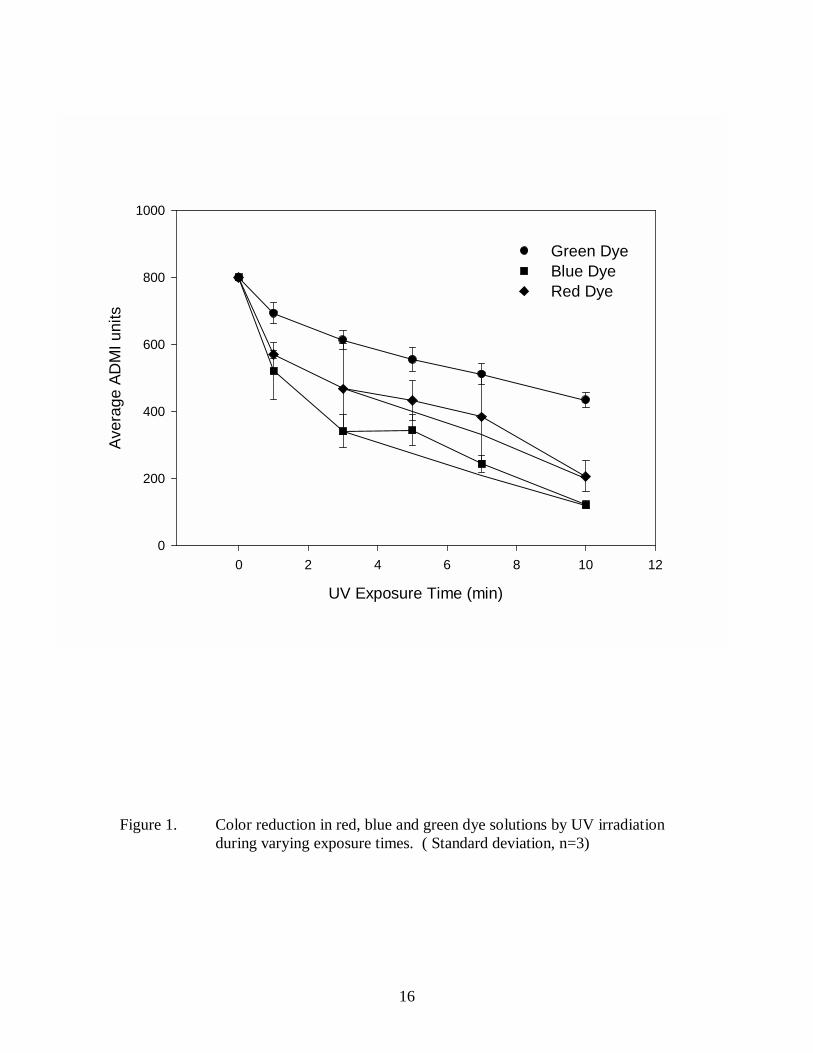
Figure 1. Color reduction in red, blue and green dye solutions by UV irradiation
during varying exposure times. ( Standard deviation, n=3).................................... 16
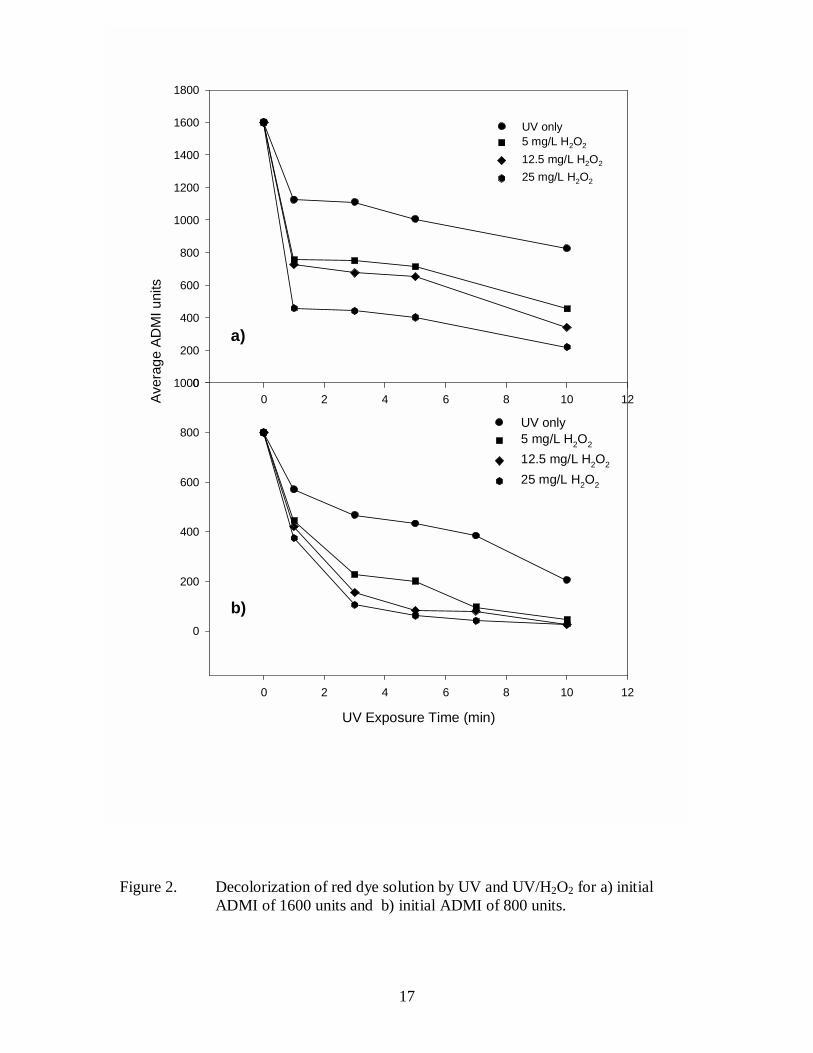
Figure 2. Decolorization of red dye solution by UV and UV/H2O2 for a) initial ADMI
of 1600 units and b) initial ADMI of 800 units. .................................................... 17
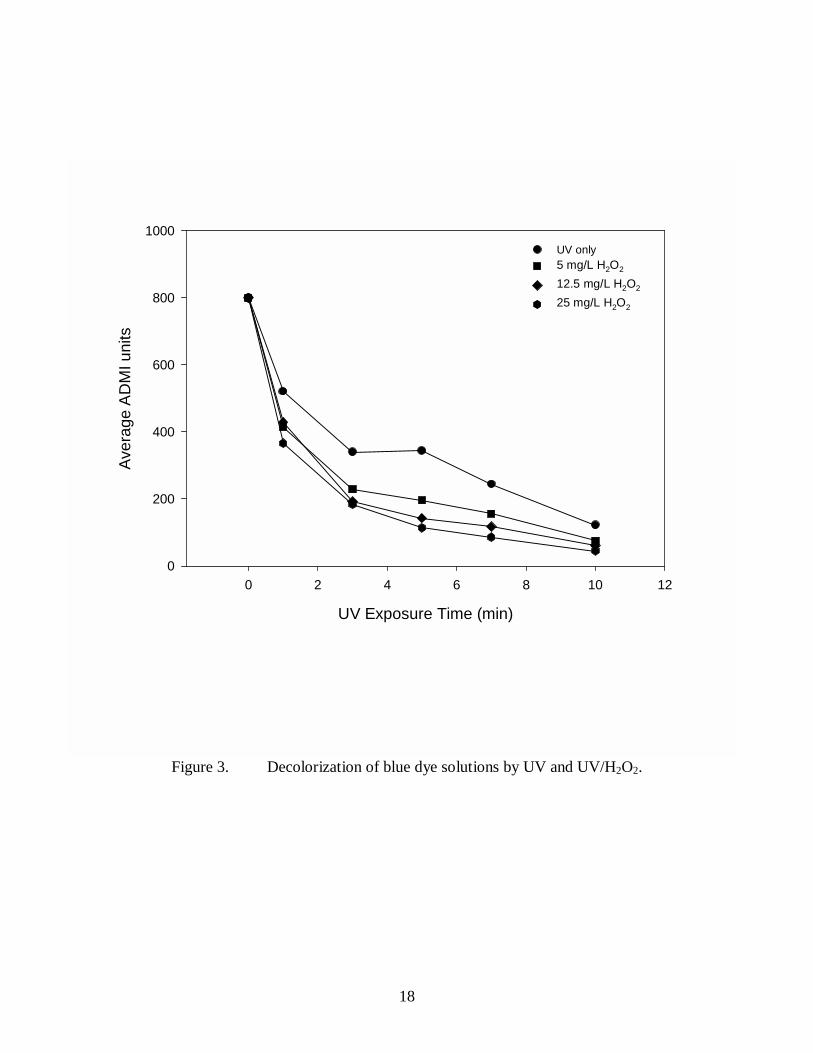
Figure 3. Decolorization of blue dye solutions by UV and UV/H2O2......................... 18
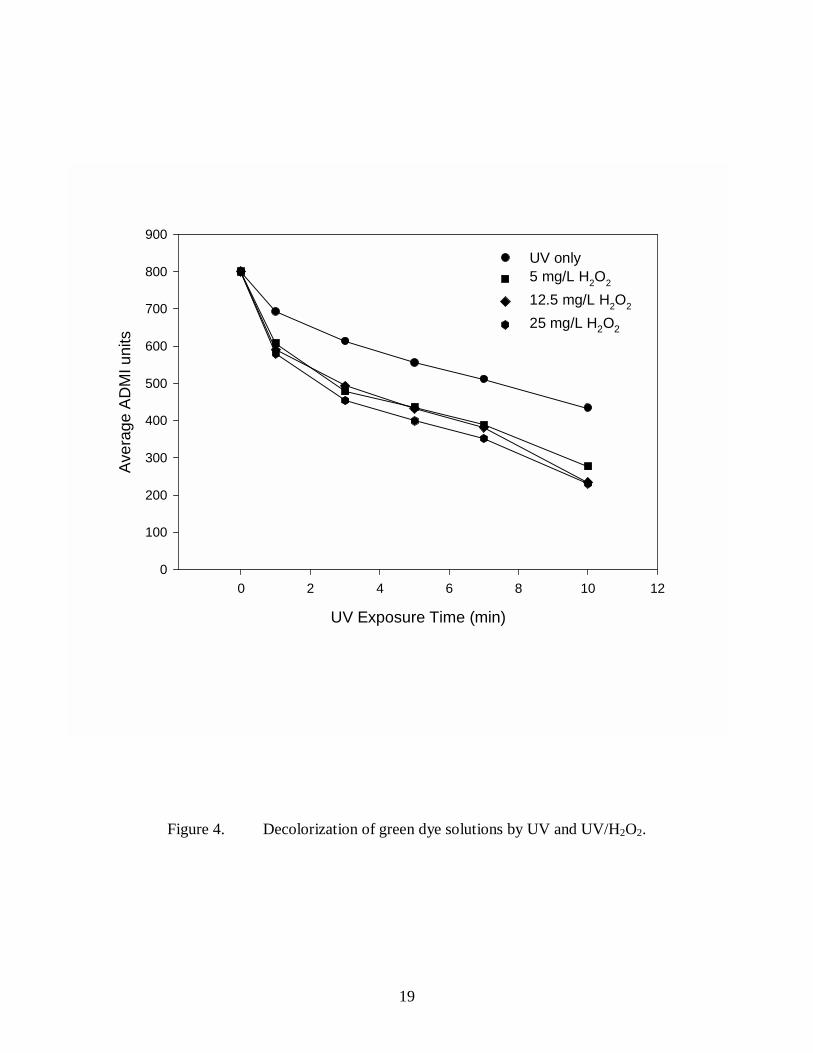
Figure 4. Decolorization of green dye solutions by UV and UV/H2O2....................... 19
Figure 5. Color reduction of Lower Smith effluents for varying UV contact times. ... 21
Figure 6. Color reduction in Lower Smith effluent by treatment with UV irradiation and
UV/H2O2. (Lower Smith Effluent collected April 30, 2000) ................................. 22
Figure 7 Linear regressions of UV exposure time needed to reach 300 ADMI unitsfor
varying initial ADMI values of Lower Smith Effluent (UV and UV/H2O2 (5 and 25
mg/L)). .................................................................................................................. 23
R2 values: UV = 0.9859, UV/H2O2 (5 mg/L) = 0.9970, UV/H2O2 (25 mg/L) = 0.9896 .. 23
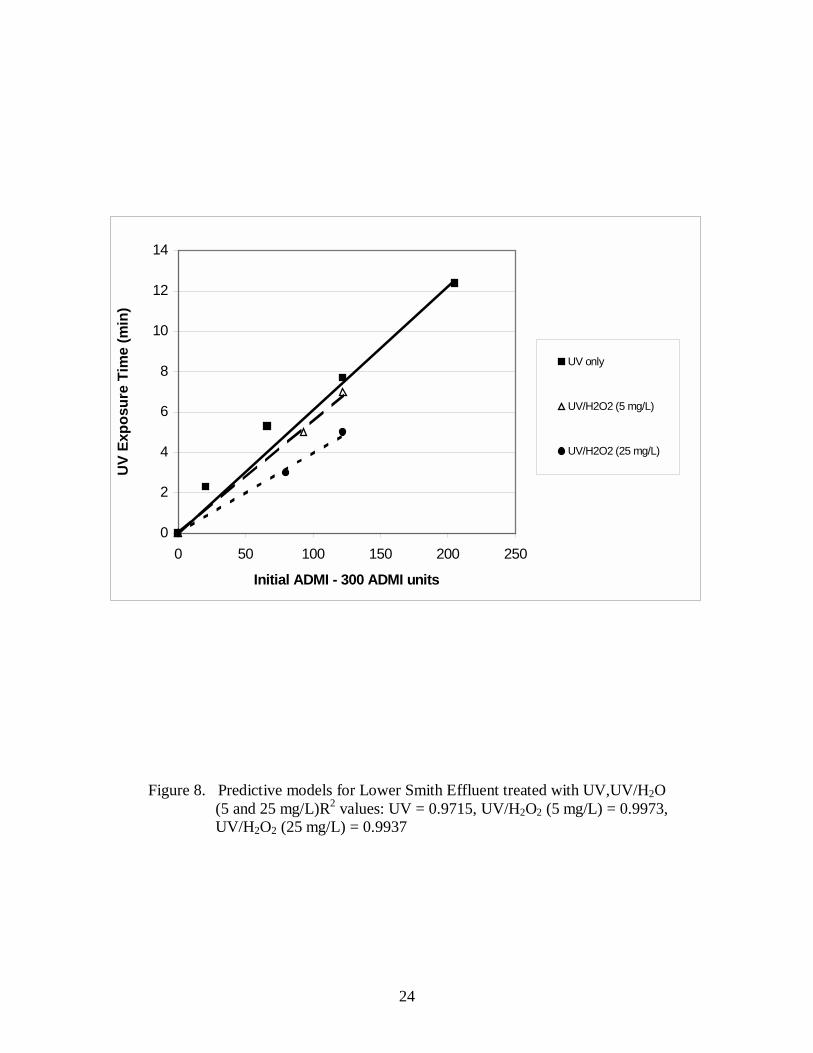
Figure 8. Predictive models for Lower Smith Effluent treated with UV,UV/H2O......... 24
(5 and 25 mg/L)R2 values: UV = 0.9715, UV/H2O2 (5 mg/L) = 0.9973, UV/H2O2 (25
mg/L) = 0.9937 ..................................................................................................... 24
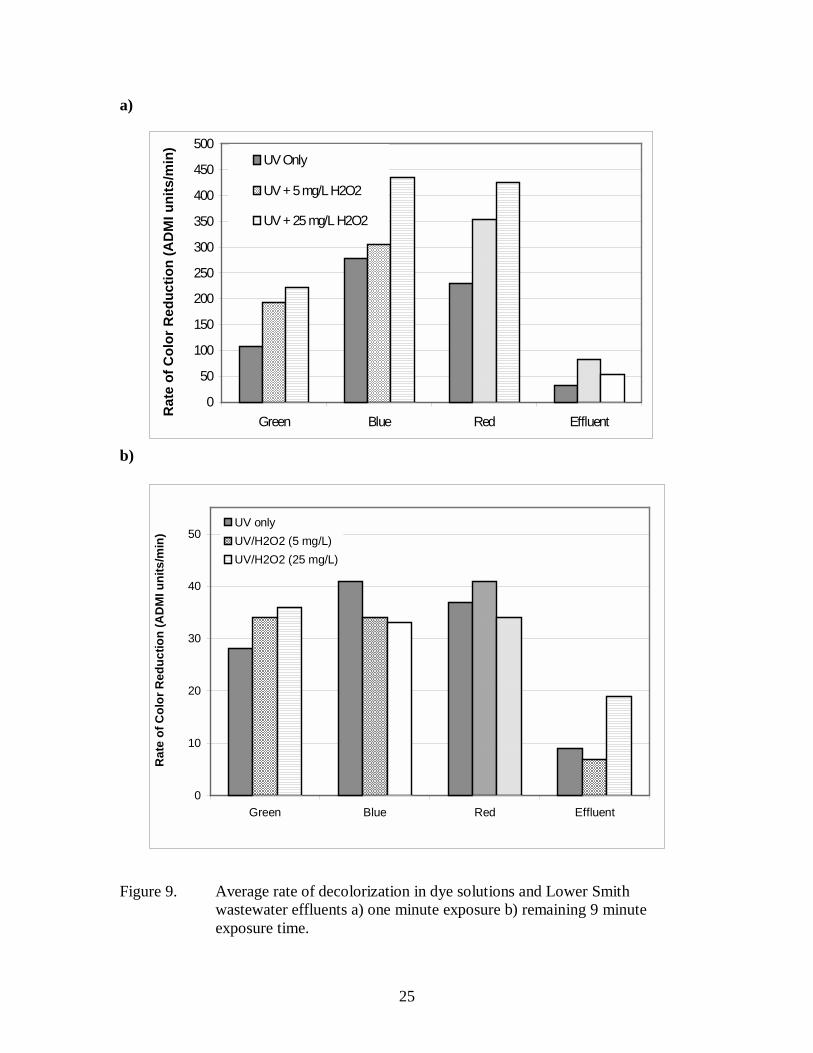
Figure 9. Average rate of decolorization in dye solutions and Lower Smith wastewater
effluents a) one minute exposure b) remaining 9 minute exposure time.................. 25
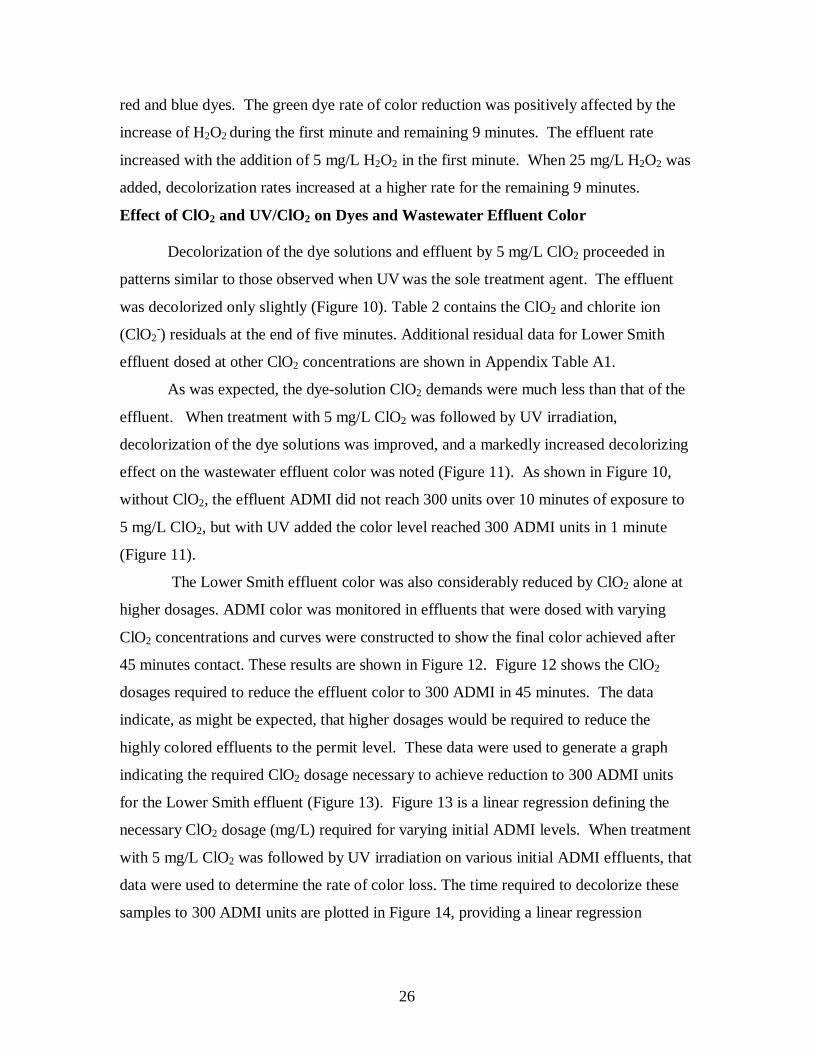
Figure 10. Color reduction by 5 mg/L ClO2 over varying exposure times. .................. 27
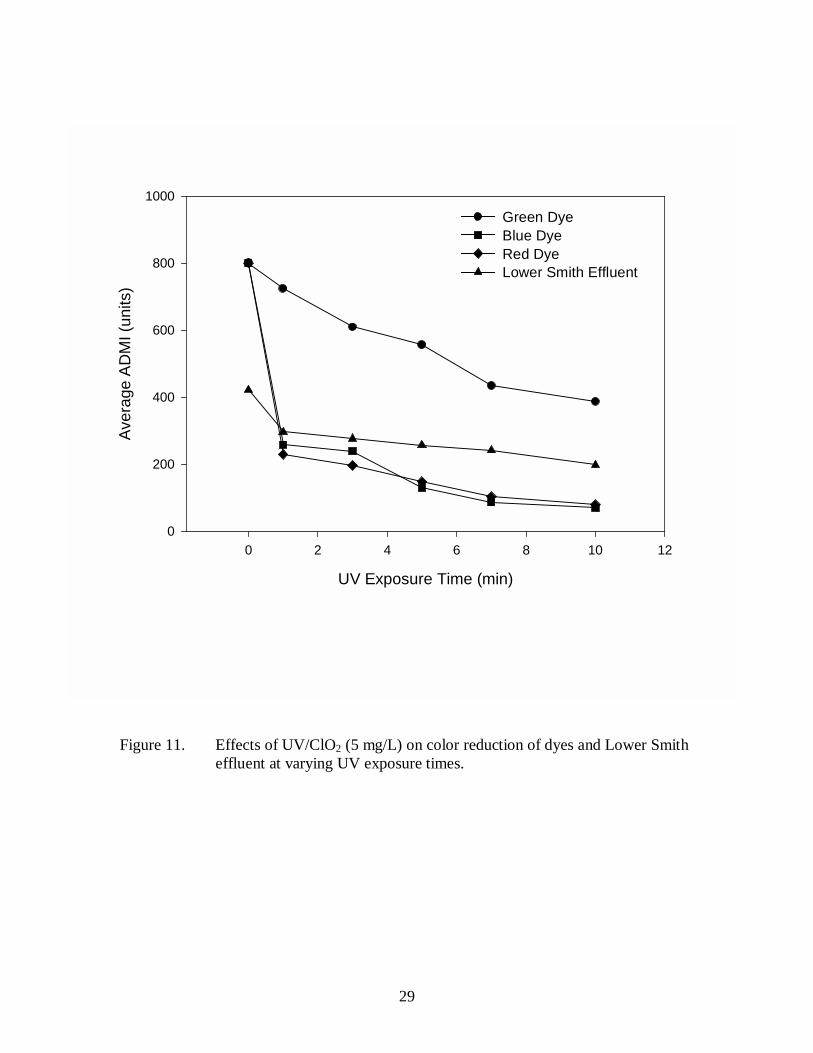
Figure 11. Effects of UV/ClO2 (5 mg/L) on color reduction of dyes and Lower Smith
effluent at varying UV exposure times................................................................... 29
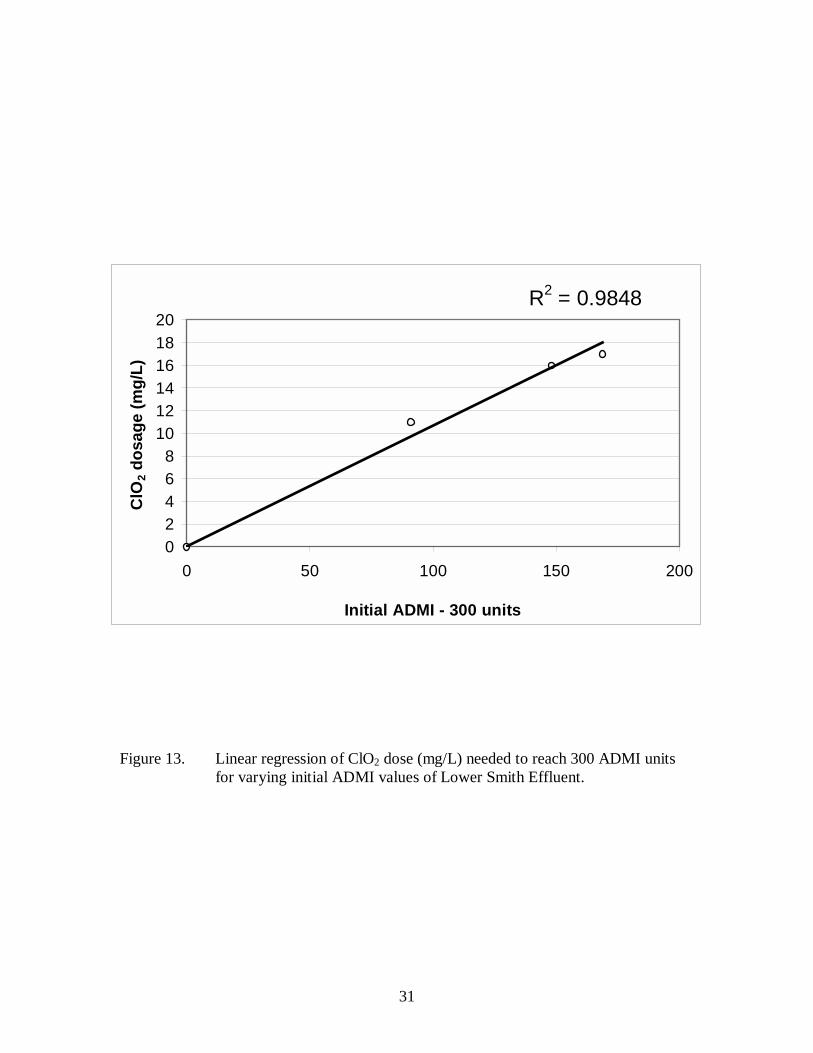
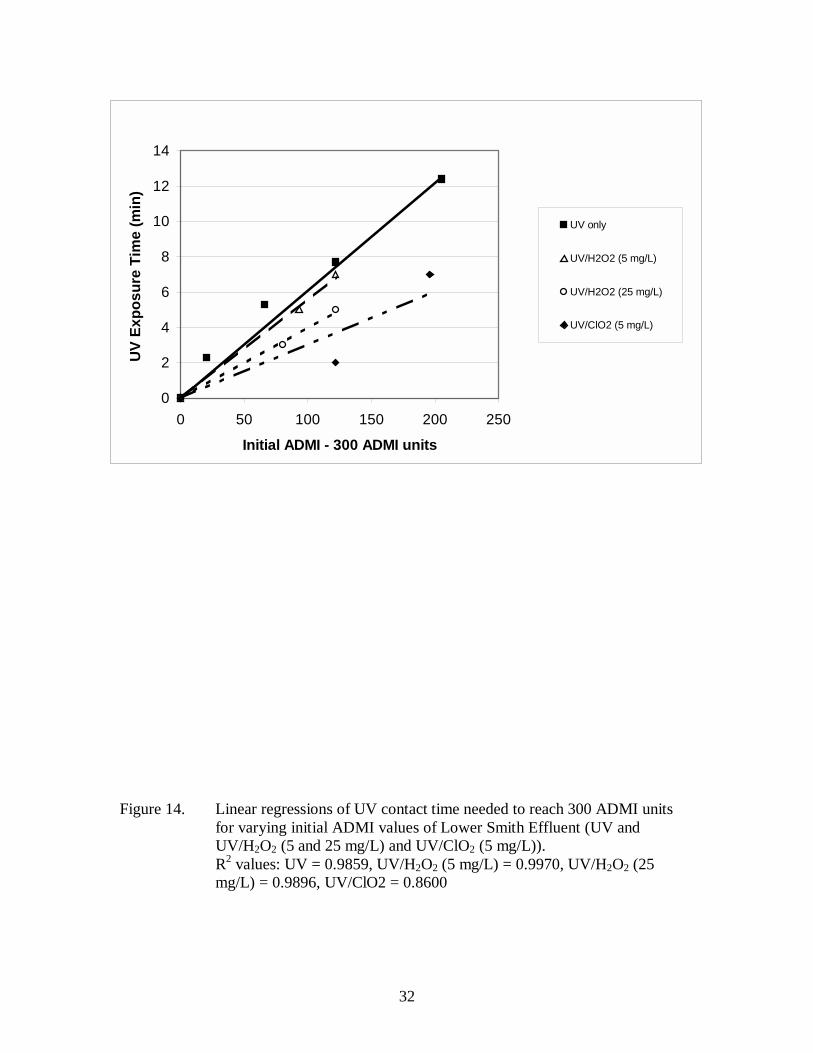
Figure 13. Linear regression of ClO2 dose (mg/L) needed to reach 300 ADMI units for
varying initial ADMI values of Lower Smith Effluent. .......................................... 31
Figure 14. Linear regressions of UV contact time needed to reach 300 ADMI units for
varying initial ADMI values of Lower Smith Effluent (UV and UV/H2O2 (5 and 25
mg/L) and UV/ClO2 (5 mg/L)). ............................................................................. 32
R2 values: UV = 0.9859, UV/H2O2 (5 mg/L) = 0.9970, UV/H2O2 (25 mg/L) = 0.9896,
UV/ClO2 = 0.8600 ................................................................................................ 32
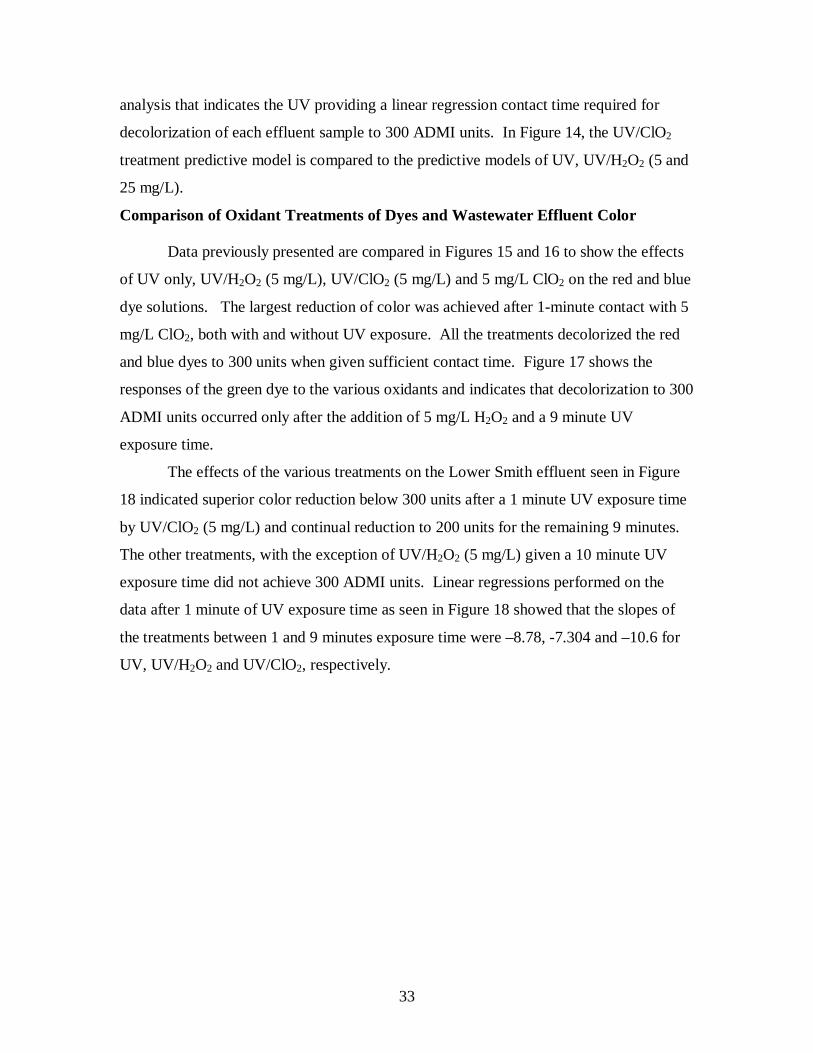
Figure 15. Effect of H2O2 and ClO2 dosages on red dye solutions at varying UV
exposure times or chemical exposure times. (Standard deviation, n=3) ................. 34
vii
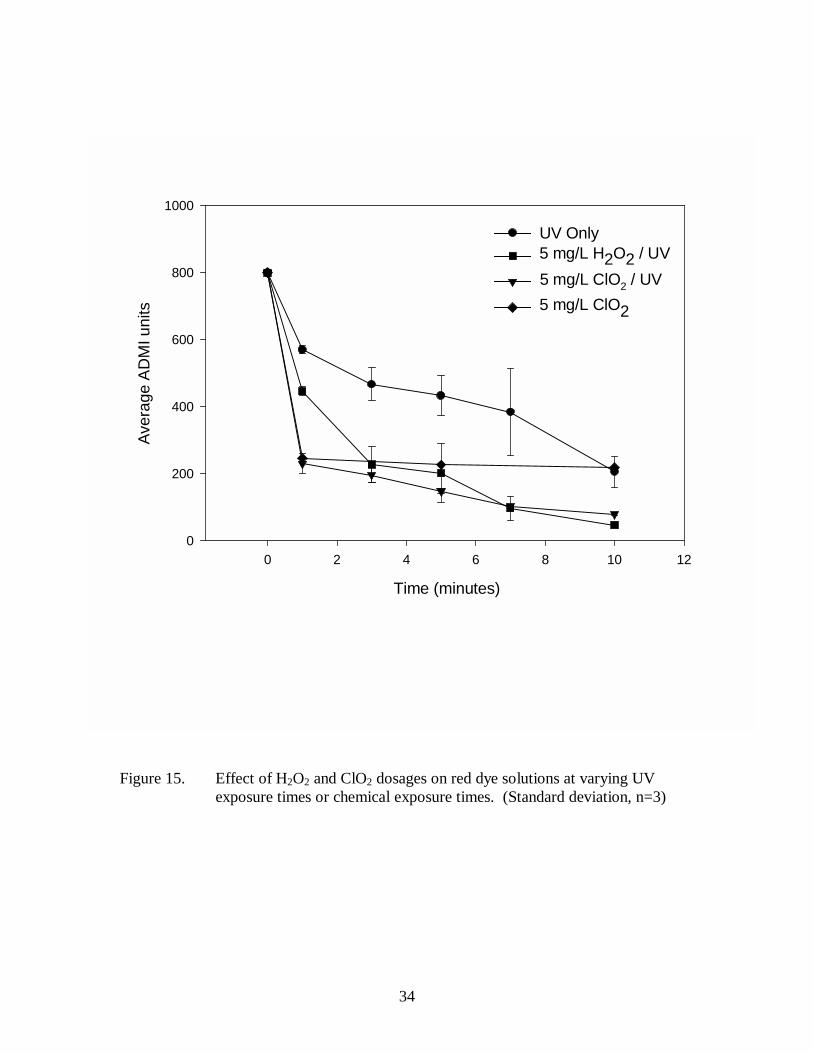
Figure 16. Effects of H2O2 and ClO2 dosages on blue dye solutions at varying UV
contact times or chemical exposure times. (Standard deviation, n=3) .................... 35
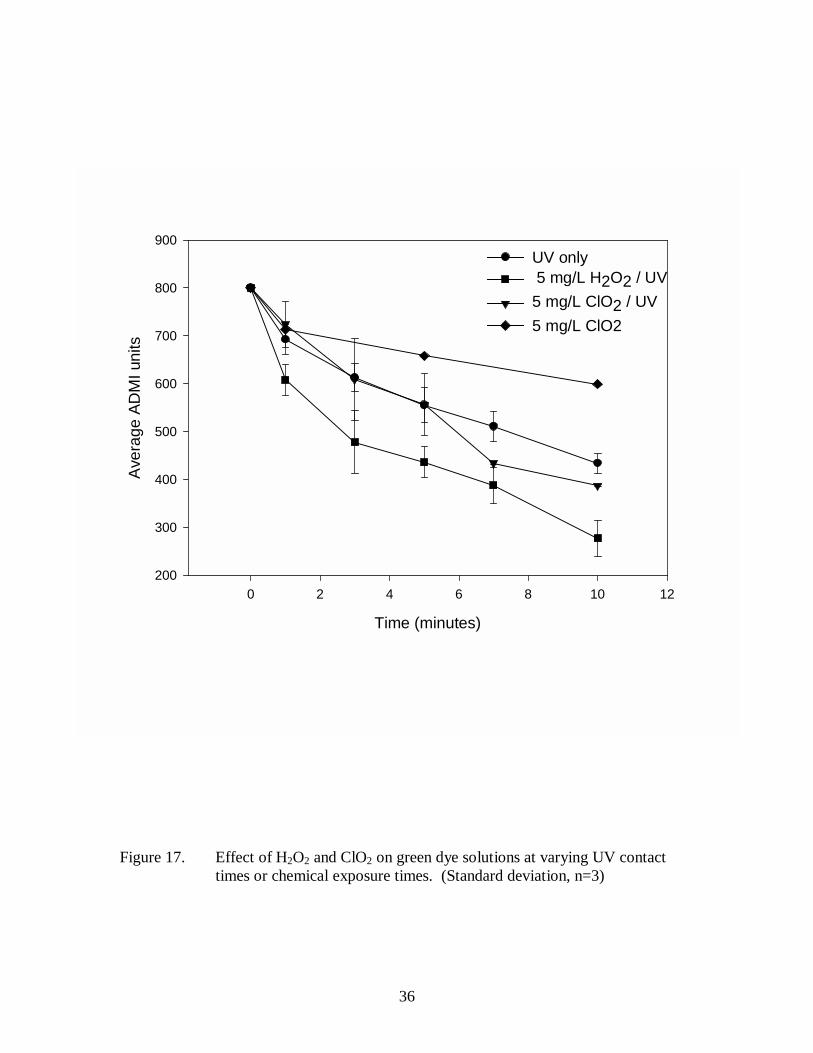
Figure 17. Effect of H2O2 and ClO2 on green dye solutions at varying UV contact times
or chemical exposure times. (Standard deviation, n=3) ......................................... 36
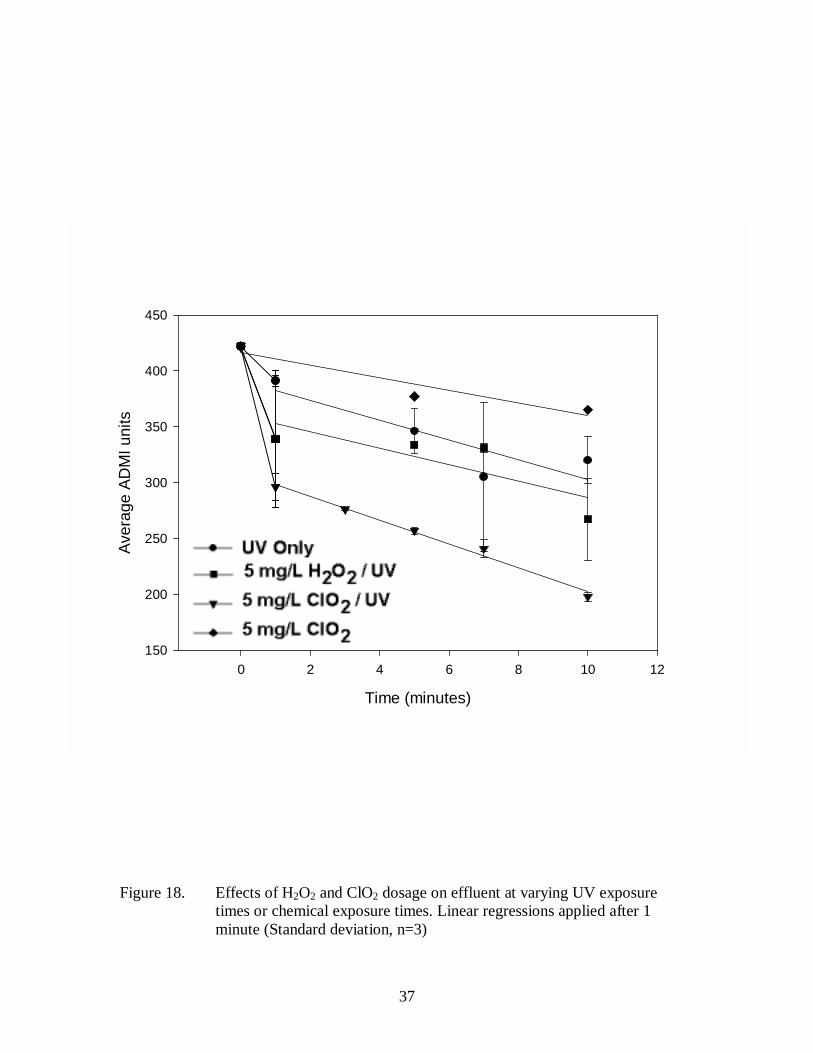
Figure 18. Effects of H2O2 and ClO2 dosage on effluent at varying UV exposure times
or chemical exposure times. Linear regressions applied after 1 minute (Standard
deviation, n=3) ...................................................................................................... 37
viii
LIST OF TABLES
Table 1. ADMI data of Dyes and Effluent for 25 mg/L H2O2 Dosing…………………..15
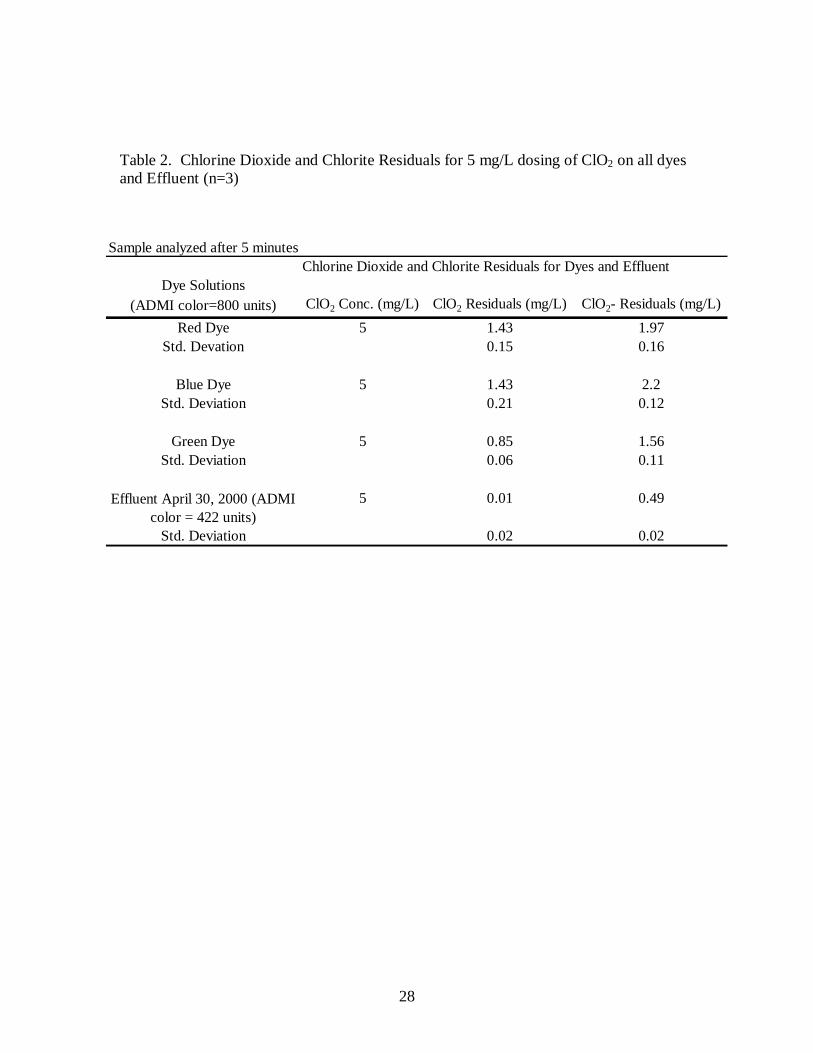
Table 2. Chlorine Dioxide and Chlorite Residuals for 5 mg/L dosing of ClO2 on all dyes
and Effluent………………………………………………………………………………28
1
CHAPTER 1: INTRODUCTION
The treatment of spent textile dyeing wastewater by traditional methods has
proven to be ineffective for many wastewater treatment facilities. Conventional activated
sludge treatment is the typical treatment method used today, though activated sludge was
not originally intended for treatment of industrial waste, particularly textile wastes
containing dyes and surfactants (Yang et al., 1998). Additional textile treatment
methods; such as combinations of biological, physical, and chemical methods including
coagulation/flocculation, electrochemical oxidation and activated carbon adsorption,
reverse osmosis, ozone and oxidative/reductive chemical processes; are all techniques
that can be used for treating textile wastewater. Chemical oxidation technologies,
however, seem to have the most potential for future use in the textile wastewater industry
(Yang et al., 1998). Treatment of spent dye effluent by a process utilizing ultraviolet light
(UV) and a strong oxidant is an effective alternative for color removal. Hydrogen
peroxide (H2O2) is the most common oxidant used in combination with UV. Chlorine
dioxide (ClO2) also has oxidative capabilities for color removal. In addition, UV in
combination with ClO2 is a possible treatment for the reduction of colored effluent from
textile dyeing facilities.
The wastewater used in this study was final clarifier effluent from the Lower
Smith Wastewater Treatment plant. Nearly 85 percent of the plant’s influent originates
from Bassett-Walker, a textile dyeing plant in Martinsville, Virginia. The plant treats
approximately 4 million gallons per day and discharges into the Smith River. The plant’s
Virginia Pollutant Discharge Elimination System (VPDES) permit limits effluent color
levels to 300 American Dye Manufacturers Institute (ADMI) color units. During this
project, color levels in samples of the Lower Smith WWTP final clarifier effluent
delivered to the Virginia Tech Environmental Laboratories where this study was
conducted were consistently greater than 300 ADMI color units.
The objectives of this research project were: (1) to evaluate the effectiveness of
three chemical oxidants [UV in combination with H2O2 (UV/H2O2), UV in combination
with ClO2 (UV/ClO2) and ClO2] for reducing ADMI color of three reactive azo dye
solutions used in textile-dyeing operations and in final clarifier effluents from the Lower
Smith Wastewater Treatment Plant (WWTP) and (2) to develop relationships and
2
predictive models for color reduction utilizing UV/H2O2, UV/ClO2 and ClO2. The desired
outcome of this project was a recommendation to the WWTP regarding the most
effective and efficient oxidation technology for use at the Lower Smith facility.
3
CHAPTER 2: LITERATURE REVIEW
Introduction
The treatment of spent dye wastewater effluent is a growing concern for the
textile industry because of aesthetic conditions, as well as ecotoxicological issues
regarding colored rinsing and process wastewater and the impact of that wastewater on
the receiving streams. As regulations become more stringent, the effectiveness and cost
of treatment processes becomes more significant. Conventional biological treatment can
be ineffective for color removal, but chemical oxidative processes seem to provide an
opportunity for future use in industrial wastewater. Examples of potentially effective
chemical oxidants include hydrogen peroxide (H2O2), ozone (O3), chlorine dioxide
(ClO2), ultraviolet irradiation following ClO2 (UV/ClO2), and H2O2/ultrasonication.
Advanced oxidation processes (AOPs) include UV/H2O2, UV/O3, O3/H2O2, Fenton’s
reagent, and the wet-air oxidation process. The concept behind an AOP is that exposure
of a strong oxidizing agent exposed to UV light generates hydroxyl free radicals (Ince
and Gonenc, 1997), which are even stronger oxidants.
Color determination is based on the American Dye Manufacturers Institute
(ADMI) tristimulus method for measuring "true" color, which is the color of a solution
after turbidity has been removed (Standard Methods, 1995). While it is not usually
specified as the required analytical method in National Pollutant Discharge Elimination
Permits (NPDES), the ADMI method is considered to be the best available method for
color analysis of wastewater (Barnhart, 1993).
Two other analyses commonly used for the analysis of wastewaters are total
organic carbon (TOC) and chemical oxygen demand (COD), neither of which is specific
for determining color reduction. A reduction in ADMI color level following the addition
of an oxidant can occur either by degradation or alteration of the conjugated system of
the dyes with the potential to create even more toxic chemicals in the effluent (Yang et
al., 1998). The toxicity associated with color degradation will prove to be an important
factor in the choice between oxidative treatments.
Previous research into the decolorization of dyes and spent textile dye effluent by
chemical oxidation appeared to focus on specific dye decomposition (rates and kinetic
4
models), initial dye concentrations, hydrogen peroxide dosing concentrations, and UV
intensity and contact times as important factors affecting color reduction.
Textile Dye Characteristics
Numerous structures of dyes exist. All are assigned a Color Index classification
number. According to Shore (1990), most of the dyes and pigments in the Color Index
are placed in one of the 25 structural classes according to their chemical type. Azo dyes,
the largest class, are subdivided into four sections. Classification of the four sections
depends on the number of azo groups within the dye molecule. The depth of color is
related to the molecular structure of the dyes, which is related to the chromophores
(-N=N- or >C=O) involved within the structure. In addition, visible and the UV
irradiation electron transfer effects at varying wavelengths on the dye structures have
been observed, supporting tautometic capabilities of the dye molecules (Shore 1990).
An oscillation between the double and single bonds occurs along the conjugated
molecular chain; therefore, as the chain becomes longer, the vibration rate becomes
slower resulting in a slower kinetic degradation rate (Shore 1990).
Shore (1990) stated that the reactive dye structures are 95 percent azo dyes,
except for some bright blues and greens. Reactive dyes react with a substrate to form a
covalent dye-substrate bond, where a substance such as cellulose acts as the substrate
(Shore 1990):
D-CH=CH2 + OH-Cellulose →D-CH2CH2O-Cellulose (1)
Where D = reactive dye structure
Dye fixation onto fibers depends on the dye property known as fastness, which describes
its ability to bond to the material. Reactive dyes are very soluble in water and, therefore,
are poorly adsorbed (Churchley and Upton, 1997). Any additional chemicals that are
added during the dye application, such as salts or detergents, will affect the wastewater
and subsequently the treatment process.
Ultraviolet Lamp and Reactor Characteristics
Ultraviolet light is an electromagnetic radiation spread between the wavelengths
100 nm and 400 nm. Most UV lamps used in wastewater treatments perform at a
wavelength of 254 nm. A mercury vapor lamp is the most common UV light source
(Hanzon and Vigilia, 1999). The lamp is filled with mercury vapor at different pressures,

5
and excitation of the mercury atoms causes the emission of UV light. Typically, UV
lamps are installed inside quartz sleeves and when implemented at a plant are usually
placed in banks with the lamps evenly spaced either vertically or horizontally. The UV
dosage applied to a wastewater is determined by the intensity of the UV radiation and the
contact time involved and is commonly expressed in milliwatt-seconds per square
centimeter (mW-sec/cm2). Ultraviolet lamps are classified as either low, medium or high-
pressure units. The intensity is a function of the lamp array’s geometry as well as the UV
transmittance of the wastewater. The literature investigated for this study dealt with low,
medium and high-pressure lamps. The UV chambers vary in size and were configured by
either vertical or horizontal lamp placement. Other factors that limit the effectiveness of
the system are the wattage and output. The UV lamps described in the literature varied
from 14 watts to 35 watts for a low pressure lamp (Shu et al., 1994; Namboodri and
Walsh, 1996; Liao et al., 2000) and 200 and 300 watts for a medium pressure lamps
(Glaze 1993; Yang et al., 1998).
UV/H2O2 and Factors that affect Efficiency
When a water or wastewater containing H2O2 is irradiated with UV, hydroxyl
radicals are formed. The mechanism is represented by the following equation:
•→+ OHhvOH 222 (2)
The ultraviolet light, represented as hv, causes the dissociation of the H2O2 into two
hydroxyl radicals (OH• ). The hydroxyl radicals are strong oxidants that can readily
oxidize organic compounds (Yang et al., 1998). The radicals degrade organic compounds
by separating protons to yield organic radical compounds, which lead to either an
abstraction of hydrogen atoms or addition to double bonds (Sundstrom et al., 1989).
Factors that affect the color removal by H2O2 and UV include: initial color
intensity, H2O2 concentration, UV-irradiation time and intensity, pH and alkalinity.
Studies have shown that the variation of initial azo dye concentration produces a
variation in kinetics (Ince and Gonenc, 1997; Shu et al. 1994). In one study by Ince and
Gonenc (1997), the decolorization rate constant for Reactive Black 5 increased with
lower dye concentrations. Another study indicated that the more concentrated the
Reactive Black 5 dye was, the slower the rate of degradation became. This was thought
to be caused by the large five aromatic ring dye structure (Ince and Gonenc, 1997). Yang
6
et al. (1998) also investigated the Reactive Black 5 dye and discovered that as the dye
concentration increased the time required to achieve identical color removal also
increased, regardless of radiation intensities.
Hydrogen peroxide concentration has varying affects on dyes. It appears that an
increase in peroxide will increase the overall efficiency of the oxidative system.
However, it has also been shown that decolorization increases when the H2O2
concentration increases, but only to some point beyond which no further decolorization
occurs (Ince and Gonenc, 1997). At increased concentrations H2O2peroxide
concentrations, the excess can react with hydroxyl radicals already in solution to form
water and oxygen (Ince and Gonenc, 1997; Yang et al., 1998).
Determination of the optimal H2O2 dosage for a particular treatment requires
preliminary evaluation of each dye. If the dye structure is known, the theoretical H2O2
concentration necessary for color removal can be estimated. A balanced chemical
equation involving the decomposition of the dye molecule into its theoretical
decomposition by-products yields the required stoichiometric H2O2 concentration (Yang
et al., 1998).
Like H2O2, UV radiation time and intensity must be determined separately for the
various dyes. Yang et al. (1998) suggested that lamp pressures and radiation intensities
for UV units used in treatment plant use should be based on a priority ranking of
variables that are most important to the plant (cost, color removal, TOC or COD
removal). He noted that color reduction is not significantly improved by use of the high-
intensity lamp when dye concentrations are high (Yang et al., 1998). Lower dye
concentrations, however, respond by increased decolorization when a high intensity lamp
is used (Shu et al., 1994; Yang et al., 1998). Contact times required for each treatment
are functions of the UV irradiation intensity, and the relationship between H2O2 and rate
of decolorization will inevitably change the extent of color reduction. In addition, the
time required for decolorization will also be a function of UV intensity. Contact times
required to decolorize various wastewaters in several studies cited in the literature ranged
from 30 seconds to 1 hour.
The pH and alkalinity of the dye effluent solutions can significantly affect the
color reduction and the rate of reduction. According to Shu et al. (1994), dye
7
decomposition rates under UV/H2O2 decreased with increasing pH. In addition, it was
discovered that H2O2 generally decomposed to water and oxygen rather than forming
hydroxyl radicals under alkaline conditions, resulting in lower rates of decolorization of
azo dyes at higher pH values. Decolorization by UV/H2O2 was most effective at a
neutral pH (Namboodri and Walsh, 1996; Ince and Gonenc, 1997; Shu et al., 1994;).
Hydrogen Peroxide Effects on Color Removal
Hydrogen peroxide alone produces hydroxyl radicals when it is added to water or
wastewater; however, the rate of decolorization by H2O2 is extremely slow for many dyes
(Ince and Gonenc, 1997). All of the literature investigated stated that color reduction was
negligible (Ince and Gonenc, 1997; Liao et al., 2000; Namboodri and Walsh, 1996; Shu
et al., 1994)
UV Effects on Color Removal
Ultraviolet light at 254 nm can degrade color. Limitations of UV as a treatment
for color reduction appear to be lamp technology; the need is increased photon
production to provide high enough energy to destroy organic material at a low cost.
High-efficiency lamps that excite protons to high energy levels are required for effective
degradation of organic compounds (Gregor 1992). The literature indicated both
successes and failures of UV alone for decolorizing wastewaters. With the exception of
Reactive Black 5, significant decolorization of reactive dyes (concentrations ranging
from 100-300 mg/L) was achieved at various UV intensities and contact times (Gregor
1992; Namboodri and Walsh, 1996). One study reported a textile wastewater color (420
ADMI units) was reduced nearly 20 percent after 40 minutes exposure to UV generated
with a 14 watt lamp (Liao et al. 2000). In two other studies, decolorization of Remazol
Black 5 (40 mg/L) and Acid Red 1 and Yellow 23 (20 mg/L) solutions was negligible
when they were exposed to UV. (Ince and Gonenc, 1997; Shu et al., 1994)
Chlorine Dioxide
Chlorine dioxide is commonly used as a disinfectant and oxidant during drinking
water treatment and as a bleaching treatment in pulp and paper industries. As an oxidant,
it readily attacks reducing substances, such as organic materials, primarily by a one-
electron pathway (AWWA 1994).
−− ⇔+ 22 ClOeClO (3)
8
No literature describing ClO2 as a chemical oxidative process for decolorization of dye
effluents could be found.
Chlorine dioxide exists as a stable, nonmetallic, monomeric free radical (AWWA
1994) and is highly soluble in water. Because it does not hydrolyze in water, ClO2 exists
as a dissolved gas as long as the pH remains between 2 and 10. Once the ClO2 has
reacted with organic matter, chlorite (ClO2-) and chlorate (ClO3
-) by-products are formed.
Drinking water regulations specify a ClO2 maximum residual disinfectant level of 0.8
mg/L and a ClO2- maximum contaminant level of 1.0 mg/L. Before these regulations
were implemented, the recommended sum of ClO2, ClO2- and ClO3
- concentrations in
drinking water was 1.0 mg/L (AWWA 1994). Reformation of ClO2 is possible when
ClO2- is in the presence of chorine; ClO2
- is oxidized and regenerates ClO2 (AWWA
1994, Gordon and Bubnis, 1999).
9
CHAPTER 3: MATERIALS AND METHODS
Introduction
Described in this chapter are the materials and methods used during this research,
including the ADMI method of ClO2 generation and analysis by amperometric titration,
the UV unit and procedures used to dose the dye and effluent solutions with H2O2 and
ClO2. The compilation of the varying H2O2 and ClO2 dosages and the varying UV
contact times for the red, blue and green dyes and effluents make up the experimental
matrix.
Chemicals
The following chemicals were used during the course of this project:
50 percent hydrogen peroxide (CAS# 7722-84-1; Fischer Scientific, Springfield, NJ),
potassium iodide (CAS# 7681-11-0; Fischer Scientific), platinum cobalt chloride (CAS#
16921-30-5, CAS# 7646-79-9, CAS# 7647-01-01; Fischer Scientific), sodium chlorite
cartridges (CAS # 7775-09-9; Composite Particles, Allentown, PA), Nitrogen gas (CAS#
7727-37-9; Holox, Norcross, GA), chlorine/nitrogen gas (CAS# 7728-50-5; Air Products,
Tamaqua, PA), 0.00564 N phenylarsine oxide (CAS# 637-03-6; Fischer Scientific), 0.1 N
sodium thiosulfate (CAS# 10102-17-7; Fischer Scientific), and potassium persulfate
(CAS# 7727-21-1; Fischer Scientific).
Glassware
All glassware was washed with standard dishwashing detergent (Sparkleen, Fisher
Scientific), rinsed with tap water and copious amounts of Nanopure water, Type I -
Standard Methods, (Barnstead, Inc., Dubuque, IA) and then allowed to dry. After the
pipettes were rinsed thoroughly with Nanopure water, they were checked regularly for
proper draining. Amber-tinted volumetric flasks (Fischer Scientific # 55640) were
cleaned as previously stated and used in the preparation of all chlorine dioxide (ClO2)
standards. Clean Pyrex gas washing bottles (# 31760-BO)) were used in ClO2 generation.
Dye Solutions
The dye solutions were prepared by pipetting a known amount of dye into a 1-liter
(L) Erlenmeyer flask and diluting it with a known amount of tap water. Three reactive
concentrated azo dyes (Sultan Red, Indigo Blue, and Cypress Green) were obtained from
Bassett Walker in Henry County, Virginia. The Classification number was not given for
10
any of the dyes. Bassett Walker uses a mix of several classifications. The flasks were
covered with aluminum foil to avoid degradation by the laboratory fluorescent lights.
Before the oxidation experiments could be performed, it was necessary to choose
the appropriate concentration of dye solutions. Since the effluent ADMI values ranged
between 300 and 800 ADMI units, an initial 800 ADMI value seemed the most
appropriate for experimentation. Dye solutions of 800 ADMI color units were prepared
for all experiments and a 1600 ADMI unit solution was prepared for red dye experiments.
Wastewater Characteristics
The wastewater samples used in this study were effuents from the final clarifier at
the Lower Smith WWTP in Axton, Virginia. At the time of this study, the effluent was
dosed with polymer to aid in color reduction. Analytical data describing the daily
clarifier-effluent quality was not available, but the following are representative values
based either on analyses at the Lower Smith WWTP laboratory or in the Virginia Tech
Environmental Laboratories: pH = 7.6, color = 450 ADMI units, TOC = 160 mg/L. The
effluent was a murky, orange/maroon color and relatively free of particulate matter.
ADMI Spectrophotometric Color Analysis Method
The ADMI Tristimulus method (2120 D) described in Standard Methods for the
Examination of Water and Wastewater (1995) was performed on a Genesis
Spectrophotometer Model 5 (Spectronic Instruments (Rochester, NY)). The ADMI
values were automatically calculated by a computer program written by Mr. Andrew
Lash (Martinsville, Virginia). Standards of 100, 200, 300, 400 and 500 ADMI units were
prepared from a commercial concentrated platinum cobalt color solution and analyzed to
verify the instrument calibration and develop a calibration curve. The r2 value associated
with this curve was 0.9999. Periodically, a new standard curve was developed and
verified. The Virginia Department of Environmental Quality accepts the ADMI color
values and the computer calculations.
Chlorine Dioxide Generation
Chlorine dioxide stock solutions used during this study were generated from
sodium chlorite (NaClO2) by two methods, a wet-chemical method and the other a dry-
chemical method with potassium persulfate according to the following reaction:
2NaClO2 + K2S2O8 → 2ClO2(g) + 2K2SO4 (4)
11
The reaction was carried out in clean Pyrex gas washing bottles equipped with
fritted disks. The production set up was similar to that shown in Standard Methods for
the Examination of Water and Wastewater (1995). Finally, gas exiting the ClO2 trap was
passed through a solution of KI to react with any untrapped oxidant. All gas- trapping
vessels and cold water traps were covered in aluminum foil to prevent
photodecomposition of the ClO2.
Other ClO2 stock solutions were prepared by a dry-chemical method with a
laboratory-scale ClO2 generator provided by CDG Technologies, Inc. in Allentown,
Pennsylvania. The process involved passing a humidified stream of chlorine gas diluted
in nitrogen gas through packed columns of Na2ClO2. The effluent ClO2 stream was then
passed through chilled distilled water traps and a final KI trap as previously described.
Each pound of chlorine gas produces 1.9 pounds of ClO2, and the stock solutions
produced by this method were more concentrated than those generated by the wet-
chemical method. Chlorine dioxide solution concentrations used during this study ranged
from 700 to 1500 mg/L.
The stock solution concentrations were determined spectrophotometrically
according to Beer’s law. The absorbance of a diluted stock solution (usually 1:10 or 1:20
in distilled, deionized water) was determined at 360 nanometers (nm). The
spectrophotometer was zeroed with deionized water and the concentration calculated
from Beer’s Law according to the following:
bca ε= (5)
Where: a = absorbance, nm
ε = ClO2 extinction coefficient, 1225 M-1cm-1
b = cuvette path length, centimeters
c = ClO2 concentration, moles/L
Chlorine Dioxide Analysis by Amperometric Titration
The titrator was a Fischer & Porter (Capital Controls, Inc., Colmar, PA) Series
17T2000, which uses a platinum measuring electrode and a platinum counter electrode to
generate a current as a function of the oxidant concentration. The procedure performed in
the amperometric titration was a modified version of Standard Method 4500-E-Chlorine
Dioxide (Standard Methods, 1998).
12
Sample Preservation
Lower Smith wastewater effluent samples were 24-hour composite samples
collected in plastic containers and delivered to Virginia Tech seven dates from March 29
through May 17, 1999. Samples taken after May 17, 1999 were grab samples. All
samples were taken immediately before the point of chlorination at the treatment facility.
Samples were refrigerated at 4oC. Prior to treatment, the samples were warmed to room
temperature (24oC –27oC).
Prior to ClO2 treatment, the samples were adjusted to pH 7 with HCl and filtered
through 0.45 micrometer (µm) glass-fiber filters. The dosing vessel was treated as a
continuously stirred tank reactor (CSTR), and samples were taken at intervals for
evaluation of color reduction.
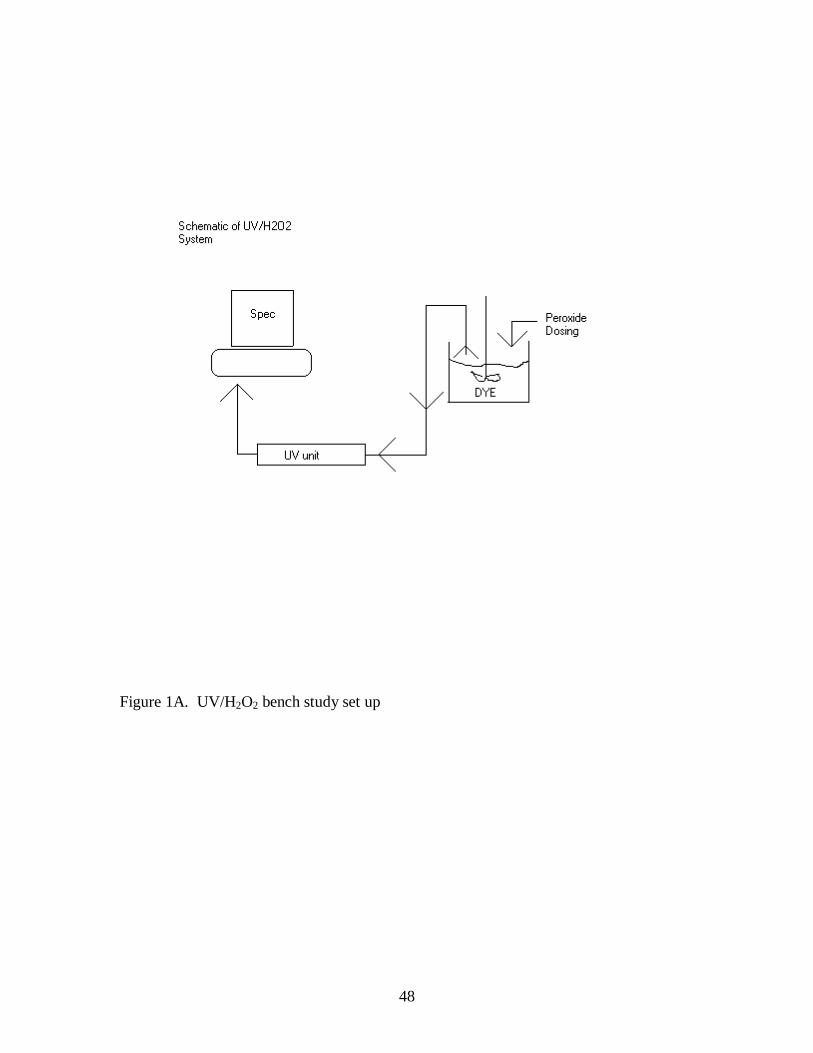
Ultraviolet Lamp Unit
The UV irradiation used in this study was a 31 cm (1.2 in) horizontal bench-scale
reactor consisting of a 15 mm (0.6 in) diameter quartz tube and a low pressure mercury
vapor lamp with a power of 14 watts emits ultraviolet irradiation at a wavelength of 254
nanometers (nm). The lamp has a base face length of 29 cm and an arc length of 21 cm
and the output was approximately >35µwatts-sec/cm2 at 1 meter. Solutions Consultants,
Inc. (Jasper, Georgia) supplied the UV unit. The UV contact times were calculated on
the basis of the pumping rates. Diagrams of the UV/H2O2 and UV/ClO2 bench scale set
up can be found in the Appendix (Figures A1 and A2).
Treatment by ClO2
Dye solutions of 1-liter were dosed with 3 and 5 mg/L ClO2 in foil-covered
Erlenmeyer flasks. Effluent samples were adjusted to pH 7 with HCl and filtered through
a 0.45 micrometer (µm) glass fiber filter. Varying concentrations (ranging from 5 mg/L
to 30 mg/L) of ClO2 were added to the effluent and ADMI color measurements were
performed at varying exposure periods, extending to 60 minutes.
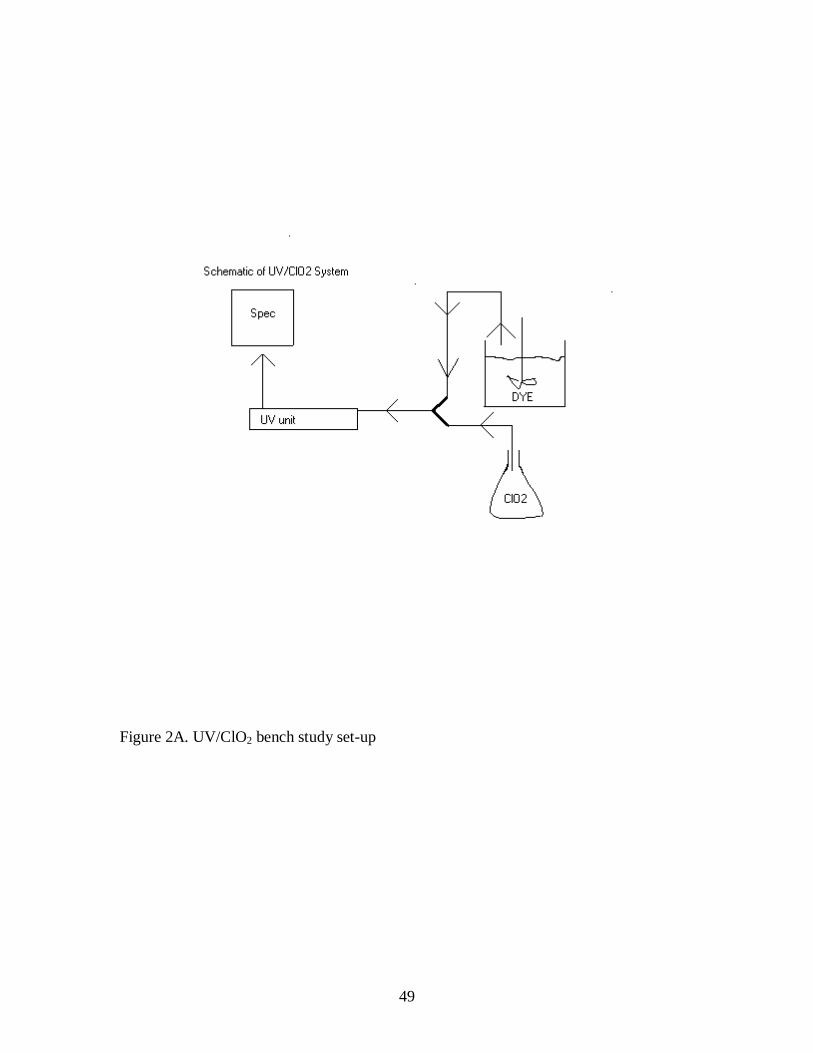
Treatment by UV/ClO2
Chlorine dioxide will readily react with organic substances in the dye solutions
and the effluent; therefore, it was imperative that a dosing method be developed that
minimized the reaction time of ClO2 prior to exposure of the solutions to UV. This was
accomplished with two Cole Parmer (Chicago, IL) peristaltic pumps, one that pumped the
13
dye solutions through to the UV unit and the other that simultaneously pumped the ClO2
solution to the unit. The tubing leading to both pumps was connected by a Y-connector,
and the ClO2 and dye/effluent solutions were mixed for only a few seconds before they
were pumped into the UV irradiation unit. Contact times inside the UV unit were
controlled by varying the pumping rates. The three dye solutions and the effluent were
treated. The experimental matrix for UV/ClO2 involved ClO2 concentrations of 3 mg/L
and 5 mg/L and UV contact times of 1 min, 3 min, 5 min, 7 min, and 10 minutes. Once
the appropriate UV contact times had been achieved, samples were taken from the output
and the ADMI evaluated.
Treatment by H2O2
Dye solutions and Lower Smith WWTP effluent samples in foil-covered and
capped Erlenmeyer flasks were dosed with 25 mg/L H2O2 and continuously stirred during
the prescribed reaction periods. Samples were withdrawn at five minute intervals for
ADMI evaluation during the first hour and then once again after 24 hours.
Treatment by UV/H2O2
Effluent samples and dye solutions were dosed with several H2O2 concentrations
and pumped through the UV unit at varying rates to provide various UV contact times.
Individual 1-L samples were dosed with varying amounts of H2O2, stirred, pumped at
varying rates through the UV unit and analyzed for remaining ADMI color. The
experimental matrix included concentrations of 5 mg/L, 12.5 mg/L, 25 mg/L H2O2 and
UV contact times of 1 min, 3 min, 5 min, 7 min, and 10 minutes.
14
CHAPTER 4: RESULTS
The effectiveness of the various oxidative treatments for reducing color in dye
solutions and wastewater was evaluated in bench-scale studies. A matrix of experimental
variables was developed in which the UV exposure time, H2O2 concentration and ClO2
concentration were varied and applied to each dye solution and the Lower Smith effluent.
The goal was to develop predictive models that could be used in the design of dye-waste
treatment systems.
Effects of UV and UV/H2O2 on Dyes and Wastewater Effluent Color
Before the UV/H2O2 studies began, color reduction by H2O2 alone and UV alone
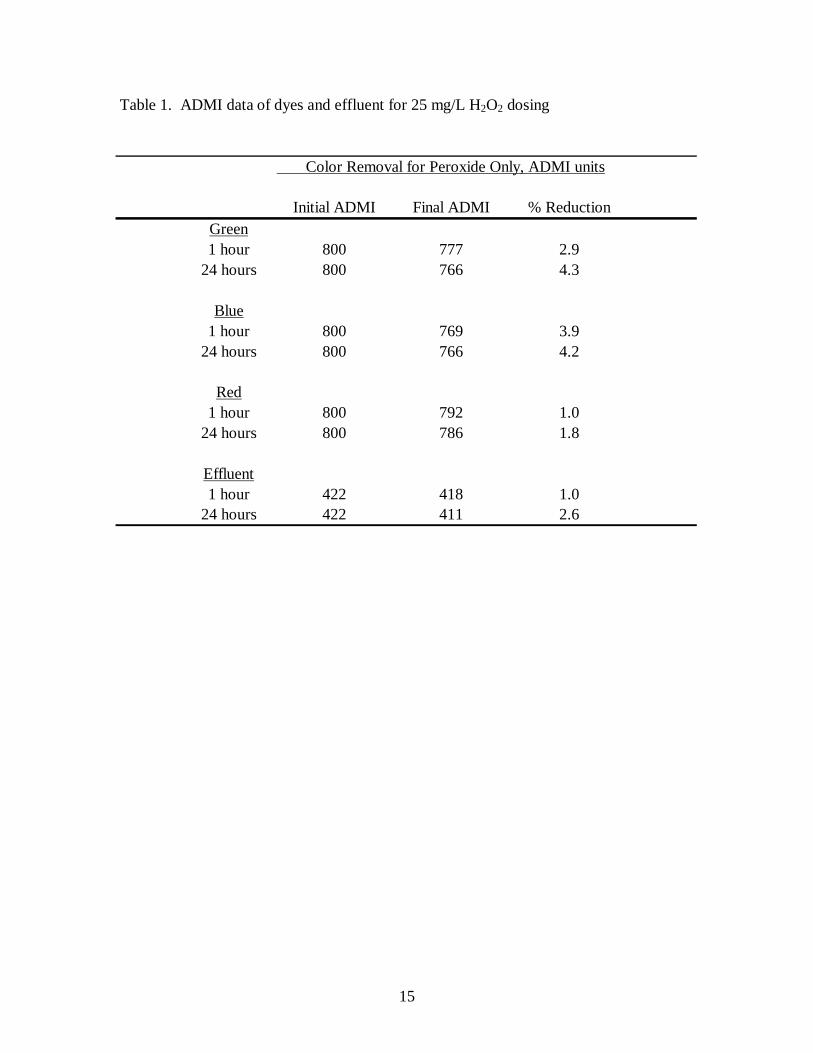
were investigated. As shown in Table 1, H2O2 treatment alone did not substantially
reduce the color intensity of either the pure dye solutions or the wastewater effluent (< 5
percent). The evaluations of UV as the sole decolorizing oxidant were conducted as
control experiments for comparison with evaluations of UV/H2O2 and UV/ClO2. The red
and blue dyes were most rapidly decolorized, reaching the 300 ADMI value in 5 and 7
minutes, respectively (Figure 1). The green dye was more resistant to oxidation and the
300 ADMI goal would not be achieved unless the irradiation time had been extended to
approximately 14 minutes (estimate based on a linear extrapolation). The color of all the
dye solutions decreased sharply during the first minute of UV exposure time and
decreased in approximately a linear fashion during the remaining 9 minutes.
The addition of 5 mg/L, 12.5 mg/L and 25 mg/L H2O2 to each of the UV- dosed
dye solutions noticeably increased both the rate and extent of color removal. Figures 2-4
show these effects compared to the effects of UV irradiation alone. Red dye solutions of
two different initial color intensities were decolorized rapidly during the first minute and
in approximately a linear fashion after the initial rapid decrease (Figure 2). The color
intensities of both the red and blue dye solutions (Figure 2b and 3, respectively) were
reduced to the 300 ADMI permit limit in less than 3 minutes. Furthermore, the data in
Figure 2b and Figure 3 clearly show that little benefit was gained by increasing the H2O2
dose beyond 5 mg/L H2O2 if the contact period were extended to 10 minutes. The benefits
of the higher H2O2 dosages were evident, however, when the initial color of the red dye
solution was 1600 ADMI units (Figure 2a). The color intensity of the green dye solution
15
Table 1. ADMI data of dyes and effluent for 25 mg/L H2O2 dosing
Color Removal for Peroxide Only, ADMI units
Initial ADMI Final ADMI % ReductionGreen1 hour 800 777 2.9
24 hours 800 766 4.3
Blue1 hour 800 769 3.9
24 hours 800 766 4.2
Red1 hour 800 792 1.0
24 hours 800 786 1.8
Effluent1 hour 422 418 1.0
24 hours 422 411 2.6
16
Figure 1. Color reduction in red, blue and green dye solutions by UV irradiationduring varying exposure times. ( Standard deviation, n=3)
UV Exposure Time (min)
0 2 4 6 8 10 12
Ave
rage
AD
MIu
nits
0
200
400
600
800
1000
Green DyeBlue DyeRed Dye
17
Figure 2. Decolorization of red dye solution by UV and UV/H2O2 for a) initialADMI of 1600 units and b) initial ADMI of 800 units.
UV Exposure Time (min)
0 2 4 6 8 10 12
0
200
400
600
800
1000
UV only5 mg/L H2O2
12.5 mg/L H2O2
25 mg/L H2O2
0 2 4 6 8 10 12Ave
rage
AD
MIu
nits
0
200
400
600
800
1000
1200
1400
1600
1800
UV only5 mg/L H2O2
12.5 mg/L H2O2
25 mg/L H2O2
a)
b)
18
Figure 3. Decolorization of blue dye solutions by UV and UV/H2O2.
UV Exposure Time (min)
0 2 4 6 8 10 12
Ave
rage
AD
MIu
nits
0
200
400
600
800
1000UV only5 mg/L H2O2
12.5 mg/L H2O2
25 mg/L H2O2
19
Figure 4. Decolorization of green dye solutions by UV and UV/H2O2.
UV Exposure Time (min)
0 2 4 6 8 10 12
Ave
rage
AD
MIu
nits
0
100
200
300
400
500
600
700
800
900
UV only5 mg/L H2O2
12.5 mg/L H2O2
25 mg/L H2O2
20
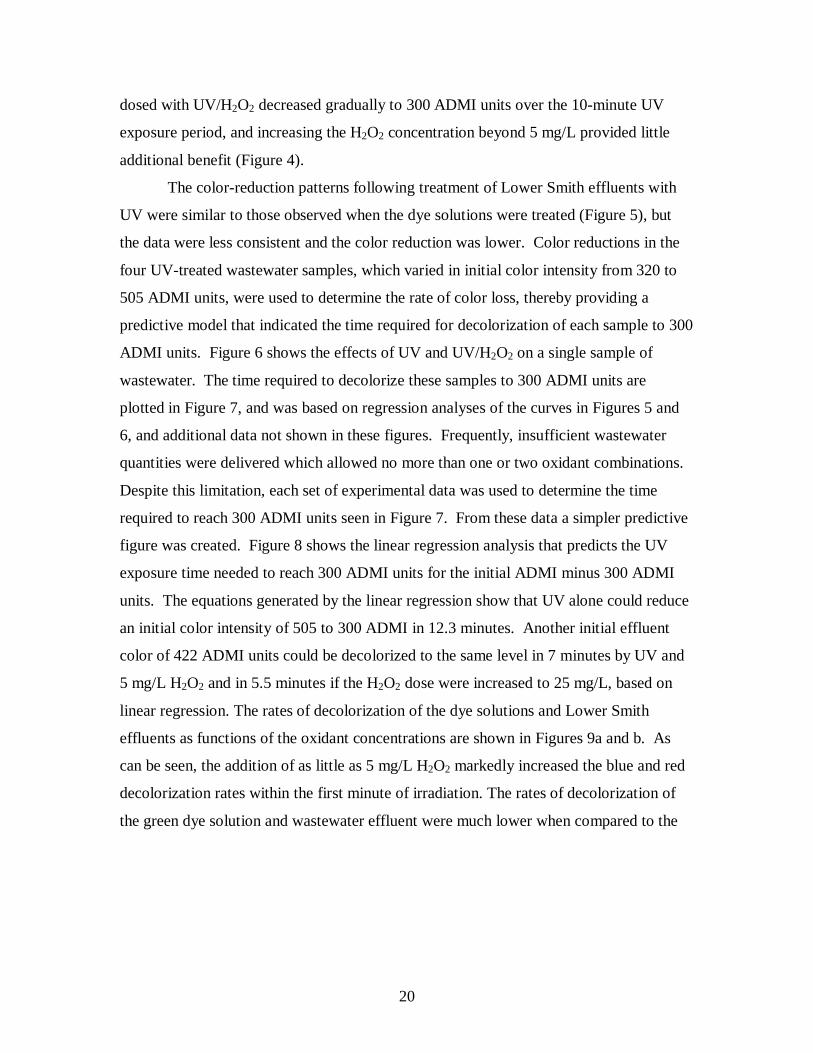
dosed with UV/H2O2 decreased gradually to 300 ADMI units over the 10-minute UV
exposure period, and increasing the H2O2 concentration beyond 5 mg/L provided little
additional benefit (Figure 4).
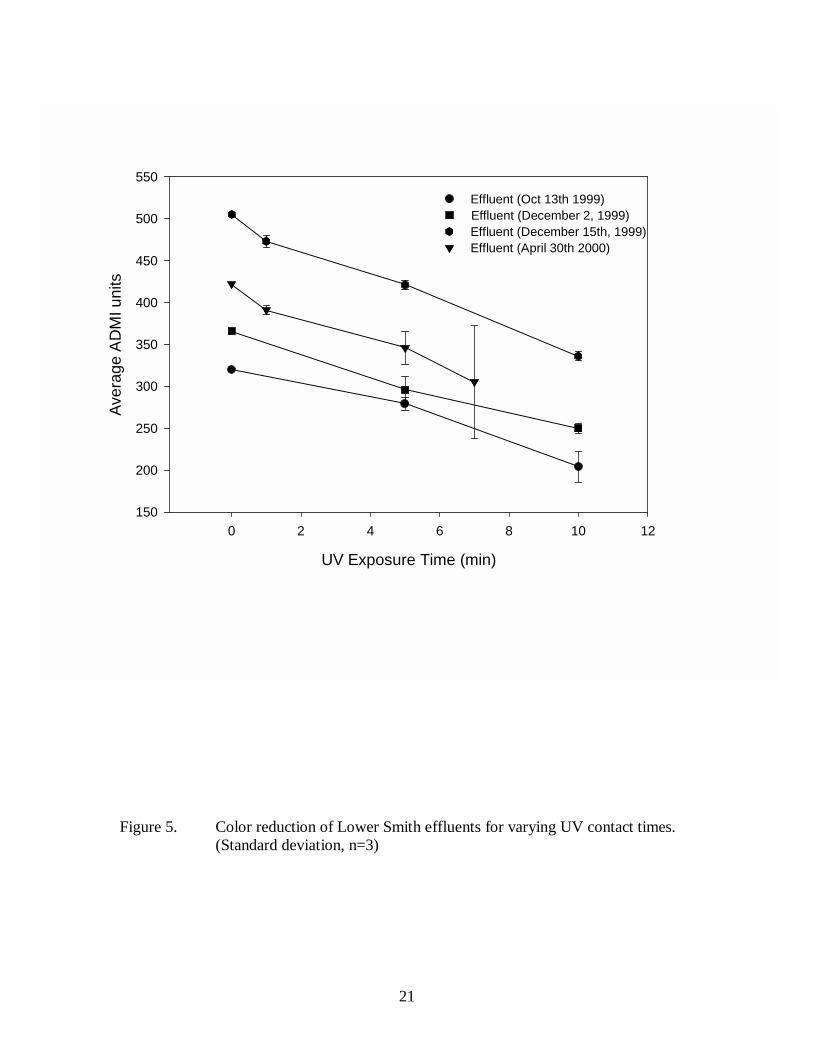
The color-reduction patterns following treatment of Lower Smith effluents with
UV were similar to those observed when the dye solutions were treated (Figure 5), but
the data were less consistent and the color reduction was lower. Color reductions in the
four UV-treated wastewater samples, which varied in initial color intensity from 320 to
505 ADMI units, were used to determine the rate of color loss, thereby providing a
predictive model that indicated the time required for decolorization of each sample to 300
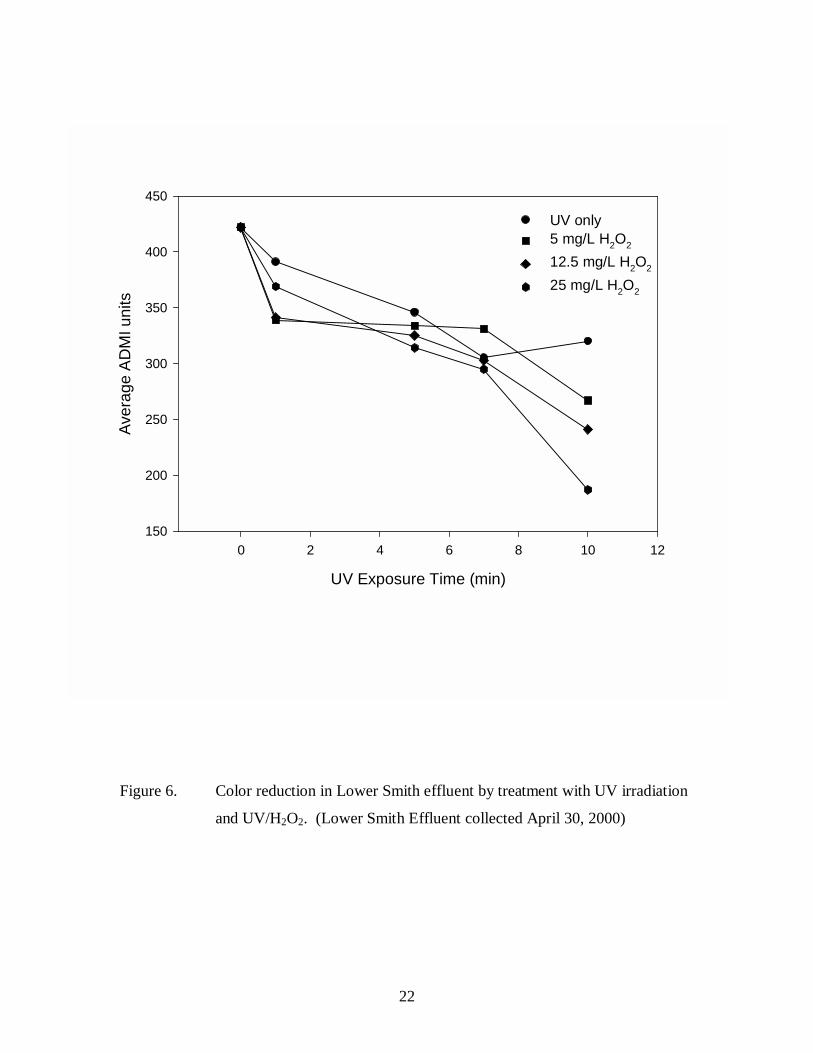
ADMI units. Figure 6 shows the effects of UV and UV/H2O2 on a single sample of
wastewater. The time required to decolorize these samples to 300 ADMI units are
plotted in Figure 7, and was based on regression analyses of the curves in Figures 5 and
6, and additional data not shown in these figures. Frequently, insufficient wastewater
quantities were delivered which allowed no more than one or two oxidant combinations.
Despite this limitation, each set of experimental data was used to determine the time
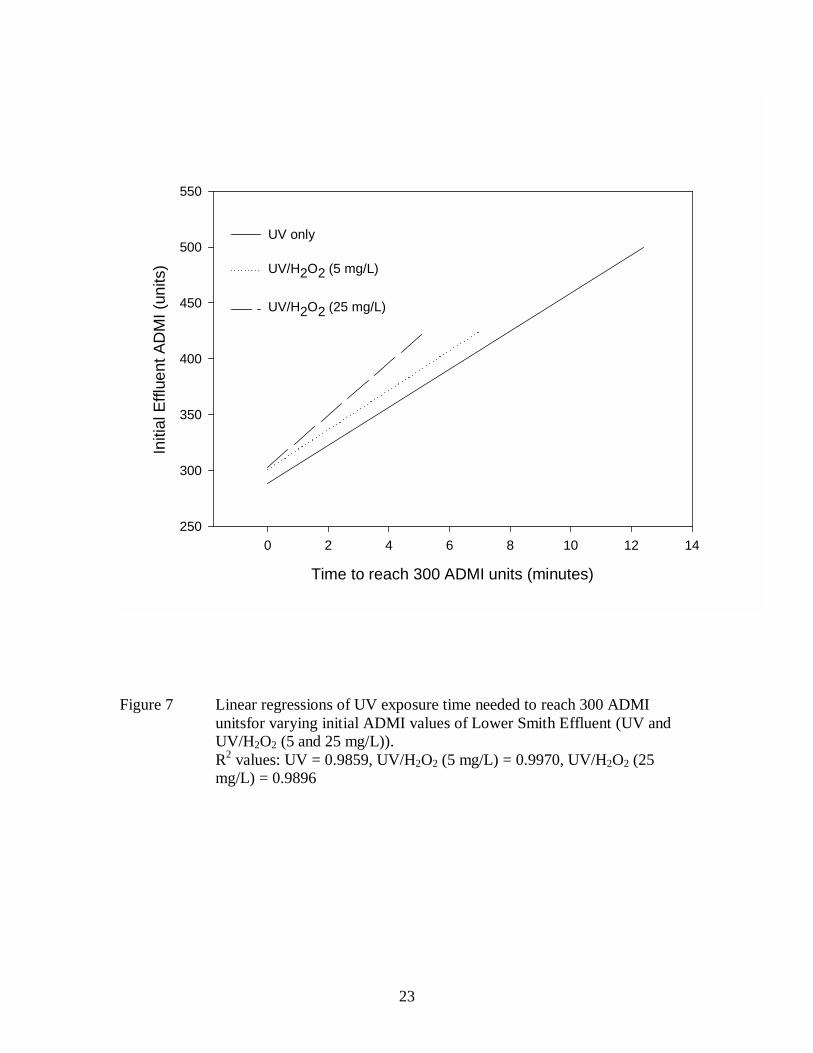
required to reach 300 ADMI units seen in Figure 7. From these data a simpler predictive
figure was created. Figure 8 shows the linear regression analysis that predicts the UV
exposure time needed to reach 300 ADMI units for the initial ADMI minus 300 ADMI
units. The equations generated by the linear regression show that UV alone could reduce
an initial color intensity of 505 to 300 ADMI in 12.3 minutes. Another initial effluent
color of 422 ADMI units could be decolorized to the same level in 7 minutes by UV and
5 mg/L H2O2 and in 5.5 minutes if the H2O2 dose were increased to 25 mg/L, based on
linear regression. The rates of decolorization of the dye solutions and Lower Smith
effluents as functions of the oxidant concentrations are shown in Figures 9a and b. As
can be seen, the addition of as little as 5 mg/L H2O2 markedly increased the blue and red
decolorization rates within the first minute of irradiation. The rates of decolorization of
the green dye solution and wastewater effluent were much lower when compared to the
21
Figure 5. Color reduction of Lower Smith effluents for varying UV contact times.(Standard deviation, n=3)
UV Exposure Time (min)
0 2 4 6 8 10 12
Ave
rage
AD
MIu
nits
150
200
250
300
350
400
450
500
550
Effluent (Oct 13th 1999)Effluent (December 2, 1999)Effluent (December 15th, 1999)Effluent (April 30th 2000)
22
Figure 6. Color reduction in Lower Smith effluent by treatment with UV irradiation
and UV/H2O2. (Lower Smith Effluent collected April 30, 2000)
UV Exposure Time (min)
0 2 4 6 8 10 12
Ave
rage
AD
MIu
nits
150
200
250
300
350
400
450
UV only5 mg/L H2O2
12.5 mg/L H2O2
25 mg/L H2O2
23
Figure 7 Linear regressions of UV exposure time needed to reach 300 ADMIunitsfor varying initial ADMI values of Lower Smith Effluent (UV andUV/H2O2 (5 and 25 mg/L)).R2 values: UV = 0.9859, UV/H2O2 (5 mg/L) = 0.9970, UV/H2O2 (25mg/L) = 0.9896
Time to reach 300 ADMI units (minutes)
0 2 4 6 8 10 12 14
Initi
alE
fflue
ntA
DM
I(un
its)
250
300
350
400
450
500
550
UV only
UV/H2O2 (5 mg/L)
UV/H2O2 (25 mg/L)
24
Figure 8. Predictive models for Lower Smith Effluent treated with UV,UV/H2O(5 and 25 mg/L)R2 values: UV = 0.9715, UV/H2O2 (5 mg/L) = 0.9973,UV/H2O2 (25 mg/L) = 0.9937
0
2
4
6
8
10
12
14
0 50 100 150 200 250
Initial ADMI - 300 ADMI units
UV
Exp
osu
reT
ime
(min
)
UV only
UV/H2O2 (5 mg/L)
UV/H2O2 (25 mg/L)
25
a)
b)
Figure 9. Average rate of decolorization in dye solutions and Lower Smithwastewater effluents a) one minute exposure b) remaining 9 minuteexposure time.
0
10
20
30
40
50
Green Blue Red Effluent
Rat
eo
fCo
lor
Red
uct
ion
(AD
MIu
nits
/min
)
UV only
UV/H2O2 (5 mg/L)
UV/H2O2 (25 mg/L)
0
50
100
150
200
250
300
350
400
450
500
Green Blue Red Effluent
Rat
eo
fC
olo
rR
edu
ctio
n(A
DM
Iun
its/
min
)UVOnly
UV+ 5mg/LH2O2
UV+ 25 mg/L H2O2
26
red and blue dyes. The green dye rate of color reduction was positively affected by the
increase of H2O2 during the first minute and remaining 9 minutes. The effluent rate
increased with the addition of 5 mg/L H2O2 in the first minute. When 25 mg/L H2O2 was
added, decolorization rates increased at a higher rate for the remaining 9 minutes.
Effect of ClO2 and UV/ClO2 on Dyes and Wastewater Effluent Color
Decolorization of the dye solutions and effluent by 5 mg/L ClO2 proceeded in
patterns similar to those observed when UV was the sole treatment agent. The effluent
was decolorized only slightly (Figure 10). Table 2 contains the ClO2 and chlorite ion
(ClO2-) residuals at the end of five minutes. Additional residual data for Lower Smith
effluent dosed at other ClO2 concentrations are shown in Appendix Table A1.
As was expected, the dye-solution ClO2 demands were much less than that of the
effluent. When treatment with 5 mg/L ClO2 was followed by UV irradiation,
decolorization of the dye solutions was improved, and a markedly increased decolorizing
effect on the wastewater effluent color was noted (Figure 11). As shown in Figure 10,
without ClO2, the effluent ADMI did not reach 300 units over 10 minutes of exposure to
5 mg/L ClO2, but with UV added the color level reached 300 ADMI units in 1 minute
(Figure 11).
The Lower Smith effluent color was also considerably reduced by ClO2 alone at
higher dosages. ADMI color was monitored in effluents that were dosed with varying
ClO2 concentrations and curves were constructed to show the final color achieved after
45 minutes contact. These results are shown in Figure 12. Figure 12 shows the ClO2
dosages required to reduce the effluent color to 300 ADMI in 45 minutes. The data
indicate, as might be expected, that higher dosages would be required to reduce the
highly colored effluents to the permit level. These data were used to generate a graph
indicating the required ClO2 dosage necessary to achieve reduction to 300 ADMI units
for the Lower Smith effluent (Figure 13). Figure 13 is a linear regression defining the
necessary ClO2 dosage (mg/L) required for varying initial ADMI levels. When treatment
with 5 mg/L ClO2 was followed by UV irradiation on various initial ADMI effluents, that
data were used to determine the rate of color loss. The time required to decolorize these
samples to 300 ADMI units are plotted in Figure 14, providing a linear regression
27
Figure 10. Color reduction by 5 mg/L ClO2 over varying exposure times.(Lower Smith effluent collected on April 30, 2000)
Exposure Time (min)
0 2 4 6 8 10 12 14 16
Ave
rage
AD
MI(
units
)
100
200
300
400
500
600
700
800
900
Green DyeBlue DyeRed DyeEffluent
28
Table 2. Chlorine Dioxide and Chlorite Residuals for 5 mg/L dosing of ClO2 on all dyesand Effluent (n=3)
Sample analyzed after 5 minutesChlorine Dioxide and Chlorite Residuals for Dyes and Effluent
Dye Solutions(ADMI color=800 units) ClO2 Conc. (mg/L) ClO2 Residuals (mg/L) ClO2- Residuals (mg/L)
Red Dye 5 1.43 1.97Std. Devation 0.15 0.16
Blue Dye 5 1.43 2.2Std. Deviation 0.21 0.12
Green Dye 5 0.85 1.56Std. Deviation 0.06 0.11
5 0.01 0.49
Std. Deviation 0.02 0.02
Effluent April 30, 2000 (ADMIcolor = 422 units)
29
Figure 11. Effects of UV/ClO2 (5 mg/L) on color reduction of dyes and Lower Smitheffluent at varying UV exposure times.
UV Exposure Time (min)
0 2 4 6 8 10 12
Ave
rage
AD
MI(
units
)
0
200
400
600
800
1000
Green DyeBlue DyeRed DyeLower Smith Effluent
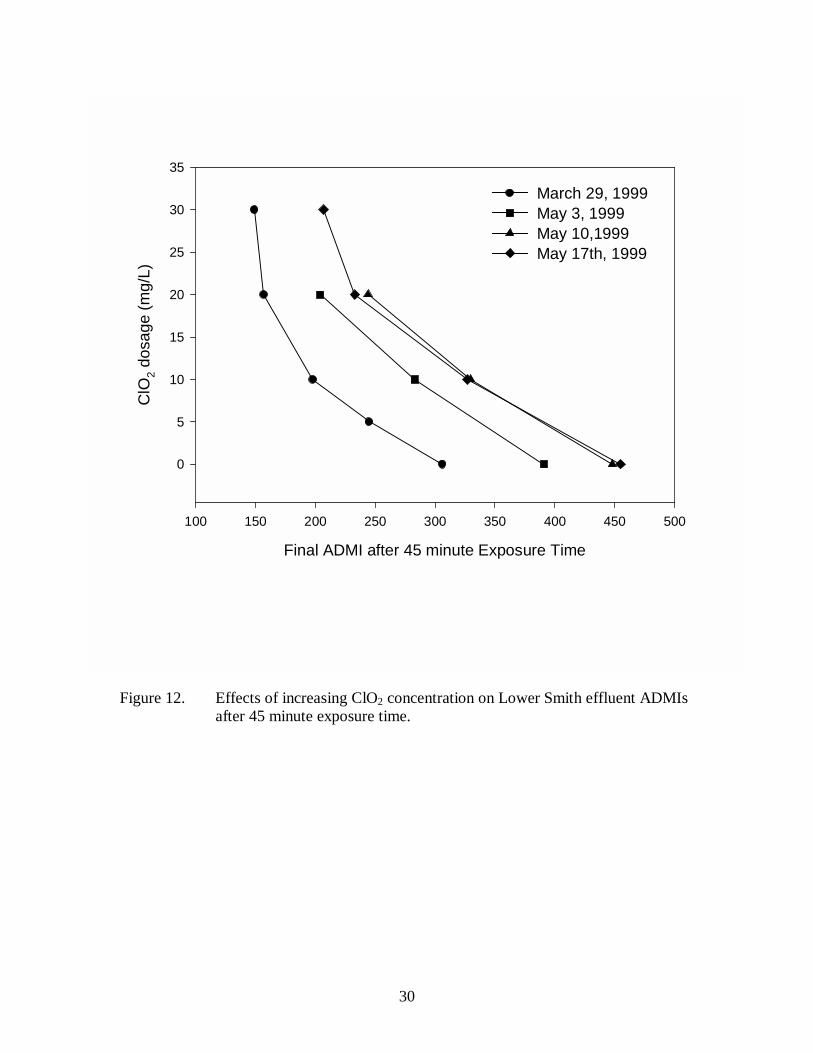
30
Figure 12. Effects of increasing ClO2 concentration on Lower Smith effluent ADMIsafter 45 minute exposure time.
Final ADMI after 45 minute Exposure Time
100 150 200 250 300 350 400 450 500
ClO
2do
sage
(mg/
L)
0
5
10
15
20
25
30
35
March 29, 1999May 3, 1999May 10,1999May 17th, 1999
31
Figure 13. Linear regression of ClO2 dose (mg/L) needed to reach 300 ADMI unitsfor varying initial ADMI values of Lower Smith Effluent.
R2 = 0.9848
02468
101214161820
0 50 100 150 200
Initial ADMI - 300 units
ClO
2d
osa
ge
(mg
/L)
32
Figure 14. Linear regressions of UV contact time needed to reach 300 ADMI unitsfor varying initial ADMI values of Lower Smith Effluent (UV andUV/H2O2 (5 and 25 mg/L) and UV/ClO2 (5 mg/L)).R2 values: UV = 0.9859, UV/H2O2 (5 mg/L) = 0.9970, UV/H2O2 (25mg/L) = 0.9896, UV/ClO2 = 0.8600
0
2
4
6
8
10
12
14
0 50 100 150 200 250
Initial ADMI - 300 ADMI units
UV
Exp
osu
reT
ime
(min
)
UV only
UV/H2O2 (5 mg/L)
UV/H2O2 (25 mg/L)
UV/ClO2 (5 mg/L)
33
analysis that indicates the UV providing a linear regression contact time required for
decolorization of each effluent sample to 300 ADMI units. In Figure 14, the UV/ClO2
treatment predictive model is compared to the predictive models of UV, UV/H2O2 (5 and
25 mg/L).
Comparison of Oxidant Treatments of Dyes and Wastewater Effluent Color
Data previously presented are compared in Figures 15 and 16 to show the effects
of UV only, UV/H2O2 (5 mg/L), UV/ClO2 (5 mg/L) and 5 mg/L ClO2 on the red and blue
dye solutions. The largest reduction of color was achieved after 1-minute contact with 5
mg/L ClO2, both with and without UV exposure. All the treatments decolorized the red
and blue dyes to 300 units when given sufficient contact time. Figure 17 shows the
responses of the green dye to the various oxidants and indicates that decolorization to 300
ADMI units occurred only after the addition of 5 mg/L H2O2 and a 9 minute UV
exposure time.
The effects of the various treatments on the Lower Smith effluent seen in Figure
18 indicated superior color reduction below 300 units after a 1 minute UV exposure time
by UV/ClO2 (5 mg/L) and continual reduction to 200 units for the remaining 9 minutes.
The other treatments, with the exception of UV/H2O2 (5 mg/L) given a 10 minute UV
exposure time did not achieve 300 ADMI units. Linear regressions performed on the
data after 1 minute of UV exposure time as seen in Figure 18 showed that the slopes of
the treatments between 1 and 9 minutes exposure time were –8.78, -7.304 and –10.6 for
UV, UV/H2O2 and UV/ClO2, respectively.
34
Figure 15. Effect of H2O2 and ClO2 dosages on red dye solutions at varying UVexposure times or chemical exposure times. (Standard deviation, n=3)
Time (minutes)
0 2 4 6 8 10 12
Ave
rage
AD
MIu
nits
0
200
400
600
800
1000
UV Only5 mg/L H2O2 / UV
5 mg/L ClO2 / UV
5 mg/L ClO2
35
Figure 16. Effects of H2O2 and ClO2 dosages on blue dye solutions at varying UVcontact times or chemical exposure times. (Standard deviation, n=3)
Time (minutes)
0 2 4 6 8 10 12
Ave
rage
AD
MIu
nits
0
200
400
600
800
1000
UV Only5 mg/L H2O2 / UV
5 mg/L ClO2 / UV
5 mg/L ClO2
36
Figure 17. Effect of H2O2 and ClO2 on green dye solutions at varying UV contacttimes or chemical exposure times. (Standard deviation, n=3)
Time (minutes)
0 2 4 6 8 10 12
Ave
rage
AD
MIu
nits
200
300
400
500
600
700
800
900UV only5 mg/L H2O2 / UV
5 mg/L ClO2 / UV
5 mg/L ClO2
37
Figure 18. Effects of H2O2 and ClO2 dosage on effluent at varying UV exposuretimes or chemical exposure times. Linear regressions applied after 1minute (Standard deviation, n=3)
Time (minutes)
0 2 4 6 8 10 12
Ave
rage
AD
MIu
nits
150
200
250
300
350
400
450
38
CHAPTER 5: DISCUSSION
Each of the treatments evaluated during this study decolorized the dyes and the
Lower Smith Wastewater Treatment Plant effluent to varying degrees. The objective was
not complete decolorization but, rather, to determine efficient means to comply with the
Virginia Pollutant Discharge Elimination System (VPDES) permit level of 300 ADMI
units. The efficacy of the oxidative treatments was dependent on the initial color intensity
of the test solutions and, therefore, predictive models for each oxidative treatment process
were created for the Lower Smith effluent. Additional attempts to model the combined
oxidant/UV systems did not yield predictive results. The treatments involving UV
irradiation, with or without the addition of a H2O2 or ClO2, rely on the length of UV
exposure time required to achieve the sufficient color reduction, which was thought to be
a function of the initial ADMI value. The treatments involving ClO2 relied on the ClO2
demand required by the test solutions, which was also a response to the initial ADMI
intensity.
Color removal by H2O2 alone and UV alone was evaluated. The literature states
that H2O2 is not a viable oxidative treatment (Ince and Gonenc, 1997; Liao et al., 2000;
Shu et al., 1994; Yang et al., 1998), and evidence from this study supports this finding.
Ultraviolet light has the ability to degrade organic compounds, and exposure to UV
irradiation resulted in decolorization of the three dyes and the Lower Smith effluent. A
10-minute UV exposure time was required to reduce color in the Lower Smith effluents
to the 300 ADMI unit permit level when they were higher than 450 –500 units. Because a
typical wastewater treatment plant is unlikely to allow a 10 minute contact time, and the
effluent ADMI values will most likely be above 400 ADMI units, UV alone was not
considered to be a feasible technology for the Lower Smith plant.
A trend seen throughout the experiments was that the red and blue dyes were
more easily decolorized than either the green dye or the effluent. These findings
regarding the dye solutions supported Gregor’s (1992) findings that high color reduction
required a 3-minute UV exposure time for red, orange and blue reactive azo dyes in a
high-pressure UV system. Gregor (1992) also cited a low percent reduction (10%) for
the green azo dye. One explanation was the structure of the red and blue dyes facilitated
invasion by the reactive hydroxyl radicals, which attacked the dye molecule and provided
39
oxidation to various intermediates (Ince and Gonenc, 1997). It should be noted that the
effluent was always more resistant to decolorization than the pure dye solutions, either
because the addition of surfactants, salts of other process chemicals by the manufacturer
interfered with treatment or because the more labile substances had already been removed
by the addition of polymer added at the treatment plant.
During this study, color reduction in all three dyes and the effluent increased only
marginally with the addition of H2O2 followed by UV irradiation. This finding was
supported by Liao et al. (2000). An exception discovered during this study was the
observed response of the red dye to H2O2 when the initial ADMI value was 1600 units.
The addition of 25 mg/L H2O2 provided 20 percent more color reduction after one minute
compared to the decolorization seen upon the addition of 5 and 12.5 mg/L H2O2. Ince
and Gonenc (1997); Namboodri and Walsh (1996); Shu et al.(1994); Yang et al.(1998)
stated that an increased UV exposure time was required to reach the identical percent
reduction when the H2O2 concentration was kept constant for increased initial dye
concentrations. These data suggest that stronger intensity dye solutions initially
consumed the oxidant and the remaining color removal through 10 minutes was a product
of UV oxidation.
The Lower Smith effluent response to increased H2O2 concentration and UV
irradiation time shown from Figure 8 also demonstrated that higher ADMI values initially
consume the oxidant and the extended UV irradiation time provides continuing
decolorization. When the UV/ H2O2 (25 mg/L) and UV/ H2O2 (5 mg/L) treatment UV
irradiation times were extrapolated to 500 ADMI unit initial effluent, an 8.0 minute and
11.3 minute irradiation periods were required. The length of UV contact time required by
dye waste entering the treatment plant becomes a question of the facility’s operation and
cost plan. Linear relationships between the times required for decolorization of effluents
to 300 ADMI and initial ADMI values are as follows:
• UV alone: UV exposure (min) = 0.061(Initial ADMI – 300 units) (6)
• UV/H2O2 (5 mg/L): UV exposure (min) = 0.056 (Initial ADMI – 300 units) (7)
• UV/H2O2 (25 mg/L): UV exposure (min) = 0.040(Initial ADMI – 300 units)(8)
40
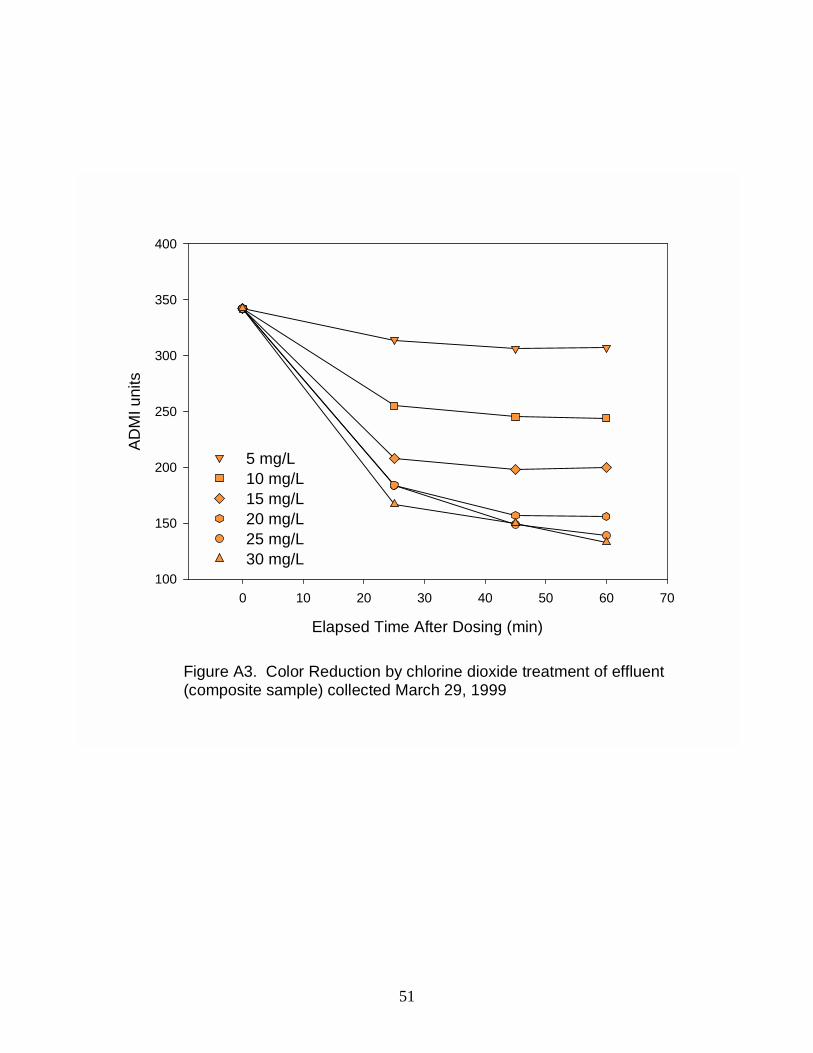
Chlorine dioxide (without UV) was consumed rapidly by the Lower Smith
effluent, and the largest percent of color removal was obtained within the first 5-15
minutes following dosing with ClO2. The data presented in Figure 13 indicate the
effective dosage of ClO2 in achieving the 300 ADMI level for various initial effluent
ADMIs over 45 minutes of chemical exposure time. The ClO2 concentrations used in this
study ranged from 5 to 30 mg/L, and larger ClO2 concentrations can be linearly
extrapolated for higher initial effluent ADMIs based on Figure 13 up to nearly 500 units.
The linear relationship between the effective ClO2 dosage required for decolorization of
effluent to 300 ADMI units and the initial ADMI effluent between 0 and 500 units is as
follows:
Effective ClO2 dosage (mg/L) = 0.1063 (Initial ADMI – 300 units) (9)
The results from the study of ClO2 effects on the dye solutions (Figure 10)
suggested that a 5 mg/L ClO2 dosage applied to the red and blue dyes reduced the color
to below 300 ADMI units after 1 minute. Little additional reduction occurred over the
next remaining 9 minutes. If an ADMI below 300 units was desired, an increased ClO2
dose would be required, but the residual ClO2 concentrations may become an obstacle
because ClO2 is toxic to stream organisms.
Only a few ClO2 demand studies were performed during this investigation
because the demand at the lower dosages appeared to be exerted rapidly. Higher ClO2
dosages to the effluent produced larger color reductions within the first 15 minutes.
Beyond 15 minutes, the effluent color stabilized indicating that the ClO2 demand was at
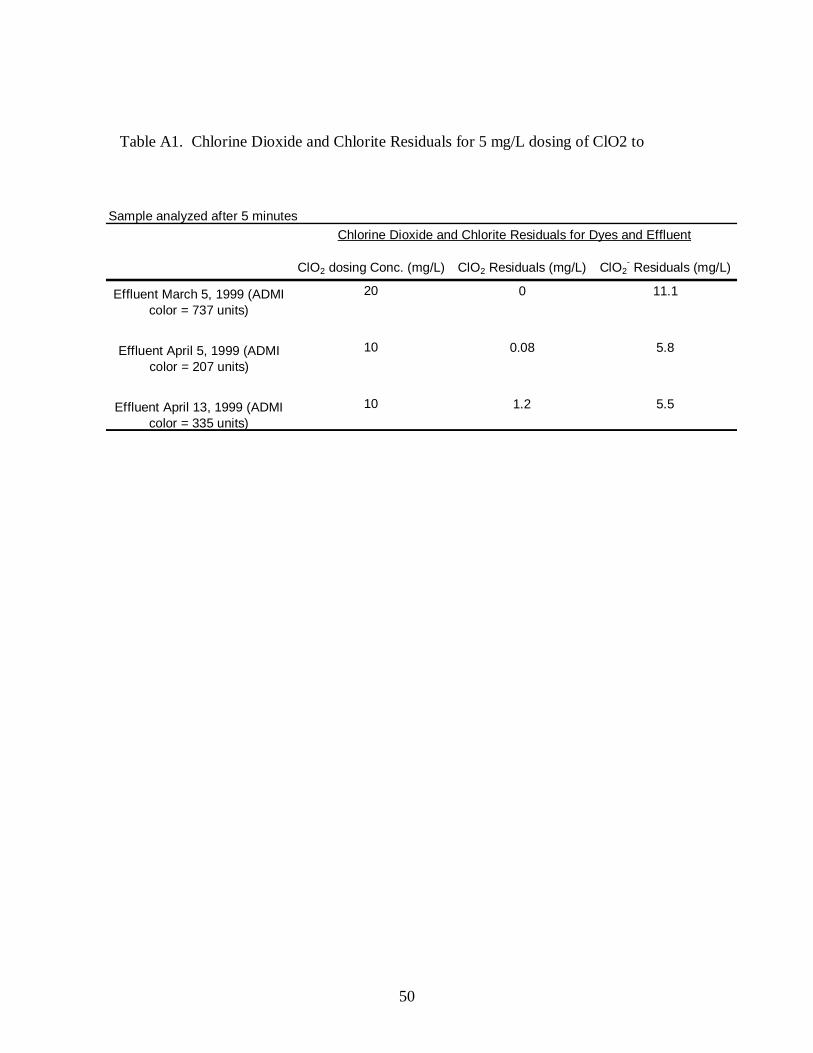
least as high as the highest applied ClO2 dose. Chlorine dioxide residuals for three
different effluents indicated little to no ClO2 remained after 5 minutes (Appendix Table
A1). Occasionally the ADMI color values (not necessarily the hue intensity of the
effluent) would increase with higher dosages of ClO2. This might have been caused by
the delayed reformation of chromophores after the initial color reduction and
consumption of ClO2. Additional graphs of ADMI color versus ClO2 exposure time of
Lower Smith effluent for varying ClO2 dosages can be found in the appendix (Figures
A3-A7).
41
The results from the demand study of the dyes indicated that after a 5-minute
exposure time, approximately 1.43 mg/L ClO2 remained in the red and blue dye solutions
(Table 2). It is possible that further decolorization might have taken place due to the
remaining ClO2 in solution. The color reduction over a 10-minute exposure time for the
green dye indicated that a 5 mg/L dosage provided continual color removal, but during
the 10-minute contact period did not reduce the color to 300 ADMI units. During the
remaining chemical exposure time, the residual ClO2 was most likely consumed, given
the continual decolorization seen in the green dye solution.
The red and blue dye solutions were decolorized by the combination of UV and
ClO2 in a fashion similar to that seen by UV/H2O2. The green dye was resistant to the
treatment and never reached 300 ADMI units in the 10-minute exposure time. During the
first minute of contact, the intensity of the red and blue dyes decreased 200 ADMI units
more than the decrease brought about by UV/H2O2 treatment. The UV exposure time
required to reach the 300 ADMI units value for the Lower Smith effluent was slightly
shorter for UV/ClO2 (5 mg/L) than for UV/H2O2 (25 mg/L) according to Figure 14. The
linear relationship of UV/ClO2 (5 mg/L) between the UV exposure time required for
decolorization of effluents to 300 ADMI units and initial ADMI values is:
UV exposure (min) = 0.030 (Initial ADMI – 300 units) (10)
If color reduction below 300 ADMI units was required, the UV/ClO2 treatment
appeared to be the most effective. The oxidant concentration of 5 mg/L ClO2 and 1
minute UV exposure time provided additional color reduction (Figures 15 -18) and
continued decolorization for the remaining 9 minutes. This finding suggests that ClO2
initially causes the sharp decrease in color and UV provides the remaining color
reduction. These data also imply that ClO2 oxidized the dyes better than H2O2 when
irradiated with UV light. An explanation for this may be that the standard oxidation
potential of the ClO2 is larger than the oxidation potential of H2O2 (-1.15 volts and –
1.776 volts, respectively), thereby, providing more oxidative strength.
The effects of the different treatment processes on the dyes and the effluent
provided varying results. The data indicated similar trends for the red and blue dyes
regardless of the type of treatment. According to Figures 15 and 16, the most effective
42
treatments (i.e. the treatment providing the most color reduction within the shortest time
period) were both ClO2 alone and UV/ClO2 (5 mg/L). The next best treatment process
was UV/H2O2 (5 mg/L) after 3 minutes UV exposure time. It should be noted that the
green dye was never decolorized to the 300 ADMI units during the first minute of either
UV exposure time or chemical exposure time, and the only treatment process that
achieved the 300 ADMI units was the UV/H2O2 (5 mg/L) after a 10-minute UV exposure
time.
A comparison of the treatment processes on the Lower Smith effluent (Figure 18)
showed that UV/ClO2 (5 mg/L) treatment provided the best color removal after 1 minute
of UV exposure time. The next most effective treatment process was UV/H2O2 (5 mg/L)
given a 10 minute UV exposure time. However, the addition of ClO2 without UV was
able to reduce color to 300 ADMI units at concentrations greater than 5 mg/L, but
required a chemical exposure period estimated at 30 minutes to 45 minutes. The
response of the treatments using UV exposure showed a decrease in color within the first
minute and then followed a linear pattern between 1 and 10 minute UV exposure time.
The slopes of these linear patterns were determined based on linear regression of the data.
The regression indicated that the greater slope of the UV/ClO2 treatment between 1 and
10 minutes provided more color reduction and the smaller slopes of UV and UV/H2O2
treatments suggested similar reduction rates. One explanation for the increased rate of
reduction is the oxidant is largely consumed within the first minute and the remaining
decolorization is a result of UV exposure. The increased oxidizing strength of ClO2 may
have provided additional decolorization during the remaining 9 minutes of UV exposure.
43
CHAPTER 6: SUMMARY AND CONCLUSIONS
As evidenced in this study, certain reactive azo dyes and spent textile dye
wastewater can be decolorized by chemical oxidation. The red, blue and green dyes were
generally more easily decolorized than the Lower Smith effluent. These data will be
more relevant to operations of the Lower Smith WWTP if the effluents from the textile
manufacturers exhibit a dominant hue or color similar to the red, blue and green dyes.
The results of this investigation performed on the Lower Smith effluent indicated
that ADMI color reduction to the VPDES permit of 300 units could be achieved by each
of the treatments (UV, UV/H2O2, UV/ClO2, and ClO2). The most effective was UV
exposure after the addition of 5 mg/L ClO2. The use of UV becomes an obstacle for a
wastewater treatment facility because UV equipment, operations, and maintenance are
expensive. Difficulties inherent in the generation and dosing of ClO2, in addition to the
UV maintenance, may further complicate implementation of the process. The alternative
treatment was ClO2 as the sole oxidative agent. The results from the ClO2 study
indicated ClO2 concentration as high as 30 mg/L might be required if the effluent ADMI
was high. The expense associated with generation of high concentrations of ClO2 could
potentially match or exceed costs of UV/ClO2. The Lower Smith WWTP would need to
perform a cost investigation and analysis of the ClO2 and UV/ClO2 treatments.
The by-products created after treatments by UV, UV/H2O2, ClO2 and UV/ClO2
are unknown. In addition, chlorite and chlorate by-products are known to be toxic. More
research is necessary to analyze the by-products in the effluent and their potential toxicity
to stream organisms.
The conclusions derived from this study are:
• The red and blue dye solutions (initial ADMI = 800 units) are readily decolorized by
UV, UV/H2O2, ClO2, and UV/ClO2, but the green dye solution (initial ADMI = 800
units) is more resistant to the oxidants.
• Predictive linear models provide simple equations for UV exposure time or ClO2
doses required to achieve 300 ADMI units for variable initial effluent. The data
suggest UV/ClO2 (5 mg/L) and UV/H2O2 (25 mg/L) will ensure adequate
decolorization for typical effluent ADMI values.
44
• Chlorine dioxide treatment alone and with UV irradiation were the most effective
treatments for reducing Lower Smith effluent color to 300 ADMI units and are
recommended treatments for consideration at the WWTP.
45
LITERATURE CITED
American Water Works Association. 1994. Sources, Occurrences, and Control ofChlorine Dioxide By-Product Residuals in Drinking Water. AWWA ResearchFoundation and American Water Works Association (Publisher).
Barnhart E.L. 1993. The Efficacy of Color Removal Techniques in Textile Wastewater.Electric Power Research Institute. Palo Alto, CA. 94304.
Churchley, John and Upton, John. 1997. Latest Developments in Textile ColourRemoval Case Studies. Severn Trent Water Limited. Coventry, United Kingdon.
Eaton, A.D., Clesceri, L.S., Greenberg, AE, eds. Standard Methods for the Examinationof Water and Wastewater. 1995.
Glaze, William. 1993. An Overview of Advanced Oxidation Processes: Current Statusand Kinetic Models. Eckenfelder, W., Bowers A.R., Roth, J.A., Editors. Proceedings ofthe Third International Symposium Chemical Oxidation: Technology for the Nineties.Technomic. Lancanster.
Gordon, Gilbert and Bubnis, Bernard. 1999. Ozone and Chlorine Dioxide: SimilarChemistry and Measurement Issues. Ozone Science and Engineering. 21: 447-463.
Gregor, Karl H. 1992. Oxidative Decolorization of Textile Waste Water with AdvancedOxidative Processes. Peroxid-Chemie GmbH, D-8023 Hollriegelskreuth, FRG.
Hanzon, Boyd and Vigilia, Rudy. 1999. UV Disinfection. Wastewater Technology.2:24-28.
Ince, N.H. and Gonenc, D.T. 1997. Treatability of a Textile Azo Dye by UV/H2O2.Environmental Technology. 18:179-185.
Liao, C., Lu, M., Yang, Y., Lu, I. 2000. UV-Catalyzed Hydrogen Peroxide Treatment ofTextile Wastewater. Environmental Engineering Science. 17:9-18.
Namboodri, C.G. and Walsh, W.K. 1996. Ultraviolet Light/Hydrogen Peroxide Systemfor Decolorizing Spent Reactive Dyebath Waste Water. American Dyestuff Reporter.
Profile of the Textile Industry. 1997. EPA Office of Compliance Sector NotebookProject. EPA 310-R-97-009. EPA Washington, DC.
Shu, H., Huang, C., Chang, M. 1994. Decolorization of Mono-Azo Dyes in Wastewaterby Advanced Oxidation Processes: A Case Study of Acid Red 1 and Acid Yellow 23.Chemosphere. 29:2597-2607.
46
Society of Dyers and Colourists. 1990. Colorants and Auxiliaries Volume 1-Colorants.John Shore, editor. BTTG. Manchester, England
Sundstrom, D.W., Weir, B.A., Klei, H.E. 1989. Destruction of Aromatic Pollutants byUV light Catalyzed Oxidation with Hydrogen Peroxide. Environmental Progress. 8:6-11.
Yang, Y., Wyatt, D.T.II., Bahorshky, M. 1998. Decolorization of Dyes Using UV/H2O2
Photochemical Oxidation. Textile Chemist and Colorist. 30:27-35.
.
47
APPENDIX
48
Figure 1A. UV/H2O2 bench study set up
49
Figure 2A. UV/ClO2 bench study set-up
50
Table A1. Chlorine Dioxide and Chlorite Residuals for 5 mg/L dosing of ClO2 to
Sample analyzed after 5 minutes
ClO2 dosing Conc. (mg/L) ClO2 Residuals (mg/L) ClO2- Residuals (mg/L)
20 0 11.1
10 0.08 5.8
10 1.2 5.5
Effluent March 5, 1999 (ADMIcolor = 737 units)
Effluent April 5, 1999 (ADMIcolor = 207 units)
Effluent April 13, 1999 (ADMIcolor = 335 units)
Chlorine Dioxide and Chlorite Residuals for Dyes and Effluent
51
Figure A3. Color Reduction by chlorine dioxide treatment of effluent(composite sample) collected March 29, 1999
Elapsed Time After Dosing (min)
0 10 20 30 40 50 60 70
AD
MIu
nits
100
150
200
250
300
350
400
5 mg/L10 mg/L15 mg/L20 mg/L25 mg/L30 mg/L
52
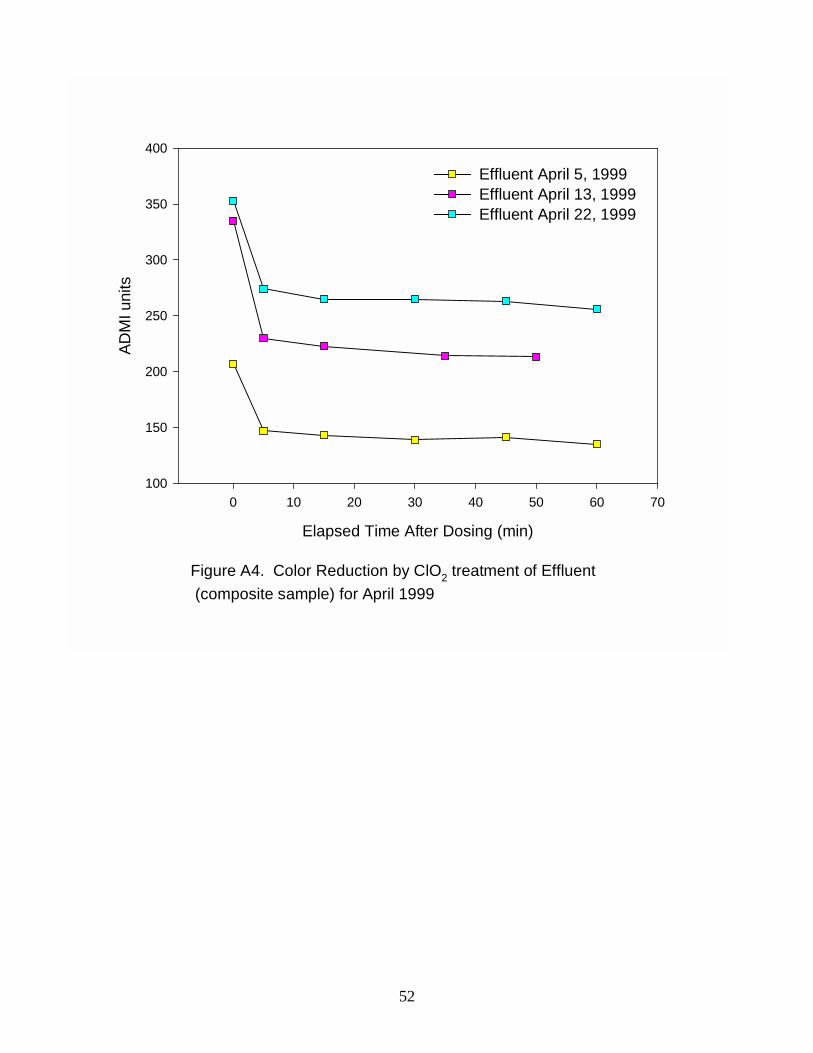
Figure A4. Color Reduction by ClO2 treatment of Effluent
(composite sample) for April 1999
Elapsed Time After Dosing (min)
0 10 20 30 40 50 60 70
AD
MIu
nits
100
150
200
250
300
350
400
Effluent April 5, 1999Effluent April 13, 1999Effluent April 22, 1999
53
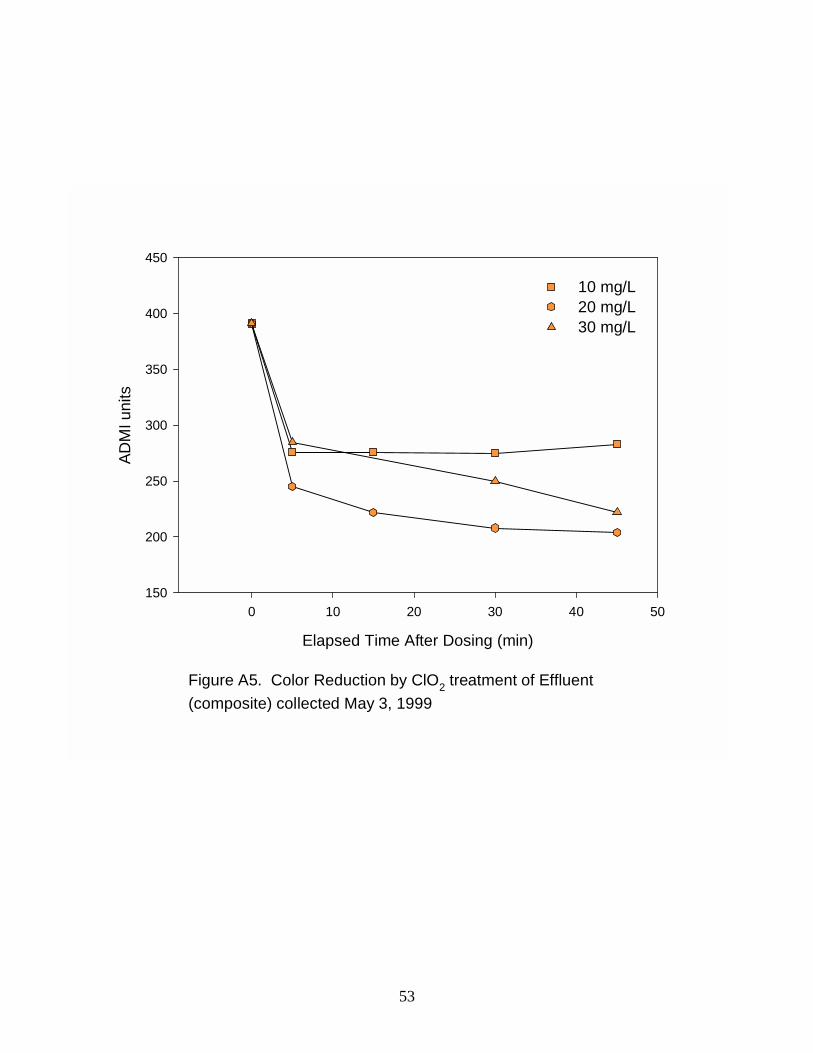
Figure A5. Color Reduction by ClO2 treatment of Effluent
(composite) collected May 3, 1999
Elapsed Time After Dosing (min)
0 10 20 30 40 50
AD
MIu
nits
150
200
250
300
350
400
450
10 mg/L20 mg/L30 mg/L
54
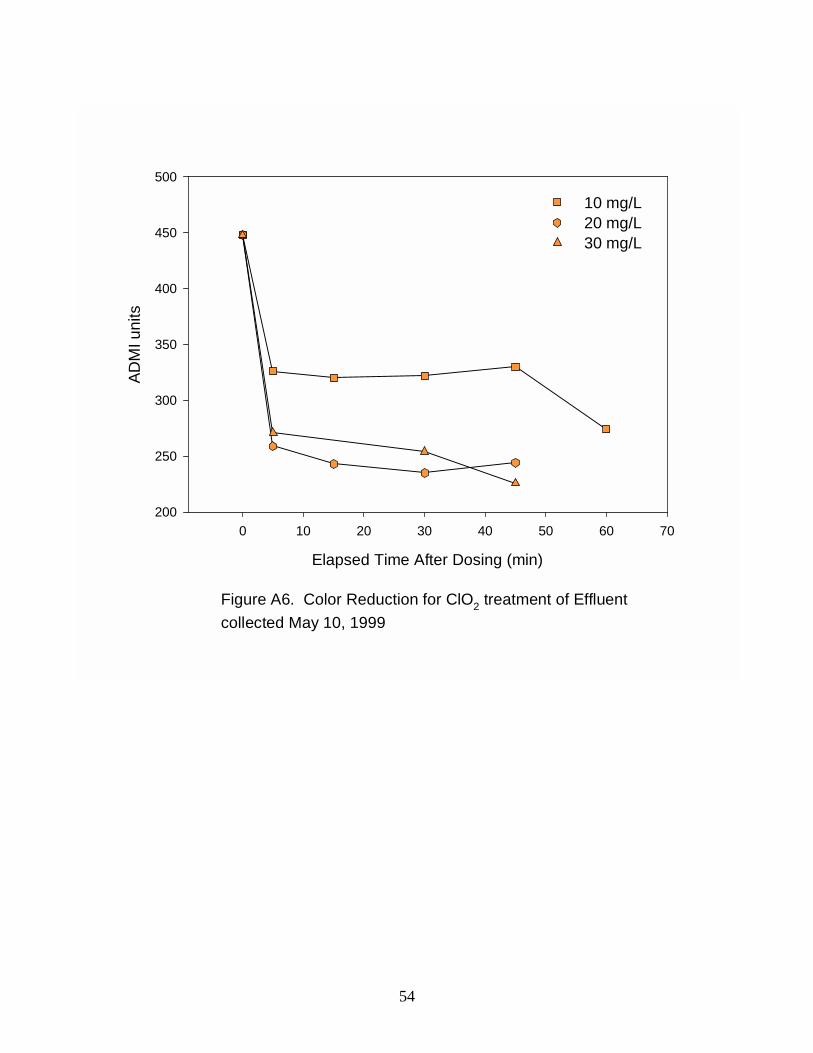
Figure A6. Color Reduction for ClO2 treatment of Effluent
collected May 10, 1999
Elapsed Time After Dosing (min)
0 10 20 30 40 50 60 70
AD
MIu
nits
200
250
300
350
400
450
500
10 mg/L20 mg/L30 mg/L
55
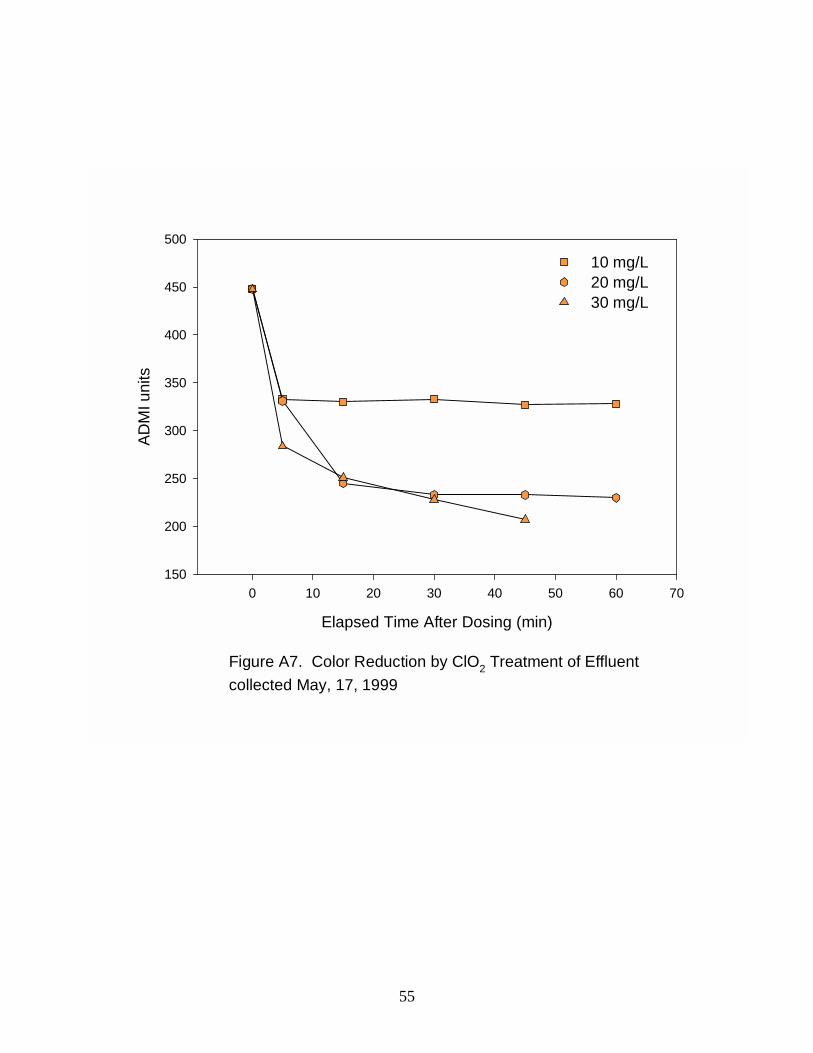
Figure A7. Color Reduction by ClO2 Treatment of Effluent
collected May, 17, 1999
Elapsed Time After Dosing (min)
0 10 20 30 40 50 60 70
AD
MIu
nits
150
200
250
300
350
400
450
500
10 mg/L20 mg/L30 mg/L
56
VITA
Jessica Corinne Edwards was born on August 30, 1976 in Crookston, MN. She
graduated from Skidmore College (Saratoga Springs, NY) in 1998 with a BA in
Chemistry and a minor in English. In August of 1998, she entered the Department of
Civil and Environmental Engineering - Master of Science program in Environmental
Science and Engineering at Virginia Polytechnic Institute and State University
(Blacksburg, VA). Following the completion of the degree requirements in July 2000,
Jessica will begin employment with the Black and Veatch Corporation in Kansas City,
MO as an environmental analyst in the Potable Water Division.