
Investigation of appropriate control measures (abatement
118
Investigation of appropriate control measures (abatement technologies) to reduce Black Carbon emissions from international shipping - Study Report Prepared by in co-operation with Daniel A. Lack Currently at University, Boulder, Colorado, USA & Jørgen Thuesen & Robert Elliot, ERRIA, DK 20 th of November 2012
Transcript of Investigation of appropriate control measures (abatement

0
0
Investigation of appropriate control measures (abatement technologies) to reduce Black Carbon emissions from international shipping -
Study Report
Prepared by
in co-operation with
Daniel A. Lack
Currently at University, Boulder, Colorado, USA
&
Jørgen Thuesen & Robert Elliot, ERRIA, DK
20th of November 2012

1

2
Foreword
This study was carried out using funds provided to IMO by Transport Canada for analytical studies and
other activities pertaining to the control of air related emissions from ships. The study was tendered
under the title ‟Investigation of appropriate control measures (abatement technologies) to reduce Black
Carbon emissions from international shipping‟ and was won by a consortium lead by LITEHAUZ (Den-
mark). The participitants responsible for the study were Dr. Daniel A. Lack currently at the University of
Colorado, Boulder, USA; mr. Jørgen Thuesen and mr Robert Elliot, ERRIA, Denmark; and Dr. Frank Stuer-
Lauridsen, mr. Svend B. Overgaard and ms. Ditte Kristensen, LITEHAUZ, Denmark.

3
List of Abbreviations
AHTS Anchor Handling Tug Supply MCR Maximum Capacity Rating
AMSA Arctic Marine Shipping Assessment MT Medium Term
BC Black carbon NA Not available
CA Commercially available NR Not reported
CAPEX Capital expenditure NOX Mono-nitrogen oxides
CO2 Carbon dioxide OPEX Operating expense
DE Demonstration OS Other sectors
DME Dimethyl ether OSV Off-shore Supply Vessel
DOC Diesel oxidation catalyst PM Particulate matter
DPF Diesel particulate filters SCR Selective catalytic reduction
ECA Emission control area SEEMP Ship Energy Efficiency Management Plan
EEDI Energy efficiency design index SFOC Specific fuel oil consumption
ESP Electrostatic precipitators SOX Mono-sulphur oxides
FW Fresh water scrubbers SSDR Slow-steaming de-rating
HFO Heavy fuel oil SWS Sea water scrubbers
IM Immediate UI Unlikely Implementation
IMO International Maritime Organization ULSD Ultra-low sulphur diesel
IN Intermediate VOC Volatile organic compound
LNG Liquefied Natural Gas WiFE Water-in-fuel emulsion
LT Long-term
MARPOL International Convention for the Pre-vention of Pollution From Ships
MDO Marine distillate oil
MEPC Marine Environment Protection Com-mittee

4
Table of Contents
List of Abbreviations 3
1 Introduction 6 1.1 Black Carbon 6 1.2 Black Carbon from Ships 6 1.3 The Impact of Black Carbon from Ships on the Arctic 6 1.4 The International Maritime Organization and Black Carbon from Ships 7
2 Measurement and Data Availability 9 2.1 Black Carbon Measurement and Data Availability 9 2.2 Particulate Matter as a Proxy for Black Carbon 9 2.3 Fuel Efficiency Improvements as a Proxy for Black Carbon Reduction 10 2.4 Primary Abatement Metrics 10 2.5 Secondary Abatement Considerations 10 2.6 Technology Maturity 10 2.7 Technology Uptake Time 11
3 Black Carbon Abatement Options 12 3.1 Fuel Efficiency - Vessel Design (excludes engine, fuel options) 12 3.2 Fuel Efficiency – Monitoring Options 13 3.3 Fuel Efficiency – Engine Options 14 3.4 Slow Steaming 15 3.5 Fuel Treatments 17 3.6 Fuel Quality – Traditional Fuels 18 3.7 Alternative Fuels 19 3.8 Exhaust Treatment 21 3.9 Summary of Data Sources and Sampling Protocols for BC Abatement 23
4 Short-List Selection of BC Abatement Options 26
5 Cost and Feasibility of BC Abatement Technologies 29 5.1 Abatement Technology Case by Case 29 5.2 Slow Steaming – With De-Rating 30 5.3 Water-in-Fuel Emulsion (WiFE) 31 5.4 Heavy Fuel Oil (HFO) – Distillate 32 5.5 LNG/DME 32 5.6 Diesel Particulate Filters (DPF) 34 5.7 Scrubbers – High Sulphur 34
6 Comparison of Abatement Technologies 36 6.1 Introduction to Assessments 36 6.2 Comparisons of Technologies 37 6.3 Cost of Reducing BC in Example Vessels 1 6.4 Assessment of Feasibility 5 6.5 Feasibility in a Regulatory Context 7 6.6 Overview of Technologies 10
7 References 12
Appendix 21 Appendix A – Cost Overview 22 Appendix B – Corbett Calculations 25
5
Appendic C - Cost and BC Reduction Overview: Ship Types 10MW with Aframax Tanker
Base Case 29 Appendix D – Cost and BC Reduction Overview: Similar Docking Size; Varying MW 38 Appendix E - Erria Report 1

6
1 Introduction
1.1 Black Carbon
Black Carbon (BC) is the product of incomplete combustion of organic fuels. Specifically, it is strongly
light absorbing across the visible wavelength spectrum. The largest sources of BC are fossil fuel, biomass
and biofuel combustion [1]. BC has distinct human health impacts [2, 3] and is a potent climate forcer
creating significant atmospheric warming [4]. Recent national and international reports provide com-
prehensive details on the definition, sources and impacts of BC [5-7], and the following detailed defini-
tion for BC has been proposed to the International Maritime Organization (IMO) by the Institute of Ma-
rine Engineering, Science and Technology [8]:
Black Carbon (BC) is strongly light-absorbing carbonaceous material emitted as solid
particulate matter created through incomplete combustion of carbon-based fuels.
BC contains more than 80% carbon by mass, a high fraction of which is sp2-bonded
carbon, and when emitted forms aggregates of primary spherules between 20 and
50 nm in aerodynamic diameter. BC absorbs solar radiation across all visible wave-
lengths and freshly emitted BC has a mass absorption efficiency of 5m2g-1 at the
mid-visible wavelength of 550 nm. The strength of this light absorption varies with
the composition, shape, size distribution, and mixing state of the particle.
1.2 Black Carbon from Ships
BC emissions from the international commercial shipping industry are thought to contribute about 1-2%
of global BC [9]. Ships emit more particulate matter (PM) and BC per unit of fuel consumed than other
fossil fuel combustion sources due to the quality of fuel used [10]. BC emissions from ships contribute
(as a component of PM) to increased human morbidity and mortality [11]. Several other studies have
also been undertaken into the impact of shipping emissions [12, 13, 14].
1.3 The Impact of Black Carbon from Ships on the Arctic
With the dramatic decline of Arctic sea ice over the past few decades, culminating in a minimum sea ice
extent of 4.28 million km2 in 2007 (compared to ~10 million in 1970) [15], comes the possibility of regu-
lar transits of the Arctic by commercial shipping traffic. New data from mid September 2012 shows even
lower minimum ice coverage of 3.41 million km2. The ice loss rate was in the 2012 season 91,700 square
kilometres per day, as opposed to 66,000 square kilometres per day in 2007 [15]. Journeys between Asia
and Europe and Eastern US and Asia through the Arctic could cut travel distances by 25% and 50% re-
spectively, with coincident time and fuel savings also resulting. The exploration for, and development of
resource reserves (e.g. oil, natural gas, forestry), and increased access to fisheries will also drive an
increase in localized shipping traffic [16-18]. Exploitation of opening Arctic-shipping routes may be re-
stricted or delayed by several factors. Reductions in multi-year sea ice in some areas of the Northwest
Passage (NWP) and Northeast Passage (NEP) will be required to improve Arctic transit viability. Vessel
7
redesign and construction may be needed, appropriate weather conditions in an ice-reduced regime are
not assured and new regulations are likely to arise for emergency response, ice charting, ice breaking,
and national sovereignty issues [16-19].
The climate of the Arctic region is known to be warming at almost twice the rate of the rest of the
world [4, 16]. The mechanisms of this warming, and in consequence Arctic sea ice and snow loss, are
closely linked to surface air temperatures, ocean circulation and radiative fluxes [20]. The majority of
influence on the radiative forcing in the Arctic is from external (i.e. outside of the Arctic) emissions of
greenhouse gases and particulate matter [16, 21], with possibly half of Arctic temperature rise linked to
BC [21]. Most Arctic BC pollution is sourced from anthropogenic and biomass burning activity within Eur-
asia [22], and outside of strong biomass burning years BC levels may be stabilizing or decreasing in the
Arctic [21, 23-25]. Recent work shows that also ship BC emissions from outside of the Arctic can con-
tribute to Arctic warming [32].
Increases in Arctic shipping will introduce direct near-surface emissions of pollution, including BC. These
direct emissions are significant contributors as Arctic warming is most sensitive to emissions within the
region compared to the current emissions where most must survive long-range transport from its source
before directly impacting the region [21, 26]. The warming efficacy of BC in the Arctic is at least double
that of CO2, as it absorbs incoming and snow-reflected radiation [22] and accelerates snow and ice melt-
ing when deposited to those surfaces [27]. It is therefore likely that any climate benefits of BC reduc-
tions within traditional shipping routes will be met with increases in the warming effect of BC emissions
across the new Arctic routes. Current and future inventories of Arctic BC from shipping activities have
been developed predicting significant increases of BC emissions in future years [28, 29]. The use of the-
se inventories to model the climate impacts of ship-emitted BC show that regional scale effects are dif-
ficult to distinguish from the impacts of other BC sources. However shipping BC potentially contributes
up to 50% of BC in some regions of the Arctic [31] and localized increases in snow and ice melt do occur
near the projected shipping lanes [30, 31] [32].
1.4 The International Maritime Organization and Black Carbon from Ships
In recent years the IMO has introduced international regulation to reduce emissions of nitrogen oxides
[33] and the sulphur content of fuel [34], which are linked to ground level ozone and particulate matter,
and both of which have an impact on human health. In addition, the IMO has also commissioned studies
in the impacts of greenhouse gases from ships [35] and subsequently introduced carbon dioxide reduc-
tion measures in the form of a ship energy efficiency design index (EEDI) requiring continual improve-
ments in ship efficiency [36]. Efforts to investigate the definition, measurement and impact of BC emis-
sions from shipping have been initiated [37].
Discussion on reduction of PM from ships at the IMO, with specific or implied reference to BC arose from
the establishment of a correspondence group during the 10th session of the Bulk Liquids and Gases sub-
committee [38]. This correspondence group was established, “with a view to controlling emissions of
particulate matter (PM), study current emission levels of PM from marine engines, including their size
distribution, quantity, and recommend actions to be taken for the reduction of PM from ships” [38]. The
group reported to BLG 11 (2007) [39] on multiple options for reductions in all PM, some of which specifi-
cally suggested PM (rather than just fuel sulphur or particulate sulphate) limits. During BLG 12 (2008)
[40], Norway submitted a paper recommending a standard for PM measurement (ISO 9096) that was

8
compatible with the high sulphur fuel used in many ships [41], thereby establishing an important
benchmark for the following discussions of reliable measurement protocols. At MEPC 59 (2009) [42] the
United States and Canada submitted a proposal to the IMO to establish an emission control area (ECA),
for control of SOX, PM and NOX emissions [42]. This North American ECA was approved at MEPC 60 in
2010 [43]. Also during MEPC 60, Norway, Sweden and United States provided an outlined of the effects
of BC on the Arctic and suggested possible actions for mitigation of BC from ships [44]. During MEPC 61
(2010) [43] the IMO agreed in relation to BC from ships “to invite interested Member Governments and
international organizations to submit concrete proposals with specific measures to BLG 15”. Information
papers were submitted to BLG 15 (2011) [45] relating to an international report on the science of BC and
climate [46] and the impacts of ship BC on the Arctic [32]. Further discussions on BC at BLG 15 and MEPC
62 (2011) [37] led to the following tasks to be identified for the BLG subcommittee:
1. develop a definition for Black Carbon emissions from international shipping;
2. consider measurement methods for Black Carbon and identify the most appropriate method
for measuring Black Carbon emissions from international shipping;
3. investigate appropriate control measures to reduce the impact of Black Carbon emissions from
international shipping; and
4. submit a final report to BLG 17
BLG 16 (2012) saw six informational submissions on ship BC issues [8, 47-51] related to these four points.
The submissions include suggestions for definitions, appropriate measurement techniques (i.e. tech-
niques, not measurement protocols) as well as two presentations, and in addition to establish a working
group on Consideration of the Impact on the Arctic of Emissions of Black Carbon from International
Shipping to address in more details the four points above. This document is expected to contribute to
point 3 of the BLG correspondence group. The relevant IMO information papers have been assessed and
used, where appropriate in this report.

9
2 Measurement and Data Availability
2.1 Black Carbon Measurement and Data Availability
The availability of BC mass emission data from ship engines and relative measurements of BC mass be-
fore and after treatment of fuels or exhaust is limited. Particularly relative to other BC sources such as
on-road diesel engines. It is recognized that there are strengths and weaknesses to various measurement
techniques [2], however, Lack and Corbett [10] reviewed the measurement of BC and related species
such as elemental carbon (EC) from ship engines. The findings show that, within an uncertainty of ap-
proximately 20%, most analytical methods for measuring the mass of the strongly light absorbing mate-
rial defined as BC, are the same. Since there is a strong lack of data availability for shipping BC abate-
ment technologies, this review paper will consider all the available BC and PM data with emphasis on
peer-reviewed data, with appropriate caution placed on indirect measures of BC (discussed below).
The majority of research into the emissions of BC from diesel engines is sourced from the on-road diesel
fleet (trucks and busses) where significant fuel-quality, fuel treatment, and exhaust treatment regula-
tions have been mandated [52-54]. Some of these regulations have only just emerged for the commer-
cial shipping industry [34] and measurement campaigns for ship emissions have not been prioritized due
to former lack of regulation and difficulty in accessing or instrumenting large commercial ships and en-
gines.
Where available, measurements of BC from ship engines are used in the assessment of abatement tech-
nologies. However, to make the full assessment of technologies measurements of species similar to BC
(see Lack and Corbett [10]) and alternative proxies for BC and BC emissions reductions were in some
cases considered.
2.2 Particulate Matter as a Proxy for Black Carbon
BC is a component of PM mass, the contribution of which is dependent on the combustion source. For
example, BC from biomass burning comprises 2 - 5% of total PM mass [55] where BC from engines burn-
ing ultra-low sulphur diesel can range from 65% - 75% of PM mass [56, 57]. BC is also formed within a
diameter range of 20 – 250nm [e.g. 58, 59, 60], unlike PM which can range up to many 1000‟s of nm [61]
and commonly measured and reported as PM10 (<10 m diameter) or PM2.5 (<2.5 m diameter).
Where BC mass measurements were not available, PM mass measurements were used as a proxy if one
of the following criteria were met1:
1 Information regarding whether bulk PM, or size selected PM was used as a proxy for BC in this review is summarised-for each abatement technology in Table 9.
10
Where BC and PM removal were not expected to differ based on the abatement technolo-
gy. For example, BC is known to be hydrophobic upon emission from many sources. Scrub-
bing technology that relies on particle wetting may have different removal rates. In con-
trast a filter will remove particles of the same size regardless of composition.
Where PM removal rates were provided as a function of PM size, extrapolation to a BC re-
moval rate is possible.
For one study particle number was the only particle measurement available. We view this as a semi-
quantitative proxy for BC.
2.3 Fuel Efficiency Improvements as a Proxy for Black Carbon Reduction
BC emission is directly proportional to fuel consumption (at full engine load) [10]. At reduced engine
load, or inefficient operation of the engine, this direct proportionality is not likely to hold [10]. In the
assessment of fuel efficiency measures for BC reductions, it is assumed that when a measure reports a
fractional change in fuel consumption that BC mass emissions will also reduce by this amount2.
2.4 Primary Abatement Metrics
All PM or BC reductions are given as a percentage reduction from the units presented in the literature.
This could be PM or BC mass per unit fuel consumed, per distance travelled or per unit of work. The use
of relative PM, or BC reductions eliminates the need to convert data into a single unit. In each table up
to three numbers are given for BC abatement potential for each technology: LOW|MID|HIGH; which rep-
resents the lower, middle and upper bound of abatement potential identified from literature. A nega-
tive number indicates an increase in BC emissions. Where a middle abatement potential is not discerna-
ble from literature an average between the lower and upper bounds is used. This method of presenting
abatement potential is also used for CO2 reduction assessment.
2.5 Secondary Abatement Considerations
While BC is the primary abatement focus, the IMO has also spent significant effort in the abatement of
CO2, NOX and SOX. In this review the BC abatement option is also assessed with regards to the technolo-
gy‟s reduction of CO2 and the qualitative abatement potential for NOX and SOX. These assessments are
considered as co-benefits to the BC abatement technology.
2.6 Technology Maturity
The overall purpose of this review is to provide input to IMO‟s assessment of available instruments for
regulating this area. In order to fully address the availability of the abatement technologies the Long
List assessment of abatement options given in this review therefore includes an estimate of the maturi-
ty of the technology. These include:
2 Details of when this BC proxy is used when assesseing the abatement technologies are given in Table 9.

11
CM: Commercially Available – Multiple units operational in the shipping sector.
CF: Commercially Available – Few units operational in the shipping sector.
DE: Demonstration – Feasibility demonstrated in the shipping sector, but it is not commercially availa-
ble yet.
OS: Other Sectors - Technology is commercially available in other sectors and potentially applicable in
shipping.
NA: Not Available - Technology may not be available in the long term.
2.7 Technology Uptake Time
The long list assessment of abatement options includes an estimate of implementation time based on
the maturity of the technology, requirements for retro-fit, ship newbuilds, research or design.
IM: Immediate - <12 months. Commercially available.
IN: Intermediate - 1 - 5 years. Commercially available, but major retro-fit or newbuild required.
MT: Medium Term - 5 – 10 years. Not commercially available. Design/experimental stage and will re-
quire further development, research and commercialization.
LT: Long-Term - > 10 years. Major design, safety and commercialization effort necessary.
UI: Unlikely Implementation - Technology unlikely to be implemented.

12
3 Black Carbon Abatement Options
BC abatement technologies are assessed within the following categories:
Fuel Efficiency – Vessel Design
Fuel Efficiency – Engine Options
Fuel Efficiency – Monitoring Options
Slow Steaming
Fuel Treatments
Fuel Quality (Traditional Fuels)
Alternative Fuels
Exhaust Treatment
The fuel efficiency measures presented are mostly summaries of a number of the high-return options
from the guide to ship eco-efficiency technologies and measures [62]. A full lifecycle assessment of fuel
production, waste disposal and new ship builds with inclusion of externalized cost should be considered
for each new abatement technology, but it is beyond the scope of the current study. Currently, the data
availability and data quality of the majority of the technology options regarding life cycle assessment do
not render such an exercise feasible.
3.1 Fuel Efficiency - Vessel Design (excludes engine, fuel options)
Improved fuel efficiency through vessel redesign will save fuel costs and reduce emissions. Many fuel-
efficient vessel design options are currently available. An energy efficiency design index (EEDI) has been
adopted by the IMO [36] and requires step-wise improvements to the energy efficiency of new build
ships, starting at 10% reduction in CO2 per tonne-mile from 2015, increasing to 20% and 30% from 2020
and 2025, respectively. The options for improved efficiency are left to the designers, builders and own-
ers of the new ships [63], and presumably will allow the most cost-effective options to be developed
and integrated into new ship builds. The EEDI will reduce fuel consumption (and thus fuel costs) and
these reductions in CO2 emissions will simultaneously reduce the emissions of co-emitted species such as
BC. Where fuel efficiency measures are implemented that move the engine away from efficient combus-
tion e.g. reduced engine load during slow steaming [10], this linear co-reduction of BC will likely not
occur. Future vessels designed for slow steaming will likely incorporate lower power engines so they can
operate near the maximum engine load, or will use engines that can be de-rated or re-tuned for the
lower load. For all measures where maximum engine efficiency is maintained it is assumed that those
measures implemented by industry will provide co-benefit reductions in BC emissions. The options, and
estimated efficiency improvements, for such efficiency measures are presented in Table 1.

13
Table 1 Fuel Efficiency Options (excludes engine and fuel options)a (nr: not reported)
Abatement Measure CO2 %
LOW|MID|HIGH
BC %
LOW|MID|HIGH
Tech-
nology
Maturity
Uptake
Time
Remarks Ref.
EEDI 10|20|30 10|20|30 CA1|
CA2|
D
2015/
2020/
2030
Required due to
regulation. New-
builds, >400 tonnes
[36]
Ballast Water & Trim 1|4|5 1|4|5 CM IM [62]
Propeller Optimiza-
tionb
3|nr|20 3|nr|20 CM IM [62]
Construction Weight nr|5|nr nr|5|nr CF IN Newbuild required [62]
Air Lubrication 3.5|10|15 3.5|10|15 CF IM Retro-fit or new-
build required
[62]
Aerodynamics 3|nr|4 3|nr|4 DE IN Retro-fit or new-
build required
[62]
Hull Coatings 2|5|9 2|5|9 CM IM Material and dry
dock costs
[62]
Hull Cleaning 3|5|10 3|5|10 CM IM Labor and dry dock
costs
[62]
Wind – Fletner Ro-
tors
3.6|nr|12.4 3.6|nr|12.4 DE MT Design, commer-
cialization
[62]
Wind – Sail/Kites 2|nr|26 2|nr|26 CF IM Capital cost
Solar 5|nr|17 5|nr|17 DE IN Retro-fit or new-
build required
[62]
aAll efficiency measures in this section are assumed to produce reductions in NOX and SOX
bCombination of multiple technologies from [62]
3.2 Fuel Efficiency – Monitoring Options
Fuel efficiency improvements due to sophisticated monitoring of ship systems and weather may also
contribute to the overall efforts to reduce fuel consumption from ships. There are currently monitoring
options available for efficient routing of ships around weather systems and for efficient autopilot opera-
tions. Any fuel efficiency gains from these systems will also reduce BC emissions.
Table 2 Fuel Efficiency Options (Monitoring Options) a (nr: not reported)
Abatement Measure CO2 %
LOW|MID|HIGH
BC %
LOW|MID|HIGH
Technology
Maturity
Uptake
Time
Remarks Ref
Weather Routing 2|nr|10 2|nr|10 CM IM [62]
Auto-Pilot Upgrades 0.5|nr| 4 0.5|nr| 4 CM IM [62]
aAll efficiency measures in this section are assumed to produce reductions in NOX and SOX

14
3.3 Fuel Efficiency – Engine Options
3.3.1 Slide Valves
Slide valves are commercially available technology used as a retro-fit options for traditional marine die-
sel engine valves that optimise fuel injection spray patterns [64]. Available data would suggest that
there are neutral or improved (1% at best) fuel efficiency responses from the use of slide valves [65-67].
This technology has been successfully applied to reduce NOX emissions while also showing reductions in
emitted PM and VOC. MAN Diesel and Turbo [68] suggest, that slide valves are an essential retro-fit for
slow-steaming where de-rating is not possible (see section 3.3.2). There is one report of a 2% fuel con-
sumption increase with the use of slide valves [69]. Corbett et al. [65] assessed the potential for BC
reductions for slide valves, concluding that reported PM reductions were equivalent to BC reductions (at
25%). This technology will have the largest impact on older engines [70] and it is becoming standard on
new engines [e.g. 71]. Since slide valves reduce NOX emissions the uptake of this technology is partially
motivated by IMO NOX regulations.
3.3.2 Tuning of Fuel Injection, Timing and Pressure, and De-Rating.
Real time electronic monitoring and tuning of diesel engine parameters, such as fuel injection pressure
and timing and fuel atomization quality, allow for optimum combustion characteristics as engine loads
change [71, 72]. Sub-optimal combustion leads to increased fuel consumption between 1 and 3% [62,
72], and cause BC formation. The optimisation of combustion conditions with engine load (or power de-
mand) can also be achieved through the use of engines with cylinders that can be brought on and off
line [i.e. traditional de-rating, 72]. This technology is available on new marine diesel engines and would
require new engine installation.
Engines that use real time tuning of fuel injection parameters and common rail fuel injection [73] will
have substantially reduced BC emissions at loads below that originally rated for the engine. The extent
of reduction of BC emissions depends on the load of the engine as discussed in the Slow-Steaming sec-
tion (3.4).
Table 3 Fuel Efficiency Options (Engine Options)a
Abatement Measure CO2 %
LOW|MID|HIGH
BC %
LOW|MID|HIGH
Technology
Maturity
Uptake
Time
Remarks Ref.
Slide Valves 1|0|-1 10|25|50 CM IM Motivated by IMO
NOX regulations.
Hardware Cost
[65]
Real Time Tuning,
De-Rating
1|2.5|4 1|2.5|4b CM IN New engine
needed
[62,
72]
aAll efficiency measures in this section are assumed to produce reductions in NOX and SOX
bBC reduction from reduced fuel consumption only. BC reductions from improved combustion conditions discussed in Slow
Steaming section (3.4)

15
3.4 Slow Steaming
Slow steaming is a reduction from full ship speed to a lower speed. This option is attractive for reduc-
tions in emissions from ships, as fuel consumption increases as a cubic function of vessel speed [74].
This means a 10% decrease in speed will lead to a ~27% decrease in fuel consumption [75]. An increase
in the transit time of a ship will lead to a reduced capacity to move goods and maintain delivery sched-
ules. If this lost capacity is replaced in the form of additional ships the added cost reduces the benefits
of slow steaming. A 10% reduction in speed therefore results in a net 20% reduction in fuel consumption
overall [75, 76]. Since 2008 (global financial crisis) many ship companies have reduced ship speeds to
reduce fuel consumption (thus cutting costs). One report suggest that since 2008 the average speed of
the global shipping fleet has reduced speed by 15% [77] which would suggest a 30 - 40% reduction in fuel
consumption. MAN Diesel and Turbo [68] conducted a survey that revealed that 75% of the global bulk
and container shipping fleet was conducting some form of slow steaming during 2011, with many operat-
ing in this manner since 2007. The majority of survey respondents operated at between 30 and 50% en-
gine load. AP Moller Maersk have reported a 22% reduction in fuel costs resulting from reducing engine
load from 100% to 40% for 73% of their fleet [78]. With reduced fuel consumption comes a corresponding
reduction in CO2 and some other emissions. Based on this literature review, further discussion on slow
steaming is done assuming an engine load reductions from 100% to 40% (in speed, from 25 knots to 18
knots).
3.4.1 Slow Steaming without Re-Tuning / De-Rating
If a ship reduces speed without any adjustment to the engine combustion process, BC emissions can in-
crease due to inefficiencies in combustion [10, 79, 80]. MAN Diesel and Turbo note that it is common for
soot build-up to occur within the engine when running at loads less that 100% [68]. Lack and Corbett
[10] reviewed 40 different measurement of BC emissions under varying engine loads and showed that
absolute BC emissions (mass per distance travelled) can increase by an average of 30% if the engine load
is reduced to 40% when the engine is not re-tuned to the new load (see Figure 1). Load reductions from
100% to 20% and 10% can increase BC emissions by 60% and 90% respectively. In another example entail-
ing AP Moller Maersk vessels, it was found that engine load reductions from 60% - 35% could have led to
a 7% increase in absolute emissions of BC if the engines were not re-tuned [10]. Based on the review of
available data, BC emissions appear to remain constant over the load range of 80 – 100% [10] and BC
emissions are therefore likely to increase when speed reductions are obtained from engine load <80%.

16
Figure 1 BC mass changes per distance travelled as a function of vessel speed.
Reproduced from Lack and Corbett [10]
3.4.2 Slow Steaming with De-Rating / Re-Tuning / Slide Valves
Fuel efficiency gains and emission reduction potential of real-time tuning, slide valves and de-rating of
engines were discussed in section 3.3. These processes have the potential to reduce fuel consumption by
1 – 4%. The use of this technology can counteract the significant increase in BC emissions caused by op-
eration of engines at lower loads (section 3.4.1). Theoretically, re-tuning/de-rating of engines to pro-
vide ideal combustion at all loads would reduce BC emissions in line with the reductions in fuel con-
sumption. For example, the 7% reduction in CO2 emissions per container moved (2008 – 2010) presented
by AP Moller Maersk [76] would result in a 7% reduction in BC emissions per container moved. Likewise,
the load reductions shown in the example by Lack and Corbett [10] would provide 20% reductions in BC
emissions. Whether ideal re-tuning and de-rating can be achieved is a question with little data to pro-
vide guidance. Slide valves are also suggested as an essential technology for significant reductions in BC
emissions during slow steaming when re-tuning or de-rating is unavailable [68].
Table 4 Summary of Slow Steaming as an Abatement Option (100% load -> 40% load). (nr: not reported)
Abatement
Measure
CO2 %
LOW|MID|
HIGH
BC %
LOW|MID
|HIGH
NOX SOX Technology
Maturity
Uptake
Time
Remarks Ref.
Slow Steaming:
No De-Rating
7|nr|25 0|nr|-30a N
b Y CM IM Fuel Savings,
increased
travel time
[10,
75,
76,
78]
Slow Steaming:
With De-Rating/
Re-Tuning/slide
valves
8|nr|29 0|nr|30a Y Y CM IN New engine
needed
[10,
62,
72,
76,
78]
aBC reductions based on the load changes presented in the references provided
bNOx emissions remain the same until low engine loads (<20%) where they increase

17
3.5 Fuel Treatments
3.5.1 Colloidal Catalysts
Heavy metals such as cerium and vanadium are known to catalyze the combustion of BC [81]. When in-
troduced into liquid fuels as a colloid, the fuel atomization process is improved leading to improved fuel
consumption and heavy metal particles at the point of BC formation, thus reducing the extent of BC
formation [62, 82]. On land transportation vehicles these colloidal catalysts are often combined with
particulate filters to reduce overall PM emissions [83]. It has been suggested that HFO, having relatively
high concentrations of vanadium, will produce less BC emissions than cleaner fuels, due to this catalytic
effect [84]. Quantitative data on the effectiveness of colloidal heavy metal catalysts independent of
other technologies is scarce, particularly for HFO.
3.5.2 Water-in-Fuel Emulsion (WiFE)
Water-in-fuel emulsions lead to improvements in combustion by improving the atomisation of the fuel
and have shown emissions reductions within the marine and on-road sectors. In the review of Corbett et
al. [65] WiFEs were shown to reduce PM emissions by 42 - 63%, with one study reporting that BC emis-
sions were reduced preferentially over PM (70 - 85% BC reduction compared to 44 – 57% PM reduction)
[65]. Corbett et al. concluded that reductions in BC emission were at least equivalent to PM reductions,
assuming 50% BC reductions. This review also suggested that there was an increase in fuel consumption
of 1.5%. Recent reports from NoNOx LTD. [85] on a variety of combustion engines using diesel suggest
that WiFE leads to reductions in fuel consumption of 7 – 15% when 10% - 17% water is added to the fuel
(by volume). PM reductions of 60 – 90% were also suggested [86]. Alternative WiFE systems show that
emulsions of water (20%) and HFO can reduce PM emissions by 83%, BC emissions (a crude estimate) by
86%, and CO2 reductions by 17% [87]. This CO2 reductions is consistent with the reductions in fuel con-
sumption of 12 – 18% seen for a WiFE trial with a lighter diesel fuel [87]. However, only preliminary
communications of proprietary studies are currently available with little information on other engines
conditions such as the existence of injectors, electronic timing or slide valves3.
Table 5 Summary Fuel Treatments as an Abatement Option (nr: not reported)
Abatement
Measure
CO2 %
LOW|MID|
HIGH
BC %
LOW|MID
|HIGH
NOX SOX Technology
Maturity
Uptake
Time
Remarks Ref.
Colloidal Catalyst 2|nr|10 nr Y Y OS IM [62, 83]
Water-in-Fuel
Emulsion
-1.5|nr|18 50|nr|90 Y Y CF IM [62, 65,
85, 87]
3 These studies were obtained directly from the individuals/companies involved and it is our impression that they would be made available to anyone requesting them.

18
3.6 Fuel Quality – Traditional Fuels
3.6.1 HFO – Distillate
HFO is a fuel used almost exclusively in the marine shipping sector, which contains significantly higher
concentrations of sulphur, aromatic hydrocarbon, and inorganic ash. All of which are know to reduce
fuel combustion efficiency [88] and produce, amongst other emissions, BC. As discussed in section 3.5.1
there is some suggestion that the high levels of vanadium in HFO can catalyze the combustion of BC as it
forms, thus reducing overall BC emissions. However, as mentioned in section 3.5.1 there is no data ena-
bling an assessment of this potential for HFO.
Lack and Corbett [10] reviewed 19 separate comparisons between HFO and higher quality fuels and con-
cluded that this shift would result in BC reductions between 30 and 80%. This assessment is consistent
with a well-established link between fuel quality and BC emissions for on-road diesel engines. The large
range of reported BC reduction introduces added difficulty is assessing this abatement option. In addi-
tion, some of the trials reviewed by Lack and Corbett [10] showed increases in BC emissions when mov-
ing to cleaner fuels, which has been suggested as evidence for the catalytic effect of vanadium [84].
However, inconsistencies in measurement results cast uncertainty on this conclusion. Recent data on
fuel switching trials on a single vessel show variable results with increased BC emissions (30% - 50%) at
low loads for a switch to cleaner fuel, and inconclusive data or decreased BC emissions (35 – 45%) at
high loads for the switch to cleaner fuel (results were reported for both auxiliary and main engines)
[80]. The conclusions of the review of Lack and Corbett [10] and data from other-sector literature do,
however, provide a balance of evidence that a switch from high sulphur residual fuels to low sulphur
distillates, at high loads in particular, will lead to BC reductions. Certainly more research is required
using reliable measurement tools to increase the statistoics on such a conclusion, however, this report
utilises the current evidence to provide its recommendations.
A switch to cleaner distillate fuels also comes with an increase in energy content of 6 – 8% [80, 89],
which will reduce required fuel consumption by the same amount.
Table 6 Fuel Switch as an abatement option (nr: not reported)
Abatement
Measure
CO2 %
LOW|MID
|HIGH
BC %
LOW|MID|
HIGH
NOX SOX Technology
Maturity
Uptake
Time
Remarks Ref.
HFO – Distillate –
energy content
6|nr|8 6|nr|8 Na Y CM IM Fuel cost/
availability
[80,
89]
HFO – Distillate 0 0|45|80 Na Y CM IM Fuel cost/
availability
[10]
aStudies show slight positive and negative changes of NOX emissions when cleaner fuel is used [e.g. 90, 91]

19
3.7 Alternative Fuels
3.7.1 Biodiesel
An extensive review across many transportation sectors of the emissions of biodiesel compared to con-
ventional low sulphur diesel, shows overwhelming evidence for a 50-90% reduction in PM emissions. This
is due to the lower concentrations of aromatic hydrocarbons, higher cetane numbers (combustion quali-
ty) and higher oxygen content in biodiesel [92]. Mixtures of biodiesel and conventional diesel show pro-
gressively decreasing PM emissions as biodiesel content increases [92, 93]. For example, 20% biodiesel
mixtures reduced PM emissions by ~20 -30%, while 100% biodiesel reduced PM emissions by 50-70%. That
review focussed on the emission reductions using low sulphur diesel as a baseline. As emissions from the
combustion of low sulphur diesel predominantly is comprised of BC and organic matter, the quoted PM
reductions are highly probably proxies for BC. Biodiesel contains 8 – 11% less energy than conventional
diesel [90, 92-94] and fuel consumption will therefor increase by this amount. A main driver for biofuels
is the reduction in life cycle carbon (CO2) and it has been suggested that the increased fuel consump-
tion (and CO2 emissions) from biodiesel are significantly offset by the closed carbon cycle of biodiesel
feedstock..
Within the shipping industry a number of biofuel experiments have taken place [90, 94, 95]. Jayaram et
al. [94] showed a 38% reduction in BC using 50% biodiesel/ultra low sulphur diesel mixture, while
Petzold et al. [90] showed BC reductions in the range of 60 – 75% for four different biodiesels compared
to HFO.
The biodiesels used in all of the studies referenced were sourced from vegetable oil (soya, palm, sun-
flower) or animal fats. Biofuels such as methanol, ethanol or dimethyl ether is not considered in this
section, although do form part of the discussion in section 3.7.3.
3.7.2 LNG
Extensive reviews of the effect of LNG on PM emissions within light-duty (passenger cars) and heavy-
duty diesel engines (buses, trucks) suggest that PM emissions are cut by 88 – 99% [96-98]. Because the
majority of PM emissions from ultra-low sulphur diesel (ULSD) fuel are BC, these PM reductions are likely
an effective proxy for BC (see section 2.2). US EPA data suggest that BC emissions are eliminated when
using LNG [57]. No data has been identified on PM or BC emissions from LNG engines used in ships. In
terms of the reduction of the global warming (GW) potential, possible fugitive emissions of methane
during LNG production may counteract an otherwise positive BC effect from LNG.
3.7.3 Methanol – Dimethyl Ether (DME) (Ethanol – Diethyl Ether)
DME is the product of the dehydration of methanol, which has a higher cetane number than methanol
itself. It can be produced from many sources, i.e. coal, biomass and CO2. The use of DME directly as a
fuel in diesel engines, or the onboard dehydration of methanol to form DME, is the subject of significant
research in the assessment of the „well to wheels‟ potential as an alternative to HFO. The SPIRETH pro-
gram [99] is investigating the onboard catalyzed dehydration of methanol or ethanol. Limited data on
this fuel source suggests that a 97% drop in particle number results from the use of dehydrated ethanol
compared to a diesel engine (presumably running ultra-low sulphur diesel) [100]. Particle number reduc-

20
tions by themselves cannot be confidently applied to BC reductions. The SPIRETH report and a report
from Wartsilla [101] suggests that the use of DME produces “no particulate emissions” or “low or no
soot”. On other parameters there appeared to be a 9% reduction in fuel efficiency and a 35% reduction
in NOX emissions, although these were based on one series of measurements [100]. Methanol storage is
reported to have similar storage requirements as LNG [102] while DME can be integrated into LNG fuel
and engine systems [103]. Production of DME from renewable sources or as by-product from other pro-
ductions is also showing promise with net CO2 reductions of 95% when produced from biomass [104].
3.7.4 Nuclear
The use of nuclear ships has occurred in military applications, ice breakers, and coast guard operations
in the Arctic. Nuclear vessels will only have an impact on global emissions when reactor design, ship
design, fuel security and waste disposal issues are considered in addition to the substantial delay in
fleet replacement. BC emissions from this fuel source could be virtually eliminated. This type of alter-
native fuel is not considered in any further detail.
Table 7 Summary of Alternative Fuels as an Abatement Option (nr: not reported)
Abatement
Measure
CO2 %
LOW|MID|HIGH
BC %
LOW|MID|HIGH
NOX SOX Technolo-
gy Maturi-
ty
Up-
take
Time
Remarks Ref.
Biodiesel –
100%
-5|nr|-11 50|nr|75 N Y DE IM Fuel Availabil-
ity
[90, 92,
94, 105]
Biodiesel –
20%
-1|nr|-3 10|nr|30 N Y DE IM Fuel Availabil-
ity
[92-94]
LNG 15|nr|30 88|nr|99 Y Y CF IN Engine/fuel
storage retro-
fit. Port sup-
ply of LNG.
Fugitive emis-
sions.
[62, 96-
98]
Metha-
nol/DME
nr|-9|nr nr|97|100 Y Y DE MT Fuel storage
retrofit and
onboard ca-
talysis units
required
[99,
100]
Nuclear nr|nr|95 nr|nr|95 Y Y NA LT –>
UN
Design, secu-
rity and waste
issues. CO2
and BC emis-
sions from
fuel produc-
tion/disposal

21
3.8 Exhaust Treatment
3.8.1 Electrostatic Precipitators (ESP)
PM is often naturally charged due to rapid airflow around the particle creating static electricity. Elec-
trostatic precipitators (ESP) take advantage of this charge by flowing the exhaust between charged
plates, leading to particle precipitation from the exhaust flow. This technology is commonly used in
large stationary sources such as mines and factories. The method is an attractive option due to high
collection efficiencies and low added energy use, as there only is a minimal pressure drop in the ex-
haust system. Collection efficiencies for PM sized 40 – 700nm can range from 60 – 100% by mass [106-
110]. Trials on small engines, where the volume of exhaust is minimal compared to large ship engines,
show PM reductions of 80 – 90% between 40 and 700nm [110]. Trials on a 4 stroke engine running marine
distillate oil (MDO) show PM reductions of 75 – 85% and BC reductions of 50 – 80% across all engine loads
[106]. Some trials report 100% PM removal at larger sizes (~500nm) and 95% efficiency at smaller sizes
(70nm – the diameters close to atmospheric BC [108]). One trial performed on a 140 kW engine running
on HFO show PM and BC reductions of 60 – 80% across the 40 – 700nm size range [109]. ESPs so far have
had very limited application to large diesel engines.
3.8.2 Diesel Particulate Filter (DPF)
Diesel particulate filtration (DPF) is a technology that has been used extensively for reductions in PM
emissions within the on-road vehicle sector. DPFs use ceramic or metal filters to trap the PM prior to
exhaust emission and periodic cleaning is required. The PM is concentrated in the filter and then com-
busted via active or passive processes and increase. A DPF results in an added fuel consumption of
about 4% [65, 111] due to exhaust flow pressure drops [70]. The combination of ULSD and DPFs are the
basis for “clean diesel” and most DPFs are only effective when combined with clean fuels (e.g. <
500ppm sulphur). At high sulphur levels the filters become ineffective or may actually produce PM [65].
PM reductions from diesel cars, trucks and buses fitted with DPFs range from 70% - 98% [65, 97, 112-
115] and the option can be used on diesel containing biodiesel and water emulsions up to 5% and 10%
respectively [112]. The use of DPFs on ship engines has been limited, however one manufacturer claims
99.9% PM reductions for engines up to 600 kW [116]; the Mitsui O.S.K. Lines have performed a DFP
demonstration on the power generation engine of an ocean going ship using C Heavy Oil (1% S max.) re-
porting 80% PM reductions [117]; and engines up to 6000 kW have been tested with DPFs [65]. Specific
BC controls on ship engines have been reported at 95 – 99.7% [65, 111, 115]. Many reports suggest that
the effectiveness of DPFs is severely reduced as fuel impurities increase, thus making DPF application to
HFO combustion a significant challenge [112, 114].
3.8.3 Diesel Oxidation Catalysts (DOCs)
Diesel oxidation catalysts (DOCs) are commonly used in the on-road transportation sector. The technol-
ogy utilises precious metals on a honeycomb structure, through which the exhaust is passed to oxidize
the exhaust components to less harmful species [118]. PM reductions of 20% - 40% have been reported,
however, this reduction is specific to particulate organic matter and has little effect on BC [118].
22
3.8.4 Selective Catalytic Reduction (SCR)
Selective catalytic reduction (SCR) is an exhaust treatment that reduces NOX concentrations significant-
ly. The technology is applied in the marine sector. There is sparse evidence that BC reductions can oc-
cur with SCR (up to 35%) [138] while other studies show no evidence of PM reductions [119, 120].
3.8.5 Exhaust Gas Recirculation (EGR)
Exaust gas recirculation (EGR) is an exhaust treatment that reduces NOX emissions that, in combination
with an internal scrubber, have an effect on removal of particles (this is assessed section 3.8.6). The
recirculation in itself does not reduce BC and it may in fact increase the build up of soot [121].
3.8.6 Exhaust Gas Scrubbers (EGS)
Exhaust gas scrubbers have been developed for marine engines as an option to reduce exhaust SO2 emis-
sions to IMO limits in emission control areas (ECAs) while still using HFO. Scrubbers can use seawater or
freshwater to scrub the exhaust to remove gas and particle pollutants. Freshwater scrubbers require an
alkaline reactant to effectively remove the acidic sulphur compounds of the exhaust while seawater is
sufficiently alkaline to achieve this removal. Dry exhaust gas scrubbers are also in commercial produc-
tion, and remove SO2 via chemical absorption to calcium hydroxide. Lack and Corbett [10] and Corbett
et al. [65] have reviewed the efficacy of marine exhaust sea water scrubber (SWS) for removal effec-
tiveness of PM and BC. While PM removal rates often exceed 75% it is apparent that PM removal rates
are dependent on particle size and water uptake ability. High sulphur fuels (e.g. HFO) produce hygro-
scopic PM that can associate with BC, and increase the removal of BC to 50 – 75%. Removal of BC in low
sulphur fuel is found to be 20 – 55%. Figure 8 in Lack and Corbett [10] show the BC removal efficiency
for SWS‟s for both high and low sulphur fuels. Dry exhausts gas scrubbers also claim PM removal [122]
with one manufacturer reporting PM removal efficiencies of 98% [123]. It is not known from these re-
ports whether there is an effective removal of BC, although claims that the ultrafine particles are re-
moved effectively have been reported [124]. The further discussion is limited to SWS systems, though it
is assumed that PM removal for seawater and freshwater scrubbers are equivalent.
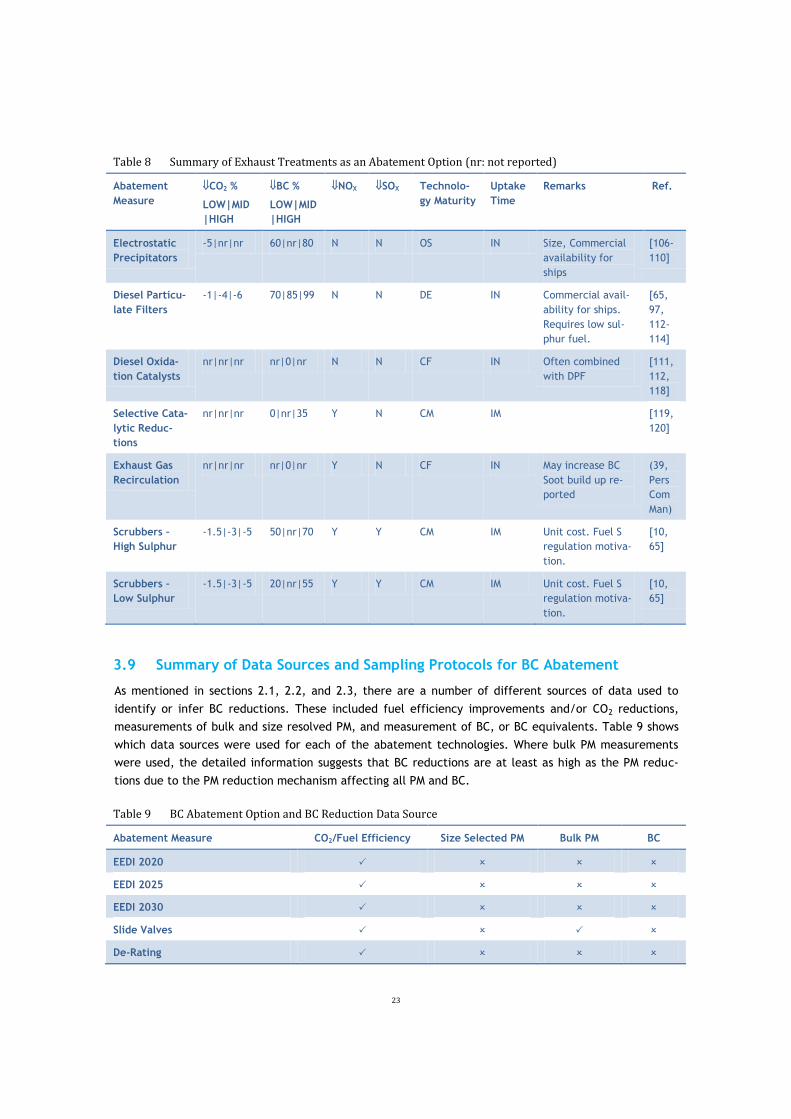
23
Table 8 Summary of Exhaust Treatments as an Abatement Option (nr: not reported)
Abatement
Measure
CO2 %
LOW|MID
|HIGH
BC %
LOW|MID
|HIGH
NOX SOX Technolo-
gy Maturity
Uptake
Time
Remarks Ref.
Electrostatic
Precipitators
-5|nr|nr 60|nr|80 N N OS IN Size, Commercial
availability for
ships
[106-
110]
Diesel Particu-
late Filters
-1|-4|-6 70|85|99 N N DE IN Commercial avail-
ability for ships.
Requires low sul-
phur fuel.
[65,
97,
112-
114]
Diesel Oxida-
tion Catalysts
nr|nr|nr nr|0|nr N N CF IN Often combined
with DPF
[111,
112,
118]
Selective Cata-
lytic Reduc-
tions
nr|nr|nr 0|nr|35 Y N CM IM [119,
120]
Exhaust Gas
Recirculation
nr|nr|nr nr|0|nr Y N CF IN May increase BC
Soot build up re-
ported
(39,
Pers
Com
Man)
Scrubbers –
High Sulphur
-1.5|-3|-5 50|nr|70 Y Y CM IM Unit cost. Fuel S
regulation motiva-
tion.
[10,
65]
Scrubbers –
Low Sulphur
-1.5|-3|-5 20|nr|55 Y Y CM IM Unit cost. Fuel S
regulation motiva-
tion.
[10,
65]
3.9 Summary of Data Sources and Sampling Protocols for BC Abatement
As mentioned in sections 2.1, 2.2, and 2.3, there are a number of different sources of data used to
identify or infer BC reductions. These included fuel efficiency improvements and/or CO2 reductions,
measurements of bulk and size resolved PM, and measurement of BC, or BC equivalents. Table 9 shows
which data sources were used for each of the abatement technologies. Where bulk PM measurements
were used, the detailed information suggests that BC reductions are at least as high as the PM reduc-
tions due to the PM reduction mechanism affecting all PM and BC.
Table 9 BC Abatement Option and BC Reduction Data Source
Abatement Measure CO2/Fuel Efficiency Size Selected PM Bulk PM BC
EEDI 2020
EEDI 2025
EEDI 2030
Slide Valves
De-Rating

24
Abatement Measure CO2/Fuel Efficiency Size Selected PM Bulk PM BC
Slow Steaming – No De-Rating
Slow Steaming – De-Rating
Colloidal Catalyst
Water-in-Fuel Emulsion
HFO – Distillate
Biodiesel – 100%
Biodiesel – 20%
LNG
MeOH/DME
Nuclear
Electrostatic Precipitator
Diesel Particulate Filter
Diesel Oxidation Catalyst
Selective Catalytic Reduction
Exhaust Gas Recirculation
Scrubbers – High Sulphur
Scrubbers – Low Sulphur
Although 100% biodiesel is superior compared to 20% biodiesel, the former option is not considered fea-
sible given limitations in biodiesel supply. Slide valves are already standard on new vessels but is a ret-
rofit option on existing ships.
Where abatement options were assessed via a particle sampling method (e.g. size selected, bulk PM, or
BC measurement the used sampling protocols were noted, see Table 10. Some recent discussions at the
IMO have seen recommendations for the use of a specific ISO protocol to measure ship emissions [41].
The summary presented in Table 10 reveals that the majority of data presented here, whether from
industry reports, peer reviewed literature or elsewhere, contain un-reported information on the instru-
mentation and sampling protocols used. Peer reviewed research often utilized the ISO 8178 protocol
[125], which was not recommended by Norway within IMO correspondence [41]. A number of studies
used atmospheric sampling where dilution is much higher than any sampling protocol used for emissions
testing in a laboratory. Insufficient dilution has been shown to have an effect on emissions measurement
[e.g. 84]. Some other standard engine test cycles were also used. Although a standard protocol such as
ISO 8178 or ISO 9096 would be preferable, the current lack of data on particle emissions from ships ne-
cessitates the judicious use of data from as many sources as possible. The summary presented below
provides context for further discussions on future sampling efforts (i.e. whether a common protocol, or
equivalent alternatives, should be implemented).

25
Table 10 BC Abatement Option and Measurement Details
Reference Abatement
Technology
Measurement Type (PM, BC, Size) Sample Protocol/Method
[66] Slide Valves Unknown (PM) Unknown
[67] Slide Valves Unknown (PM) Unknown
[126] Slide Valves Unknown (PM) Unknown
[127] Slide Valves Unknown (PM, BC) Unknown
[113] DPF Unknown (PM) Unknown
[112] DPF Unknown (PM) Unknown
[114] DPF Unknown (PM) Unknown
[116] DPF Unknown (PM) Unknown
[117] DPF Unknown (PM) Unknown
[111] DPF Smoke Meter (BC) Peer Reviewed
[115] DPF Filter Mass (PM)
TOA* (BC)
Peer Reviewed, ISO 8178-4, Code of
Federal Regulation, Title 40 -80, 86
[65] DPF Unknown (PM) Unknown
[10] Scrubbers TOA (BC), Filter Mass (PM), Size (PM) New EU Driving Cycles, Dilution Tunnel
[65] Scrubbers Size (PM), Mass (PM) Unknown
[123] Scrubber Unknown (PM) Unknown
[106] ESP Filter mass (PM) Unknown
[107] ESP Mass, Number (PM) Unknown
[108] ESP Mass, Size (PM) Unknown, Peer Reviewed
[109] ESP Mass, Size (PM) Unknown, Peer Reviewed
[125] SCR TOA* (BC) ISO 8178
[57] LNG Unknown Unknown
[98] LNG Mass (PM) Unknown, Review Article
[96] LNG Mass (PM) Unknown, CBD and Brawnschweig Test-
ing Cycles
[100] MeOH/DME Number (PM) Unknown
[92] Biodiesel Mass (PM) Unknown, Peer Review Article
[57] Biodiesel Unknown Unknown
[90] Biodiesel Filter Absorption (BC) ISO - 8178
[94] Biodiesel Filter Mass (PM), Size (PM) ISO – 8178-1
[10] HFO Filter, TOA, Filter Absorption, Photo-
acoustic (BC)
ISO – 8178, Atmospheric Dilution, In-
creased Dilution Tests, Unknown
[80] HFO TOA* (BC) ISO-8178
[10, 79, 80] Slow Steaming Filter, TOA, Filter Absorption, Photo-
acoustic (BC)
ISO – 8178, 9096, 10054, 11614, Atmos-
pheric Dilution, Unknown
[85, 128] WiFE Unknown Unknown
[86, 129] WiFE Unknown Unknown
[87] WiFE Smoke Number (BC) Unknown
*TOA: Thermal-Optical Analysis

26
4 Short-List Selection of BC Abatement Options
The long list of BC abatement options was reduced to a selection of the highest-probability technologies
using a set of objective criteria. It is recognized that in addition to the BC abatement potential, there
are other factors that will improve the acceptance of a technology as an abatement option. These in-
clude changes in CO2, NOX, and SOX emissions due to the technology, current commercial availability,
and time to implementation.
Ranking: Criteria for Abatement Potential
BC Abatement: Each 10% reduction (or increase) in BC emissions due to the abatement technology was
assigned 1 (or -1) point. For example, a 30% reduction in BC was assigned 3 points.
CO2 Abatement: Each 10% reduction (or increase) in CO2 emissions due to the abatement technology was
assigned 1 (or -1) point. For example, a 10% increase in CO2 was assigned -1 point.
NOX Abatement: NOX abatement is not a primary consideration for this project. Whether the specific BC
abatement technology changes NOX concentrations will be of secondary importance. If a BC abatement
technology reduces NOX emissions, produces no change or increases NOX emissions, the abatement tech-
nology was assigned 1, 0 or -1 point respectively. This assignment indicates that the NOX abatement is
an order of magnitude less important than BC reduction.
SOX Abatement: SOX abatement is not a primary consideration for this project. Whether the specific BC
abatement technology changes SOX concentrations will be of secondary importance. If a BC abatement
technology reduces, produces no change or increases SOX emissions, the abatement technology was as-
signed 1, 0, or -1 points respectively. This assignment indicates that the SOX abatement is an order of
magnitude less important than BC reduction.
Technology Maturity: The commercial availability of a particular BC abatement technology will have an
impact on the ability for successful uptake. The five technology maturity criteria outlined in section 2.6
are assigned points of 0 through 4, with the most mature technology receiving 4. This indicates that
technology maturity is only approximately 50% of the importance of BC abatement.
Technology Uptake Time: The time required for implementation of the technology will impact the abil-
ity for successful uptake. The uptake time includes the time required for retrofits of current technolo-
gy, newbuilds of ships, or design and commercialization of immature technology. The five technology
uptake criteria outlined in section 2.7 are assigned points of 0 through 4, with the fastest implementa-
tion time receiving 4 points. This indicates that technology maturity is only approximately 50% of the
importance of BC abatement.
This process was carried out for the midranges of abatement potential for BC and other air emissions,
which resulted in the short list of abatement technologies. The process was also carried out for the low
and high ranges for BC abatement potential, i.e., utilizing the LOW|MID|HIGH abatement potentials for
each technology shown in Table 1 - 8 (not shown).

27
A summary of the BC abatement options score chart is presented in Table 11.
Table 11 Ranking of BC abatement options as a weighted points summary including other air emission re-ductions or employing only BC reduction points, technology availablility and implementation
Abatement Measure All
air emissions
Black Carbon
only
EEDI 2020 11 8
EEDI 2025 12 8
EEDI 2030 16 9
Slide Valves 12.5 10.5
De-Rating 9.5 7.3
Slow Steaming – No De-Rating 0 0
Slow Steaming – De-Rating 12.4 8.5
Colloidal Catalyst 0 0
WiFE 17 15
HFO – Distillate 14.9 13.2
Biodiesel – 100% 10.5 11.3
Biodiesel – 20% 6.8 7
LNG 20.6 16.4
Nuclear 0 0
Electrostatic Precipitator 9.8 10
Diesel Particulate Filter 13.1 13.5
Diesel Oxidation Catalyst 0 0
Selective Catalytic Reduction 0 0
Scrubbers – High Sulphur 15.7 14
Scrubbers – Low Sulphur 13.5 11.8
The rankings of abatement technologies when considering BC compared to all air emissions are only
slightly different when omitting EEDI, as it is not feasible as a retrofit option. The result is mainly af-
fected by how high 100% biodiesel and electrostatic precipitators are on the top 10 list (see ranking be-
low). The objective was to identify six technologies for consideration for feasibility and costing, and the
consolidated list does not include 100% biodiesel, electrostatic precipitators and scrubbers for low-
sulphur applications. Since slow steaming is voluntarily employed in the industry, this technology was
included whereas slide valves were not, although the latter forms part of the WiFE technology.

28
Table 12 The top 10 abatement technologies ranked by including all air emission parameters or only Black Carbon. Final column shows the consolidated list of six abatement technologies
All air emission parameters Black Carbon only Consolidated list
1. LNG 2. Water-in-Fuel Emulsion 3. Scrubbers – High Sulphur 4. HFO – Distillate 5. Scrubbers – Low Sulphur 6. Diesel Particulate Filter 7. Slide Valves 8. Slow Steaming – De-Rating
9. Biodiesel – 100% 10. Electrostatic Precipitator
1. LNG 2. Water-in-Fuel Emulsion 3. Scrubbers – High Sulphur 4. Diesel Particulate Filter 5. HFO – Distillate 6. Scrubbers – Low Sulphur 7. Biodiesel – 100% 8. Slide Valves 9. Electrostatic Precipitator 10. Slow Steaming – De-Rating
1. LNG 2. Water-in-Fuel Emulsion 3. Scrubbers 4. Diesel Particulate Filter 5. HFO – Distillate 6. Slow Steaming – De-Rating
The top six abatement technologies from the midrange abatement potential are presented in full in Ta-
ble 13. These abatement technologies are evaluated for BC abatement costs in section 5.
Table 13 Summary of the six technologies for the short-list BC abatement option
Abatement
Measure
CO2 % BC % NOX SOX Technology
Maturity
Uptake
Time
Remarks Ref.
EEDI* 30 30 Yes Yes n/a LT Required due to
regulation; New-
builds, >400 tonnes
[36]
Slow Steam-
ing:
With De-Rating
18.5 15 Yes Yes CM IN New engine needed [10, 62,
72, 76,
78]
Water-in-Fuel
Emulsion
0 70 Yes Yes CF IM [62, 65,
85, 87]
HFO – Distil-
late
7 52 No Yes CM IM Fuel cost/
availability
[10]
LNG 22.5 93.5 Yes Yes CF IN Engine/fuel storage
retrofit; Port sup-
ply of LNG; Fugi-
tive emissions.
[62, 96-
98]
Diesel Particu-
late Filters
-3.5 85** No No D IN Commercial availa-
bility for ships;
Requires low sul-
phur fuel.
[65, 97,
112-
114]
Scrubbers –
High Sulphur
-3 60 Yes Yes CM IM Unit cost: Fuel S
regulation motiva-
tion.
[10, 65]
* The EEDI is not included in the BC abatement cost assessment; ** The 85% is a mid-range between the minimum and max-
imum reductions reported for LSFO. It happens to also correspond to the reductions reported for the HFO trial, however this
is coincidental.
29
5 Cost and Feasibility of BC Abatement Technologies
The full technical and cost-analysis report is included in Appendix E, which evaluates the cost effective-
ness of the short list of identified market-available BC abatement measures. A detailed summary of the
report is provided in this section. The base example is a tanker (Aframax), for which both retrofit and
newbuilding installation are provided.
For comparison, the installation costs on a range of ship types - tanker, container, bulker carrier, gas
carrier, passenger ship, offshore supply vessel (OSV)/anchor handling tug supply (AHTS) and tug- are
provided for vessels with similar engine size (10 MW) and vessels of approximately the same physical
size vessel, i.e. with comparable docking costs (tugs and OSV)/AHTS excluded). The data is given in de-
tail in the Appendix E.
5.1 Abatement Technology Case by Case
The selected abatement measures are applied to the base case, Aframax Tanker, as listed in Appendix
E, where the calculated capital investment cost and application to seven vessels are summarized. Of the
selected vessels, five are of similar tonnage but with very different power requirements due to applica-
tion and speed requirements. Two vessels are smaller. The procedure to estimate the cost for each
abatement measure was to utilise quotes from manufacturers, where it was concluded that there is a
linear relationship between the price of the equipment and the power of the main engine, except for
the EEDI, which is dependent on other parameters as well. Estimated uncertainty in these estimates is
10-20%. The quotes were converted to a U.S. dollar cost per kilowatt hour (USD/kW) and used to scale
to the relevant vessel.
The capital investment of the abatement measures is approximately 80-90% of the total retrofitting
cost, which minimizes the costs associated with installation location (labour etc.). Some of the retrofit-
ting cases were estimated to take up to 40 days, and so the charter rates of each vessel type for this
lost time were also taken into consideration. Reduced costs are obviously associated with the installa-
tion of the abatement measures at the vessel newbuild stage, and the reduction potential in capital
expenditure (CAPEX) is between 40-60% depending on off-hire rates and installation time. During the
vessel design phase for a newbuild, many of the smaller modifications to the standard design can be
absorbed into the contract price. The cost difference between newbuilding and retrofitting is illustrated
in Appendix E. The CAPEX calculations are based on the installed shaft power of the vessel at 100% MCR.
Consideration for the additional operating costs per day has also been taken into account. The addition-
al operating costs per day are chosen due to the fact that each abatement measure has a varying degree
of energy requirement, which is dependent on the abatement measure (Appendix E). The abatement
measures do not require additional crew competencies except for LNG installation, where an estimated
10% additional crewing cost is required, due to the complexity and safety requirements of the systems.
The reason for not including the vessels‟ individual operating expenditure (OPEX) is simply that the dif-
ferent vessels, owners and managers use different nationalities of crew, which could influence the OPEX
considerably. Crewing costs are often approximately 50% of the total OPEX of a vessel, depending on the
complexity and flag of registration. The OPEX calculations are based on 90% MCR.

30
5.2 Slow Steaming – With De-Rating
Slow steaming became popular within the shipping industry at the end of 2007, mainly with container
vessel owners and operators, as a consequence of drastically dropping charter rates at the beginning of
the global financial downturn. Vessels were instructed by owners to reduce main engine load to approx-
imately 40% MCR, which decreased the speed by approximately 20%. Summarized calculations of an av-
erage fuel oil cost (FOC) savings of approximately 42% without a de-rated engine and 45% with a de-
rated motor are shown in Table 14 below.
Table 14 Slow steaming (40% MCR) without and with de-rated engine
Shaft
power
(kW)
Speed
(knots)
Distance
(nautical miles)
Time
(hours)
Total fuel
consump-
tion (ton)
Fuel oil
savings (%)
90% MCR (kW) 14,256 15.0 10,000 667 1,730 0%
40% MCR (kW) without de-rating 6,336 11.4 10,000 877 1,012 42%
40% MCR (kW) with de-rating 6,336 11.4 10,000 877 951 45%
From January 2010, owners started to investigate super-slow steaming down to below 35% MCR and as
low as 10% MCR. Engine makers were initially hesitant due to the lack of experience, but in June 2011
MAN Diesel issued a service letter (SL11-544 MTS) permitting owners to reduce engine load down to 10%
MCR, though with certain recommendations. Several problems may arise from low load operation e.g.
loss of main engine turbocharger and propeller efficiency, hull fouling, and economizer soot build up.
Electronic engines (ME, ME-B and RT-FLEX) are more flexible for slow steaming, therefore it is recom-
mended to convert all mechanical injection main engines to electronically controlled engines.
In the 2012 Danish initiative Green Ship Of The Future in Copenhagen, MAN Diesel presented a vessel
emissions study [130], in which the conversion cost of the MT Nord Butterfly from an MC engine (me-
chanical injection) to an ME-B engine (electro hydraulic, common rail injection) was estimated. The
conversion was from a 6S50MC-C (9,480 kW) motor to a 6S50ME-B motor with the same effective power.
With our experience from MAN Diesel retrofits it is possible to calculate a cost per kW to scale the
CAPEX to the specific vessels (See Appendix E). If a vessel already has an electronic engine installed, the
CAPEX will be reduced approximately 45-50%.
Table 15 Green Ship of the Future: Vessel Emission Study (Copenhagen 2012) [130]
Amount Unit
NORD Butterfly ME-B Conversion 9,480 kW
CAPEX 800,000 USD
Cost for ME-B conversion 84 USD/kW

31
5.3 Water-in-Fuel Emulsion (WiFE)
In water-in-fuel emulisions (WiFE), water is added continuously to the fuel supply and a homogeneous
mixture is achieved by mechanical measures. When WiFE is used it can be observed that the specific
fuel oil consumption (SFOC) generally increases for the larger additions of water. This is due to the en-
ergy required to heat up the injected water to its saturation temperature, subsequent evaporation at
the saturation temperature, and further super-heating to the temperature in the combustion zone. In
previous work, the SFOC penalty at 30% vol. added water is estimated to be approximately 2% when
considering evaporation and super heating only. It should be noted that the water may contribute with
work in the expansion process, thereby reducing the actual SFOC penalty, and that little is known about
to the corrosive effects from the water on the fuel system and other machinery related to the fuel sys-
tem [137].
To retrofit a WiFE system to a standard engine, the following components need to be installed or re-
placed:
A homogenizer unit, which heats the water and mixes it with fuel to form an emulsion pri-
or to injection, is to be installed. CAPEX is estimated to USD 400,000 excluding retrofitting
costs on a 40,000 kW engine [131]. To this a 20% price increase from 2006 to 2012 is as-
sumed based on 3.5% inflation per year, which gives an USD/kW estimate of approximately
USD 13/kW. If retrofitting costs are included, but excluding off-hire, the average cost is
USD 27/kW. On the Aframax Tanker base case a retrofit time of 20 days with an off-hire
rate of USD 20,000/day is assumed, which increases the cost to USD 52/kW.
A possible increase in freshwater (FW) storage capacity onboard, as a standard FW genera-
tor cannot keep up with the FW consumption of the WiFE system. Thus, additional FW is to
be stored onboard. FW consumption is dependent on power requirement and not ship size.
A large, slow-steaming Aframax tanker will consume considerably less FW compared to a
container vessel of the same size sailing at full speed. Average FW generation onboard a
commercial cargo vessel is 25MT/day. The cost of FW water depends on many variables -
trading routes, FW generation onboard and FW consumption on board (apart from WiFE).
As this cost also has little influence on the CAPEX or OPEX, it is therefore not included in
the calcalculations.
Replacement of the standard fuel valve (fuel injector) with slide fuel valves is needed due
to the more efficient atomization of the fuel and to optimise the combustion. The cost of
the new slide fuel valves is included in the total cost as per Table 16.
Table 16 MAN Diesel: WiFE cost overview [132]
Amount Unit
Engine power 40,000 kW
Total WiFE unit cost and slide fuel valves 500,000 USD
Cost per kW (excl. retrofit) 13 USD/kW
Cost per kW (incl. retrofit, excl. off-hire) 27 USD/kW
Cost per kW (incl. retrofit and off-hire) 52 USD/kW

32
5.4 Heavy Fuel Oil (HFO) – Distillate
A fuel switch to destilate fuel from heavy fuel oil is a simple alternative to achieve compliance with
current and forthcoming IMO emissions regulations on maximum allowable sulphur content in the fuel
oil. There are two main challenges when running on distillate fuels, e.g. MGO: fuel viscosity and main
engine cylinder lubrication [133].
The fuel systems for engines, boilers and other machinery required to comply with IMO
regulations are recommended to have a cooler or chiller arrangement fitted, to meet the
fuel viscosity requirements for safe operation of the engine‟s fuel system. Vessels in the
future will probably not experience problems running without a chiller due to the fact that
engine and pump makers are designing their equipment to run on the lower viscosity fuels,
but it is not recommended due to the increased wear on fuel systems. Cooling of the MGO
is a not a straightforward solution, since several parameters should be considered before
deciding the appropriate method of cooling, e.g., SFOC, duration of time using MGO,
pumps and engine fuel system specification, and age.
There is a correlation between low-sulphur fuels and BN or TBN (Base Number). Thus,
when low-sulphur fuels with <1% sulphur are used, the cylinder lubrication rate is lowered
to the minimum dosage recommended by engine makers (when using an oil for HFO (e.g.,
BN70)). In this configuration the cylinder liner would be overadditivated. Therefore, en-
gine makers recommend changing to low BN cylinder lube oils of BN 40-50 when fuels be-
low 1% sulphur are used for prolonged periods of time. Automatic cylinder feed rate regu-
lating systems, e.g., the Alfa Lubricator, are recommended on newer engines in order to
regulate the dosage automatically during different engine loads [133].
A chiller unit costs approximately USD 70,000 for the Aframax Tanker base case, which represents a USD
4/kW exclusive installation cost. The calculated cost inclusive installation is USD 13/kW; however, that
does not include the expected 10 off-hire days. This chiller unit price could vary, depending on which
system and maker are chosen.
Table 17 MGO chiller unit cost
Amount Unit
MGO chiller unit cost (excl. inst.) 70,000 USD
MGO chiller cost (excl. inst.) 4 USD/kW
MGO chiller cost (incl. inst.) 13 USD/kW
5.5 LNG/DME
Liquefied natural gas (LNG) is natural gas stored as liquid at -162°C. The predominant component is
methane with some ethane and small amounts of heavy hydrocarbons. LNG as a fuel for marine propul-
sion and power generation has been common with 4-stroke engines as a dual fuel system for LNG tank-
ers. In a dual fuel system, boil-off gas is used as fuel on loaded voyages and HFO on the ballasted voy-
age. Two-stroke LNG-powered engines have been in operation only as land-based, stationary engines for
power generation running at a constant load. In contrast, marine engines have variable loads and re-
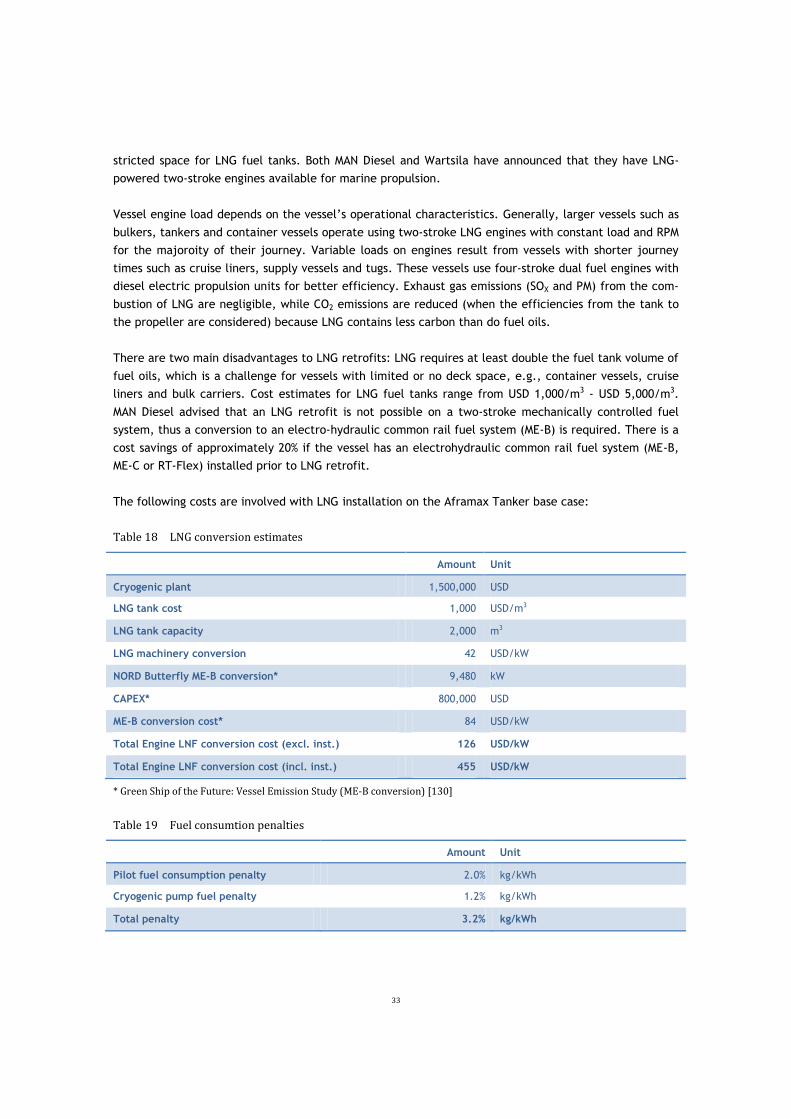
33
stricted space for LNG fuel tanks. Both MAN Diesel and Wartsila have announced that they have LNG-
powered two-stroke engines available for marine propulsion.
Vessel engine load depends on the vessel‟s operational characteristics. Generally, larger vessels such as
bulkers, tankers and container vessels operate using two-stroke LNG engines with constant load and RPM
for the majoroity of their journey. Variable loads on engines result from vessels with shorter journey
times such as cruise liners, supply vessels and tugs. These vessels use four-stroke dual fuel engines with
diesel electric propulsion units for better efficiency. Exhaust gas emissions (SOX and PM) from the com-
bustion of LNG are negligible, while CO2 emissions are reduced (when the efficiencies from the tank to
the propeller are considered) because LNG contains less carbon than do fuel oils.
There are two main disadvantages to LNG retrofits: LNG requires at least double the fuel tank volume of
fuel oils, which is a challenge for vessels with limited or no deck space, e.g., container vessels, cruise
liners and bulk carriers. Cost estimates for LNG fuel tanks range from USD 1,000/m3 - USD 5,000/m3.
MAN Diesel advised that an LNG retrofit is not possible on a two-stroke mechanically controlled fuel
system, thus a conversion to an electro-hydraulic common rail fuel system (ME-B) is required. There is a
cost savings of approximately 20% if the vessel has an electrohydraulic common rail fuel system (ME-B,
ME-C or RT-Flex) installed prior to LNG retrofit.
The following costs are involved with LNG installation on the Aframax Tanker base case:
Table 18 LNG conversion estimates
Amount Unit
Cryogenic plant 1,500,000 USD
LNG tank cost 1,000 USD/m3
LNG tank capacity 2,000 m3
LNG machinery conversion 42 USD/kW
NORD Butterfly ME-B conversion* 9,480 kW
CAPEX* 800,000 USD
ME-B conversion cost* 84 USD/kW
Total Engine LNF conversion cost (excl. inst.) 126 USD/kW
Total Engine LNF conversion cost (incl. inst.) 455 USD/kW
* Green Ship of the Future: Vessel Emission Study (ME-B conversion) [130]
Table 19 Fuel consumtion penalties
Amount Unit
Pilot fuel consumption penalty 2.0% kg/kWh
Cryogenic pump fuel penalty 1.2% kg/kWh
Total penalty 3.2% kg/kWh

34
5.6 Diesel Particulate Filters (DPF)
The diesel particulate filter (DPF) system is comprised of silicon carbide ceramic fibers and a self-
cleaning mechanism. The filter collects particulate matter (PM) as exhaust gas is forced through it and
is very efficient at the removal of PM and BC. The self-cleaning element automatically combusts and
eliminates PM buildup in the filter. This allows for continual operation without clogging the filter and
requires no maintenance by seafarers. The use of particle filters in inland waterway vessels and highway
trucks has been very successful.
The Japanese shipping line MOL started preliminary tests of a diesel particulate filter on a two-stroke
engine in 2010. A demonstation test was initiated in November 2011 [134] and in February 2012 the DPF
system had operated smoothly for more than 500 hours. With research support from the Japanese Classi-
fication Society (ClassNK), they have jointly developed a DPF system for marine diesel engines, which
run on C heavy oil.
The MOL test is scheduled for about one year (operating time about 4,000 hours) to verify the system‟s
PM collection performance. After that its durability will be assessed. The additional energy penalty due
to exhaust back pressure is estimated to be approximately 0.4% of shaft power [135]. The space re-
quirements of these filters (2-3 times engine volume) [135] introduce considerable cost.
A paper by Eelco den Boer, “Emissions from the Legacy Fleet” [135], estimates the installation cost of
DPF on inland waterway vessels. The estimated CAPEX cost was reported to be EUR 50/kW ≈ USD 63/kW
and the CAPEX including installation costs for a typical retrofit case to EUR be 110/kW ≈ USD 139/kW
(EUR to USD exchange rate ≈ 1.26).
Table 20 Cost of DPF
Amount Unit
CAPEX DPF (excl. inst.) 63 USD/kW
CAPEX DPF (incl. inst.) 139 USD/kW
5.7 Scrubbers – High Sulphur
Trials of exhaust gas scrubbers have been conducted since 2006, and the system selected for this analy-
sis has an open loop (seawater mode) system and a closed loop (internal freshwater mode) system. In a
closed loop, freshwater is recycled, into which sodium hydroxide (NaOH) is continuously added in order
to balance pH to a slightly alkaline value (required for optimal scrubbing operation). The closed loop is
used for special areas or coastal waters where discharge water is restricted.
Scrubber consumables would result in FW mode. NaOH can be supplied as a 50% solution by tanker
trucks at most major ports around the world as it is used in many industries to produce paper, soap,
detergents etc. The vessel can also be supplied with large 5m3 IBC containers with heat insulation due
to volitaility from temperature change. NaOH flakes or pellets can also be supplied, in which case the
crew will have to manually blend the dry product with water onboard.

35
The average costs of the equipment, Table 20, in USD/kW can be used to scale the price of the equip-
ment linearly according to the power requirement for the specific vessel, as found in Appendix E. A typ-
ical newbuilding cost would be USD 330/kW, excluding off-hire and drydocking, and for a retrofit case
USD 368/kW, including off-hire and drydocking.
Table 21 Scrubber cost
Amount Unit
Scrubber cost (excl. offhire and drydocking) 330 USD/kW
Scrubber cost (Incl. offhire and drydocking) 368 USD/kW
Table 22 RETROFIT: CAPEX in USD of retrofitting vessels of different type and engine size, but comparable
physical dimensions to provide similar drydock costs. Shaft power is given in kW @100% MCR.
EEDI (De-Rating)
De-Rating
Emulsion LNG HFO-distillate
DPF Scrubber
1 Aframax 16,000 2,210,000 2,210,000 810,000 8,080,000 410,000 1,410,000 5,880,000
2 Container 85,000 9,730,000 9,730,000 2,970,000 45,630,000 1,500,000 6,160,000 29,240,000
3 Bulk Carrier 15,000 2,050,000 2,050,000 740,000 8,490,000 370,000 1,310,000 5,490,000
4 Gas 22,000 3,110,000 3,110,000 1,160,000 12,600,000 580,000 1,990,000 8,160,000
5 Passenger 75,000 9,330,000 9,330,000 3,120,000 41,250,000 1,570,000 5,930,000 26,540,000
6 OSV/AHTS 16,000 2,660,000 2,660,000 1,110,000 9,690,000 560,000 1,710,000 6,330,000
7 Tug 6,100 910,000 910,000 360,000 3,560,000 180,000 580,000 2,310,000
Table 23 NEWBUILD: CAPEX in USD of retrofitting vessels of different type and engine size, but comparable
physical dimensions to provide similar drydock costs. Shaft power is given in kW @100% MCR
EEDI (De-Rating)
De-Rating Emulsion LNG HFO-distillate
DPF Scrubber
1 Aframax 16,000 1,610,000 1,610,000 410,000 7,280,000 210,000 1,010,000 5,280,000
2 Container 85,000 8,530,000 8,530,000 2,170,000 44,030,000 1,100,000 5,360,000 28,040,000
3 Bulk Carrier 15,000 1,510,000 1,510,000 380,000 7,770,000 190,000 950,000 4,950,000
4 Gas 22,000 2,210,000 2,210,000 560,000 11,400,000 280,000 1,390,000 7,260,000
5 Passenger 75,000 7,530,000 7,530,000 1,920,000 38,850,000 970,000 4,730,000 24,740,000
6 OSV/AHTS 16,000 1,610,000 1,610,000 410,000 8,290,000 210,000 1,010,000 5,280,000
7 Tug 6,100 610,000 610,000 160,000 3,160,000 80,000 380,000 2,010,000

36
6 Comparison of Abatement Technologies
6.1 Introduction to Assessments
In this section the effectiveness of the abatement technologies is assessed through their costs both on a
generic level and on a ship-type level, the latter exemplified with the Aframax example in section five.
The overall effectiveness of an abatement is calculated as the cost associated with a reduction in BC
emissions compared to the base case using MDO as fuel. However, the final assessment of the abate-
ment technologies also considers factors such as those mentioned in section 3 and 4, in particular the
technological maturity, the technology‟s co-reduction with other regulated air pollutants and the ap-
plicability in the Arctic.
The Aframax Ship Type Example
Comparing the different methodologies regarding the costs relative to the benefits is the objective of
this section. The costs and benefits, the latter measured as reduced amount of BC, are compared using
the Aframax Tanker base case as an example, but the calculation is carried out for other ship types as
well, including container, bulk carrier, gas carrier, passenger, offshore supply vessels/anchor handling
tug supply vessels, and tugs. The calculations for all included ship types are provided in appendix C.
The data are provided in 2012 costs in USD similarly to section 5, but include depreciation and interest
rate, remaining lifetime and a given number of operating days per year.
Table 24 Basic assumptions for cost-benefit assessment
Operating days per year 260
Interest rate 6%
Lifetime year
Retrofit 10
Newbuilding 30
As mentioned earlier, the base case is a comparison to MDO, since a BC regulation is not expected to be
introduced prior to the sulphur regulation in 2020, and no assumptions are made regarding geographical,
ship type or timely limitations.
Cost-Effctiveness of the Technologies
The cost-effetiveness has been calculated according to the method of Corbett et al. [65] using the same
input data as given in section 5 and these results are presented in appendix B. In the model time spent
in ECAs or special areas can be modelled. The costs are presented for an all year operation in such areas
(6,240 hours).

37
Table 25 Input parameters for cost-effectiveness after Corbett et al. [65]
Input parameter ranges
Low Medium High
∧ = Average engine load fraction 0.72 - - -
Total annual operating hours [h] 6,240 - - -
Interest rate - 4% 7% 10%
BC emissions rate [g/kWh] - 0.03 0.07 0.17
Time with system engaged [%] - 100% 100% 100%
Φ = engine power [kW] - 5,500 10,000 49,504
Fuel prices: -
MDO [USD/ton] - 973 1,041 1,095
HFO [USD/ton] - 642 659.8 671
LNG [USD/mmBtu] - 10 10 10
6.2 Comparisons of Technologies
6.2.1 Yearly Reduction Potential for Abatement Technologies
Base Case MDO
The percentage of reductions of BC as estimated in section 3 were recalculated to mass, assuming the
base fuel to be MDO.
Table 26 (overleaf) shows the calculated reduction of BC by the short-listed abatement technologies.
The emission reduction rates were calculated from percentage reduction as given in Table 13 and with
0.07 g BC/kWh as the base case.

0
0
Table 26 Assessment of reduction of BC through abatement technologies in example vessel (14.4 MW)
No abatement (using MDO
and assuming EEDI)
Slow Steaming and De-Rating WiFE LNG
Low Best High Low Best High Low Best High Low Best High
Reduction [%] 0 0 0 20 50 80 0 30.56 58.33 80 93.5 100
BC Emission rate [g/kWh] 0.07 0.07 0.07 0.056 0.035 0.014 0.07 0.049 0.029 0.014 0.005 0.00
BC Reduction rate [g/kWh] 0 0 0 0.014 0.035 0.056 0 0.021 0.041 0.056 0.065 0.07
Annual BC Emissions [g/y] 3.14E+06 3.14E+06 3.14E+06 2.52E+06 1.57E+06 6.29E+05 3.14E+06 1.52E+06 9.10E+05 6.29E+05 2.04E+05 0.00E+00
DPF SWS FWS
Low Best High Low Best High Low Best High
Reduction [%] 70 85 90 25 40 50 25 40 50
BC Emission rate [g/kWh] 0.021 0.011 0.007 0.053
0.042
0.035
0.053
0.042
0.035
BC Reduction rate [g/kWh] 0.049 0.059 0.063 0.017
0.028
0.035
0.017
0.028
0.035
Annual BC Emissions [g/y] 9.43E+05 4.72E+05 3.14E+05 2.36E+06 1.89E+06 1.57E+06 2.36E+06 1.89E+06 1.57E+06
38

39
1
1
6.3 Cost of Reducing BC in Example Vessels
The price for reducing BC with the different abatement technologies is assessed through the BC
reduction potential as provided in section 4 and the costs found in section 5. The cost in USD per
reduced gram of BC was calculated including CAPEX and OPEX in a standard scenario for the Aframax
Tanker example, where an existing vessel has 10 years of remaining trading life and a new vessel has 30
years (for other details see Appendix E).
6.3.1 Aframax Tanker 14.4 MW
The estimate for the reduction of BC is shown for the example case (14.4 MW Aframax Tanker as in
section five), with the column showing the reduction based on the best estimate and the bars showing
upper and lower ranges of estimates. In absolute amounts, the largest reductions are achieved by
moving from HFO or MGO to LNG, or by introducing DPF, since both technologies yield >90% reductions
in BC (bearing in mind the lack of experience with DPF in international shipping). The remaining
technologies provide 30-50% reductions, although the data sets are not strong regarding BC and
considerable ranges are seen between high and low estimates, except for the scrubber data.
A. Reduced BC
per year (g)
B. Cost
estimates for
the
technologies
(USD/year)
0
1,000,000
2,000,000
3,000,000
4,000,000
5,000,000
6,000,000
7,000,000
30 vol.%H20
20 vol.%H20
MGO HFO SW modeFW mode
SSDR WiFE LNG DPF Scrubber
Reduction per year (g) AFRAMAX
-15,000,000
-10,000,000
-5,000,000
0
5,000,000
10,000,000
15,000,000
20,000,000
30 vol.%H20
20 vol.%H20
MGO HFO SW modeFW mode
SSDR WiFE LNG DPF Scrubber
USD per year Equivalent annual cost
AFRAMAX
Retrofit New Building

2
C. Cost per
reduced BC
(USD/g BC)
Figure 2 A-C The amount of BC reduced, the cost and the estimated cost-effectiveness of the abatement
technologies in the example vessel. The cost assessment is given for Retrofit (blue) and Newbuilding (red)
Fuel Switch from HFO
The case where a fuel switch from HFO to distillate is introduced in the base case and the reductions
are calculated from a base emission of 1.34 g BC/kWh [138].
Table 27 BC reduction with fuel switch from HFO
HFO Low sulphur distillate
Low Medium High
Reduction [%] 30 50 80
BC Emission rate [g/kWh] 1.34 1.34 1.34
BC Reduction rate [g/kWh] 0.40 0.67 1.07
Annual BC Emission [g/year] 8.45E+07 6.02E+07 2.43E+07
The cost-efficiency is relatively high, as the estimated cost is approximately USD 0.08 per g reduced BC.
6.3.2 Comparison over Range of Ship Types with 10 MW Installed Effect
Since the governing factors associated with abatement technology installation and operating costs are
related to the installed effect, the overall pattern remains more or less the same across ship types, but
nevertheless there are differences mainly related to the installation and off-hire costs for the vessel
type.
-8.00
-6.00
-4.00
-2.00
0.00
2.00
4.00
6.00
8.00
30 vol.%H20
20 vol.%H20
MGO HFO SW mode FW mode
SSDR WiFE LNG DPF Scrubber
Cost per reduction USD per g
AFRAMAX
Retrofit New Building
40
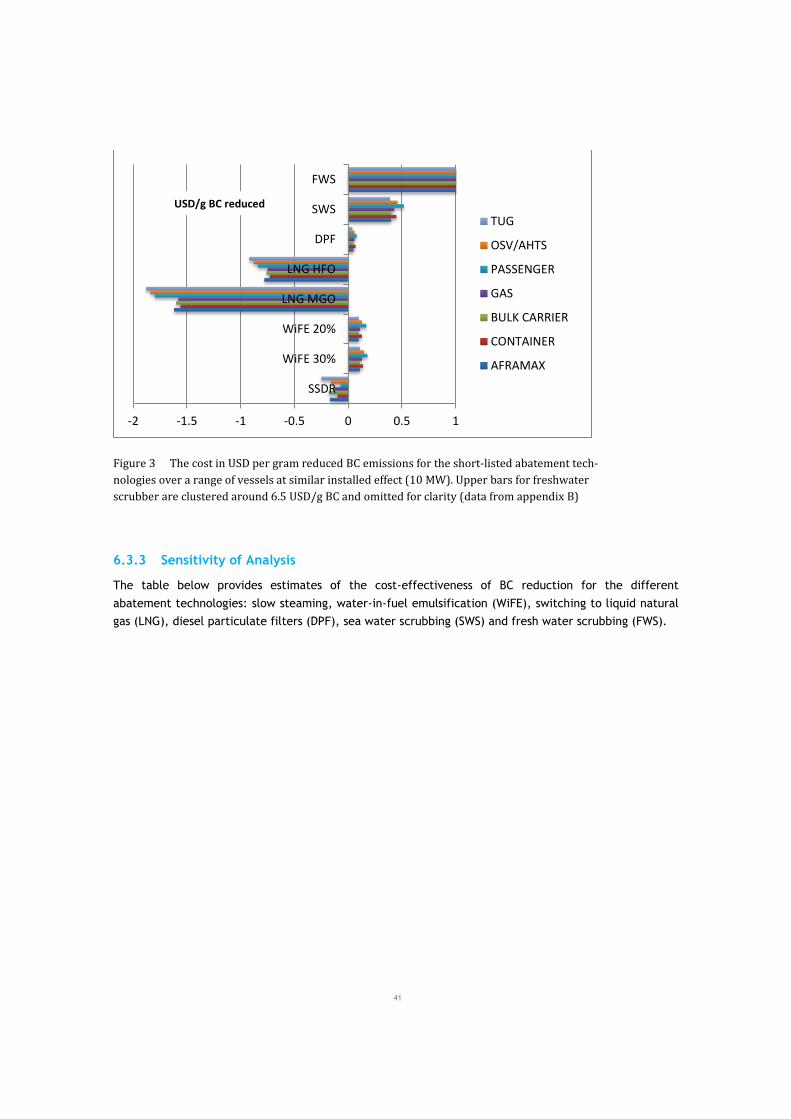
3
Figure 3 The cost in USD per gram reduced BC emissions for the short-listed abatement tech-
nologies over a range of vessels at similar installed effect (10 MW). Upper bars for freshwater
scrubber are clustered around 6.5 USD/g BC and omitted for clarity (data from appendix B)
6.3.3 Sensitivity of Analysis
The table below provides estimates of the cost-effectiveness of BC reduction for the different
abatement technologies: slow steaming, water-in-fuel emulsification (WiFE), switching to liquid natural
gas (LNG), diesel particulate filters (DPF), sea water scrubbing (SWS) and fresh water scrubbing (FWS).
-2 -1.5 -1 -0.5 0 0.5 1
SSDR
WiFE 30%
WiFE 20%
LNG MGO
LNG HFO
DPF
SWS
FWS
TUG
OSV/AHTS
PASSENGER
GAS
BULK CARRIER
CONTAINER
AFRAMAX
USD/g BC reduced
41

4
Table 28 Cost-effectiveness (USD/g BC reduced) in select combinations of the cost of fuel and the interest
rate scenarios in High, Medium and Low. Thus, for example, high fuel cost and medium interest rate will be
HFC-MIR. Numerical values of MDO costs are the lowest, currrent and highest MDO prices since March 2009,
and the annual interest rates are 4%, 7% and 10%, respectively. All estimates are made for an engine power of
10,000 kW, total annual operating hours of 6,240, use of marine diesel oil (MDO) and an average engine load
fraction of 0.72.
Cost-
effectiveness
(USD/g BC re-
duced)
Base case
MFC-MIR
MFC-HIR MFC-LIR LFC-MIR HFC-MIR
Slow steaming -2.62 -2.60 -2.65 -0.76 -3.16
WiFE 0.07 0.08 0.06 0.05 0.07
LNG -1.73 -1.7 -1.76 0.26 -2.31
DPF 0.21 0.21 0.21 0.12 0.23
SWS 0.31 0.35 0.28 0.24 0.33
FWS 8.92 8.95 8.89 8.76 8.96
The first observation is that the ranking of the methods in terms of USD/g BC reduced does not change
regardless of the cost of fuel and the range of interest rates - except for LNG when MDO fuel price is
low and the advantage of the fuel switch to LNG is less pronounced.
Figure 4 Total costs of the different abatement technologies using the best estimate MDO price of USD
1,011.8 USD/ton, the lowest MDO price of UDS 320/ton and the highest MDO price of USD 1,213/ton.
-8
-6
-4
-2
0
2
4
6
8
10
12
14
Slowsteaming
WiFE LNG DPF SWS FWS
Mil
lio
n U
SD
Abatement technology
Low
Best
High
42
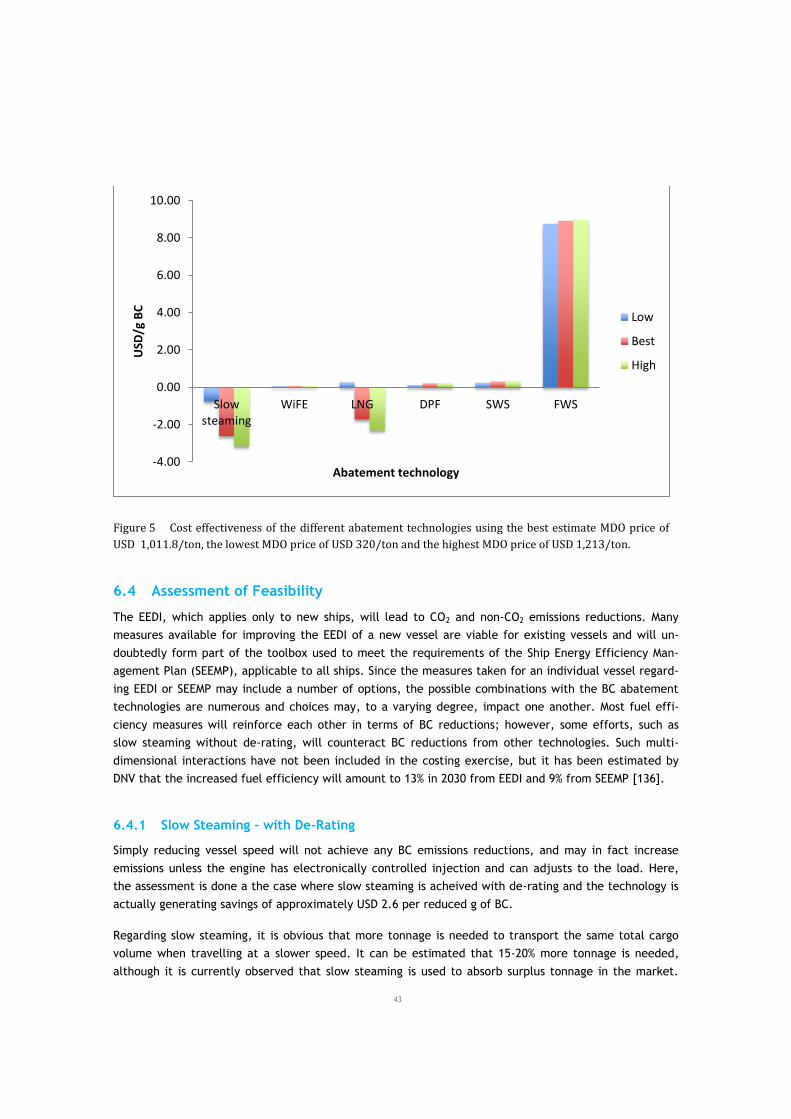
5
Figure 5 Cost effectiveness of the different abatement technologies using the best estimate MDO price of
USD 1,011.8/ton, the lowest MDO price of USD 320/ton and the highest MDO price of USD 1,213/ton.
6.4 Assessment of Feasibility
The EEDI, which applies only to new ships, will lead to CO2 and non-CO2 emissions reductions. Many
measures available for improving the EEDI of a new vessel are viable for existing vessels and will un-
doubtedly form part of the toolbox used to meet the requirements of the Ship Energy Efficiency Man-
agement Plan (SEEMP), applicable to all ships. Since the measures taken for an individual vessel regard-
ing EEDI or SEEMP may include a number of options, the possible combinations with the BC abatement
technologies are numerous and choices may, to a varying degree, impact one another. Most fuel effi-
ciency measures will reinforce each other in terms of BC reductions; however, some efforts, such as
slow steaming without de-rating, will counteract BC reductions from other technologies. Such multi-
dimensional interactions have not been included in the costing exercise, but it has been estimated by
DNV that the increased fuel efficiency will amount to 13% in 2030 from EEDI and 9% from SEEMP [136].
6.4.1 Slow Steaming – with De-Rating
Simply reducing vessel speed will not achieve any BC emissions reductions, and may in fact increase
emissions unless the engine has electronically controlled injection and can adjusts to the load. Here,
the assessment is done a the case where slow steaming is acheived with de-rating and the technology is
actually generating savings of approximately USD 2.6 per reduced g of BC.
Regarding slow steaming, it is obvious that more tonnage is needed to transport the same total cargo
volume when travelling at a slower speed. It can be estimated that 15-20% more tonnage is needed,
although it is currently observed that slow steaming is used to absorb surplus tonnage in the market.
-4.00
-2.00
0.00
2.00
4.00
6.00
8.00
10.00
Slowsteaming
WiFE LNG DPF SWS FWS
USD
/g B
C
Abatement technology
Low
Best
High
43

6
Since the estimations on abatement technology are concerned with the comparison of cost associated
with the individual vessel, these are not included in the calculations.
As mentioned in section 3, many shipping companies have already pursued slow steaming and many
more may do so in order to pursue fuel savings to meet EEDI requirements. Thus, reduction in BC
emissions will be achieved through the fuel savings associated with EEDI. Slow steaming may be a
preferred option for ships operating on the high seas, but the need for highly adjustable loads in Arctic
waters during icy conditions may limit applicability in vessels operating there (particularly with engines
with mechanical operation).
6.4.2 WiFE
WiFE produces significant BC reductions with the addition of 20-30% water to the fuel. WiFE is an
abatement technology with fewer barriers and it provides a less costly reduction in BC at some 5-8
cents/g BC reduced. It is market ready and already in use for the purpose of reducing NOX emissions. It
must be kept in mind that many studies of WiFE were carried out with the objective of studying the
reduction of nitrogen oxides. PM reductions were often measured albeit with limited direct
measurements of BC reductions. Recent work suggests that both MDO and HFO water emulsions can be
produced to achieve the NOX, PM and BC benefits. Although the BC reductions are considered valid only
few studies are available to further substantiate the reported fuel cost reductions of 10% or more at 15-
20% water. To accomodate this uncertainty a sensitivity analysis is performed comparing a 10% fuel
reduction scenario with the scenario of 1.5-2.0% fuel penalty used in the estimates above.
Substantial savings are associated if 10% SFOC are achieved in a WiFE. The cost of reducing one gram of
BC at a 1.5-2.0% fuel penalty is 0.08-0.10 USD as seen in Table 28 whereas the 10% fuel reduction leads
to a negative cost of 0.31-0.36 USD/g BC, i.e. savings, in the 10 MW Aframax model vessel.
6.4.3 LNG/DME
The use of natural gas as fuel for propulsion of ships is considered attractive in terms of its potential for
reduction of SOX and NOX, but it has considerable potential for BC reduction also. However, the barriers
are high for introduction, since the ships must undergo extensive retrofitting and may lose commercial
space onboard, in addition to a widespread lack of bunkering facilities. The advantage, besides the
reduction of emissions, is a fuel bonus rendering LNG a most cost-effective remedy generating savings of
approximately USD 1.7 per gram BC reduced.
If the alternative fuel is MGO, as in ECAs when operating without a scrubber, the use of LNG is very
attractive. For HFO, the case is less attractive but still positive. The use of LNG reduces the BC emis-
sions considerably more than a simple switch to distillate fuels, although an LNG estimate using the High
estimate will overestimate reality in a dual fuel engine since pilot fuel and lubricants will contribute
some 2% BC in practice.
No detailed assessment of DME was performed, since the technology is not yet available beyond the
initial test stage. Engine requirements are reportedly similar to LNG, but the use of DME for fuel is less
dependent on costly infrastructure.
44

7
6.4.4 Diesel Particulate Filters
The advantage of DPFs is the great efficiency of the exhaust after treatment. Despite the technology‟s
low cost, it suffers from a severe lack of maturity in maritime applications and, more importantly, the
experience from land and inland water traffic with DPF is that the abatement technology currently can
only be operated on (ultra) low-sulphur diesel. Results of an ongoing DPF test on a vessel operated on C
Heavy fuel is awaited with interest. The ranking here reflects a situation where DPF can be operated on
MDO.
The filters are well known from land-based applications for diesel and low-sulphur fuels, but it is an
open question as to how marketable the DPFs are in the immediate future in the maritime market. The
costs are comparable to abatement with the seawater scrubber solution.
6.4.5 Scrubbers – High Sulphur
Scrubbers, in both seawater and recirculation modes, are effective technologies for the reduction of BC.
When applying scrubbers on the base fuel case of MDO to reduce BC, this technology is a suitable
abatement technology at an approximate cost of 30 cents/g BC reduced. The vessel will often need to
operate in freshwater mode close to port and the consumption of sodium hydroxide during this freshwa-
ter mode is a major cost that bears negatively on the BC reduction cost. This is a significant drawback,
e.g. for tugs. It must be kept in mind that marine scrubbers are designed and developed for the
reduction of sulphur oxides when operating on HFO, rather than reduction of BC, and their use in
international shipping are expected to vastly expand with the introduction of a stricter sulphur regime
in 2020.
The actual economical feasibility of this technology is therefore dependent on the trade pattern of the
vessel with the expected operation in the vicinity of ports or in ECAs. Obviously, when scrubbers are
required and installed for other reasons, the BC reduction comes as a collateral benefit. Scrubbers for
the reduction of BC in low-sulphur fuels have not been assessed.
6.4.6 HFO – Low Sulphur Fuel
Significant reductions in BC are achieved when switching from HFO to a lower sulphur fuel, as in the
case of distillate fuel. There are studies suggesting that there is no BC reduction or even increases in BC
emissions as fuel quality improves, but most studies point to a genuine BC reduction potential, which is
corroborated by the experience from land-based diesel engines (see section 3 for the discussion on this).
This is obviously also the case when choosing LNG as the alternative to HFO, and in both cases the ship-
owner‟s choice is influenced heavily by the sulphur regulation and the trading pattern with respect to
ECAs. The costs are substantial but distributed quite differently, with the LNG option carrying a massive
upfront investment and savings on operational costs, and the use of distillate fuel being virtually all
operating costs.
6.5 Feasibility in a Regulatory Context
The future scenarios of emissions from a given vessel are extraordinary complicated over the next dec-
ade, with a number of possible interactions depending on the timing. As mentioned in the introductory
part of the study, the future emissions of BC from shipping may be affected by the 2020 (or possibly
45

8
2025) reduction to 0.5% sulphur in fuel on a global scale and to 0.1% when travelling in ECAs, or by the
corresponding reduction in sulphates (and particulate matter) arising from the use of exhaust gas clean-
ing systems. BC emissions will also be affected by the introduced Tier II and coming Tier III NOX regula-
tions.
6.5.1 Air Emissions Regulation and the No Action Option: Co-Reduction of BC
The requirements of MARPOL Annex VI regarding Tier II NOX reduction entered into force on 1st of Janu-
ary,2011, and according to Dieselnet.com (Dieselnet 2010): Tier II standards are expected to be met by
combustion process optimization. The parameters examined by engine manufacturers include fuel in-
jection timing, pressure, and rate (rate shaping), fuel nozzle flow area, exhaust valve timing, and cyl-
inder compression volume.
While some technical solutions to the Tier II requirement do not necessarily lead to reduced BC emis-
sions, others do lead to notable BC effects, including WiFE, slide valves and de-rating combined with
slow steaming.
Thus, given the renewal of the fleet, and in the perspective of a 2020 or 2030 horizon a significant part
of the global fleet may, through EEDI, NOX requirements and sulphur reductions, already have co-
reduced BC emissions inadvertently. Since the mechanisms of the aforementioned requirements to
achieve their objectives are not defined, the precise reduction in BC resulting hereof cannot be as-
sessed.
Therefore, the timing of a BC emissions reduction regulation may have significant impact on the “value”
of the regulatory action. If the IMO choose to implement BC regulation early, some abatement technolo-
gies acting on HFO (switching to low sulphur or using scrubbers) may be relevant, but if the action to-
ward BC has a longer time frame, existing requirements under MARPOL will already have BC reduction
potential through EEDI, SOX and NOX regulation.
A shipowner already facing investments regarding both sulphur and nitrogen oxides would possibly be
positively inclined toward a BC abatement technology that was also addressing the other issues of air
emissions, and, potentially, even fuel efficiency improvements.
The table below lists the six abatement technologies, of which some provide the BC reduction as part of
a general reduction in fuel consumption.
46

9
Table 29 Tentative assessment of co-reduction of BC through other mechanisms for air pollution reduction
Sulphur
and/or SOX
NOX BC Fuel savings
Slow steaming with de-rating YES YES YES YES
Water-in-Fuel Emulsion YES YES YES YES
HFO to Distillate YES NO YES NO
LNG for propulsion YES YES YES YES
Diesel Particulate Filter YES NO YES NO
Scrubber - High Sulphur Fuel YES NO YES YES
6.5.2 Operational Pattern Relative to ECAs
Although it is not part of the current study to examine the effect of the operational pattern of a vessel,
it is going to influence the shipowner‟s choice of the most beneficial BC abatement technology. For ex-
ample, if all or most voyages take place in ECAs or on the high seas, as may be the case for ro-ro opera-
tions or large container vessels respectively, different abatement options might be considered. Opera-
tion in ECAs will favour certain technologies for which the alternative is low-sulphur marine gas oil. For
the High Seas vessels a technology compatible currently with HFO and later with 0.5% Sulphur Marine
Diesel Oil may be preferred. Also, technologies that address requirements regarding both sulphur and
nitrogen oxides will gain an advantage beyond 2020.
6.5.3 Assessment of Abatement Technologies Regarding Specific Arctic Issues
The majority of vessels currently operating in the Arctic are vessels calling ports in the area rather than
vessels transiting through the Northwest Passage or the Northern Sea Route. However, it is expected
that the increase in traffic will be for vessels in transhipment such as tankers and bulkers, and for cruise
ships and vessels operating for extended periods in the Arctic such as the OSV/AHTS and fishing vessels.
Several of the abatement technologies may not be suited for vessels operating in the Arctic. This would
include LNG, since the lack of bunkering infrastructure and relatively limited operational range of cur-
rent designs of LNG-powered vessels does challenge the applicability.
The current study is directed at the ranking of various abatement technologies for the purpose of
regulatory feasibility and, as such, not directed at assessing the cost for the global fleet composition -
or an Arctic fleet given the possible trading patterns - and route viability in a future setting.
47

10
The global reduction in shipping‟s emissions of air pollutants will reduce the long-range transport of BC
to the Arctic and will likewise reduce the locally generated BC originating from (international) shipping.
The introduction of abatement technologies mentioned in this study may further reduce locally
generated BC from international shipping by 50-90% depending on the actual technology.
6.6 Overview of Technologies
In the table overleaf the technologies are presented with the key characteristics regarding their
feasibilty for existing vessels. The most feasible and cost-effective technologies may be found among
slow steaming with de-rating, fuel switch to low sulphur or LNG. But WiFE is also a relatively simple
technology with a reasonable cost-effectiveness.
Several of the BC abatement technologies may be used in combination with one another for increased
efficiency or some are already under consideration for other purposes (SOX or NOX reductions) and a BC
abatement technology may be added. While the available body of data on BC does not allow any
detailed analyses and it is not within the scope of the current study to evaluate the multiple
combinations possible it may be noted that some technologies lend themselves to this option: For
example slow steaming operations (with engine retuning or de-rating) and diesel particulate filters will
substantially reduce CO2 and particle emissions. A small fuel penalty for DPF operation will mean fuel
savings will be slightly reduced. Alternatively operation of engines on high quality fuels, in combination
with DPFs will produce significant SOX and PM reductions, although both of these options come with a
cost penalty. An alternative combination of technologies is a combination of operational, fuel-based and
after-treatment options such as slide valves, water in fuel emulsions and scrubbers (or DPF).
We caution that the efficiencies observed with one technology may not always be additive and both
antagonistic and synergistic effects may be observed when combining operational, fuel-based and after-
treatment measures. However, the efficiencies observed with one technology may not necessarily be
additive and both antagonistic and synergistic effects may be observed when combining operational,
fuel-based and after-treatment measures.
It is clear from the difficulties reported in monitoring BC in exhausts points toward certifying certain
technologies, particularly if regulation is enacted within the coming decade. However, few technologies
are in fact thoroughly studied with respect to BC, although data on particles and hydrocarbons are used
as proxies and thus the current basis for certification is not strong.
48

11
Table 30 Factors impacting feasibility of technology
BC re-
duction
%
Cost ef-
fective-
ness
Ties and
co-
reduction
Barriers to
retrofit
Other bar-
riers
Arctic
barrier
Enforce-
ment
mechanism
SSDR 15 High Not direct-
ly linked,
but strong
fuel saving
motivation
Not possible
for mechan-
ically con-
trolled en-
gine
- Variable
loads un-
der ice
conditions
Not readily
certifiable
WiFE 70 Medium Will
increase
with NOX
regulation
Lack of
emulsifica-
tion in dis-
tillates
Few No Certifiable
HFO -
Distillat
e
52 High Driven by
Sulphur
regulations
Few Fuel avail-
ability
No Certifiable
LNG 93.5 High Driven by
NOX and
Sulphur
regulations
Design chal-
lenges in
vessel with
no deck
space
- Bunkering
infra-
structure
missing
Certifiable
DPF 85 Medium No incen-
tive from
other regu-
lation
Footprint
restrictions
Immature
technology
- Certifiable
SWS 60 Medium Driven by
Sulphur
regulations
Footprint
restrictions
- May re-
quire
heating
Certifiable
FWS 60 Low Driven by
Sulphur
regulations
Footprint
restrictions
- Heating
of NaOH
solution
above 18C
to avoid
crystaliza
tion
Certifiable
49
12
7 References
1. Bond, T. C., Streets, D. G., Yarber, K., Nelson, S. M., Woo, J.-H. and Klimont, Z., 2004, A
Technology-Based Global Inventory of Black Carbon and Organic Carbon Emissions from
Combustion, Journal of Geophysical Research 109(D14203): doi:10.1029/2003JD003697.
2. Janssen, N. A. H., Gerlofs-Nijland, M. E. and Lanki, T., 2012, Health Effects of Black Carbon.
http://www.euro.who.int/__data/assets/pdf_file/0004/162535/e96541.pdf
3. Smith, K. R., Jerrett, M., Anderson, H. R., Burnett, R. T., Stone, V., Derwent, R., Atkinson, R.
W., Cohen, A., Shonkoff, S. B., Krewski, D., Pope, C. A., Thun, M. J. and Thurston, G., 2009,
Public Health Benefits of Strategies to Reduce Greenhouse-Gas Emissions: Health Implications
of Short-Lived Greenhouse Pollutants, The Lancet 374(9707): 2091-2103.
4. IPCC, 2007, Climate Change 2007: The Physical Science Basis. Contribution of Working group 1
to the Fourth Assessment Report. Report of the Intergovernmental Panel on Climate Change. S.
Solomon, D. Qin, M. Manninget al. Cambridge, United Kingdom and New York, NY USA,
Cambridge University Press.
5. AMAP, 2011, The Impact of Black Carbon on Arctic Climate, AMAP Technical Report No. 4. Oslo,
Norway, Arctic Monitoring and Assessment Programme (AMAP): 70pp.
http://amap.no/documents/index.cfm?action=getfile&dirsub=&filename=89439%5Fimpact of
black carbon%5FLO%5FFINAL.pdf&sort=default.
6. US-EPA, 2012, Report to Congress on Black Carbon. EPA-450/R-12-001,
http://www.epa.gov/blackcarbon/2012report/fullreport.pdf
7. UNEP and WMO, 2012, Integrated Assessment of Black Carbon and Tropospheric Ozone Sum-
mary for Decision Makers, UNEP.
8. IMO, 2012, Definition and measurement of Black Carbon in international shipping, BLG
16/15/4. Sub-Committee On Bulk Liquids And Gases,
http://docs.imo.org/Shared/Download.aspx?did=69893
9. Lack, D. A., Lerner, B., Granier, C., Baynard, T., Lovejoy, E. R., Massoli, P., Ravishankara, A.
R. and Williams, E., 2008, Light Absorbing Carbon Emissions from Commercial Shipping,
Geophys. Res. Lett. 35(L13815): doi:10.1029/2008GL033906
10. Lack, D. A. and Corbett, J. J., 2012, Black Carbon from Ships: A Review of the Effects of Ship
Speed, Fuel Quality and Exhuast Gas Scrubbing, Atmos. Chem. Phys. 12: 3985-4000
10.5194/acp-12-3985-2012.
11. Corbett, J. J., Winebrake, J. J., Green, E. H., Kasibhatla, P., Eyring, V. and Lauer, A., 2007,
Mortality from Ship Emissions: A Global Assessment, Environ. Sci. Technol. 41(24): DOI:
10.1021/es071686z
12. Eyring, V., et al. 2010, Transport Impacts on Atmosphere and Climate: Shipping. Atmos. Envi-
ron,.44(37): p. 4735-4771.
13. Lauer, A., et al. 2009, Assessment of Near-Future Policy Instruments for Oceangoing Shipping:
Impact on Atmospheric Aerosol Burdens and the Earth's Radiation Budget. Environ. Sci. Tech-
nol., 43(15): p. 5592-5598.
14. Fuglestvedt, J., Berntsen, T., Eyring, V., Isaksen, I., Lee, D. S. and Sausen, R., 2009, Shipping
Emissions: From Cooling to Warming of Climate—and Reducing Impacts on Health,
Environmental Science & Technology 43(24): 9057-9062 10.1021/es901944r.
15. NSIDC, 2007, Arctic Sea Ice Shatters All Previous Record Lows. Diminished summer sea ice
leads to opening of the fabled Northwest Passage 2007 [cited; Available from:
http://nsidc.org/news/press/2007_seaiceminimum/20071001_pressrelease.html and
http://nsidc.org/arcticseaicenews/].
50

13
16. ACIA, 2004, Impacts of a Warming Arctic: Arctic Climate Impact Assessment, Cambridge Uni-
versity Press.
17. AMSA, 2009, Arctic Marine Shipping Assessment 2009 Report, Arctic Council.
http://www.arctic.gov/publications/AMSA_2009_Report_2nd_print.pdf
18. ECON, 2007, Arctic Shipping 2030: From Russia with Oil, Stormy Passage, or Arctic Great
Game?, Oslo. 2007-070: 1-25. http://www.econ.no/stream_file.asp?iEntityId=3244
19. Laulajainen, R., 2009, The Arctic Sea Route, Int. J. Shipping and Transport Logistics 1(1): doi:
10.1504/IJSTL.2009.021976.
20. Serreze, M. C., Holland, M. M. and Stroeve, J., 2007, Perspectives on the Arctic's Shrinking Sea-
Ice Cover, Science 315(5818): 1533-1536 10.1126/science.1139426
21. Shindell, D. and Faluvegi, G., 2009, Climate response to regional radiative forcing during the
twentieth century,Nature Geosci 2(4): 294-300.
22. Law, K. and Stohl, A., 2007, Arctic Air Pollution: Origins and Impacts, Science 315(1537): DOI:
10.1126/science.1137695
23. McConnell, J. R., Edwards, R., Kok, G. L., Flanner, M. G., Zender, C. S., Saltzman, E. S.,
Banta, J. R., Pasteris, D. R., Carter, M. M. and Kahl, J. D. W., 2007, 20th-Century Industrial
Black Carbon Emissions Altered Arctic Climate Forcing, Science 317(5843): 1381-1384
10.1126/science.1144856
24. Quinn, P. K., Bates, T. S., Baum, E., Doubleday, N., Fiore, A. M., Flanner, M., Fridlind, A.,
Garrett, T. J., Koch, D., Menon, S., Shindell, D., Stohl, A. and Warren, S. G., 2008, Short-lived
pollutants in the Arctic: their climate impact and possible mitigation strategies, Atmos. Chem.
Phys. 8(6): 1723-1735.
25. Quinn, P. K., Shaw, G., Andrews, E., Dutton, E. G., Ruoho-Airola, T. and Gong, S. L., 2007,
Arctic haze: current trends and knowledge gaps,Tellus 59B: 99-144.
26. Stohl, A., Andrews, E., Burkhart, J. F., Forster, C., Herber, A., Hoch, S. W., Kowal, D., Lunder,
C., Mefford, T., Ogren, J. A., Sharma, S., Spichtinger, N., Stebel, K., Stone, R., Strom, J.,
Tørseth, K., Wehrli, C. and Yttri, K. E., 2006, Pan-Arctic enhancements of light absorbing
aerosol concentrations due to North American boreal forest fires during summer 2004, Journal
of Geophysical Research 111(D22214): doi:10.1029/2006JD007216..
27. Flanner, M. G., Zender, C. S., Randerson, J. T. and Rasch, P. J., 2007, Present-day climate
forcing and response from black carbon in snow, Journal of Geophysical Research 112(D11202):
doi:10.1029/2006JD008003.
28. Corbett, J. J., Lack, D. A., Winebrake, J. J., Harder, S., Silberman, J. A. and Gold, M., 2010,
Arctic shipping emissions inventories and future scenarios, Atmos. Chem. Phys. 10(19): 9689-
9704 10.5194/acp-10-9689-2010.
29. Peters, G. P., Nilssen, T. B., Lindholt, L., Eide, M. S., Glomsrød, S., Eide, L. I. and Fuglestvedt,
J. S., 2011, Future emissions from shipping and petroleum activities in the Arctic, Atmos.
Chem. Phys. 11(11): 5305-5320 10.5194/acp-11-5305-2011.
30. Bailey, D., Holland, M., Lack, D., Lamarque, J. F., Flanner, M. and Corbett, J. J., 2011,
Potential impacts of 21st century Arctic shipping. World Climate Research Program. Denver,
CO.
http://www.star.nesdis.noaa.gov/star/documents/meetings/Ice2011/posters/NIC_Bailey.pdf.
31. Dalsøren, S. B., Samset, B. H., Myhre, G., Corbett, J. J., Minjares, R., Lack, D. and
Fuglestvedt, J. S., 2012, Environmental impacts of shipping in 2030 with a particular focus on
the Arctic region, Atmos. Chem. Phys. Discuss. 12(10): 26647-26684 10.5194/acpd-12-26647-
2012
32. IMO, 2010, Emissions inventory and analysis of impacts of short-lived climate forcing aerosols
from international shipping activity in the Arctic, BLG 15/INF.5.
http://docs.imo.org/Shared/Download.aspx?did=64259
33. IMO, 1997, Technical Code on Control of Emission of Nitrogen Oxides from Marine Diesel
Engines (NOx Technical Code), IMO. 13.
51

14
http://www.imo.org/ourwork/environment/pollutionprevention/airpollution/pages/nitrogen-
oxides-%28nox%29-%E2%80%93-regulation-13.aspx
34. IMO, 2010, Air Pollution from Ships Cut with Entry Into Force of MARPOL Amendments,
http://www.imo.org/newsroom/mainframe.asp?topic_id=1859&doc_id=13309.
35. IMO, 2009, Second IMO Greenhouse Study 2009.
http://www.imo.org/blast/blastDataHelper.asp?data_id=27795&filename=GHGStudyFINAL.pdf.
36. IMO, 2011, Amendments to the Annex of the Protocol of 1997 to Amend the International
Convention for the Prevention of Pollution from Ships, 1973, as Modified by the Protocol of
1978 Relating Thereto (Inclusion of regulations on energy efficiency for ships in MARPOL Annex
VI). Resolution MEPC.203(62). International-Maritime-Organization.
http://www.imo.org/MediaCentre/HotTopics/GHG/Documents/eedi amendments RESOLUTION
MEPC203 62.pdf
37. IMO, 2011,Report of the Marine Environement Protection Committee on its Sixty-Second Ses-
sion, MEPC 62/24. http://docs.imo.org/Shared/Download.aspx?did=68320.
38. IMO, 2006, Report to the Maritime Safety Committee and the Marine Environment Protection
Committee, BLG 10/19. Sub-Committee On Bulk Liquids And Gases
http://docs.imo.org/Shared/Download.aspx?did=37738
39. IMO, 2007, Report to the Maritime Safety Committee and the Marine Environment Protection
Committee, BLG 11/16. Sub-Committee On Bulk Liquids And Gases
http://docs.imo.org/Shared/Download.aspx?did=43029
40. IMO, 2008, Report to the Maritime Safety Committee and the Marine Environment Protection
Committee, BLG 12/17. Sub-Committee On Bulk Liquids And Gases
http://docs.imo.org/Shared/Download.aspx?did=47528
41. IMO, 2007, Proposal for the measurement method for particulate matter emitted from marine
diesel engines, BLG 12/6/14. Review Of Marpol Annex Vi And The NOx Technical Code
http://docs.imo.org/Shared/Download.aspx?did=46015
42. IMO, 2009, Report of the Marine Environement Protection Committee on its Fifty-Ninth
Session, MEPC 59/24. http://docs.imo.org/Shared/Download.aspx?did=56200
43. IMO, 2010, Report of the Marine Environment Protection Committee on its Sixy-First Sesion,
MEPC 61/24. http://docs.imo.org/Shared/Download.aspx?did=63388
44. IMO, 2010, Reduction of emissions of black carbon from shipping in the Arctic. Prevention of
Air Pollution from Ships, http://docs.imo.org/Shared/Download.aspx?did=58243
45. IMO, 2011, Report to the Maritime Safety Committee and the Marine Environment Protection
Committee, BLG 15/19. Sub-Committee On Bulk Liquids And Gases,
http://docs.imo.org/Shared/Download.aspx?did=65804.
46. IMO, 2010, Report to the Executive Body for the Convention on Long-range Transboundary Air
Pollution by the Co-Chairs of the Ad Hoc Expert Group on Black Carbon, BLG 15/INF.8.
http://docs.imo.org/Shared/Download.aspx?did=64474
47. IMO, 2012,Impact of fuel quality regulation and speed reductions on shipping emissions: Impli-
cations for climate and air quality, BLG 16/Inf.5. Sub-Committee On Bulk Liquids And Gases,
http://docs.imo.org/Shared/Download.aspx?did=69842.
48. IMO, 2012, Emissions of Black Carbon from international shipping – IMO definition, BLG
16/15/1. Sub-Committee On Bulk Liquids And Gases,
http://docs.imo.org/Shared/Download.aspx?did=69905.
49. IMO, 2012, Impact on the Arctic of Emissions of Black Carbon from International Shipping, BLG
16/15/2. Sub-Committee On Bulk Liquids And Gases,
http://docs.imo.org/Shared/Download.aspx?did=69878.
50. IMO, 2012, Consideration of Black Carbon Emissions, BLG 16/15/3. Sub-Committee On Bulk
Liquids And Gases, http://docs.imo.org/Shared/Download.aspx?did=69879.
51. IMO, 2012, Reduction of emissions of Black Carbon from shipping in the Arctic, BLG 16/15/5.
Sub-Committee On Bulk Liquids And Gases,
http://docs.imo.org/Shared/Download.aspx?did=69894.
52

15
52. CARB, 2004, The California Diesel Fuel Regualtions. http://www.arb.ca.gov/regs/regs.htm.
53. EU, 1993, Directive 93/12/EEC of 23 March 1993 relating to the sulphur content of certain
liquid fuels, Official Journal of the European Communities L074: 0081 - 0082.
54. EU, 2003, Directive 2003/17/EC of the European Parliament and of the Council of 3 March
2003 amending Directive 98/70/EC relating to the quality of petrol and diesel fuels, Official
Journal of the European Communities L076: 0010 - 0019.
55. Lack, D. A., Langridge, J. M., Bahreini, R., Brock, C. A., Middlebrook, A. M. and Schwarz, J. P.,
2012, Brown Carbon and Internal Mixing in Biomass Burning Particles, Proceedings of the
National Academy of Sciences, In Preparation.
56. Burtscher, H., 2005, Physical characterization of particulate emissions from diesel engines: a
review, Journal of Aerosol Science 36(7): 896-932 10.1016/j.jaerosci.2004.12.001.
57. US-EPA, 2005, Emissions Modeling Clearinghouse Speciation, Titles and Documentation for PM
Profiles. http://www.epa.gov/ttn/chief/emch/speciation/pm25_prof_titles_revised.xls
58. Schwarz, J. P., Gao, R. S., Spackman, J. R., Watts, L. A., Thomson, D. S., Fahey, D. W.,
Ryerson, T. B., Peischl, J., Holloway, J. S., Trainer, M., Frost, G. J., Baynard, T., Lack, D. A.,
de Gouw, J. A., Warneke, C. and Del Negro, L. A., 2008, Measurement of the Mixing State,
Mass, and Optical Size of Individual Black Carbon Particles in Urban and Biomass Burning
Emissions, Geophys. Res. Lett. 35 10.1029/2008gl033968.
59. Kondo, Y., Matsui, H., Moteki, N., Sahu, L., Takegawa, N., Kajino, M., Zhao, Y., Cubison, M. J.,
Jimenez, J. L., Vay, S., Diskin, G. S., Anderson, B., Wisthaler, A., Mikoviny, T., Fuelberg, H. E.,
Blake, D. R., Huey, G., Weinheimer, A. J., Knapp, D. J. and Brune, W. H., 2011, Emissions of
black carbon, organic, and inorganic aerosols from biomass burning in North America and Asia
in 2008, J. Geophys. Res. 116(D8): D08204 10.1029/2010jd015152.
60. Sedlacek, A. J., III, Lewis, E. R., Kleinman, L., Xu, J. and Zhang, Q., 2012, Determination of
and evidence for non-core-shell structure of particles containing black carbon using the Single-
Particle Soot Photometer (SP2), Geophys. Res. Lett. 39(6): L06802 10.1029/2012gl050905.
61. Seinfeld, J. H. and Pandis, S. N., 1998, Atmospheric Chemistry and Physics: From air pollution
to climate change. New York, John Wiley and Sons, Inc
62. Fathom, 2011, Ship Efficiency: The Guide A comprehensive guide to ship eco-efficiency
technologies and measures. Berkshire, UK.
63. IMO, 2011, Energy Efficiency Design Index - Technical and Operational Measures,
http://www.imo.org/OurWork/Environment/PollutionPrevention/AirPollution/Pages/Technical
-and-Operational-Measures.aspx.
64. Ritchie, A., Jonge, E., Hugi, C. and Cooper, D.., 2005, European Commission Directorate Gen-
eral Environment, Service Contract on Ship Emissions: Assignment, Abatement and Market-
based Instruments: Task 2b – NOX Abatement, Entec UK Limited: Northwich, Cheshire, UK. p.
60.
65. Corbett, J. J., Winebrake, J. J. and Green, E. H., 2010, An Assessment of Technologies for
Reducing Regional Short-Lived Climate Forcers Emitted by Ships with Implications for Arctic
Shipping, Carbon Management 1(2): 207-225 10.4155/cmt.10.27
66. Fournier, A., 2006, Controlling Air Emissions from Marine Vessels: Problems and Opportunities,
Donald Bren School of Environmental Science and Management. Santa Barbara, California, USA,
University of California Santa Barbara.
67. MAN, 2002, Considerable Emission Reductions and Improved Operation with Slide Fuel Valves.
News from MAN B&W Diesel http://mandieselturbo.com/files/news/filesof737/Slide Fuel
Valves 190802.pdf
68. MAN, 2012, Slow Steaming Practices in the Global Shipping Industry: Results of a survey
conducted by MAN PrimeServ in late 2011 among representatives of the global container, bulk
and tanker shipping industry. 2/2012, http://www.manslowsteaming.com.
69. Henningsen, S., 2004, MV Sine Maersk Emission Measurements & Retrofit Control Technology
Discussion, The MARAD Shipboard Energy Technologies Workshop. Sacramento, CA, USA.
53
16
70. CIMAC, 2012, Background Information on Black Carbon Emissions from Large Marine and
Stationary Diesel Engines - Definition, Measurement Methods, Emission Factors and Abatement
Technologies. http://www.cimac.com/cimac_cms/uploads/explorer/Working
groups/black_carbon.pdf.
71. MAN, 2004, Low Container Ship Speed Facilitated by Versatile ME/ME-C Engines.
http://www.mandieselturbo.de/files/news/filesof8410/5510-0038-04.pdf
72. Wettstein, R. and Brown, D., 2008, Derating: A Solution for High Fuel Savings and Lower
Emissions. http://www.wartsila.com/file/Wartsila/1278512639967a1267106724867-Wartsila-
SP-Tech-2008-Derating.pdf
73. MAN, 2004, MAN Diesel Common Rail. 6L32/40CR,
http://www.mandiesel.com.cn/files/news/filesof15981/Commonrail Brochure.pdf
74. Harvald, S., 1977, Prediction of Power of Ships, Lyngby, Denmark: Department of Ocean Engi-
neering, Technical University of Denmark.
75. Faber, J., Nelissen, D., Hon, G., Wang, H. and Tsimplis, M., 2012, Regulated Slow Steaming in
Maritime Transport: An Assessment of Options, Costs and Benefits.
http://www.transportenvironment.org/sites/default/files/media/Slow steaming CE Delft
final.pdf
76. Maersk, 2010, Slow Steaming Here to Stay,
http://www.maersk.com/AboutMaersk/News/Pages/20100901-145240.aspx.
77. PWC, 2011, A Game Changer for the Shipping Industry? An analysis of the future impact of
carbon regulations on environment and industry.
http://www.scribd.com/doc/68027866/Shipping-GHG-PwC-Final
78. Jorgensen, R., 2010, Slow Steaming: The Full Story.
http://www.maersk.com/Innovation/WorkingWithInnovation/Documents/Slow Steaming - the
full story.pdf.
79. IMO, 2007, Estimation method of particulate matter emitted from marine engines, BLG
11/5/18. REVIEW OF MARPOL ANNEX VI AND THE NOx TECHNICAL CODE
http://docs.imo.org/Shared/Download.aspx?did=41566
80. Miller, J. W., Khan, M. Y., Welch, W. A. and Gutierrez, J., 2010, On-Board C3 Marine Engine
Measurement of Emission Reductions from Fuel Switching at the Port of Houston and a Mexican
Port, University of California, Riverside
81. Issa, M., Petit, C., Brillard, A. and Brilhac, J.-F. O., 2008, Oxidation of carbon by CeO2: Effect
of the contact between carbon and catalyst particles, Fuel 87(6): 740-750
10.1016/j.fuel.2007.05.053.
82. Maricq, M. M., 2007, Chemical Characterization of Particulate Emissions from Diesel Engines: A
Review, J. Aero. Sci 38(11): 1079-1118 10.1016/j.jaerosci.2007.08.001.
83. MECA, 2007, Emission Control Technologies for Diesel-Powered Vehicles.
http://www.meca.org/galleries/default-file/MECA Diesel White Paper 12-07-07 final.pdf
84. Ristimaki, J., Hellem, G. and Lappi, M., 2010, Chemical and Physical Characterization of
Exhaust Particulate Matter from a Marine Medium Speed Diesel Engine, CIMAC Congress.
Bergen, International Council on Combustion Engines.
http://www.researchgate.net/publication/41205230_Chemical_and_physical_characterization_
of_exhaust_particulate_matter_from_a_marine_medium_speed_diesel_engine.
85. Cottel, E. W., 2012, (Personnel Communication (available upon request from E.W. Cottel or
Lithauz)). Nonox Ltd. Emulsion Combustion Technology, Nonox Ltd.
86. Einemo, U., 2012, Emulsion fuel system promises fuel savings, emission reductions.
SustainableShipping.com
http://www.sustainableshipping.com/news/i109570/Emulsion_fuel_system_promises_fuel_savi
ngs_emission_reductions
87. Inerco, 2012 (Personnel Communication, available from Lithauz upon request). Caracterizacion
de Emisiones Durante la Inyeccion de Aditivos en Una Caldera de Fuel-Oil de la Ladrilleria "El
Prado en Velez-Malago"
54
http://www.wartsila.com/file/Wartsila/1278512639967a1267106724867-Wartsila-SP-Tech-2008-Derating.pdf

17
88. American-Bureau-of-Shipping, 2001, Notes on Heavy Fuel Oil
http://www.eagle.org/eagleExternalPortalWEB/ShowProperty/BEA
Repository/Rules&Guides/Current/31_HeavyFuelOil/Pub31_HeavyFuelOil.pdf.
89. Lack, D. A., Cappa, C. D., Langridge, J., Bahreini, R., Buffaloe, G., Brock, C., Cerully, K.,
Coffman, D., Hayden, K., Holloway, J., Lerner, B., Massoli, P., Li, S.-M., McLaren, R.,
Middlebrook, A. M., Moore, R., Nenes, A., Nuaaman, I., Onasch, T. B., Peischl, J., Perring, A.,
Quinn, P. K., Ryerson, T., Schwartz, J. P., Spackman, R., Wofsy, S. C., Worsnop, D., Xiang, B.
and Williams, E., 2011, Impact of Fuel Quality Regulation and Speed Reductions on Shipping
Emissions: Implications for Climate and Air Quality, Environmental Science & Technology
45(20): 9052-9060 10.1021/es2013424.
90. Petzold, A., Lauer, P., Fritsche, U., Hasselbach, J., Lichtenstern, M., Schlager, H. and
Fleischer, F., 2011, Operation of Marine Diesel Engines on Biogenic Fuels: Modification of
Emissions and Resulting Climate Effects, Environ. Sci. Technol. 45(24): 10394 - 10400
10.1021/es2021439
91. Winebrake, J. J., Corbett, J. J. and Meyer, P. E., 2007, Energy Use and Emissions from Marine
Vessels: A Total Fuel Life Cycle Approach, J. Air & Waste Manage. Assoc. 57: 102-110.
92. Xue, J., Grift, T. E. and Hansen, A. C., 2011, Effect of biodiesel on engine performances and
emissions, Renewable and Sustainable Energy Reviews 15(2): 1098-1116
10.1016/j.rser.2010.11.016
93. US-EPA, 2002, A Comprehensive Analysis of Biodiesel Impacts on Exhaust Emissions - Draft
Technical Report. EPA420-P-02-001,
http://www.epa.gov/oms/models/analysis/biodsl/p02001.pdf
94. Jayaram, V., Agrawal, H., Welch, W. A., Miller, J. W. and Cocker, D. R., 2011, Real-Time
Gaseous, PM and Ultrafine Particle Emissions from a Modern Marine Engine Operating on
Biodiesel, Environmental Science & Technology 45(6): 2286-2292 10.1021/es1026954.
95. Lloyds, 2010, Maersk and Lloyd’s Register team up for marine engine bio-fuel tests,
http://www.lr.org/news_and_events/press-releases/181528-maersk-and-lloyds-register-team-
up-for-marine-engine-biofuel-tests.aspx
96. CAIP, 2004, Compressed Natural Gas versus Diesel, Results of Vehicle Testing at Misr Lab.
pdf.usaid.gov/pdf_docs/PNACX796.pdf.
97. Coroller, P., Plassat, G. and Seguelong, T., 2003, Comparative Study on Exhaust Emissions
from Diesel- and CNG-Powered Urban Buses. Diesel Engine Emissions Reduction (DEER)
Conference, Rhode Island, USA.
http://www.eere.energy.gov/vehiclesandfuels/pdfs/deer_2003/session5/deer_2003_dunn.pdf.
98. Hesterberg, T. W., Lapin, C. A. and Bunn, W. B., 2008, A Comparison of Emissions from
Vehicles Fueled with Diesel or Compressed Natural Gas, Environmental Science & Technology
42(17): 6437-6445 10.1021/es071718i.
99. NORDEN, 2012, SPIRETH – Alcohol (Spirits) and Ethers as marine fuel,
http://www.nordicenergy.org/project/alcohol-spirits-and-ethers-as-marine-fuel/
100. Duwig, C., Gabrielsson, P. and Højlund-Nielsen, P. E., 2011, SPIRETH: Methanol fuelled Diesel
engine using the OBATE technology. Energy Efficient Shipping Through Ultra-Slow Steaming,
http://www.marindagen.se/wp-content/uploads/2010/11/P.E.-H%C3%B8jlund-Nielsen.pdf
101. Wartsilla, 2010, Fuels of the future – What will come next after HFO? CIMAC Congress 10,
http://www.cimac.com/cimac_cms/uploads/explorer/Congress_2010/panel_presentations_thu
rsday/CIMAC_Panel_Thursday_all.pdf.
102. Ramne, B., 2011, EFF Ship, Efficient Shipping with Low Emissions.
http://www.effship.com/PublicPresentations/EffShip_Transportforum_12-13_januari_2011-
Final1.ppt
103. MAN, 2011, New Liquid ME-GI Engine Signals Expansion of MAN B&W Gas Portfolio.
http://www.mandieselturbo.com/files/news/filesof15559/Master_PR LPG ME-LGI engine.pdf
104. BioDME, 2012, Production of DME from biomass and utilisation of fuel for transport and
industrial use, http://www.biodme.eu/about-dme.
55

18
105. Maersk, 2012, (Personnel Communication, contact Maersk for further use and permissions). Bio
fuel trial on seagoing vessel. Netherlands, Maersk Ship Management
106. Ariana, I. M., Nishida, O., Fujita, H., Harano, W. and Fujio, M., 2006, Removal of Marine Diesel
Particulate Matter by Electrostatic Precipitator, ICESP X. Australia. Paper 4A2.
http://www.isesp.org/ICESP X PAPERS/PDFS/Paper 4A2.pdf.
107. Farnoud, A., 2008, Electrostatic removal of diesel particulate matter, Southern Methodist
University. PhD. http://gradworks.umi.com/33/03/3303839.html.
108. Hayashi, H., Kimura, M., Kawahara, K., Takasaki, Y., Takashima, K. and Mizuno, A., 2009,
Collection of diesel exhaust particle using electrostatic charging prior to mechanical
filtration, Electrostatics Joint Conference. Boston, MA, USA.
http://www.electrostaticanswers.com/2009ESJC/Session04/2009 Hayashi Collection of diesel
exhaust particle using electrostatic charging.pdf.
109. Kawakami, H., Zukeran, A., Yasumoto, K., Inui, T., Ehara, Y. and Yamamoto, T., 2011, Diesel
PM Collection for Marine Emissions Using Double Cylinder Type Electrostatic Precipitator,
International Journal of Plasma Environmental Science & Technology 5(2): 174-178.
110. Yamamoto, T., Mimura, T., Otsuka, N., Ito, Y., Ehara, Y. and Zukeran, A., 2010, Diesel PM
Collection for Marine and Automobile Emissions Using EHD Electrostatic Precipitators, Industry
Applications, IEEE Transactions on 46(4): 1606-1612 10.1109/tia.2010.2049970
111. Lin, C.-Y., 2002, Reduction of particulate matter and gaseous emission from marine diesel
engines using a catalyzed particulate filter, Ocean Engineering 29(11): 1327-1341
10.1016/s0029-8018(01)00086-5.
112. Eminox, 2011, CRT System Operation and Maintenance Manual.
http://www.eminox.com/assets/documents-and-downloads/English CRT manual LR.pdf
113. Lowell, D., 2003, Comparison of Clean Diesel Buses to CNG Buses. Diesel Engine Emissions
Reduction (DEER) Conference. Rhode Island, USA, US Departmenr of Energy.
http://www1.eere.energy.gov/vehiclesandfuels/pdfs/deer_2003/session5/
deer_2003_lowell.pdf.
114. US-EPA, 2010, Diesel Particulate Filter General Information. United States Environmental
Protection Agency Technical Bulletin
http://www.epa.gov/cleandiesel/documents/420f10029.pdf
115. Liu, Z. G., Berg, D. R. and Schauer, J. J., 2009, Detailed Effects of a Diesel Particulate Filter
on the Reduction of Chemical Species Emissions, SAE International Journal of Fuels and
Lubricants 1(1): 184-191.
116. Huss, 2009, Diesel Particulate Filter with Active Diesel Burner Technology.
http://www.hussgroup.com/group/en/shared_content/download_files/02-EN_MK.pdf
117. MOL, 2012, MOL Introduces Technology to Eliminate Particulate Emissions from Vessels -
Announces demonstration test of Diesel Particulate Filter, http://www.mol.co.jp/pr-
e/2012/e-pr_1209.html.
118. US-EPA, 2010, Diesel Oxidation Catalyst General Information. United States Environmental
Protection Agency Technical Bulletin
http://www.epa.gov/cleandiesel/documents/420f10031.pdf
119. Eminox, 2009, Eminox SCR System - NOx Reducing Technology.
http://www.eminox.com/assets/documents-and-downloads/(5) English SCR Leaflet Sep 09
LR_1.pdf
120. Nuszkowski, J., Clark, N. N., Spencer, T. K., Carder, D. K., Gautam, M., Balon, T. H. and
Moynihan, P. J., 2009, Atmospheric Emissions from a Passenger Ferry with Selective Catalytic
Reduction, Journal of the Air & Waste Management Association 59(1): 18-30 10.3155/1047-
3289.59.1.18
121. MAN, 2012, Pers. Comm. with Michael Finch Pedersen, MAN Diesel & Turbo. Sept.
122. Lloyds, 2012, Understanding exhaust gas treatment systems: Guidance for shipowners and
operators. http://www.lr.org/Images/Understanding exhaust gas treatment systems June
2012_tcm155-240772.pdf
56

19
123. Couple-Systems, 2010, Dry Exhaust Gas Cleaning System. http://www.egcsa.com/pdfs/Couple-
Systems-EGCS-SMM-Workshop-2010.pdf.
124. Hombravella, A., Kihcaslan, A., Perales, J. and Rub, C., 2011, Study of Exhaust Gas Cleaning
Systems for Vessels to Fulfill IMO III in 2016.
http://upcommons.upc.edu/pfc/bitstream/2099.1/13745/1/CAT FINAL REPORT.pdf.
125. International-Standards-Organization, 1996, Reciprocating internal combustion engines -
Exhaust emission measurement -Part 1: Test-bed measurement of gaseous particulate exhaust
emissions. IS0 8178-1.
126. Ritchie, A., Jonge, E., Hugi, C. and Cooper, D., 2005, European Commission Directorate
General Environment, Service Contract on Ship Emissions: Assignment, Abatement, and
Market-based Instruments. Task 2b – NO× Abatement.
ec.europa.eu/environment/air/pdf/task2_nox.pdf.
127. CARB, 2002, Oceangoing Marine Vessel Emission Control Technology Matrix.
http://www.arb.ca.gov/ports/marinevess/documents/matrix.pdf.
128. Cottel, E.W., 2012, Emission Control Technology for Engines and Boilers Pays for Itself in Fuel
Savings. http://www.nonoxltd.com/WhitePaper.html
129. Einemo, U., 2012, Emulsifier inventor promises huge emission reductions.
SustainableShipping.com http://www.sustainableshipping.com/news/2012/5/113958?tag=45-
81976-10013373-0-SS.
130. GSOTF, 2012, Green Ships of the Future, Vessel Emissions Study.
131. MAN,2006, Faster Freight Cleaner Air.
132. MAN, Emulsion Cost Overview.
133. Diesel, M., Operation on Low-Sulphur Fuels.
134. Mitsui, O.S.K.L., 2010, MOL Develops Marine Use Diesel Particulate Filter.
135. den Boer, E., 2011, Emissions from the Legacy Fleet.
136. Longva, T., 2011, Emmission reduction potential in shipping. EECP - WG ships meeting 3, DNV.
137. Andreasen A (MAN Diesel) & Nyggard KB (Danisco) (2011), Danish Ministry of the Environment
(Water-in-fuel emulsion as marine engine fuel for reduced NOx and particulate emissions -
Environmental Project No. 1380 2011)
138. Jayaram, V., Miller, J.W., Nigam, A., Welch, W.A., Cocker, D.R., 2009, Effect of Selective
Catalytic Reduction Unit on Emissions from and Auxilliary Engine on an Ocean-Going Vessel.
Final Report to California Air Resources Board.
http://www.arb.ca.gov/ports/marinevess/documents/emissiontest/post%20panamax%20AUX%2
0SCR%20final.pdf
57

20

21
Appendix
58

Appendix A – Cost Overview
Table 35 from Erria report
Cost Index EEDI De-Rating Emulsion LNG HFO-Distillate
/day DPF Scrubber
1. AFRAMAX
COST INDEX
0.73
0.73
0.51
0.90
0.51
0.72
0.90
2. CONTAINER 4.40 5.30 4.40 5.30 3.67 5.29 5.65 6.05 3.66 5.24 4.37 5.31 4.97 5.31
3. BULK CARRIER
0.93 0.94 0.93 0.94 0.91 0.93 1.05 1.07 0.90 0.90 0.93 0.94 0.93 0.94
4. GAS 1.41 1.37 1.41 1.37 1.43 1.37 1.56 1.57 1.41 1.33 1.41 1.38 1.39 1.38
5. PASSENGER 4.22 3.41 4.22 4.68 3.85 4.68 5.11 5.34 3.83 4.62 4.21 4.68 4.51 4.69
6. OSV/AHTS 1.20 1.00 1.20 1.00 1.37 1.00 1.20 1.14 1.37 1.00 1.21 1.00 1.08 1.00
7. TUG 0.41 0.38 0.41 0.38 0.44 0.39 0.44 0.43 0.44 0.38 0.41 0.38 0.39 0.38
Table 34 from Erria report
Off-hire rates EEDI De-Rating WiFE LNG HFO-Distillate DPF Scrubber Off Hire Rates
AFRAMAX 30 30 20 40 10 20 30 USD 20,000
CONTAINER 30 30 20 40 10 20 30 USD 40,000
BULK CARRIER 30 30 20 40 10 20 30 USD 18,000
GAS 30 30 20 40 10 20 30 USD 30,000
PASSENGER 30 30 20 40 10 20 30 USD 60,000
OSV/AHTS 30 30 20 40 10 20 30 USD 35,000
TUG 30 30 20 40 10 20 30 USD 10,000
59

Table 31 from Erria report
Cost per kW excl. Off-hire cost AFRAMAX CONTAINER BULK CARRIER GAS PASSENGER OSV/AHTS TUG
EEDI USD 100 USD 100 USD 100 USD 100 USD 100 USD 100 USD 100
Slow Steaming: With De-Rating USD 100 USD 100 USD 100 USD 100 USD 100 USD 100 USD 100
WIFE USD 26 USD 26 USD 26 USD 26 USD 26 USD 26 USD 26
LNG USD 455 USD 518 USD 518 USD 518 USD 518 USD 518 USD 518
DPF USD 63 USD 63 USD 63 USD 63 USD 63 USD 63 USD 63
HFO-Distillate USD 13 USD 13 USD 13 USD 13 USD 13 USD 13 USD 13
Scrubber USD 330 USD 330 USD 330 USD 330 USD 330 USD 330 USD 330
Table 28 from Erria report
SFOC (Specific Fuel Oil Consumption)
HFO LS MGO LNG
2-Stroke 0.182 0.171 0.155 kg/kWhr
2-Stroke (de-rated) 0.171 0.161 0.145 kg/kWhr
4-Stroke 0.209 0.196 0.178 kg/kWhr
4-Stroke (de-rated) 0.196 0.185 0.167 kg/kWhr
60

Table 9 from Erria report
Fuel Price - World Wide
HFO 380 1-3.5%S MGO 0.1%S LNG
Singapore USD 676.00 USD 995.00 USD 412.00
Rotterdam USD 653.50 USD 975.00 USD 389.00
Houston USD 671.50 USD 1,040.00
Fujairah USD 681.50 USD 1,026.00
Los Angeles USD 686.50 USD 1,097.00
Durban
USD 1,131.50
Tokyo USD 718.50 USD 1,008.00
New York USD 663.50
Average: USD 678.71 USD 1,038.93 USD 400.50
61

Appendix B – Calculations according to Corbett
Table 31 to Table 35 provide estimates of energy use, total cost of technology, pollution reduction and cost-effectiveness of BC reduction for the different abatement technologies slow steaming, water-in-fuel emulsification (WiFE), switch to liquid natural gas (LNG), diesel particulate filters (DPF), sea water scrubbing (SWS) and fresh water scrubbing (FWS). All estimates are made for an engine power of 10,000 kW, total annual operating hours of 6240, use of marine diesel oil (MDO) and an average engine load fraction of 0.72. The base scenario uses a discount rate of 7% and MDO cost of 1011.8 USD/mt (Table 31). A sensitivity analysis assessing the impact on cost of changing discount rates and MDO costs has been made (Table 32 to 35). The lowest and the highest MDO price since March 2009 have been used.
Table 31 Best estimates for the different technologies using MDO fuel cost of 1011.8 USD/mt and a discount rate of 7%.
Energy use [kWh/year]
Total cost [USD/year]
Pollution reduction [g/year]
Cost-effectiveness [USD/g BC]
Slow steaming 3.12E+07 -2.52E+06 9.61E+05 -2.62
WiFE 4.49E+07 1.04E+05 1.57E+06 0.07
LNG 4.49E+07 -5.09E+06 2.94E+06 -1.73
DPF 4.49E+07 5.58E+05 2.67E+06 0.21
SWS 4.49E+07 3.92E+05 1.26E+06 0.31
FWS 4.49E+07 1.12E+07 1.26E+06 8.92
Table 32 Estimates for the different technologies using MDO fuel cost of 1011.8 USD/mt and a discount rate of 10%.
Energy use [kWh/year]
Total cost [USD/year]
Pollution reduction [g/year]
Cost-effectiveness [USD/g BC]
Slow steaming 3.12E+07 -2.49E+06 9.61E+05 -2.60
WiFE 4.49E+07 1.19E+05 1.57E+06 0.08
LNG 4.49E+07 -5.01E+06 2.94E+06 -1.7
DPF 4.49E+07 5.63E+05 2.67E+06 0.21
SWS 4.49E+07 4.34E+05 1.26E+06 0.35
FWS 4.49E+07 1.13E+07 1.26E+06 8.95
Table 33 Estimates for the different technologies using MDO fuel cost of 1011.8 USD/mt and a discount rate of 4%.
Energy use [kWh/year]
Total cost [USD/year]
Pollution reduction [g/year]
Cost-effectiveness [USD/g BC]
Slow steaming 3.12E+07 -2.55E+06 9.61E+05 -2.65
WiFE 4.49E+07 9.06E+04 1.57E+06 0.06
LNG 4.49E+07 -5.16E+06 2.94E+06 -1.76
DPF 4.49E+07 5.54E+05 2.67E+06 0.21
SWS 4.49E+07 3.54E+05 1.26E+06 0.28
FWS 4.49E+07 1.12E+07 1.26E+06 8.89
62

Table 34 Estimates for the different technologies using MDO fuel cost of 320 USD/mt and a discount rate of 7%.
Energy use [kWh/year]
Total cost [USD/year]
Pollution reduction [g/year]
Cost-effectiveness [USD/g BC]
Slow steaming 3.12E+07 -7.31E+05 9.61E+05 -0.76
WiFE 4.49E+07 7.49E+04 1.57E+06 0.05
LNG 4.49E+07 7.54E+05 2.94E+06 0.26
DPF 4.49E+07 3.25E+05 2.67E+06 0.12
SWS 4.49E+07 2.99E+05 1.26E+06 0.24
FWS 4.49E+07 1.10+07 1.26E+06 8.76
Table 35 Estimates for the different technologies using MDO fuel cost of 1213 USD/mt and a discount rate of 7%.
Energy use [kWh/year]
Total cost [USD/year]
Pollution reduction [g/year]
Cost-effectiveness [USD/g BC]
Slow steaming 3.12E+07 -3.04E+06 9.61E+05 -3.16
WiFE 4.49E+07 1.13E+05 1.57E+06 0.07
LNG 4.49E+07 -6.79E+06 2.94E+06 -2.31
DPF 4.49E+07 6.26E+05 2.67E+06 0.23
SWS 4.49E+07 4.19E+05 1.26E+06 0.33
FWS 4.49E+07 1.13E+07 1.26E+06 8.96
Table 36 provides estimates of energy use, total cost of technology, pollution reduction and cost-effectiveness when switching from heavy fuel oil (HFO) to MDO. The estimates are made for an engine power of 10,000 kW, total annual operating hours 6240 and an average engine load fraction of 0.72. The best estimate uses a discount rate of 7%, HFO cost of 659.8 USD/mt and MDO cost of 1011.8 USD/mt (Table 36). A sensitivity analysis has been made where the discount rate and the fuel costs are varied. The lowest and the highest MDO price since March 2009 have been used together with the corresponding lowest and highest HFO for the given dates.
Table 36 Best estimates when switching from HFO to MDO and sensitivity analysis assessing the impact of changing discount rates and fuel costs.
HFO-> distillate Energy use [kWh/year]
Total Cost [USD/year]
Pollution reduction [g/year]
Cost-effectiveness [USD/g BC]
Best estimate 4.49E+07 2.63E+06 1.57E+06 1.67
Interest rate 4% 4.49E+07 2.63E+06 1.57E+06 1.67
Interest rate 10% 4.49E+07 2.64E+06 1.57E+06 1.68
MDO cost 320 USD/mt, HFO cost 160 USD/mt
4.49E+07 1.28E+06
1.57E+06
0.81
MDO cost 1213 USD/mt HFO cost 903 USD/mt
4.49E+07 2.14E+06
1.57E+06
1.36
63

Figure 6 Total costs of the different abatement technologies using the best estimate MDO price of 1,011.8
USD/ton, the lowest MDO price of 320 USD/ton and the highest MDO price of 1,213 USD/ton.
Figure 7 Cost effectiveness of the different abatement technologies using the best estimate MDO price of 1,011.8
USD/ton, the lowest MDO price of 320 USD/ton and the highest MDO price of 1,213 USD/ton
References used for Corbett bawed calculations:
Andersen, ML, Clausen, NB and Sames, PC, 2011, LNG as ship fuel, Germanisher Loyd & MAN, viewed
September 12th 2012, http://www.gl-group.com/pdf/GL_MAN_LNG_study_web.pdf (Info on costs of
euipment and installation when switching to LNG)
64
-8
-6
-4
-2
0
2
4
6
8
10
12
14
Slowsteaming
WiFE LNG DPF SWS FWS
Mil
lio
n U
SD
Abatement technology
Low
Best
High
-4.00
-2.00
0.00
2.00
4.00
6.00
8.00
10.00
Slowsteaming
WiFE LNG DPF SWS FWS
USD
/g B
C
Abatement technology
Low
Best
High
Blikom, LP, 2012, Det Norske Veritas, personal communication on lifetime of LNG equipment, Sept. 4th 2012
Blikom, LP 2011, LNG Energy of the future, Det Norske Veritas, viewed Oct 1st 2012,
http://blogs.dnv.com/lng/2011/06/which-is-the-cheaper-marine-fuel-oil-or-natural-gas/ (Info on LNG cost)
Bunkerindex, 2012, Index summary, viewed Oct 12th 2012,
<http://www.bunkerindex.com/prices/indices.php>
Bunkerworld, 2012 Latest prices, viewed Oct 1st 2012, <http://www.bunkerworld.com/prices
Corbett, JJ, Winebrake, JJ & Green, EH, 2010, „An assessment of technologies for reducing regional short-
lived climate forcers emitted by ships with implications for Arctic shipping‟, Future Science – carbon
management (2010) 1(2), 207-225 (Specific info on abatement technologies)
http://www.sjofartsdir.no/PageFiles/7937/An%20assessment%20of%20technologies%20for%20reducing%20regi
onal%20short-
ived%20climate%20forces%20emitted%20by%20ships%20with%20implications%20for%20Arctic%20shipping.pdf
Erria, 2012 (Specific input on slow steaming, switching from HFO and scrubber – appendix E to this study)
Lack, D 2012, (Info on reduction rates when switching from HFO to MDO and when using LNG)
MAN Diesel, 2012, personal communication on lifetime of chiller, Oct. 17th.
Pedersen, BO, 2012, Rolls Royce, personal communication on BC reduction rates for LNG, Sept. 10th – Sept.
17th, 2012
Tellkamp, J 2012, LNG as a marine fuel, Det Norske Veritas, viewed Oct 1st 2012,
<vhttp://www.nautischerverein.de/Seiten/schiffstreibstoff_lng.pdf> (Info on LNG consumption)
Wils, Y. 2005, Determination of energy cost of electrical energy on board sea-going vessels, Ingenieurbüro
GmbH & Thermo King Corp., viewed Oct. 16th 2012,
http://www.effship.com/PartnerArea/MiscPresentations/Dr_Wild_Report.pdf (Specific info on HFO
consumption)
65

Appendic C - Cost and BC Reduction Overview: Ship Types 10MW with Aframax Tanker Base Case
Input
CAPEX for 10 MW
Shaft Power (kW) @100%
MCR
EEDI (De-Rating) SSDR WiFE LNG DPF Scrubber
Retrofit New-
building Retrofit New-
building Retrofit New-
building Retrofit New-
building Retrofit New-
building Retrofit New-
building
1. AFRAMAX 10,000 1,600,000 1,000,000 1,600,000 1,000,000 660,000 260,000 5,350,000 4,550,000 1,030,000 630,000 3,900,000 3,300,000
2. CONTAINER 10,000 2,200,000 1,000,000 2,200,000 1,000,000 1,060,000 260,000 6,780,000 5,180,000 1,430,000 630,000 4,500,000 3,300,000
3. BULK CARRIER
10,000 1,540,000 1,000,000 1,540,000 1,000,000 620,000 260,000 5,900,000 5,180,000 990,000 630,000 3,840,000 3,300,000
4. GAS 10,000 1,900,000 1,000,000 1,900,000 1,000,000 860,000 260,000 6,380,000 5,180,000 1,230,000 630,000 4,200,000 3,300,000
5. PASSENGER 10,000 2,800,000 1,000,000 2,800,000 1,000,000 1,460,000 260,000 7,580,000 5,180,000 1,830,000 630,000 5,100,000 3,300,000
6. OSV/AHTS 10,000 2,050,000 1,000,000 2,050,000 1,000,000 960,000 260,000 6,580,000 5,180,000 1,330,000 630,000 4,350,000 3,300,000
7. TUG 10,000 1,300,000 1,000,000 1,300,000 1,000,000 460,000 260,000 5,580,000 5,180,000 830,000 630,000 3,600,000 3,300,000
Addition to OPEX per day for 10 MW.
Shaft Power (kW)@90%
MCR
EEDI (De-Rating) SSDR WiFE LNG comparison DPF Scrubber
2-Stroke 4-Stroke 2-Stroke 4-Stroke 30 vol.%
H20 20 vol.%
H20 MGO HFO
SW mode FW mode
1.
AFRAMAX 9,000 -1,600 - -1,600 - 500 400 -25,500 -13,800 107 400 37,200
2.
CONTAINER 9,000 -1,600 - -1,600 - 500 400 -25,500 -13,800 107 400 37,200
3.
BULK CARRIER
9,000 -1,600 - -1,600 - 500 400 -25,500 -13,800 107 400 37,200
4.
GAS 9,000 -1,600 -1,800 -1,600 -1,800 500 400 -25,500 -13,800 107 400 37,200
5.
PASSENGER 9,000 - -1,800 - -1,800 600 500 -29,300 -15,800 123 500 37,300
6.
OSV/AHTS 9,000 - -1,800 - -1,800 600 500 -29,300 -15,800 123 500 37,300
7.
TUG 9,000 - -1,800 - -1,800 500 500 -29,300 -15,800 123 500 37,300
66

BC reduction rates [g/kWh]
No abatement SSDR WiFE LNG DPF SWS
Low 0 0.001 0.014 0.056 0.049 0.017
Base case
0 0.021 0.035 0.065 0.059 0.028
High 0.000 0.041 0.056 0.070 0.063 0.035
Operating days, interest rate and lifetime
Operating days per year 260
Interest rate 6%
Lifetime year
Retrofit 10
Newbuilding 30
Calculations
Shaft Power (kW)@90% MCR
EEDI (De-Rating) SSDR WiFE LNG comparison DPF Scrubber
2-Stroke 4-Stroke 2-Stroke 4-Stroke 30 vol.% H20 20 vol.% H20 MGO HFO
SW mode FW mode
1. AFRAMAX -416,000 - -416,000 - 130,000 104,000 -6,630,000 -3,588,000 3,068,000 104,000 9,672,000 -416,000
2. CONTAINER -416,000 - -416,000 - 130,000 104,000 -6,630,000 -3,588,000 3,068,000 104,000 9,672,000 -416,000
3. BULK CARRIER -416,000 - -416,000 - 130,000 104,000 -6,630,000 -3,588,000 3,068,000 104,000 9,672,000 -416,000
4. GAS -416,000 -468,000 -416,000 -468,000 130,000 104,000 -6,630,000 -3,588,000 3,068,000 104,000 9,672,000 -416,000
5. PASSENGER - -468,000 - -468,000 156,000 130,000 -7,618,000 -4,108,000 3,536,000 130,000 9,698,000 -
6. OSV/AHTS - -468,000 - -468,000 156,000 130,000 -7,618,000 -4,108,000 3,536,000 130,000 9,698,000 -
7. TUG - -468,000 - -468,000 156,000 130,000 -7,618,000 -4,108,000 3,536,000 130,000 9,698,000 -
67

AFRAMAX EEDI (De-Rating) SSDR WiFE LNG DPF
Scrubber
30 vol.% H20 20 vol.% H20 MGO HFO SW mode FW mode
Newbuilding 1,000,000 1,000,000 260,000 260,000 4,550,000 4,550,000 630,000 3,300,000 3,300,000
Addition to OPEX per year (USD) -416,000 -416,000 130,000 104,000 -6,630,000 -3,588,000 27,749 0 104,000
Costs
Costs per year for retrofit [USD]
Shaft Power (kW) @90% MCR
EEDI (De-Rating)
SSDR
WiFE LNG DPF
Scrubber
30 vol.% H20 20 vol.% H20 MGO HFO SW mode FW mode
1. AFRAMAX 9,000 -198,611 -198,611 219,673 193,673 -5,903,106 -2,861,106 167,693 633,885 10,201,885
2. CONTAINER 9,000 -117,090 -117,090 274,020 248,020 -5,708,815 -2,666,815 222,040 715,406 10,283,406
3. BULK CARRIER 9,000 -206,763 -206,763 214,238 188,238 -5,828,379 -2,786,379 162,258 625,733 10,193,733
4. GAS 9,000 -157,851 -157,851 246,846 220,846 -5,763,162 -2,721,162 194,866 674,645 10,242,645
5. PASSENGER 9,000 -87,570 -87,570 354,367 328,367 -6,588,121 -3,078,121 280,618 822,927 10,390,927
6. OSV/AHTS 9,000 -189,471 -189,471 286,433 260,433 -6,723,989 -3,213,989 212,684 721,026 10,289,026
7. TUG 9,000 -291,372 -291,372 218,499 192,499 -6,859,857 -3,349,857 144,750 619,125 10,187,125
Costs per year for newbuilding [USD]
Shaft Power (kW) @90% MCR
EEDI (De-Rating)
SSDR
WiFE LNG DPF
Scrubber
30 vol.% H20 20 vol.% H20 MGO HFO SW mode FW mode
1. AFRAMAX 9,000 -343,351 -343,351 148,889 122,889 -6,299,447 -3,257,447 73,518 343,741 9,911,741
2. CONTAINER 9,000 -343,351 -343,351 148,889 122,889 -6,253,679 -3,211,679 73,518 343,741 9,911,741
3. BULK CARRIER 9,000 -343,351 -343,351 148,889 122,889 -6,253,679 -3,211,679 73,518 343,741 9,911,741
4. GAS 9,000 -343,351 -343,351 148,889 122,889 -6,253,679 -3,211,679 73,518 343,741 9,911,741
5. PASSENGER 9,000 -395,351 -395,351 174,889 148,889 -7,241,679 -3,731,679 77,749 369,741 9,937,741
6. OSV/AHTS 9,000 -395,351 -395,351 174,889 148,889 -7,241,679 -3,731,679 77,749 369,741 9,937,741
7. TUG 9,000 -395,351 -395,351 174,889 148,889 -7,241,679 -3,731,679 77,749 369,741 9,937,741
68

BC Reduction Overview
Reduction per year [g] per vessel
Shaft Power (kW) @90% MCR
EEDI (De-Rating)
SSDR
WiFE LNG DPF
Scrubber
30 vol.% H20 20 vol.% H20 MGO HFO SW mode FW mode
1. AFRAMAX 9,000 - 1,179,360 1,965,600 1,965,600 3,650,400 3,650,400 3,313,440 1,572,480 1,572,480
2. CONTAINER 9,000 - 1,179,360 1,965,600 1,965,600 3,650,400 3,650,400 3,313,440 1,572,480 1,572,480
3. BULK CARRIER 9,000 - 1,179,360 1,965,600 1,965,600 3,650,400 3,650,400 3,313,440 1,572,480 1,572,480
4. GAS 9,000 - 1,179,360 1,965,600 1,965,600 3,650,400 3,650,400 3,313,440 1,572,480 1,572,480
5. PASSENGER 9,000 - 1,179,360 1,965,600 1,965,600 3,650,400 3,650,400 3,313,440 1,572,480 1,572,480
6. OSV/AHTS 9,000 - 1,179,360 1,965,600 1,965,600 3,650,400 3,650,400 3,313,440 1,572,480 1,572,480
7. TUG 9,000 - 1,179,360 1,965,600 1,965,600 3,650,400 3,650,400 3,313,440 1,572,480 1,572,480
1 AFRAMAX 9,000 - 1,179,360 1,965,600 1,965,600 3,650,400 3,650,400 3,313,440 1,572,480 1,572,480
Decrease low - 1,123,200 1,179,360 1,179,360 505,440 505,440 561,600 617,760 0
Increase high - 2,504,736 3,066,336 3,066,336 2,639,520 2,639,520 2,347,488 1,572,480 1,572,480
69

Cost per BC Reduction Overview
Cost per reduction for retrofit, base case [USD/g BC]
Shaft Power (kW) @90% MCR
EEDI (De-Rating)
SSDR
WiFE LNG DPF
Scrubber
30 vol.% H20 20 vol.% H20 MGO HFO SW mode FW mode
1. AFRAMAX 9,000 - -0.17 0.11 0.10 -1.62 -0.78 0.05 0.40 6.49
2. CONTAINER 9,000 - -0.10 0.14 0.13 -1.56 -0.73 0.07 0.45 6.54
3. BULK CARRIER 9,000 - -0.18 0.11 0.10 -1.60 -0.76 0.05 0.40 6.48
4. GAS 9,000 - -0.13 0.13 0.11 -1.58 -0.75 0.06 0.43 6.51
5. PASSENGER 9,000 - -0.07 0.18 0.17 -1.80 -0.84 0.08 0.52 6.61
6. OSV/AHTS 9,000 - -0.16 0.15 0.13 -1.84 -0.88 0.06 0.46 6.54
7. TUG 9,000 - -0.25 0.11 0.10 -1.88 -0.92 0.04 0.39 6.48
1 AFRAMAX 9,000 - -0.17 0.11 0.10 -1.62 -0.78 0.05 0.40 6.49
Decrease low - 3.37 -0.17 -0.15 0.26 0.13 -0.01 -0.26 0.00
Increase high - 0.11 -0.07 -0.06 0.68 0.33 -0.02 -0.20 -3.24
Cost per reduction for newbuilding, base case [USD/g BC]
Shaft Power (kW) @90% MCR
EEDI (De-Rating) SSDR WiFE LNG DPF
Scrubber
30 vol.% H20 20 vol.% H20 MGO HFO SW mode FW mode
1. AFRAMAX 9,000 - -0.29 0.08 0.06 -1.73 -0.89 0.02 0.22 6.30
2. CONTAINER 9,000 - -0.29 0.08 0.06 -1.71 -0.88 0.02 0.22 6.30
3. BULK CARRIER 9,000 - -0.29 0.08 0.06 -1.71 -0.88 0.02 0.22 6.30
4. GAS 9,000 - -0.29 0.08 0.06 -1.71 -0.88 0.02 0.22 6.30
5. PASSENGER 9,000 - -0.34 0.09 0.08 -1.98 -1.02 0.02 0.24 6.32
6. OSV/AHTS 9,000 - -0.34 0.09 0.08 -1.98 -1.02 0.02 0.24 6.32
7. TUG 9,000 - -0.34 0.09 0.08 -1.98 -1.02 0.02 0.24 6.32
1 AFRAMAX 9,000 - -0.29 0.08 0.06 -1.73 -0.89 0.02 0.22 6.30
Decrease low - 5.82 -0.11 -0.09 0.28 0.14 0.00 -0.14 0.00
Increase high - 0.20 -0.05 -0.04 0.72 0.37 -0.01 -0.11 -3.15
70

Figures - 10 MW Comparisson
71
-8,000,000
-6,000,000
-4,000,000
-2,000,000
0
2,000,000
4,000,000
6,000,000
8,000,000
10,000,000
12,000,000
30 vol.%H20
20 vol.%H20
MGO HFO SW mode FW mode
SSDR WiFE LNG DPF Scrubber
USD per year Equivalent annual cost
AFRAMAX
Retrofit New Building

72
-8.00
-6.00
-4.00
-2.00
0.00
2.00
4.00
6.00
8.00
30 vol.%H20
20 vol.%H20
MGO HFO SW mode FW mode
SSDR WiFE LNG DPF Scrubber
Cost per reduction USD per g
AFRAMAX
Retrofit New Building

73
0
2,000,000
4,000,000
6,000,000
8,000,000
10,000,000
12,000,000
14,000,000
16,000,000
30 vol.%H20
20 vol.%H20
MGO HFO SW mode FW mode
SSDR WiFE LNG DPF Scrubber
Reduction per year (g) AFRAMAX

74
SSDR
WiFE 30 vol.% H20
WiFE 20 vol.% H20
LNG MGO
LNG HFO
HFO-Distillate
DPF
Scrubber SW mode
-8
-6
-4
-2
0
2
0 1 2 3 4 5
Ad
dit
ion
al o
pe
x p
er
year
, Mill
ion
USD
Investment costs, Million USD

Appendix D – Cost and BC Reduction Overview: Similar Docking Size; Varying MW
Input
Input data, CAPEX
Shaft Power (kW) @100%
MCR
EEDI (De-Rating) SSDR WiFE LNG DPF Scrubber
Retrofit Newbuild-
ing Retrofit Newbuilding Retrofit Newbuilding Retrofit Newbuilding Retrofit Newbuilding Retrofit Newbuild-
ing
1. AFRAMAX 16,000 2,210,000 1,610,000 2,210,000 1,610,000 810,000 410,000 8,080,000 7,280,000 1,410,000 1,010,000 5,880,000 5,280,000
2. CONTAINER 76,500 9,730,000 8,530,000 9,730,000 8,530,000 2,970,000 2,170,000 45,630,000 44,030,000 6,160,000 5,360,000 29,240,000 28,040,000
3. BULK CARRIER 13,500 2,050,000 1,510,000 2,050,000 1,510,000 740,000 380,000 8,490,000 7,770,000 1,310,000 950,000 5,490,000 4,950,000
4. GAS 19,800 3,110,000 2,210,000 3,110,000 2,210,000 1,160,000 560,000 12,600,000 11,400,000 1,990,000 1,390,000 8,160,000 7,260,000
5. PASSENGER 67,500 9,330,000 7,530,000 9,330,000 7,530,000 3,120,000 1,920,000 41,250,000 38,850,000 5,930,000 4,730,000 26,540,000 24,740,000
6. OSV/AHTS 14,400 2,660,000 1,610,000 2,660,000 1,610,000 1,110,000 410,000 9,690,000 8,290,000 1,710,000 1,010,000 6,330,000 5,280,000
7. TUG 5,490 910,000 610,000 910,000 610,000 360,000 160,000 3,560,000 3,160,000 580,000 380,000 2,310,000 2,010,000
Input data, addition to OPEX per day
Shaft Power (kW)@90% MCR
EEDI (De-Rating) SSDR WiFE LNG comparison DPF
Scrubber
2-Stroke 4-Stroke 2-Stroke 4-Stroke 30 vol.% H20 20 vol.% H20 MGO HFO SW mode FW mode
1. AFRAMAX 14,400 -2,600 -2,600 - 900 600 -40,800 -22,000 171 700 59,500
2. CONTAINER 76,500 -13,600 -13,600 - 4,500 3,400 -216,600 -117,100 907 3,600 316,100
3. BULK CARRIER 13,500 -2,400 -2,400 - 800 600 -38,200 -20,700 160 600 55,800
4. GAS 19,800 -3,500 -4,000 -3,500 -4,000 1,200 900 -56,100 -30,300 235 900 81,800
5. PASSENGER 67,500 - -13,800 - -13,800 4,600 3,400 -219,500 -118,600 919 3,700 279,900
6. OSV/AHTS 14,400 - -2,900 - -2,900 1,000 700 -46,800 -25,300 196 800 59,700
7. TUG 5,490 - -1,100 - -1,100 400 300 -17,900 -9,600 75 300 22,800
75

Operating days per year 260
Interest rate 6%
Lifetime year
Retrofit 10 Newbuilding 30
Calculations
Addition to OPEX per year [USD]
Shaft Power (kW)@90% MCR
EEDI (De-Rating) SSDR WiFE LNG comparison DPF Scrubber
2-Stroke 4-Stroke 2-Stroke 4-Stroke 30 vol.% H20 20 vol.% H20 MGO HFO SW mode FW mode
1. AFRAMAX 14,400 -676,000 - -676,000 - 234,000 156,000 -10,608,000 -5,720,000 44,398 182,000 15,470,000
2. CONTAINER 76,500 -3,536,000 - -3,536,000 - 1,170,000 884,000 -56,316,000 -30,446,000 235,865 936,000 82,186,000
3. BULK CARRIER 13,500 -624,000 - -624,000 - 208,000 156,000 -9,932,000 -5,382,000 41,623 156,000 14,508,000
4. GAS 19,800 -910,000 -1,040,000 -910,000 -1,040,000 312,000 234,000 -14,586,000 -7,878,000 61,048 234,000 21,268,000
5. PASSENGER 67,500 - -3,588,000 0 -3,588,000 1,196,000 884,000 -57,070,000 -30,836,000 238,991 962,000 72,774,000
6. OSV/AHTS 14,400 - -754,000 0 -754,000 260,000 182,000 -12,168,000 -6,578,000 50,985 208,000 15,522,000
7. TUG 5,490 - -286,000 0 -286,000 104,000 78,000 -4,654,000 -2,496,000 19,438 78,000 5,928,000
AFRAMAX EEDI (De-Rating) SSDR WiFE LNG DPF Scrubber
30 vol.% H20 20 vol.% H20 MGO HFO SW mode FW mode
Newbuilding 1,610,000 1,610,000 410,000 410,000 7,280,000 7,280,000 1,010,000 5,280,000 5,280,000
Addition to OPEX per year (USD) -676,000 -676,000 234,000 156,000 -10,608,000 -5,720,000 44,398 0 182,000
76

Cost Overview
Costs per year retrofit
Shaft Power (kW) @90% MCR
EEDI (De-Rating)
SSDR
WiFE LNG DPF
Scrubber
30 vol.% H20 20 vol.% H20 MGO HFO SW mode FW mode
1. AFRAMAX 14,400 -375,732 -375,732 344,053 266,053 -9,510,187 -4,622,187 235,972 980,904 16,268,904
2. CONTAINER 76,500 -2,214,005 -2,214,005 1,573,528 1,287,528 -50,116,345 -24,246,345 1,072,812 4,908,779 86,158,779
3. BULK CARRIER 13,500 -345,471 -345,471 308,542 256,542 -8,778,481 -4,228,481 219,610 901,915 15,253,915
4. GAS 19,800 -487,451 -487,451 469,607 391,607 -12,874,064 -6,166,064 331,425 1,342,683 22,376,683
5. PASSENGER 67,500 -2,320,352 -2,320,352 1,619,908 1,307,908 -51,465,447 -25,231,447 1,044,688 4,567,936 76,379,936
6. OSV/AHTS 14,400 -392,591 -392,591 410,813 332,813 -10,851,439 -5,261,439 283,319 1,068,044 16,382,044
7. TUG 5,490 -162,360 -162,360 152,912 126,912 -4,170,310 -2,012,310 98,241 391,855 6,241,855
Costs per year newbuilding
Shaft Power (kW) @90% MCR
EEDI (De-Rating) SSDR WiFE LNG DPF Scrubber
30 vol.% H20 20 vol.% H20 MGO HFO SW mode FW mode
1. AFRAMAX 14,400 -559,035 -559,035 263,786 185,786 -10,079,116 -5,191,116 117,774 565,586 15,853,586
2. CONTAINER 76,500 -2,916,305 -2,916,305 1,327,648 1,041,648 -53,117,268 -27,247,268 625,264 2,973,075 84,223,075
3. BULK CARRIER 13,500 -514,300 -514,300 235,607 183,607 -9,367,518 -4,817,518 110,640 515,612 14,867,612
4. GAS 19,800 -749,446 -749,446 352,683 274,683 -13,757,802 -7,049,802 162,030 761,431 21,795,431
5. PASSENGER 67,500 -3,040,954 -3,040,954 1,335,486 1,023,486 -54,247,590 -28,013,590 582,620 2,759,334 74,571,334
6. OSV/AHTS 14,400 -637,035 -637,035 289,786 211,786 -11,565,741 -5,975,741 124,360 591,586 15,905,586
7. TUG 5,490 -241,684 -241,684 115,624 89,624 -4,424,429 -2,266,429 47,045 224,024 6,074,024
77

BC Reduction Overview
Reductions per year [g] per vessel
Shaft Power (kW) @90% MCR
EEDI (De-Rating) SSDR WiFE LNG DPF Scrubber
30 vol.% H20 20 vol.% H20 MGO HFO SW mode FW mode
1. AFRAMAX 14,400 - 1,886,976 3,144,960 3,144,960 5,840,640 5,840,640 5,301,504 2,515,968 2,515,968
2. CONTAINER 76,500 - 10,024,560 16,707,600 16,707,600 31,028,400 31,028,400 28,164,240 13,366,080 13,366,080
3. BULK CARRIER 13,500 - 1,769,040 2,948,400 2,948,400 5,475,600 5,475,600 4,970,160 2,358,720 2,358,720
4. GAS 19,800 - 2,594,592 4,324,320 4,324,320 8,030,880 8,030,880 7,289,568 3,459,456 3,459,456
5. PASSENGER 67,500 - 8,845,200 14,742,000 14,742,000 27,378,000 27,378,000 24,850,800 11,793,600 11,793,600
6. OSV/AHTS 14,400 - 1,886,976 3,144,960 3,144,960 5,840,640 5,840,640 5,301,504 2,515,968 2,515,968
7. TUG 5,490 - 719,410 1,199,016 1,199,016 2,226,744 2,226,744 2,021,198 959,213 959,213
1 AFRAMAX 14,400 - 1,886,976 3,144,960 3,144,960 5,840,640 5,840,640 5,301,504 2,515,968 2,515,968
Decrease low - 1,797,120 1,886,976 1,886,976 808,704 808,704 898,560 988,416 0
Increase high - 1,797,120 1,886,976 1,886,976 449,280 449,280 359,424 628,992 628,992
Cost per BC Reduction Overview
Costs per reduction retrofit [USD/g]
Shaft Power (kW) @90% MCR EEDI (De-Rating)
SSDR
WiFE LNG DPF Scrubber
30 vol.% H20 20 vol.% H20 MGO HFO SW mode FW mode
1. AFRAMAX 14,400 - -0.20 0.11 0.08 -1.63 -0.79 0.04 0.39 6.47
2. CONTAINER 76,500 - -0.22 0.09 0.08 -1.62 -0.78 0.04 0.37 6.45
3. BULK CARRIER 13,500 - -0.20 0.10 0.09 -1.60 -0.77 0.04 0.38 6.47
4. GAS 19,800 - -0.19 0.11 0.09 -1.60 -0.77 0.05 0.39 6.47
5. PASSENGER 67,500 - -0.26 0.11 0.09 -1.88 -0.92 0.04 0.39 6.48
6. OSV/AHTS 14,400 - -0.21 0.13 0.11 -1.86 -0.90 0.05 0.42 6.51
7. TUG 5,490 - -0.23 0.13 0.11 -1.87 -0.90 0.05 0.41 6.51
1 AFRAMAX 14,400 - -0.20 0.11 0.08 -1.63 -0.79 0.04 0.39 6.47
Decrease low - 3.98 -0.16 -0.13 0.26 0.13 -0.01 -0.25 0.00
Increase high - 0.10 -0.04 -0.03 0.12 0.06 0.00 -0.08 -1.29
78

Costs per reduction newbuilding [USD/g]
Shaft Power (kW) @90% MCR
EEDI (De-Rating)
SSDR
WiFE LNG DPF Scrubber
30 vol.% H20 20 vol.% H20 MGO HFO SW mode FW mode
1. AFRAMAX 14,400 - -0.30 0.08 0.06 -1.73 -0.89 0.02 0.22 6.30
2. CONTAINER 76,500 - -0.29 0.08 0.06 -1.71 -0.88 0.02 0.22 6.30
3. BULK CARRIER 13,500 - -0.29 0.08 0.06 -1.71 -0.88 0.02 0.22 6.30
4. GAS 19,800 - -0.29 0.08 0.06 -1.71 -0.88 0.02 0.22 6.30
5. PASSENGER 67,500 - -0.34 0.09 0.07 -1.98 -1.02 0.02 0.23 6.32
6. OSV/AHTS 14,400 - -0.34 0.09 0.07 -1.98 -1.02 0.02 0.24 6.32
7. TUG 5,490 - -0.34 0.10 0.07 -1.99 -1.02 0.02 0.23 6.33
1 AFRAMAX 14,400 - -0.30 0.08 0.06 -1.73 -0.89 0.02 0.22 6.30
Decrease low - 5.93 -0.13 -0.09 0.28 0.14 0.00 -0.15 0.00
Increase high - 0.14 -0.03 -0.02 0.12 0.06 0.00 -0.04 -1.26
79

Figures
80
-15,000,000
-10,000,000
-5,000,000
0
5,000,000
10,000,000
15,000,000
20,000,000
30 vol.%H20
20 vol.%H20
MGO HFO SW mode FW mode
SSDR WiFE LNG DPF Scrubber
USD per year Equivalent annual cost
AFRAMAX
Retrofit New Building

81
-8.00
-6.00
-4.00
-2.00
0.00
2.00
4.00
6.00
8.00
30 vol.%H20
20 vol.%H20
MGO HFO SW mode FW mode
SSDR WiFE LNG DPF Scrubber
Cost per reduction USD per g
AFRAMAX
Retrofit New Building

82
0
1,000,000
2,000,000
3,000,000
4,000,000
5,000,000
6,000,000
7,000,000
30 vol.%H20
20 vol.%H20
MGO HFO SW mode FW mode
SSDR WiFE LNG DPF Scrubber
Reduction per year (g) AFRAMAX

83
SSDR WiFE 30 vol.% H20
WiFE 20 vol.% H20
LNG MGO
LNG HFO
HFO-Distillate
DPF
Scrubber SW mode
-12
-10
-8
-6
-4
-2
0
2
4
6
8
10
12
0 2 4 6 8
Ad
dit
ion
al o
pe
x p
er
year
, Mill
ion
USD
Investment costs, Million USD

Page - 1
1. September 2012/REL
Appendix E - Erria Report
1. Introduction
The below technical and cost analysis report has the intention of clarifying and cost evaluating the selected seven
abatement measures available on the market to reduce Black Carbon (BC). The selected abatement measures are ap-
plied to the Base Case, Aframax Tanker as listed in table 35,, where we have summarized and calculated capital invest-
ment cost and application to seven vessels, of which five similar capacity vessels and two smaller but also very relevant
vessels were selected. The five vessels are similar in capacity but have very different power requirements, due to appli-
cation and speed requirement. After analysing costs of the equipment from different makers, we could conclude that
there was a linear relationship between price of the equipment and the power of the main engine, except for the EEDI,
which is dependent on other parameters as well. The procedure to estimate the cost for each vessel type, was to take
quotes from makers and calculate a rough cost, USD / kW, for each abatement measure and scale up or down to the
relevant vessel. We would like to advise that the estimates could vary 10-20%.
Due to the fact that the Capital investment of the abatement measures is approximately 80-90% of the total retrofitting
cost, which makes it quite irrelevant which part of the world the equipment is installed at. The Charter rates of each
vessel type was also taken into consideration, as we estimated some of the retrofitting cases to take up to 40 days,
which is a considerable cost to consider. Our conclusion is that if possible, the abatement measures are to be installed
at Newbuilding stage to reduce the CAPEX, between 40-60%, depending on off-hire rates and installation time. During
the design phase of a Newbuilding, many of the smaller modifications to the standard design can be absorbed into the
Contract Price. The cost difference between Newbuilding and Retrofitting is illustrated in Table 35.
Consideration for the additional operating costs per day, have also been taken into account and illustrated in table 36.
The reason for not including the vessel’s individual OPEX, is simply because the different vessels and owners, manag-
ers, use different nationalities of crew, which could influence the OPEX drastically. Crewing costs are often approxi-
mately 50% of the total OPEX of a vessel, depending on complexity and Flag of Registration.
2. EEDI (Energy Efficiency Design Index)
At the intercessional meeting in Norway 2008, the word Energy Efficiency Design Index was introduced first time,
The word is a bit controversial as EEDI can be lowered, simply by reducing the speed, even though the propulsion effi-
ciency is low. However in order to obtain the lowest possible EEDI at the highest speed, the total propulsion efficiency
shall be as high as possible. Several attempts have been made to make EEDI speed independent. There are three major
means to reduce EEDI, speed reduction, decrease in steel weight and increase in length.
When considering the options to reduce the EEDI and taking into consideration the limitations of retrofitting an
abatement measure, we chose slow steaming: with De-Rating, where the same number of off-hire days as per the De-
Rating case were used. This solution is one of the most effective solutions to reduce EEDI with one of the lowest
CAPEX’s, if having to retrofit. If your vessel has an Electronic engine, your CAPEX will be reduced approximately 45-
50% compared to the Standard Mechanical Injection Engine (e.g. MC, MC-C or RTA.)

Page - 2
1. September 2012/REL
Figure 8, Estimated required EEDI
Figure 9, EEDI (Base line definition)(i)
Additional requirements and restrictions:
IMO 15 July 2011: Mandatory measures to reduce emissions of greenhouse gases (GHGs) from international
shipping were adopted.
The Amendments to MARPOL Annex VI Regulations for the prevention of air pollution from ships, scheduled to
enter into force on 1 January 2013, add a new chapter 4 to Annex VI on Regulations on energy efficiency for
ships to make mandatory the Energy Efficiency Design Index (EEDI), for new ships, and the Ship Energy Effi-
ciency Management Plan (SEEMP) for all ships.( i)
EEDI only applies to new vessels, which could give an unfair advantage to vessels built before 1 January 2013,
due to the fact that the EEDI restricted vessels will possibly be forced to operate at lower speeds and forcing
the owner to introduce more vessels into a trading pattern to move the same amount of cargo during a limited
amount of time. The Capital investment for the EEDI restricted vessels are estimated to be 25-30%, which will
reduce their profit margin compared to existing vessels. The fuel savings with EEDI implementation measures
in many cases do not benefit the owners, as it is the charterer or operator that procures the fuel.
No Limitations for Polar Operation
No limitations in respect to Class rules on the listed vessels
3. Slow Steaming: with De-Rating
Slow Steaming was started during the end of 2007 by mainly container vessel owners and operators, when the charter rates dropped drastically at the beginning of the financial down turn in the US. Vessels were instructed by owners to reduce Main Engine load to approximately 40% MCR, which decreased the speed with approximately 20%. An average

Page - 3
1. September 2012/REL
FOC (Fuel Oil Cost) saving of approximately 42% without de-rated engine and 45% with a de-rated motor can be calcu-lated below in Table 37, Slow Steaming (40%MCR) without and with De-Rated Engine.
Table 37, Slow Steaming (40%MCR) without and with De-Rated Engine
From January 2010, owners started to investigation Super Slow Steaming, down to below 35% MCR, as low as 10% MCR. Engine Makers were initially hesitant due to the lack of experience but in June 2011, MAN Diesel issued a Service Letter (SL11-544 MTS) permitting owners to reduce engine load down to 10% MCR with certain recommendations. Several problems arise with low load operation e.g. Loss of Main Engine Turbocharger and propeller efficiency, fouling of hull, economizer soot build up etc. Electronic engines (ME, ME-B and RT-FLEX) engines are more flexible for slow steaming, therefore it is recommended to convert all mechanical injection Main engines to electronically controlled engines(ii). This conversion is costly, estimated at approximately USD 100 USD / kW, including Slide fuel valves, which are highly recommended by Engine makers. A Danish Initiative, Green Ship Of The Future, presented in Copenhagen 2012, a ‘Vessel Emissions Study’ [130], where MAN Diesel estimated the conversion cost of the ‘MT Nord Butterfly’ from a MC engine (Mechanical Injection) to a ME-B engine (Electro hydraulic, common rail injection). The conversion was from a 6S50MC-C (9.480 kW) motor to a 6S50ME-B, with the same effect. With our experience from MAN Diesel retrofits, it is possible to calculate a Table 45, Cost per kW, to scale the CAPEX to the specific vessel in Table 35.. If your vessel already has installed an Electronic en-gine, your CAPEX will be reduced approximately 45-50%.
NORD Butterfly ME-B Conversion 9480 kW
CAPEX USD 800,000 Cost per kW for ME-B conversion 84 USD / kW
Table 38, Green Ship of The Future: Vessel Emission Study (Copenhagen 2012)[130]
Engine makers are offering de-rated engines from newbuilding, where there is a larger CAPEX but reducing the SFOC
by 3-6% reduces the fuel costs. If the Propeller is redesigned to a more flexible operating curve, a further 6-10% can be
achieved, resulting in a total SFOC reduction of 10-15%(ii). Only reduced SFOC was included into
. When Slow Steaming, less cargo is transported from point A to B, thus additional vessels need to be included to transport the same amount of cargo as the ships operating at normal speeds. We have not included this scenario into Table 37, Slow Steaming (40%MCR) without and with De-Rated Engine due its complexity. Only the reduced fuel con-sumption with a de-rated engine is included into
Shaft Power Speed (Knots)
Distance
(Nautical Miles) Time
Total Fuel
Consumption Fuel Oil Savings (%)
90% MCR (kW) 14256 15,0 10000 667 1730 0%
40% MCR (kW) without derating 6336 11,4 10000 877 1012 42%
40% MCR (kW) with derating 6336 11,4 10000 877 951 45%

Page - 4
1. September 2012/REL
Figure 10, De-Rated S60MC MAN Diesel Engine.(ii)
Figure 11, SFOC Reduction Past 100 Years (iii)
Additional requirements and restrictions:
(Guidance from Lloyds Register)(iii)
If the de-rated engines have been de-rated after delivery, a new de-rated certificate has to be issued which
would have to comply with NOx requirements as per MEPC.1/Circ.678(iv), on how to have . Unusually, for such
requirements, the certification can be undertaken by the Administration of any signatory to MARPOL Annex VI
and hence this will not necessarily be a particular ship’s flag State. In practice it is probable that, as with much
of the NOx Technical Code certification, the actual approval will be undertaken by one of the Recognised Or-
ganisations acting on behalf of an Administration (Classification Society).
No Polar Limitiations
4. Water in Fuel Emulsion (WiFE)
In WiFE water is added continuously to the fuel supply and a homogeneous mixture is ensured by mechanical measures. When the mixture is injected the additional heat required to heat up liquid water to the boiling point, the
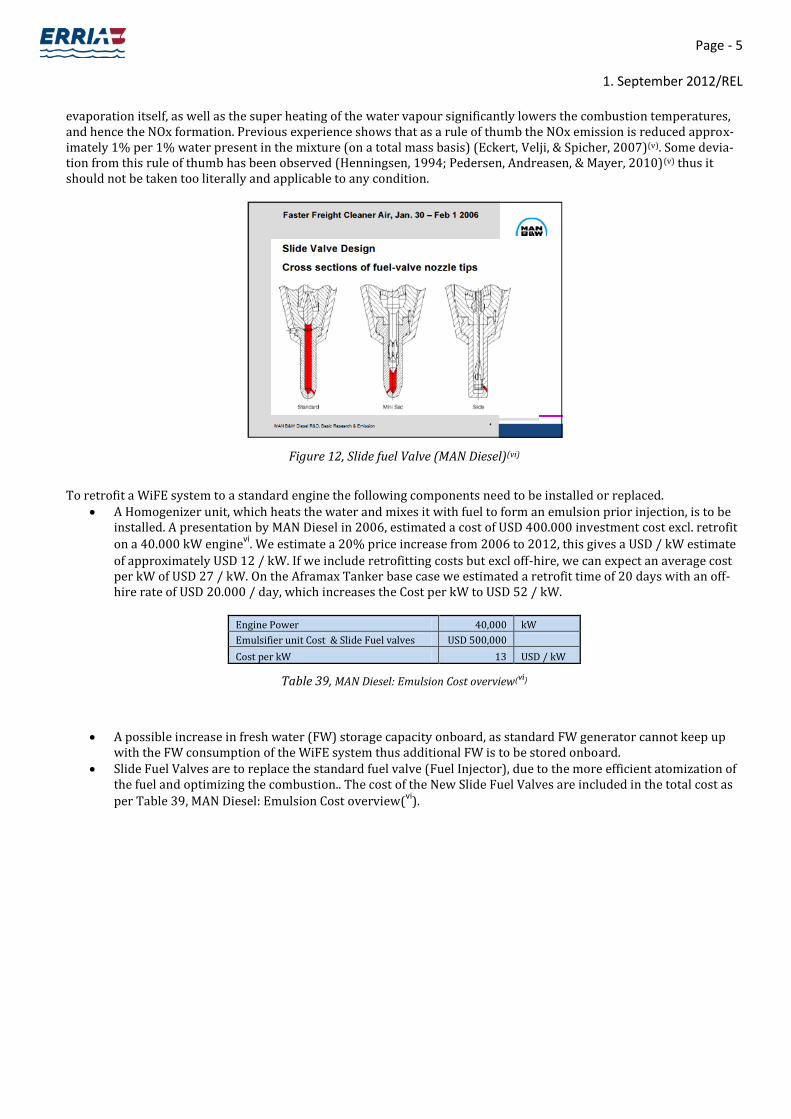
Page - 5
1. September 2012/REL
evaporation itself, as well as the super heating of the water vapour significantly lowers the combustion temperatures, and hence the NOx formation. Previous experience shows that as a rule of thumb the NOx emission is reduced approx-imately 1% per 1% water present in the mixture (on a total mass basis) (Eckert, Velji, & Spicher, 2007)(v). Some devia-tion from this rule of thumb has been observed (Henningsen, 1994; Pedersen, Andreasen, & Mayer, 2010)(v) thus it should not be taken too literally and applicable to any condition.
Figure 12, Slide fuel Valve (MAN Diesel)(vi)
To retrofit a WiFE system to a standard engine the following components need to be installed or replaced.
A Homogenizer unit, which heats the water and mixes it with fuel to form an emulsion prior injection, is to be installed. A presentation by MAN Diesel in 2006, estimated a cost of USD 400.000 investment cost excl. retrofit
on a 40.000 kW enginevi
. We estimate a 20% price increase from 2006 to 2012, this gives a USD / kW estimate
of approximately USD 12 / kW. If we include retrofitting costs but excl off-hire, we can expect an average cost per kW of USD 27 / kW. On the Aframax Tanker base case we estimated a retrofit time of 20 days with an off-hire rate of USD 20.000 / day, which increases the Cost per kW to USD 52 / kW.
Engine Power 40,000 kW
Emulsifier unit Cost & Slide Fuel valves USD 500,000
Cost per kW 13 USD / kW
Table 39, MAN Diesel: Emulsion Cost overview(vi)
A possible increase in fresh water (FW) storage capacity onboard, as standard FW generator cannot keep up with the FW consumption of the WiFE system thus additional FW is to be stored onboard.
Slide Fuel Valves are to replace the standard fuel valve (Fuel Injector), due to the more efficient atomization of the fuel and optimizing the combustion.. The cost of the New Slide Fuel Valves are included in the total cost as
per Table 39, MAN Diesel: Emulsion Cost overview(vi
).
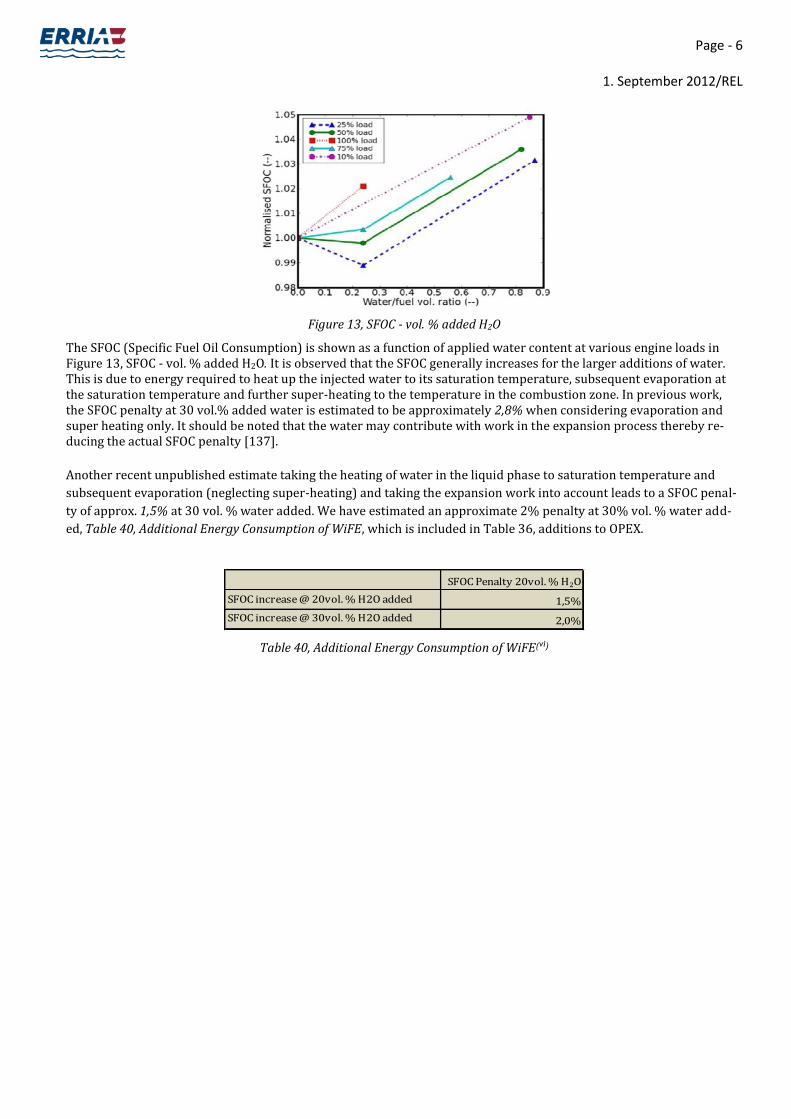
Page - 6
1. September 2012/REL
Figure 13, SFOC - vol. % added H2O
The SFOC (Specific Fuel Oil Consumption) is shown as a function of applied water content at various engine loads in Figure 13, SFOC - vol. % added H2O. It is observed that the SFOC generally increases for the larger additions of water. This is due to energy required to heat up the injected water to its saturation temperature, subsequent evaporation at the saturation temperature and further super-heating to the temperature in the combustion zone. In previous work, the SFOC penalty at 30 vol.% added water is estimated to be approximately 2,8% when considering evaporation and super heating only. It should be noted that the water may contribute with work in the expansion process thereby re-ducing the actual SFOC penalty [137].
Another recent unpublished estimate taking the heating of water in the liquid phase to saturation temperature and
subsequent evaporation (neglecting super-heating) and taking the expansion work into account leads to a SFOC penal-
ty of approx. 1,5% at 30 vol. % water added. We have estimated an approximate 2% penalty at 30% vol. % water add-
ed, Table 40, Additional Energy Consumption of WiFE, which is included in Table 36, additions to OPEX.
Table 40, Additional Energy Consumption of WiFE(vi)
SFOC Penalty 20vol. % H2O
SFOC increase @ 20vol. % H2O added 1,5%
SFOC increase @ 30vol. % H2O added 2,0%

Page - 7
1. September 2012/REL
Figure 14, WiFE Layout(vi)
Additional requirements and restrictions:
The WiFE application is still fairly new, thus little is known to the corrosive effects the water will have on the
fuel system, and other machinery related to the fuel system.
When operating on MGO instead of HFO emulsion, it is recommended to add additives to stabilize the emul-
sion.
The Installation is to comply with IMO Tier III requirements. The Engine Maker or equipment manufacturer
will test and issue certification.
Fresh water tank volume of up to 50% of the Fuel tank volume.
Possible installation of additional fresh water generators if Fresh water tank volume is limited.
No Polar restrictions, except for heating is required in the fresh water tanks and piping to avoid freezing.
No Classification Society restrictions.
5. LNG
Liquefied Natural Gas (LNG) is lighter than air and has a narrow flammability interval. It can be combusted in 2-stroke gas engines as Diesel Cycle and in 4-stroke, applying the Otto principle. 2-Stroke slow speed engines are generally only using diesel fuel as pilot fuel, (functioning on heat of compression and not with a spark plug). The 2-stroke engines can operate on diesel fuel only but at low loads, due to the fact that the pilot fuel valves are di-mensioned only for efficient operation between 1-20% diesel fuel, depending on engine load, when at low load opera-tion the pilot fuel ratio to LNG is approximately 5-20% but as the load increases the ratio drops to as low as 1%.

Page - 8
1. September 2012/REL
Figure 15, MAN ME-GI Dual Fuel Engines
Dual fuel 4-Stroke medium speed LNG engines are based upon the Otto technology. The primary fuel is natural gas but they are designed to operate interchangeably with diesel as a ‘pilot’ ignition source (functioning on heat of compres-sion and not with a spark plug). These engines can also operate on 100% diesel fuel. When idling these engines tend to operate on 100% diesel. As the engine begins to move to full load performance, an increasing amount of natural gas replaces the diesel fuel to 90% or more. This makes LNG engines especially valuable in circumstances where the use of natural gas is desired for environmental or economic reasons but if the natural gas supply is not available in all locations, the Engines can run on Pilot MGO. (2-Stroke Engines will only be able to run at approximately 50% load due to the Pilot fuel system only supplies 20% fuel) Generally the larger vessels with constant load and RPM use the 2-stroke LNG engines and the variable load vessels e.g. cruise liners, supply vessels and tugs will use the 4-Stroke Dual fuel engines, with Diesel Electric propulsion units for better efficiency. Exhaust gas emissions such as SOx and PM are negligible. LNG contains less carbon than fuel oils, re-ducing the CO2 emissions first and foremost from tank to propeller. Liquefied Natural Gas (LNG) is natural gas stored as liquid at -162°C. The predominant component is methane with some ethane and small amounts of heavy hydrocarbons.
Figure 16, LNG Installation on Harbour Tug and Cruise Liner (Rolls Royce & Wartsila)
The LNG tank volume is selected to give the AFRAMAX base case vessel half-round-trip endurance. This controls in-vestment costs but increases exposure to volatile fuel prices. Costs for LNG system include costs for the tanks, bunker station, gas preparation (cryogenic plant), gas line, main engine (Electronic controlled common rail (ME-B) Conver-sion). If the existing engine is an electronic controlled common rail engine (ME-B, RT-Flex), the cost saving could be up to 20%.

Page - 9
1. September 2012/REL
Figure 17, LNG Fuel Tank installation on a tanker vesselvii
Due to the low temperature, LNG has to be stored in cryogenic tanks. LNG storage tanks require double the space com-pared to traditional fuel oil tanks. For the AFRAMAX base case vessel, where the HFO capacity is approximately 1000m3, where the replacement LNG Capacity is estimated to 2000m3, in our Table 41, LNG Conversion Estimates. We have received estimates from MAN Diesel and GL(viii), for the construction cost of LNG tanks. Estimates from USD 1000/m3 - USD 5000/m3 for the LNG tanks. The AFRAMAX tanker LNG tank cost was estimated at USD 1000/m3 but becomes more costly if the tanks cannot be installed on the main deck. For example, Cruise liners, Container vessels, Bulk Carriers, LNG Tankers and Supply vessels will need more complicated shapes to fulfill space restrictions. The LNG Tank cost was estimated at USD 1500/m3. Some vessels will experience reduced cargo capacity in some cases, depend-ing on type of vessel, type of fuel tank and potential for adequate location of the LNG tanks on-board. LNG tanks are assumed to consume TEU slots on Container vessels, resulting in lost earnings, assumed only for every second voyage. The large-sized container vessels (8 500 TEU and 15 000 TEU) have losses with a maximum of about 1,5% of the total available TEU slots.
Figure 18, LNG layout onboard a Large Container vessel(ix)
A Cryogenic Plant is required to pump the LNG fuel from the fuel tanks at a pressure LNG has a high auto ignition tem-perature and therefore needs an additional ignition source, i.e. a pilot fuel, to ignite in combustion engines. Expected MGO consumption (pilot fuel) 1-5% & Cryogenic Plant fuel consumption penalty of 1,2%. We have used 2% percent for Pilot fuel consumption and a total fuel penalty of 3,2% in, Table 41, LNG Conversion Estimates. The Cryogenic Plant is reported by MAN Diesel to cost approximately USD 1.500.000 (for our base case AFRAMAX Tanker), which were used in Table 35...
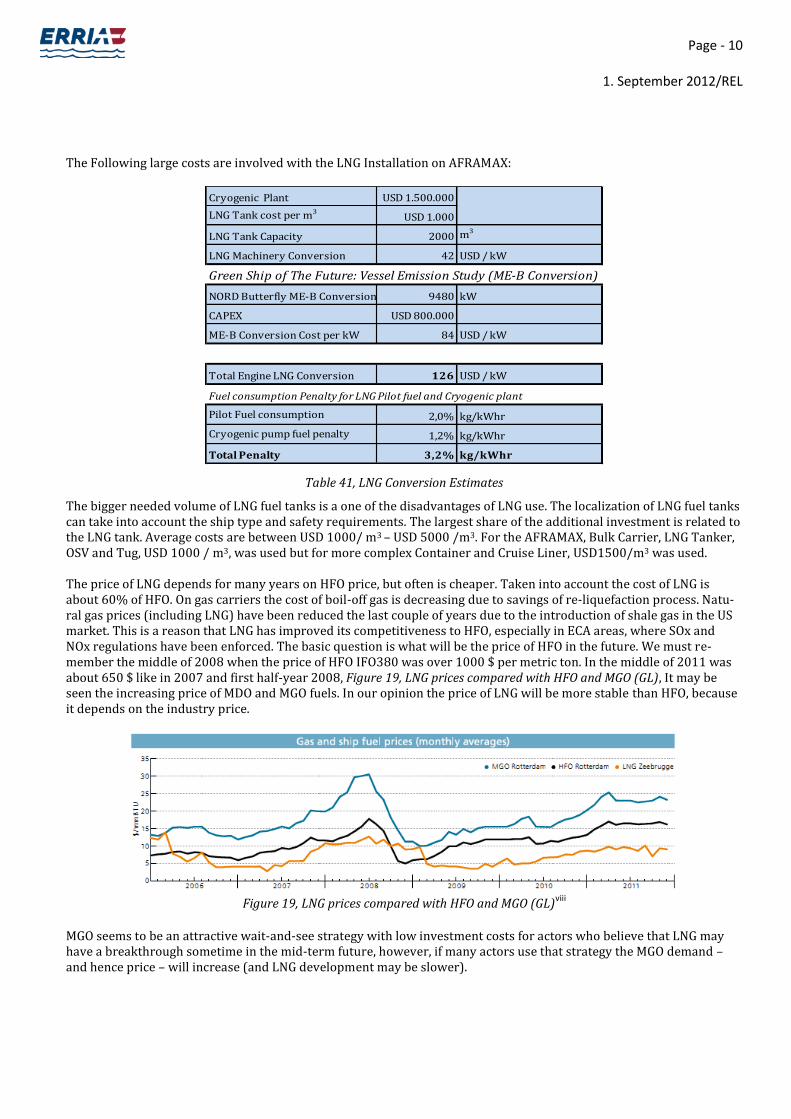
Page - 10
1. September 2012/REL
The Following large costs are involved with the LNG Installation on AFRAMAX:
Table 41, LNG Conversion Estimates
The bigger needed volume of LNG fuel tanks is a one of the disadvantages of LNG use. The localization of LNG fuel tanks can take into account the ship type and safety requirements. The largest share of the additional investment is related to the LNG tank. Average costs are between USD 1000/ m3 – USD 5000 /m3. For the AFRAMAX, Bulk Carrier, LNG Tanker, OSV and Tug, USD 1000 / m3, was used but for more complex Container and Cruise Liner, USD1500/m3 was used.
The price of LNG depends for many years on HFO price, but often is cheaper. Taken into account the cost of LNG is about 60% of HFO. On gas carriers the cost of boil-off gas is decreasing due to savings of re-liquefaction process. Natu-ral gas prices (including LNG) have been reduced the last couple of years due to the introduction of shale gas in the US market. This is a reason that LNG has improved its competitiveness to HFO, especially in ECA areas, where SOx and NOx regulations have been enforced. The basic question is what will be the price of HFO in the future. We must re-member the middle of 2008 when the price of HFO IFO380 was over 1000 $ per metric ton. In the middle of 2011 was about 650 $ like in 2007 and first half-year 2008, Figure 19, LNG prices compared with HFO and MGO (GL), It may be seen the increasing price of MDO and MGO fuels. In our opinion the price of LNG will be more stable than HFO, because it depends on the industry price.
Figure 19, LNG prices compared with HFO and MGO (GL)
viii
MGO seems to be an attractive wait-and-see strategy with low investment costs for actors who believe that LNG may have a breakthrough sometime in the mid-term future, however, if many actors use that strategy the MGO demand – and hence price – will increase (and LNG development may be slower).
Cryogenic Plant USD 1.500.000
LNG Tank cost per m3USD 1.000
LNG Tank Capacity 2000 m3
LNG Machinery Conversion 42 USD / kW
NORD Butterfly ME-B Conversion 9480 kW
CAPEX USD 800.000
ME-B Conversion Cost per kW 84 USD / kW
Total Engine LNG Conversion 126 USD / kW
Fuel consumption Penalty for LNG Pilot fuel and Cryogenic plant
Pilot Fuel consumption 2,0% kg/kWhr
Cryogenic pump fuel penalty 1,2% kg/kWhr
Total Penalty 3,2% kg/kWhr
Green Ship of The Future: Vessel Emission Study (ME-B Conversion)

Page - 11
1. September 2012/REL
Figure 20, Existing and planned production plants and LNG terminals in the SECA
Additional requirements and restrictions:
The IMO Interim Guidelines for gas as ship fuel (Resolution MSC.285 (86)) contain the state of the art on safety concepts for using gas as a ship fuel. These are voluntary to the flag states. GL (Germanische Lloyd) issued its own guidelines in April 2010, adding own interpretations. The IMO subcommittee BLG is working on the In-ternational Gas as Fuel Code (IGF) which will supersede the interim guidelines and which is planned to enter into force with the SOLAS 2014 edition. In parallel, work has started at ISO TC 67 on standards for LNG bun-kering
LNG supply is under rapid development in the SECA, Figure 20, Existing and planned production plants and
LNG terminals in the SECA, but is rarely available as bunker fuel outside of EU. Singapore is developing a large terminal for local land based supply, which could possibly be extended to Marine fuel supply, as it is one of the world’s largest bunker ports.
Other operational costs (OPEX), such as crew, spare parts and maintenance are assumed to be 10% higher than the
standard Fuel Oil fueled vessels. This cost is not included in the our Table 36, due to the complexity of OPEX calcula-
tions, e.g. different Nationalities, trade routes and Flag Registry.
Some vessels will experience reduced cargo capacity in some cases, depending on type of vessel, type of fuel tank and potential for adequate location of the LNG tanks on-board, due to the fact that LNG requires twice the space of Fuel Oil.
No polar restrictions.
6. HFO – Heavy Fuel Oil (Residual Fuel Oil) – MGO (Distillate Fuel):
Running on distillate fuels for a long period of time is the straight forward solution to comply with the forthcoming emissions regulations on maximum allowable sulphur content in the fuel oil and reduction of BC. There are two main challenges when running on MGO, Fuel viscosity and Main Engine Cylinder Lubrication(x). The fuel systems for engines, boilers and other machinery required to comply with above IMO regulations, would be recommended to have a cooler or a chiller arrangement fitted, to meet the fuel viscosity requirements for a safe opera-
Page - 12
1. September 2012/REL
tion of the engine’s fuel system. Vessel’s in the future will probably not experience problems running without a chiller due to the fact that engine and pump makers are designing their equipment to run on the lower viscosity fuels but it is not recommended, due increased wear on fuel systems. Cooling of the MGO is a not a straight forward solution since several parameters should be considered before deciding the appropriate method of cooling.
There are three methods that can cool the MGO in order to increase its viscosity to at least 3 cSt in order to be
handled by the pumps without leakages.
Cooling by sea water coolers
Cooling by refrigerating compressors of direct expansion connected by a cooler (Chosen solution for
our CAPEX)
Cooling using water chillers in connection with coolers.

Page - 13
1. September 2012/REL
Figure 21, MGO Chiller Plant Layout
Example 1:
When MGO 2 cSt @40°C is used and 3 cSt Viscosity is required the temperature is to be cooled to approximately 18°C.
Example 2:
MGO with viscosity of 3 cSt @ 40°C is entering the engines at 55°C. According to the curves the viscosity is then be-
tween 2 and 3 cSt, approximately 2,3 cSt.
Figure 22, Fuel Temperature vs. Viscosity
Depending on the installation, the viscosity of MGO should be minimum, 2-3cSt for optimal operation of fuel pumps and
fuel valves. The examples below refer to Figure 22, Fuel Temperature vs. Viscosity.
There is a correlation between Low sulphur fuels and BN or TBN (Base Number), thus when using low sulphur fuels
below 1% sulphur, the cylinder lubricaiton rate is to be lowers to the minimum dosage, recommended by engine mak-
ers, but if using BN 70, the liner would be overadditivated. Therefore Engine Makers recommend to change to low BN
cylinder Lub oils of BN 40-50 if using low sulphur fuels below 1% sulphur for prolonged periods of time. Automatic

Page - 14
1. September 2012/REL
cylinder feed rate regulating systems, e.g. Alfa Lubricator, are recommended on newer engines to regulate the dosage
automatically during different engine loads(x).
Figure 23, Use of BN40, BN50, BN60 and BN70 Cylinder oils
In the shipping field the following type of classification is used for fuel oils (http://en.wikipedia.org/wiki/Shipping):
CCAI and CII are two indexes which describe the ignition quality of residual fuel oil, and CCAI is especially often calcu-lated for marine fuels. Despite this marine fuels are still quoted on the international bunker markets with their maxi-mum viscosity (which is set by the ISO 8217 standard) due to the fact that marine engines are designed to use different viscosities of fuel. The unit of viscosity used is the cSt and the fuels most frequently quoted are listed below in order of cost, the least expensive first-
IFO 380 - Intermediate fuel oil with a maximum viscosity of 380 cSt (<3.5% sulphur)
LS 380 - Low-sulphur (<1.0%) intermediate fuel oil with a maximum viscosity of 380 cSt
MDO - Marine diesel oil.
MGO - Marine gasoil.
LSMGO - Low-sulphur (<0.1%) Marine Gas Oil - The fuel is to be used in EU community Ports and Anchorages. EU Sulphur directive 2005/33/EC
A Chiller unit costs approximately USD 70.000 for the AFRMAX, which is USD 4 /kW for the Chiller Unit. The calculated
cost per kW for the Chiller Unit and Installation is USD 13 / kW excluding the expected 10 Off-hire days. This price
could vary, depending on which system and maker is chosen.
HFO LS MGO LNG
2-Stroke 0,182 0,171 0,155 kg/kWhr
2-Stroke (de-rated) 0,171 0,161 0,145 kg/kWhr
4-Stroke 0,209 0,196 0,178 kg/kWhr
4-Stroke (de-rated) 0,196 0,185 0,167 kg/kWhr
SFOC (Specific Fuel Oil Consumption)

Page - 15
1. September 2012/REL
Table 42, Specific Fuel Oil Consumption
Due to the significantly higher cost of MGO compared to HFO, we have calculated the increase in running cost, with
MGO, compared to running the main engine on HFO in table 36, MGO has a higher Calorific value, which reduces the
SFOC as per Table 42, Specific Fuel Oil Consumption.
Additional requirements and restrictions:
Latest Emission Control Regulations - The International Maritime Organisation (IMO) The IMO Annex VI of MARPOL 73/78, Regulations for the Prevention of Air Pollution from Ships has been in force since May 2005. Thus, the SOx limit applies to all vessels in the category of ships with an engine power output of more than 130 kW. The general international limit on sulphur is reduced from 5% to 4.5% through the ISO 8217 fuel standard. IMO has specified that, in future, further limitations will be imposed on SOx as well as on other components in the exhaust gas. Figure 24, Sulphur Reduction 'road map' illustrates the IMO SOx limits or both ECAs (Emission Controlled Areas) and for international waters. CARB (California Air Resources Board) has introduced limits on the use of sulphur for MGO and MDO, respectively.
Figure 24, Sulphur Reduction 'road map'
No special requirements or regulations govern the use of Distillate fuels except that the fuels are to comply
with ISO 8217 standard. There are concerns regarding the safety of the use of distillate fuels (LS MGO) on oil
fire boilers
There exists a concern during a fuel changeover from HFO to distillate fuel (LS MGO) because the pipes and
other parts of the fuel oil pumping system are heated when using HFO. MGO flowing through the same hot pip-
ing may vaporize creating vapour locks and causing irregular fuel flow to injectors resulting in engine stop-
page. Therefore, MGO is not to be used through heated pipes to engines.
Distillate fuels (LS MGO) is rarely found in isolated ports and is often only available by truck, which at times is
a problem due to ISPS control at high profile ports.
Engine maker’s recommendation for an MGO chiller or cooling plant.
No restrictions by Classification Society
No Polar Restrictions

Page - 16
1. September 2012/REL
7. Exhaust Gas Scrubber: An EPA report from November 2011 (EPA-800-R_11_006)(xi) reports results of preliminary studies of Exhaust Gas Scrubber installations on 3 vessels. In November 2006, the Puget sound Clean Air Agency received funding from the EPA to evaluate whether a seawater scrubbing system could be successfully designed, retrofitted and operated with in the tight confines of an existing cruise vessel. In April 2007, Holland America Line installed a seawater scrubber in the stack of one of the five 9 MW diesel generators on the cruise ship MS Zaandam. We have investigated one recent exhaust gas scrubber systems installed in the DFDS Ro-Ro vessel, Facaria Seawaysxii,
as a retrofit option. We received an equipment quote from the Scrubber maker, Alfa Laval/Aalborg Industries xiii
for the
base case vessel, AFRAMAX tanker with a total motor effect of 15.840 kW. The quote for the equipment alone is EUR 2.510.000, ≈ USD 3.162.600, (EUR – USD exchange rate ≈ 1,26)(xiii) excluding installation and off-hire at a Shipyard. We estimated a retrofit time of 30 days for each type of vessel. After researching the average costs of the equipment, are we able to confirm that an average USD / kW price can be used to scale the price of the equipment linearly according to the Power requirement for the specific vessel. The Table 45, Cost per kW, for the Scrubber is USD 330 /kW – excl. off-hire and dry docking, which would be a typical newbuilding cost and USD 368 / kW – incl. off-hire and dry docking, which would be a retrofit case.
Figure 25, External Exhaust Gas Scrubber
NaOH can be supplied as a 50% solution by tanker trucks at most major ports around the world, as it is used in many industries to produce paper, soap, detergents etc. The vessel can be supplied with large 5m3 IBC containers with heat insulation. NaOH flakes or pellets can also be supplied, where the crew will manually have to blend the dry product with water onboard. This option is not recommended to avoid spillage and human contact.
Figure 26, Alfa Laval Scrubber installation on DFDS RoRo

Page - 17
1. September 2012/REL
AFRAMAX – Installation layout of Scrubber
Option 1: NaOH bags
Option 2: 50% NaOH solution

Page - 18
1. September 2012/REL
Freshwater mode (FW): While operating in FW mode, the scrubber recycles freshwater in which sodium hydroxide (NaOH) is continuously added in order to balance pH at a slightly alkaline value.
A 167 kWxiv
pump has been estimated on the base case, AFRAMAX, to supply water to the scrubber. At full engine load
(90% MCR, 16,000kW), this corresponds to max 1 % of the engine power. The scrubber is causing an additional back
pressure of up to 30 mbar, which will also cause some additional energy consumption on the main engine. The addi-
tional energy consumption associated with the scrubber back pressure is within the uncertainties of the engine per-
formance measurements – this is difficult to measure but estimated to 0,4 % by MAN Diesel & Turboxiv
, Table 43, Fuel
consumption Penalty for Scrubber. In FW mode, energy for producing NaOH must also be taken into account. NaOH can
be produced by several methods; most common is Diaphragm Cell Electrolysis, which requires 5000 kWh/ton. This
corresponds to a 2 % emissions penalty of energy in the HFO, Table 43, Fuel consumption Penalty for Scrubber. The
consumption of NaOH at 90%MCR of the Main Engine on the base case AFRAMAX, is estimated to 265 Ltr/hrxiv @ an
average cost of USD 9 / Litre. This cost including the Additional Energy Consumption can be seen in Table 36. The con-
sumption will most probably be reduced from 90% MCR, due to vessel operating at reduced RPM (15-40% MCR).
Seawater mode (SW) While operating in SW mode, the scrubber uses the natural alkalinity of seawater to absorb and bind the SOX from the exhaust gas, thus no NaOH is needed for in the scrubbing process. There is an increase SW requirement through the
scrubber in SW mode requiring 206kW pumpsxiv
. This increases the power requirement to 1,2% of the engine power.
Table 43, Fuel consumption Penalty for Scrubberxiv
Additional requirements and restrictions: An Exhaust Gas Scrubber requires significant space onboard, depending on engine output. Retrofitting chal-
lenges are to be expected on smaller vessels and vessels with restricted space in the funnel casing, e.g. tugs, fishing vessels, cruise liners and container feeder vessels etc.
Special precautions should be taken when sailing to Polar Regions where temperatures could drop below freezing point. Heating Elements are to be installed into the fresh water tanks and heat tracing cabling in-stalled around all fresh water piping to avoid pipe bursts under extreme sub-zero conditions. The below instal-lation picture is not recommended in Polar Operation areas, due to exposure to the elements. The NaOH, is re-quired to be kept above 18°C, to avoid crystallization. NaOH is not to be stored in Aluminium containers to avoid a violent reaction. It is recommended that crew is made aware of the dangers of NaOH before any opera-tion.
MEPC 184(59) – 2009 Guidelines for Exhaust Gas Cleaning Systemsxv specifies the requirements for the test, certification and in-service verification of SOX scrubbing systems. The Guidelines apply to any SOx scrubber fit-ted to fuel oil combustion machinery (excluding incinerators) as an alternative method of compliance with An-nex VI, Regulation 14. There are two schemes available: Scheme A under which the SOx scrubber is subject to initial certification of SOx reduction performance fol-lowed by continuous monitoring of operating parameters and a daily spot check of emissions performance; or Scheme B in which there is no requirement for initial certification, but continuous emissions monitoring using an approved system and a daily spot check of operating parameters are required.
Currently the EC only accepts continuous emissions monitoring and the US Coastguard also appears to be pre-
disposed to continuous emissions monitoring. Each ship fitted with a scrubbing system will require a SOX Emissions Compliance Plan (SECP). The plan, prepared by the ship operator, must demonstrate how the ship in
SW Scrubbing FW Scrubbing
Pumps 1,2% 1,0%
Engine back pressure 0,4% 0,4%
NaOH production emmsions penalty 0 2%
Total 1,6% 3,4%

Page - 19
1. September 2012/REL
its entirety will comply with Regulation 14 and must be approved by the administration. It is required to cover all fuel oil combustion units on the ship, whether fitted with scrubbers or not.
8. Diesel Particle Filter (DPF)
A well known Japanese Shipping Line have started preliminary tests of a DPF on a 2-Stroke engine in November 2011xvi, and the DPF system has already operated smoothly for over 500 hours. With research support from the Japa-nese Classification Society, they have jointly developed a DPF system for marine diesel engines, which run on C heavy oil. The use of particle filters in Inland waterway vessels and Highway Trucks have been very successful.
A paper by Eelco den Boer, ‘Emissions from the Legacy Fleet’xvii, estimates the installation cost of DPF on inland water-way vessels. The Estimated CAPEX cost was reported EUR 50 / kW ≈ USD 63 /kW, (EUR – USD exchange rate ≈ 1,26) and the CAPEX including installation costs for a typical retrofit case would be EUR 110 / kW ≈ USD 139 / kW (EUR – USD exchange rate ≈ 1,26).
Figure 27, DPF (Diesel Particle Filter)xviii
This system incorporates a filter that relies on silicon carbide ceramic fibers. The filter collects particulate matter (PM) when exhaust gas goes through it. It is also a self-cleaning system that automatically combusts and eliminates PM buildup in the filter. This allows for continual operation without clogging of the filter, and requires no maintenance by seafarers. The test is scheduled for about one year (operating time: about 4,000 hours) to verify the system’s PM collec-tion performance. After that, its durability will be assessed. We estimate an additional energy penalty, due to exhaust
back pressure, to be approximately 0,4% of Shaft Powerxviii
.
Additional requirements and restrictions: The down side of the DPF solution is that it requires a lot of space, approximately two or three times en-
gine volume. This is not a problem with Inland waterway vessels, with small engine capacity but is a chal-lenge on the large commercial vessels with 2-Stroke Engines or cruise vessels. Installation is recommend-

Page - 20
1. September 2012/REL
ed in the design phase of the Newbuilding vessels, as the size of the installation can be taken into consider-ation when designing the Engine Room, exhaust trunking and funnel casing.
No Classification Society Restrictions No Polar Restrictions.

Page - 21
1. September 2012/REL
80.000 – 120.000 DWT
Length 245 m
Beam 34 m
Draft 20 m
Cargo 120.000 m3
Power 16.000 kW
AFRAMAX
120.000 – 180.000 DWT
Length 350 m
Beam 56 m
Draft 15.5 m
Cargo 156.000 m3
Power 85.000 kW
10 000 – 13 000 TEU CONTAINER VESSEL
150.000 – 180.000 DWT
Length 280 m
Beam 43 m
Draft 18 m
Cargo 175.000 m3
Power 15.000 kW
CAPE SIZE BULK CARRIER
75.000 – 80.000 DWT
Length 345 m
Beam 53.8 m
Draft 12 m
Cargo 162.000 m3
Power 22.000 kW
VLGC – VERY LARGE GAS CARRIER
120.000 – 150.000 DWT
Length 345 m
Beam 45 m
Draft 10 m
Power 75.000 kW
OCEAN LINER
VLGC – VERY LARGE GAS CARRIER
AFRAMAX
CAPE SIZE BULK CARRIER
OSV/AHTS
TUG
200 - 500 DWT
Length 36 m
Beam 11 m
Draft 3-4 m
Power 6.100 kW
3.000 – 8.000 DWT
Length 90 m
Beam 21 m
Draft 7,5 m
Power 16.000 kW
OSV/AHTS
Table 44, Classification of Vessels
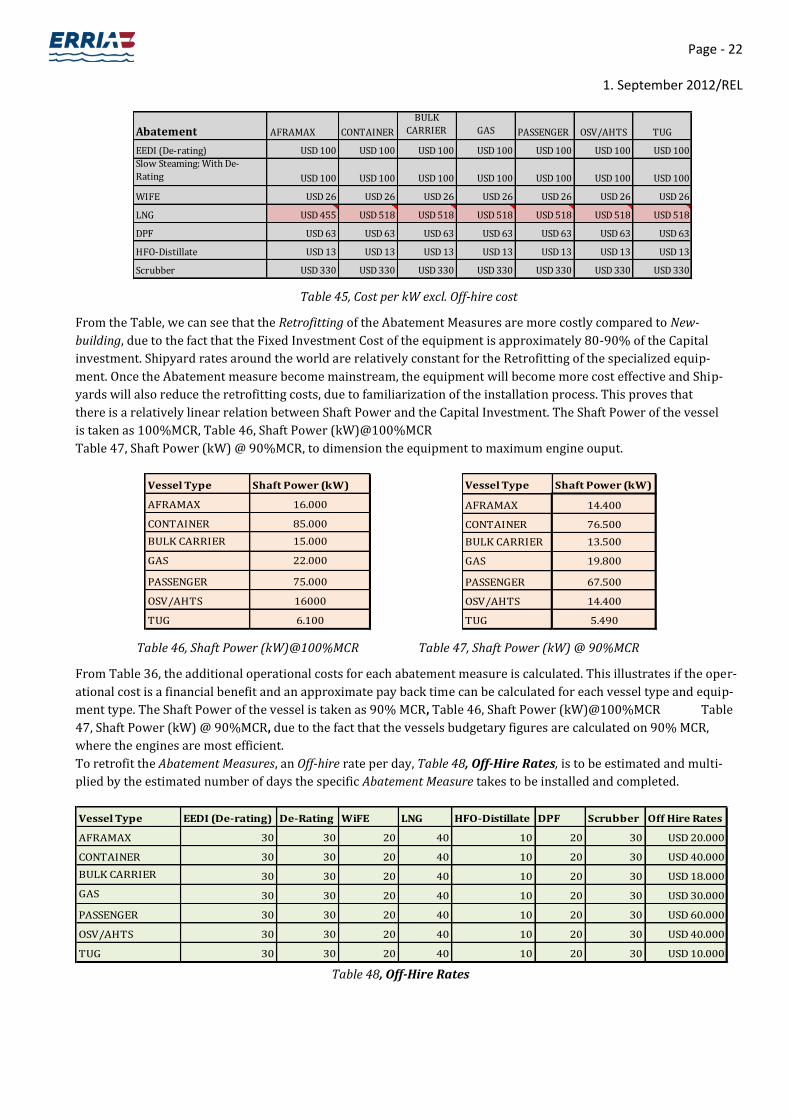
Page - 22
1. September 2012/REL
Table 45, Cost per kW excl. Off-hire cost
From the Table, we can see that the Retrofitting of the Abatement Measures are more costly compared to New-
building, due to the fact that the Fixed Investment Cost of the equipment is approximately 80-90% of the Capital
investment. Shipyard rates around the world are relatively constant for the Retrofitting of the specialized equip-
ment. Once the Abatement measure become mainstream, the equipment will become more cost effective and Ship-
yards will also reduce the retrofitting costs, due to familiarization of the installation process. This proves that
there is a relatively linear relation between Shaft Power and the Capital Investment. The Shaft Power of the vessel
is taken as 100%MCR, Table 46, Shaft Power (kW)@100%MCR
Table 47, Shaft Power (kW) @ 90%MCR, to dimension the equipment to maximum engine ouput.
Table 46, Shaft Power (kW)@100%MCR Table 47, Shaft Power (kW) @ 90%MCR
From Table 36, the additional operational costs for each abatement measure is calculated. This illustrates if the oper-
ational cost is a financial benefit and an approximate pay back time can be calculated for each vessel type and equip-
ment type. The Shaft Power of the vessel is taken as 90% MCR, Table 46, Shaft Power (kW)@100%MCR Table
47, Shaft Power (kW) @ 90%MCR, due to the fact that the vessels budgetary figures are calculated on 90% MCR,
where the engines are most efficient.
To retrofit the Abatement Measures, an Off-hire rate per day, Table 48, Off-Hire Rates, is to be estimated and multi-
plied by the estimated number of days the specific Abatement Measure takes to be installed and completed.
Table 48, Off-Hire Rates
Abatement AFRAMAX CONTAINER
BULK
CARRIER GAS PASSENGER OSV/AHTS TUG
EEDI (De-rating) USD 100 USD 100 USD 100 USD 100 USD 100 USD 100 USD 100
Slow Steaming: With De-
Rating USD 100 USD 100 USD 100 USD 100 USD 100 USD 100 USD 100
WIFE USD 26 USD 26 USD 26 USD 26 USD 26 USD 26 USD 26
LNG USD 455 USD 518 USD 518 USD 518 USD 518 USD 518 USD 518
DPF USD 63 USD 63 USD 63 USD 63 USD 63 USD 63 USD 63
HFO-Distillate USD 13 USD 13 USD 13 USD 13 USD 13 USD 13 USD 13
Scrubber USD 330 USD 330 USD 330 USD 330 USD 330 USD 330 USD 330
Vessel Type Shaft Power (kW)
AFRAMAX 16.000
CONTAINER 85.000
BULK CARRIER 15.000
GAS 22.000
PASSENGER 75.000
OSV/AHTS 16000
TUG 6.100
Vessel Type Shaft Power (kW)
AFRAMAX 14.400
CONTAINER 76.500
BULK CARRIER 13.500
GAS 19.800
PASSENGER 67.500
OSV/AHTS 14.400
TUG 5.490
Vessel Type EEDI (De-rating) De-Rating WiFE LNG HFO-Distillate DPF Scrubber Off Hire Rates
AFRAMAX 30 30 20 40 10 20 30 USD 20.000
CONTAINER 30 30 20 40 10 20 30 USD 40.000
BULK CARRIER 30 30 20 40 10 20 30 USD 18.000
GAS 30 30 20 40 10 20 30 USD 30.000
PASSENGER 30 30 20 40 10 20 30 USD 60.000
OSV/AHTS 30 30 20 40 10 20 30 USD 40.000
TUG 30 30 20 40 10 20 30 USD 10.000
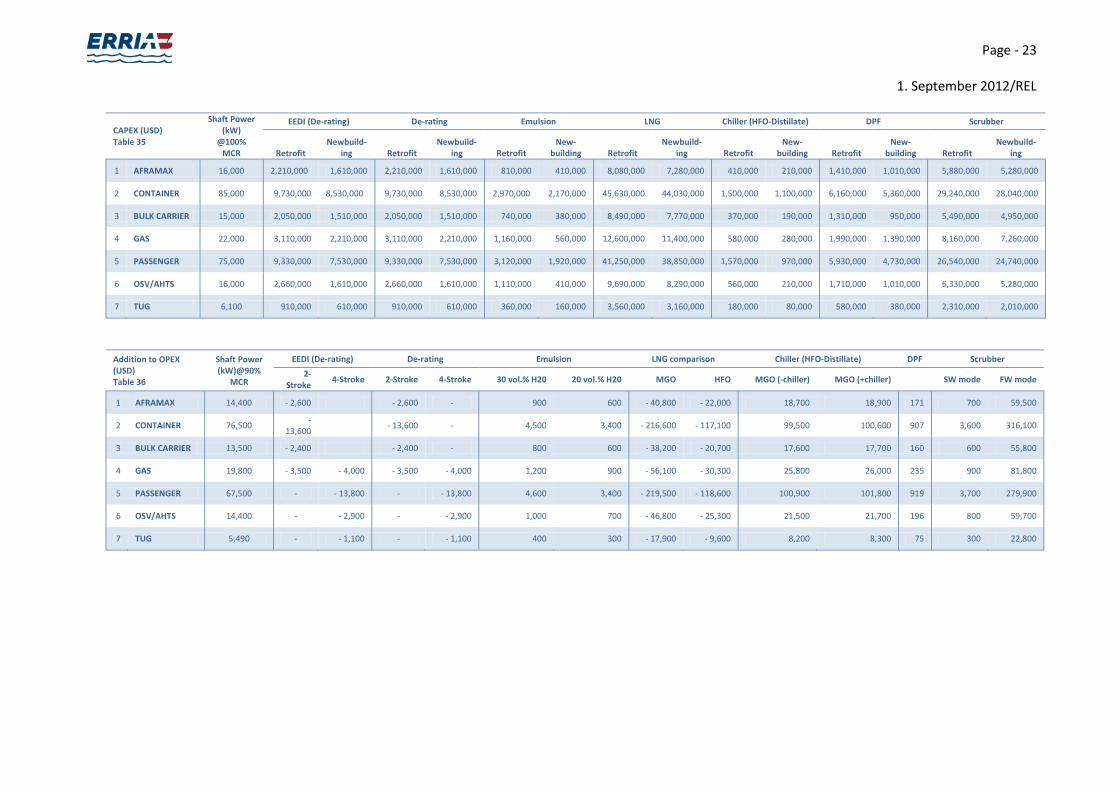
Page - 23
1. September 2012/REL
CAPEX (USD) Table 35
Shaft Power (kW)
@100% MCR
EEDI (De-rating) De-rating Emulsion LNG Chiller (HFO-Distillate) DPF Scrubber
Retrofit Newbuild-
ing Retrofit Newbuild-
ing Retrofit New-
building Retrofit Newbuild-
ing Retrofit New-
building Retrofit New-
building Retrofit Newbuild-
ing
1 AFRAMAX 16,000 2,210,000 1,610,000 2,210,000 1,610,000 810,000 410,000 8,080,000 7,280,000 410,000 210,000 1,410,000 1,010,000 5,880,000 5,280,000
2 CONTAINER 85,000 9,730,000 8,530,000 9,730,000 8,530,000 2,970,000 2,170,000 45,630,000 44,030,000 1,500,000 1,100,000 6,160,000 5,360,000 29,240,000 28,040,000
3 BULK CARRIER 15,000 2,050,000 1,510,000 2,050,000 1,510,000 740,000 380,000 8,490,000 7,770,000 370,000 190,000 1,310,000 950,000 5,490,000 4,950,000
4 GAS 22,000 3,110,000 2,210,000 3,110,000 2,210,000 1,160,000 560,000 12,600,000 11,400,000 580,000 280,000 1,990,000 1,390,000 8,160,000 7,260,000
5 PASSENGER 75,000 9,330,000 7,530,000 9,330,000 7,530,000 3,120,000 1,920,000 41,250,000 38,850,000 1,570,000 970,000 5,930,000 4,730,000 26,540,000 24,740,000
6 OSV/AHTS 16,000 2,660,000 1,610,000 2,660,000 1,610,000 1,110,000 410,000 9,690,000 8,290,000 560,000 210,000 1,710,000 1,010,000 6,330,000 5,280,000
7 TUG 6,100 910,000 610,000 910,000 610,000 360,000 160,000 3,560,000 3,160,000 180,000 80,000 580,000 380,000 2,310,000 2,010,000
Addition to OPEX (USD) Table 36
Shaft Power (kW)@90%
MCR
EEDI (De-rating) De-rating Emulsion LNG comparison Chiller (HFO-Distillate) DPF Scrubber
2-Stroke
4-Stroke 2-Stroke 4-Stroke 30 vol.% H20 20 vol.% H20 MGO HFO MGO (-chiller) MGO (+chiller)
SW mode FW mode
1 AFRAMAX 14,400 - 2,600 - 2,600 - 900 600 - 40,800 - 22,000 18,700 18,900 171 700 59,500
2 CONTAINER 76,500 -
13,600 - 13,600 - 4,500 3,400 - 216,600 - 117,100 99,500 100,600 907 3,600 316,100
3 BULK CARRIER 13,500 - 2,400 - 2,400 - 800 600 - 38,200 - 20,700 17,600 17,700 160 600 55,800
4 GAS 19,800 - 3,500 - 4,000 - 3,500 - 4,000 1,200 900 - 56,100 - 30,300 25,800 26,000 235 900 81,800
5 PASSENGER 67,500 - - 13,800 - - 13,800 4,600 3,400 - 219,500 - 118,600 100,900 101,800 919 3,700 279,900
6 OSV/AHTS 14,400 - - 2,900 - - 2,900 1,000 700 - 46,800 - 25,300 21,500 21,700 196 800 59,700
7 TUG 5,490 - - 1,100 - - 1,100 400 300 - 17,900 - 9,600 8,200 8,300 75 300 22,800

Page - 24
1. September 2012/REL
The first set of columns, Table 49, Index Summary of the Short List BC Abatement Option for 2-Stroke Engines,
under Relevance, are divided into Retrofit and New Building, which is illustrating if the specific abatement measure
is possible on the different type of vessels. Following relevance is the engine types, e.g. 2-Stroke or 4-Stroke. Ap-
proximately 90% of the world commercial fleet uses 2-stroke engines for propulsion, and due to propulsion power
requirement for 90-98% of all power consumption onboard, all other consumers are negligible, except for in Table
7, where 4-Stroke engines are the main source of power for propulsion.
The second set of columns Table 15, Index Summary of the Short List BC Abatement Option for 2-Stroke En-
gineTable 49, Index Summary of the Short List BC Abatement Option for 2-Stroke Engines under Cost Index, are
divided into Retrofit and New Building. This is due to the cost implications involved when retrofitting the abate-
ment options e.g. Dry Docking, Off-hire, Classification Society, Design, Machinery Modification, Additional
steel/piping/cabling etc. When designing and installing the abatement measures from the New Building stage, a
considerable cost saving is found and recommended. The Cost Index varies considerably between vessel classes
due to the large variances in Shaft Power and Off-hire rates. E.g. due to the minimum available knowledge of the
daily charter rate for a cruise liner, we estimated a rate of USD 60.000 / day.
The third set of columns, Table 49, Index Summary of the Short List BC Abatement Option for 2-Stroke Engines
under Reduction Index, The Reduction Index is summarising all emissions, which are being discussed during this
report, e.g. NOx, SOx, Black Carbon, CO2 etc. The reduction of emissions is directly related to the Fuel Consumption
of each vessel type, which in turn is related to the Shaft Power. There could be a minor improvement in reducing
emissions from New building stage compared to Retrofit, but the difference is very small and thus negligible.
(1) 90% of the Commercial bulk fleet use 2-stroke engines, so the 4-stroke engines are not relevant in our estimates
except for Gas vessels and Ocean Liners. (2)De-Rating of 4-stroke medium speed engines usually requires the engines to be replaced. Only during the New
Building design phase will this be viable. (3)Diesel Particle filters are being tested on inland water way vessels but the technology needs to mature to gain more experiences and data. (4) De-Rating & slow steaming has been taken as the most cost effective way to reduce the EED Index. (5) 2-Stroke engines are not possible on Ocean Passenger Liners, Supply vessels and tugs. (6) Retrofit of de-rated propulsion plants for 4-stroke engines is not an option due to the complete propulsion plant
needs replacement and pay-back time is not realistic. De-Rated engines are an option in the design phase of a New
Building Slow Steaming is an option with 4-stroke propulsion, as most Ocean Liners, Supply vessels and tugs as
Diesel-Electric driven. This gives the vessel flexibility to reduce number of generators. (7) LNG retrofit for Tugs is not possible due to the space requirement. If the vessel is designed to accommodate the
LNG tanks, then the system can be incorporated.
If the abatement option Cost or Reduction Index per comparative vessel exceeds the AFRAMAX tanker, the
specific Index will exceed Index 100 and vice versa if the Cost or Reduction Index is less.

Page - 25
1. September 2012/REL
25
Table 49, Index Summary of the Short List BC Abatement Option for 2-Stroke Engines
AFRAMAX TANKER
Relevance Cost Index
Retrofit New Building
Retrofit New Building
2-Stroke 4-Stroke 2-Stroke 4-Stroke
EEDI (4) -(1) (4) -(1) 100(4) 71(4)
Slow Steaming: with De-Rating -(1) -(1) 100 71
Water-in-Fuel Emulsion -(1) -(1) 100 48
LNG -(1) -(1) 100 89
HFO-Distillate -(1) -(1) 100 71
Diesel Particle filters (3) -(1) (3) -(1) 100(3) 69(3)
Scrubbers-High Sulphur -(1) -(1) 100 90
13000-15000 TEU CONTAINER VESSEL
Relevance Cost Index

Page - 26
1. September 2012/REL
26
Retrofit New Building
Retrofit New Building
2-Stroke 4-Stroke 2-Stroke 4-Stroke
EEDI (4) -(1) (4) -(1) 433(4) 530(4)
Slow Steaming: with De-Rating -(1) -(1) 433 530
Water-in-Fuel Emulsion -(1) -(1) 358 530
LNG -(1) -(1) 561 605
HFO-Distillate -(1) -(1) 440 536
Diesel Particle filters (3) -(1) (3) -(1) 429(3) 530(3)
Scrubbers-High Sulphur -(1) -(1) 494 531
CAPE SIZE BULK CARRIER
Relevance Cost Index
Retrofit New Building
Retrofit New Building
2-Stroke 4-Stroke 2-Stroke 4-Stroke

Page - 27
1. September 2012/REL
27
VLGC (VERY LARGE GAS CARRIER)
Relevance Cost Index
Retrofit New Building
Retrofit New Building
2-Stroke 4-Stroke 2-Stroke 4-Stroke
EEDI (4) (4) (4) (4) 141(4) 137(4)
Slow Steaming: with De-Rating 141 137
EEDI (4) -(1) (4) -(1) 93(4) 944)
Slow Steaming: with De-Rating -(1) -(1) 93 94
Water-in-Fuel Emulsion -(1) -(1) 92 95
LNG -(1) -(1) 105 107
HFO-Distillate -(1) -(1) 93 94
Diesel Particle filters (3) -(1) (3) -(1) 92(3) 93(3)
Scrubbers-High Sulphur -(1) -(1) 93 94

Page - 28
1. September 2012/REL
28
Water-in-Fuel Emulsion 144 138
LNG 156 157
HFO-Distillate 141 138
Diesel Particle filters (3) (3) (3) (3) 141(3) 137(3)
Scrubbers-High Sulphur 139 137
Table 50, Index Summary of the Short List BC Abatement Option for 4-Stroke Engines
OCEAN LINER
Relevance Cost Index
Retrofit New Building
Retrofit New Building
2-Stroke 4-Stroke 2-Stroke 4-Stroke
EEDI -(5) (4) -(5) (4) 419(4) 341(4)
Slow Steaming: with De-Rating -(5) (2) -(5) 419 (2) 341
Water-in-Fuel Emulsion -(5) -(5) 381 468

Page - 29
1. September 2012/REL
29
LNG -(5) -(5) 508 534
HFO-Distillate -(5) -(5) 423 472
Diesel Particle filters -(5) (3) -(5) (3) 416(3) 467(3)
Scrubbers-High Sulphur -(5) -(5) 450 469
OSV/AHTS
Relevance Cost Index
Retrofit New Building
Retrofit New Building 2-Stroke 4-Stroke 2-Stroke 4-Stroke
EEDI -(5) (4) -(5) (4) 122(4) 100(4)
Slow Steaming: with De-Rating -(5) (2) -(5) 122 (2) 100
Water-in-Fuel Emulsion -(5) -(5) 139 100
LNG -(5) -(5) 121 114
HFO-Distillate -(5) -(5) 121 100

Page - 30
1. September 2012/REL
30
Diesel Particle filters -(5) (3) -(5) (3) 123(3) 100(3)
Scrubbers-High Sulphur -(5) -(5) 108 100
TUG
Relevance Cost Index
Retrofit New Building
Retrofit New Building
2-Stroke 4-Stroke 2-Stroke 4-Stroke
EEDI -(5) -(5) 41 38
Slow Steaming: with De-Rating -(5) (2) -(5) 41(2) 38
Water-in-Fuel Emulsion -(5) -(5) 44 38
LNG -(5) (7) -(5) 44(7) 43
HFO-Distillate -(5) -(5) 41 38
Diesel Particle filters -(5) (3) -(5) (3) 42(3) 38(3)
Scrubbers-High Sulphur -(5) -(5) 39 38

Page - 31
1. September 2012/REL
31
We have based our comparative index, Table 49, Index Summary of the Short List BC Abatement
Option for 2-Stroke Engines, on an AFRAMAX tanker. We have given all the abatement options
Index 100, for this vessel. All the following vessels that have similar Length/Breadth dimensions
are given a calculated Index based on our AFRAMAX tanker.
We have calculated an average Cost and Reduction Index, Table 49, Index Summary of the Short
List BC Abatement Option for 2-Stroke Engines, for each vessel, based on Shaft Power (kW aver-
age), If the comparative vessel has an increased power requirement, then the Cost Index, is di-
rectly proportional to the power, Table 31 and 32.

Page - 32
1. September 2012/REL
32
References for appendix E:
i Kristensen HO, et al. (2012) Energy Efficiency Design Index Regulations from IMO (MEPC), Latest update – January 2012
ii MAN Diesel, (2012) Improved Efficiency and Reduced CO2
iii Lloyd’s Register, (2012) MARPOL Annex VI – Approved Method (http://www.lr.org/compliance/codes/203236-MARPOLAnnexVIApprovedMethod.aspx) iv MEPC.1/Circ.678 (2009), DEFINITIONS FOR THE COST EFFECTIVENESS FORMULA IN REGULATION 13.7.5 OF THE REVISED MARPOL ANNEX VI v Andreasen A (MAN Diesel) & Nyggard KB (Danisco) (2011), Danish Ministry of the Environment (Water-in-fuel emulsion as marine engine fuel for reduced NOx and particulate emissions -Environmental Project No. 1380 2011) vi MAN Diesel (2006), Faster Freight Cleaner Air vii Wartsila Technical Journal (2012), LNG Conversions for Marine Installations viii Germanischer Lloyd & MAN Diesel (2012), Cost and benefits of LNG as ship fuel for container vessels ix DSME, DSME Green Ship Technology is Certified by Classifications. (http://www.dsme.co.kr/epub/ds/td/dstd030Q.do?dt_type=etod&dt_seq_no=2604¤tPageNo=1) x MAN Diesel, Operation on Low-Sulphur Fuels xi United States Environmental Protection Agency (2011), Exhaust Gas Scrubber Wastewater Effluent (Report # EPA-800-R-11-006) xii Hansen JP Ph.D. Chem. Eng. (2012), Alfa Laval & Danish Ministry of the Environment (Exhaust Gas Scrubber Installed Onboard MV Ficaria Seaways
xiii Alfa Laval (2012), Budgetary Quotation for PureSOx xiv Alfa Laval (2012), Technical Specification – PureSOx comb 128-Multiple inlet-Hybrid System xv MEPC 184(59) – 2009 Guidelines for Exhaust Gas Cleaning Systems

Page - 33
1. September 2012/REL
33
xvi Mitsui O.S.K Lines (MOL) (2010), MOL Develops Marine Use Diesel Particulate Fil-ter xvii den Boer E (2011), (CE Delft) ‘Emissions from the Legacy Fleet’ xviii Korean Register (KR) (2010), Energy & Environmental Business Center