![[PPT]Three-Phase Bridge Rectifier - Welcome - Faculty … · Web viewTitle Three-Phase Bridge Rectifier Author Robert C Helgeland Last modified by Owner Created Date 2/12/2006 8:50:03](https://static.fdocuments.net/doc/165x107/5b2f9a327f8b9a55208d07cb/pptthree-phase-bridge-rectifier-welcome-faculty-web-viewtitle-three-phase.jpg)
DTIC investigation has been performed for ... with each part fed from an individual 3-phase bridge...
32
AD-A204 998 2a. SECURITY CLASSIFICATION AUTHORITY 3 05S r.?iBU TION/ AVAILAILITY OF REPORT 2b- DECLASSICATIONI DOWNGRADING SCHEDULE Unclassified unlimited 4 PERFORMING ORGANIZATION REPORT NUMBER(S) 5 MONITORING ORGANIZATION REPORT NUMBER(S) 6a NAME OF PERFORMING ORGANIZATION 6bOFFICE SYMBOL 7a NAME OF MONITORING ORGANIZATION EG &G (if applicable) Naval Sea Systems Command I______ qgpn Pms-4091 6c. ADDRESS (City, State, and ZIP Code) lb ADDRESS (City, State, and ZIP Code) !ockville, MD 20850 Washington, D.C. 20362 Ba. NAME OF FUNDING/ SPONSORING 8b. OFFICE SYMBOL 9 PROCUREMENT INSTRUMENT IDENTIFICATION NUMBER ORGANIZATION (if applicable) NAVSEA 1 660F N00024-79-6379 B. ADDRESS (City, State, and ZfP Code) 10 SOURCE OF FUNDING NUMBERS Washington,D.C. 20362 PROGRAM PROJECT TASK WORK UNIT IELEMENT NO INO. NO. ACCESSION NO. 11 TITLE (include Security Classification) Reduction of Line Current Harmonics in 3-phase off-line rectifier systel by ~'eof a efficient 3-phase to 9-phase autotransformer conversion Tec ique 12 PERSONL AUTHOR(S) Williams, Michael L 13a TYPE OF REPORT 13b TIME COVERED 14. DATE OF REPORT ( Year, Month, Day) 15 PAGE COUNT rir -FROM __ __TO ___ 79-04-12 31 16 SUPPLEMENTARY NOTATION draft report 17 COSATI CODES 18B. SUBJECT TERMS (Continue on reverse if necessary and identify by block number) FIELD GROUP SUB-GROUP harmonics, 3-phase of line 19. ABSTRACT (Continue on reverse if necessary and identify by block number) DTIC ELT 20 DISTRIBU TION I'AVAILABILI1TY OF ABS TRAC T ~21 ABSTRACT SECURITY CLASSIFICATION P UNCLASSIFIED'UNLIMITED 0 SAME AS RPT El DTIC USERS 22a NAME OF RESPONSIBLE INDIVIDUAL 22b TELEPHONE (Include Area Code) 22c OFFICE SYMROL Mr. Archer 1 746-0019 1CI QAQ DD Form 1473. JUN 86 Previous editions are obsolete __SECURTY CLASSIFICATION OF S S 89 2 6 116
Transcript of DTIC investigation has been performed for ... with each part fed from an individual 3-phase bridge...

AD-A204 998
2a. SECURITY CLASSIFICATION AUTHORITY 3 05S r.?iBU TION/ AVAILAILITY OF REPORT
2b- DECLASSICATIONI DOWNGRADING SCHEDULE Unclassified unlimited
4 PERFORMING ORGANIZATION REPORT NUMBER(S) 5 MONITORING ORGANIZATION REPORT NUMBER(S)
6a NAME OF PERFORMING ORGANIZATION 6bOFFICE SYMBOL 7a NAME OF MONITORING ORGANIZATION
EG &G (if applicable) Naval Sea Systems CommandI______ qgpn Pms-4091
6c. ADDRESS (City, State, and ZIP Code) lb ADDRESS (City, State, and ZIP Code)
!ockville, MD 20850 Washington, D.C. 20362
Ba. NAME OF FUNDING/ SPONSORING 8b. OFFICE SYMBOL 9 PROCUREMENT INSTRUMENT IDENTIFICATION NUMBERORGANIZATION (if applicable)
NAVSEA 1 660F N00024-79-6379B. ADDRESS (City, State, and ZfP Code) 10 SOURCE OF FUNDING NUMBERS
Washington,D.C. 20362 PROGRAM PROJECT TASK WORK UNIT
IELEMENT NO INO. NO. ACCESSION NO.
11 TITLE (include Security Classification)
Reduction of Line Current Harmonics in 3-phase off-line rectifier systel
by ~'eof a efficient 3-phase to 9-phase autotransformer conversion Tec ique12 PERSONL AUTHOR(S)
Williams, Michael L13a TYPE OF REPORT 13b TIME COVERED 14. DATE OF REPORT ( Year, Month, Day) 15 PAGE COUNT
rir -FROM __ __TO ___ 79-04-12 3116 SUPPLEMENTARY NOTATION
draft report
17 COSATI CODES 18B. SUBJECT TERMS (Continue on reverse if necessary and identify by block number)
FIELD GROUP SUB-GROUP harmonics, 3-phase of line
19. ABSTRACT (Continue on reverse if necessary and identify by block number)
DTIC
ELT
20 DISTRIBU TION I'AVAILABILI1TY OF ABS TRAC T ~21 ABSTRACT SECURITY CLASSIFICATIONP UNCLASSIFIED'UNLIMITED 0 SAME AS RPT El DTIC USERS
22a NAME OF RESPONSIBLE INDIVIDUAL 22b TELEPHONE (Include Area Code) 22c OFFICE SYMROLMr. Archer 1 746-0019 1CI QAQ
DD Form 1473. JUN 86 Previous editions are obsolete __SECURTY CLASSIFICATION OF S S
89 2 6 116

, I I I&
REDUCTION OF LINE CURRENT HARMONICS IN 3-PHASE OFF-LINE RECTIFIER SYSTEMSBY USE OF AN EFFICIENT 3-PHASE TO 9-PHASE AUTOTRANSFORER CONVERSION TECHNIQUE
or C* p&AF '
Accession ForNTIs G RA& , -
DTIC TABUnannounced
12 April 1979 Justiftoation
This draft is the final version of this Distribution/report and should be processed. Availability CodesPer Mr. Archer, NAVSEA/pms-4091 AvaNiand/or
Dist Special
Michael L. Williams
(301) S9"i/o- v/3 7
4Ac- 0 os-f
This investigation has been performed for NAVSEA 660Funder contract No. N00024-79-C-6376
EG&G Washington Analytical Services Center, Inc.
2150 Fields Road
Rockville, Maryland 20850
(30) eqo-1000

NOTICE
Because of the degree of current interest in the subject of
reducing power line harmonic currents, this report is being released
to a limited distribution in DRAFT form. It is expected
that editorial and technical modifications will occur prior to issue
of the complete report. Additional effort will also be expended in
verifying the analysis. It is expected that laboratory testing will be
performed in the near future to obtain experimental verification of the
analysis. Comments are solicited.
Michael L. Williams
(301) 8
kzy - S,
•~ zl ii I ' I S'9

REDUCTION OF LINE CURRENT HARMONICS IN 3-PHASE OFF-LINE RECTIFIER SYSTEMSBY USE OF AN EFFICIENT 3-PHASE TO 9-PHASE AUTOTRANSFORMER CONVERSION TECHNIQUE
- A technique is described which provides a substantial reduction
(50 dB or more) of the low frequency harmonics of a 3-phase off-line
rectifier system. In a conventional off-line rectifier system, the line
current waveform has a total harmonic distortion (THD) of 78 percent. With
the technique described herein, the line current is modified to a nearly
sinusoidal waveshape having less than 5 percent THD, predominantly 17th
and 19th harmonic. The technique employs autotransformers to achieve a
high degree of volumetric and energy efficiency at a substantially lower
cost, and with reduced acoustic hum and stray magnetic fields as compared
to conventional transformer configurations. A power density of approx-
imately 12 Watts/in3 or better is expected to be achieved with this
technique for applications requiring several kilowatts of input power,
when the 20 degree system is employed. For the 40 degree system, a power
density of approximately 6 Watts/in3 or better is expected.
This technique also has the advantage of reducing the line current harmonics
without the use of reactive filter elements. -7t. is therefore
inherently insensitive to the effects of the negative input impedance
characteristics of switching regulator power supplies, which can result in
instability and/or a high degree of susceptibility to conducted interference.b
INTRODUCTION
Harmonic line currents produced by rectifier current pulses are a
major source of conducted electromagnetic interference (EI). This form
of interference can result in wieform distortion of the power source and
degradation of equipment which is sensitive to the frequency spectrum of
the interference. In 3-phase systems, the most difficult interference to eliminat,
tends to be the 5th and 7th harmonics. Although line filters may be
employed to reduce the harmonic currents, the low frequencies involved tend
to cause the filters to be prohibitively large. Because of considerable

experience with degradation due to such line current harmonics ti].military and industrial specifications are becoming more and more
restrictive with regard to the allowed levels of line current harmonics.
MIL-E-16400G, Amendment 1 requires that, for 60 Hz units of 1000 VA or
more, no single harmonic from the 2nd to the 32nd may be greater than
3 percent of the fundamental. From the 32nd harmonic to 20kHz, the
individual harmonic currents must not be greater than 100/n percentof the fundamental, where n is the harmonic number. Transformer methods
offer a solution which is attractive form the viewpoint of retrofitting existing
existing systems to meet more stringent requirements. Investigations are
currently underway for such applications (2]. The technique described
herein has been shown by analysis to meet the 3 percent and 100/n harmonic
current requirement of MIL-E-16400C Amendment 1, except at the 17th
harmonic where the line current harmonic is 3.9 percent. A minor degree
of filtering would be sufficient to achieve full compli ance to these
requirements.
2.

DISCUSSION
When a conventional full-wave bridge capacitor-input rectifier
is operated from a 3-phase line, as is quite common in off-line switch-mode
power supply applications, the unfiltered line current has a doublet pulse
characteristic as shown in Figure 1A. The frequency spectrum of this current
waveform shown in Figure 1B indicates that the 5th and 7th harmonics are only
several dB below the magnitude of the fundamental frequency component. The
1th and 13th harmonics are also rather large. The Total Harmonic Distortion
of this waveform is 78 percent. Transformers may be employed to con-
vert the 3-phase rectifier system to a Many-phase system. As more phases are
added, the line current waveform improves and approaches a pure sinusoid as
the number of phases becomes very large. Although this approach is veryA
effective, a large penalty must be paid in terms of space, weight, and cost
for the use of such transformers. Acoustic hum produced by the transformers
may also be objectionable in some applications." ...- n sA, m*qr/c -Plch/I
The technique presented here provides a very large improvement in the
space, weight, and cost factors by making use of the very high efficiency
of autotransformers. As shown in Figure 2, the volt-ampere capacity req-
uirement of an autotransformer is considerably less than that of a conventional
transformer when the input/output voltage transformation ratio is close to
unity. As the input/output voltage transformation ratio approaches unity,
the volt-ampere capacity requirement of the autotransformer approaches
zero. Therefore, in applications in which t o age transformation ratio
is close to unity, and where DC isolation is not required, the use of
autotransformers instead of conventional transformers results in a large
reduction of size, weight, and cost. Acoustic hum should also be substantially
reduced with the smaller transformers./
3

_ _ _ _j 7
-Tt
- -j7-1
i- J ~ .
0 -----.-. i
*1E
-20dB
-40 -
-60 -' - :
1 5 7 11 13 17 19 23 25 29 31Harmonic Number n
Figure 1B Frequency spectrum of waveform. shown in Figure IA

P= 1200W Pwvr = Zoo'4
IOAIZA
I DovIzov
TRANSFORMER VOLT*AMP CAPACITY 1200 VA
A. CONV(ENTIONAL TRANSFOAAGA1
TRANSFORMER VOLT*AMP CAPACITY 200 VA
3. AtmrTRANSFOR,.1R
F14V)RE 2 COM'PARISON OF VOLT-AM4P CAPACITYREOVIREI4ENrS OF CONVENrIONAL TRAN3ANAVe-S
ANt) AUTO TRANVs FOR .IEAS

The proposed method converts the 3-Phase input power to a 9-Phase
system using autotransformer techniques as shown in Figures 3.j' In
these figuresit may be seen that phases A,B, and C are provided directlyA
by the input power lines, thereby requiring no transformation. Phases
A", A', B",B',C",C' are produced by transformation. However, as may be
seen from Ajaw. 3, tNe S weuIX,#4vy 4.4ajeS are produced by
adding relatively small phasors to the existing phases A,B,C. Only the
short phasor paths such as exist between A and A', A and A", etc. must be
produced via transformer action. Since these phasor components are
small relative to the phasors A-B, B-C, C-A from which they must be
transformed, the effective transformation ratio between phase A' and
phase A, etc. is close to unity. The volt-ampere capacity of the transformers
required to generate phases A",A', B",B',C",C' from phases A,B,C is therefore
small compared with the volt-ampere capacity of conventional transformers
't~a would provide complete DC isolation of the secondaries from the primaries.
In off-line switch-mode power supplies, DC isolation is provided by a small
high frequency transformer. Therefore, there is no need to provide DC
isolation at the primary input power level.
Two versions of the 3-phase to 9-phase autotransformer conversion
system are described. A 20 degree system is the most efficient..:L!owever,
the use of this system requires that the load be split into three equal
parts, with each part fed from an individual 3-phase bridge rectifier.
If a 9-phase full-wave bridge rectifier were used with the 20 degree system,
rectifier conduction would occur via paths wherein the line-to-line voltage
exceeds the normal line-to-line voltage of the 3-phase power input, such
as across phases A"-B', A'-C", etc. shown in Figure 3-a.
A 40 degree system permits the use of a conventional 9-phase bridge
rectifier to form a single rectified DC output. In this system, the
auxiliary phases A", A', B", B', C", and C' are arranged such that their
combination with the input phases A, B, and C forms a uniformly distributed
9-phase system with 40 degrees between phases. The arrangement of phases
for this system is shown in Figure 3-b.
. , a l l I

0
All -A
/a. 20 Degree System
I
CC
AA
C" B
Figure 3 3-Phase to 5-hase Conversion Using Autotransformer Method
7

As an :xample of the efficiency of the autotransformer technique, it is
assumed -nat a 3-phase power source must supply 3000 Volt-Amperes at a
line-to-line voltage of 115 volts to a group of switch-mode power supplies
employing off-line rectifiers. It is also assumed that the power supplies
may be grouped such that three equal 3-phase loads are formed. Assuming
sinusoidal waveforms for simplicity, the line current in each of the three
input power lines would be 15.1 amperes. A conventional isolating transformer
system would be required to have a 3000 VA capacity in order to provide the
required power. For the autotransformer method however, the current provided
by phases A", A', B", B', C", C' would be one third of the 15.1 amperes or
dFw Od.'. 5.03 amperes. 4the short phasors which must be added to phases A,B,C to make
these auxiliary phases are composed of two components each of length 20.40
volts and 4.62 volts, as shown in Appendix A. The volt-ampere capacity
required to produce each of the auxiliary phases such as A" is
therefore (20.40V + 4.62V) X 5.03A or 126 VA. For the six auxiliary phases,
a total transformer capacity of 751.6 VA is required. the autotransformer
method therefore requires only 25 percent, approximately, of the volt-ampere
capacity of conventional isolating transformers, resulting in a substantial
reduction in size, weight, costY acoustic noise, cd sTr .
3Assuming approximately 3.0 VA/in as a reasonable sizing factor for OH
transformers of this power range, a total of 251 in 3would be required to
package the autotransformers. When related to an assumed input power level
3of 3000 watts, the resulting power density is 12. Watts/in . This level
of power density would seem to make the autotransformer technique feasible
for use in many applications. In those applications requiring a single
rectified DC output, the 40 degree system must be used. The 40 degree
system permits the use of a conventional 9-phase full-wave bridge
rectifier. In this system however, the power density is reduced to approx-3
imately 6 Watts/in
Since the reduction in line current harmonics may permit the useof a smaller EMI filter in an cases, the net impact upon systemvolume may be less than 251 in

Figure 4 presents the schematic diagram of the 3-phase to 9-phase
autotransformer conversion system. Transformers connected in this manner
viii convert a balanced 3-phase input to the 9-phase system shown in
Figure 3. Figure 5A indicates the waveform of the current flowing in the
3-phase input power lines when either a 20 degree or 40 degree 3-phase
to 9-phase autotransformer conversion system is used. The individual
rectifier current pulses are
assumed to be trapezoidal, 10 degrees wide at the top and 30 degrees wide at
the base. This pulse waveform is typical of that occurring in capacitor
input off-line rectifiers. The line current waveform shown in Figure 5A
is nearly sinusoidal, having a total harmonic distortion (THD) of only
5 percent. The frequency spectrum of this waveform is shown in Figure 5B.
The residual distortion is predominantly 17th.and 19th harmonic, having
amplitudes of 3.9 percent and 3.0 percent respectively. This waveform
is dramatically improved over that of the conventional 3-phase off-line
rectifier line current dhown in Figure 1A.
Because the output phases A,B,C are provided directly by the input
phases OA,0B,0C, their output impedances will be lower than the other
phases which are produced by the transformers. In order to provide equal
source impedances for each of the output phases, a resistance R is placed
in series with the A,B,C output phases as shown in Figure 4. The value
of these resistors should be chosen to equal the effective series resistance
inserted in the auxiliary phase outputs A",A',B",B',C",C' by the autotrans-
formers. The value of this resistance may be measured between the OA input
and the A" output, with OA, OB, and 0C shorted together. Improved matching
of the output impedances would occur if the resistors were inductively wound
so as to match the inductive component of the output impedances as well.
9

T11
tic4
OAA
OB A 4
B"cc -
Poe Source T2 W
4A 00
OB
I 4R
01
~4 -041V
41 4)
cCt) U
0 0
0 0
Basic TransformerSpecifications for 115 V Line-to-Line 3000 VA System
20 Degree 40 Degree 6.67 DegreeSystem System System
Primary 115 V 115 V 115 VSecondary #1 and #3 4.624 V 17.936 V Not UsedSecondary #2 40.794 V CT 67.418 V CT 15.521 V CTPhase Shift 0 Degrees 0 Degrees 0 DegreesVA Rating per Trans 250 VA 520 VA 78 VA
Figure 4 3-Phase to 9-Phase Autotransformer Conversion System

. . ... .. .. . .
V-1-
Figure 5A Waveform of current flowing in the phase A,B, and Cinput power lines with a 20 0 or 400 3-phase to 9-phaseautotransformer conversion system feeding off-line rectifiers
-40 ......
-60- __ _ __ _ _ _ _ _
1 17 19 32TSHarmonic Number n
Figure 5B Frequency spectrum of waveform shown in Figure 5A

The improvement is achieved primarily by converting the waveform shown
in Figure 1-a into the sum of three similar waveforms of one third amplitude,
with one of the waveforms advanced by 20 degrees (or 40 degrees, depending
upon the system used) and one retarded by 20 degrees ( or 40 degrees) relative
to the third waveform.
The summation of these three waveforms is then substantially more similar
to a sine wave than is the severe pulse waveform shown in Figure IA. The
remaining improvement results from the fact that the transformer primary
currents, which are reduced amplitude replicas of their secondary currents,
very conveniently add to and subtract from the waveform in an optimum
manner to make the total waveform very nearly sinusoidal. This process
is discussed in detail in Appendix B.
The analysis presented herein assumes perfectly balanced 3-phase
voltages. Imbalance of the input phase voltages would cause some degradation
of performance. A quantitative analysis of the effects of phase voltage
imbalance has yet to be performed.
Approximately Z3 dB further reduction of the 17th and 19th harmonic
could be achieved in large systems by cascading 3-phase to 9-phase
autotransformer conversion systems, as discussed in Appendix C.
/L

APPENDIX A
DETERMINATION OF TRANSFORMER SECONDARY VOLTAGE RATINGS FOR TRANSFORMERS
USED IN A 3-PHASE TO 9-PHASE AUTOTRANSFORMER CONVERSION SYSTEM
V
Y X_ R - Radius
U - R Cos X V Tan 300
V=R-U Y -W-X.0 W R Sin Z V /Cos 300
0 0
30 0 Radius =LL
2 Cos 300
U 66.395 V
@ VLL =115 V
From inspection of the figure above, it may be seen that the transformer
secondary voltages required for the 3-phase to 9-phase autotransformer
conversion system are given by the following equations.
VLL (Sin (I -Cos )Tan 300)VY m 2 Cos 300 -
"aL 1 1-CosOZ 2 Cos 300 Cos 30°
20 Degree 40 Degree 6.67 DegreeSystem System System
Voltage with Vy 20.3968 V 33.709 V 7.7605 VVL - 115 VLL V 4.6236 V 17.936 V Not Used
Turns Y : Primary 0.1774 : 1 0.2931 : 1 0.06748 : 1
Ratios Z : Primary 0.0402 : 1 0.1560 : 1 Not Used
A
Al
APPENDIX B
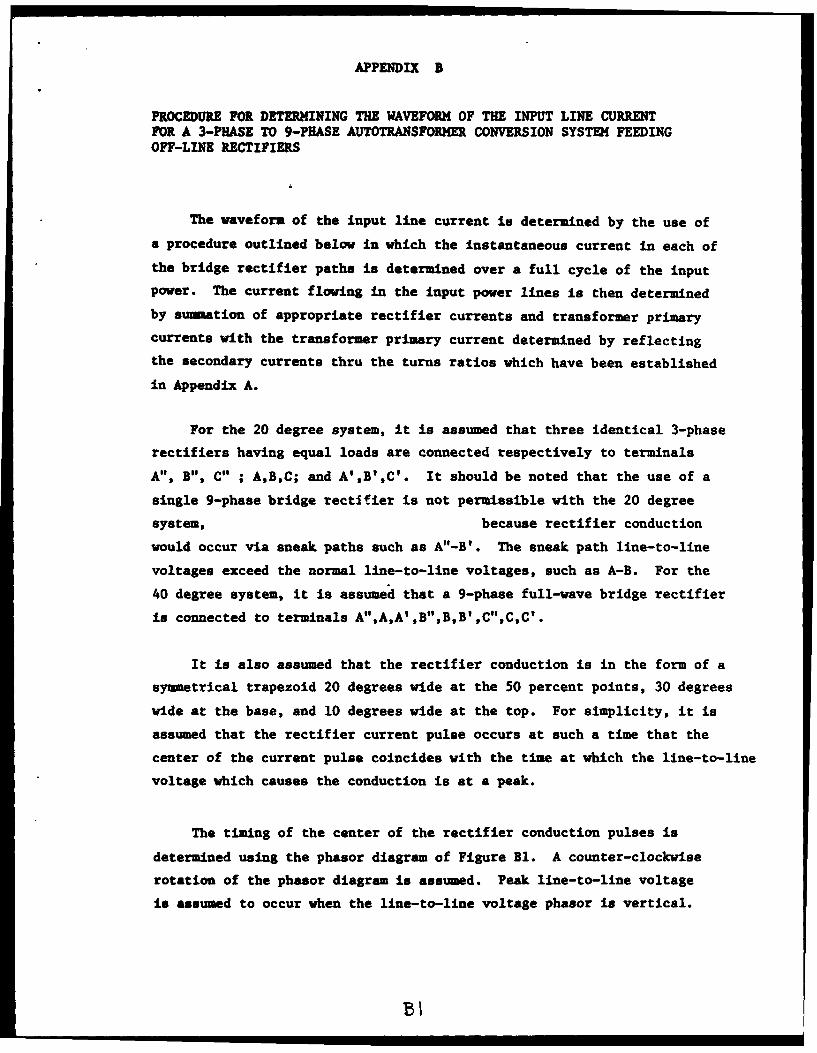
PROCEDURE FOR DETERMINING THE WAVEFORM OF THE INPUT LINE CURRENTFOR A 3-PHASE TO 9-PHASE AUTOTRANSFORMER CONVERSION SYSTEM FEEDINGOFF-LINE RECTIFIERS
The waveform of the input line current is determined by the use of
a procedure outlined below in which the instantaneous current in each of
the bridge rectifier paths is determined over a full cycle of the input
power. The current flowing in the input power lines is then determined
by summation of appropriate rectifier currents and transformer primary
currents with the transformer primary current determined by reflecting
the secondary currents thru the turns ratios which have been established
in Appendix A.
For the 20 degree system, it is assumed that three identical 3-phase
rectifiers having equal loads are connected respectively to terminals
A", B", C" ; A,B,C; and A',B',C'. It should be noted that the use of a
single 9-phase bridge rectifier is not permissible with the 20 degree
system, because rectifier conduction
would occur via sneak paths such as A"-B'. The sneak path line-to-line
voltages exceed the normal line-to-line voltages, such as A-B. For the
40 degree system, it is assumed that a 9-phase full-wave bridge rectifier
is connected to terminals A",A,A',B",B,B',C",C,C'.
It is also assumed that the rectifier conduction is in the form of a
symmetrical trapezoid 20 degrees wide at the 50 percent points, 30 degrees
wide at the base, and 10 degrees wide at the top. For simplicity, it is
assumed that the rectifier current pulse occurs at such a time that the
center of the current pulse coincides with the time at which the line-to-line
voltage which causes the conduction is at a peak.
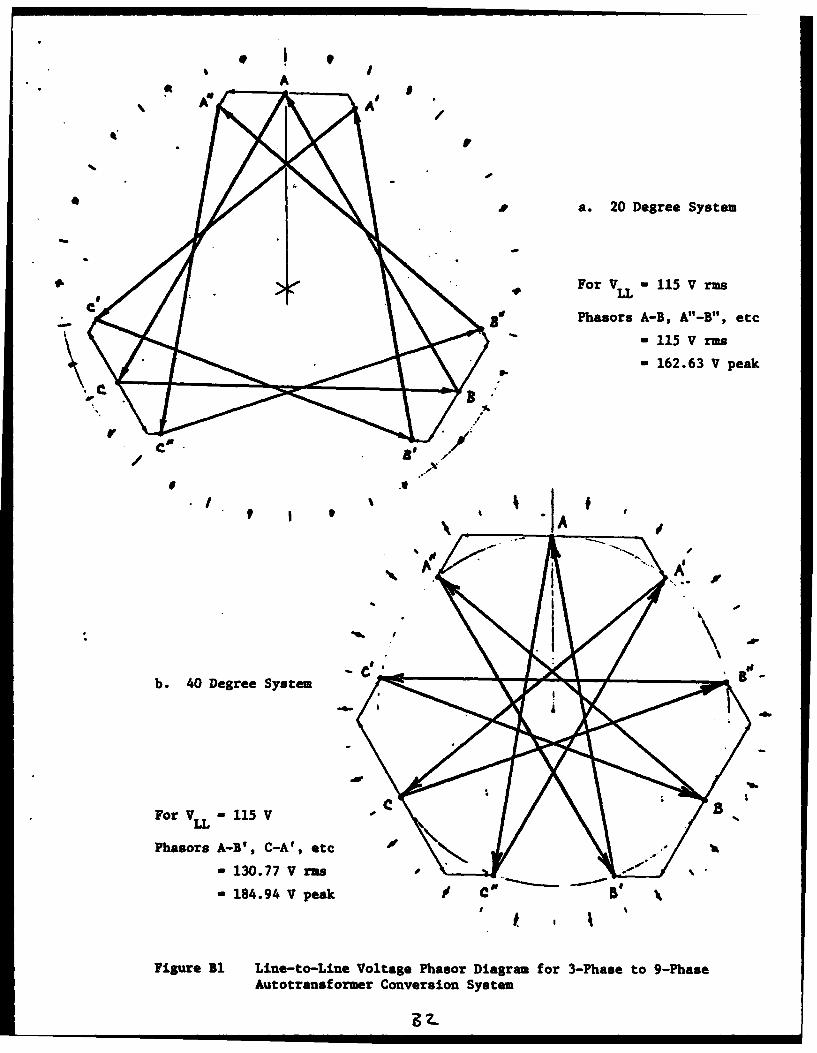
The timing of the center of the rectifier conduction pulses is
determined using the phasor diagram of Figure Bl. A counter-clockwise
rotation of the phasor diagram is assumed. Peak line-to-line voltage
is assumed to occur when the line-to-line voltage phasor is vertical.
BI
AA
a. 20 Degree System
For VL 115 V rms
Phasors A-B, A"-B", etc
- 115 V rins
- 162.63 V peak
*/
b. 40 Degree System C
For VL- 115 V
Phasors A-B', C-A', etc
- 130.77 V rs
- 184.94 V peak #f C
Figure B1 Line-to-Line Voltage Phasor Diagram for 3-Phase to 9-PhaseAutotransforuer Conversion System

Because the use of full-wave bridge rectifiers is assumed, conduction will
occur for both peak positive and peak negative line-to-line voltages. The
direction of line current flow is determined by whether the phasor is
pointing upward or downward.
Because the process of constructing the entire waveform for the input
line current is lengthy and tedious, a formal procedure has been established.
This permits an orderly process, and documents the rationale. In order to
greatly simplify the process, it is first assumed that the diode condwiction
occurs as current impulses of zero width. The final waveform is then
formed by converting the impulses into trapezoidal pulses having the same
amplitude. The procedure for constructing the waveform is given below.
1. The phasor diagram of Figure B1 is rotated CCW.
The rectifier bridge is assumed to conduct when the relevant line-to-line
source voltage phasor is vertical. The direction of line current flow
is defined below.
x
I X Y Point X is positive relative to point Y
Rectifier current flows out of line X and into line YY
Y VX Y Point X is negative relative to point Y
I Rectifier current flows out of line Y and into line X
x
2. Current that flows out of line A' or A" also flows out of line OA
Current that flows out of line B' or B" also flows out of line 0B
Current that flows out of line C' or C" also flows out of line OC

3. Current that flows out of line' 200 400
A' gB') (C') System System
also flows out of line OB IOCJ (OA) reduced by: 0.1774 0.2931
also flows into line 0C [OA) (0B) reduced by: 0.1774 0.2931
also flows out of line 0B [0C) (OA) reduced by: 0.0402 0.1560
also flows into line OA (OBI (0c) reduced by: 0.0402 0.1560
Current that flows out of line: 200 400
A" (B" (C") System System
also flows out of line OC 1OA1 (OB) reduced by: 0.1774 0.2931
also flows into line B (OC (OA) reduced by: 0.1774 0.2931
also flows out of line OC (OA) (0B) reduced by: 0.0402 0.1560
also flows into line OA EOB) (0C) reduced by: 0.0402 0.1560
Items 2 and 3 above may be more easily understood by examining the
transformer system schematic diagram, Figure J5 .
The rules given in item 2 should be obvious from inspection of Figure Bio
In considering the rules of item 3, it is helpful to remember that current
flowing out of a dotted transformer secondary terminal must flow into the
dotted primary terminal, reduced by the appropriate turns ratio. It should
also be noted that current flowing into a transformer primary terminal must
flow out of the primary power line connected to that transformer terminal.
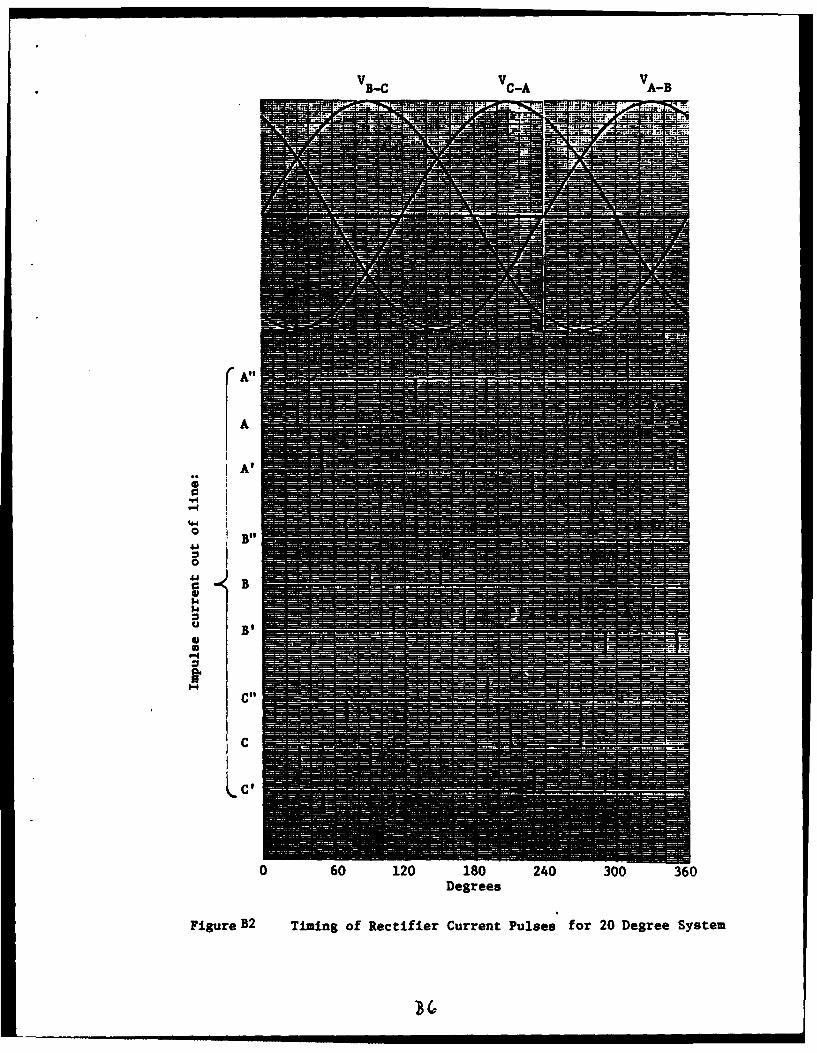
Figure B2 presents the impulse representation of the rectifier currents
flowing out of the respective transformer system output terminals, for
a 20 degree system.
Figure B2 is formed by examination of Figure B1 and the
application of rule 1 above. By examination of Figure B1, it may be seen that
the phasor C"-A" is vertically downward after 10 degrees of rotation.
Accordingly, a pCs," current impulse is shown for terminal A" and a nel-i
current Impulse is shown for terminal C at an angle of 10 degrees. The
polarities of these impulses are determined in accordance with rule 1.
At a rotation of 30 degrees, phasor C-A is positioned vertically downward,
resulting in appropriate current impulses shown for terminals A and C. This
process is continued for a full 360 degree rotation of the phasor diagram.

Rule 2 is then applied to form the intermediate impulse waveform labeled
Axl.O00 in Figure 33. This waveform is simply the direct summation of the
impulse waveforms A", A, and A' shown in Figure B2. The rules of item 3 are
then applied to form the intermediate impulse waveforms labeled AxO.1774 and
AxO.0402 shown in Figure B3. These two waveforms account for the line current
flowing out of the input power line A as a result of the current pulses
flowing in the primaries of the transformers connected to line A.
The impulse waveforms labeled Axl.O000, AxO.1774, and AxO.0402 are
then summed, acounting for the scale factors to form the impulse waveform
labeled Asum, which represents in impulse form the total current flowing
out of the phase A input power line. This impulse waveform is then
converted to the actual time waveform of the line current flowing out of
the phase A input power line replacing the impulses of the Asum waveform
with trapezoidal pulses. The actual time waveform is then equal to the
instantaneous sum of the trapezoidal pulses. A similar process will yield
the waveform of the line
current flowing in the phase B and phase C input power lines. By the
symmetry of the system, it may be seen that these waveforms are identical
to that of the phase A waveform, except for a plus or minus 120 degree
phase shift of the fundamental.
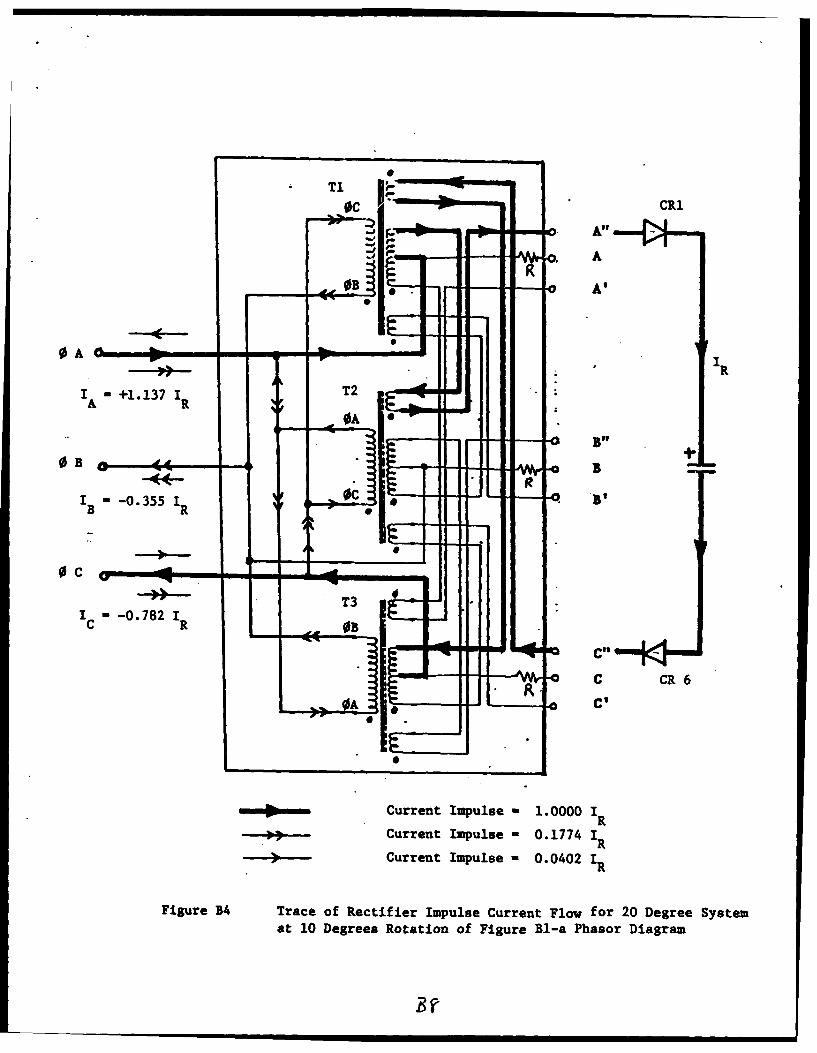
Figure B4 illustrates the flow of rectifier current and the resulting
transformer primary currents flowing at 10 degrees rotation of the phasor
diagram, Figure Bl. In Figure B4, the bridge rectifier current flows out
of terminal A" and into terminal C". All other rectifier terminals have
zero conduction at this time, since the associated diodes are reverse biased.
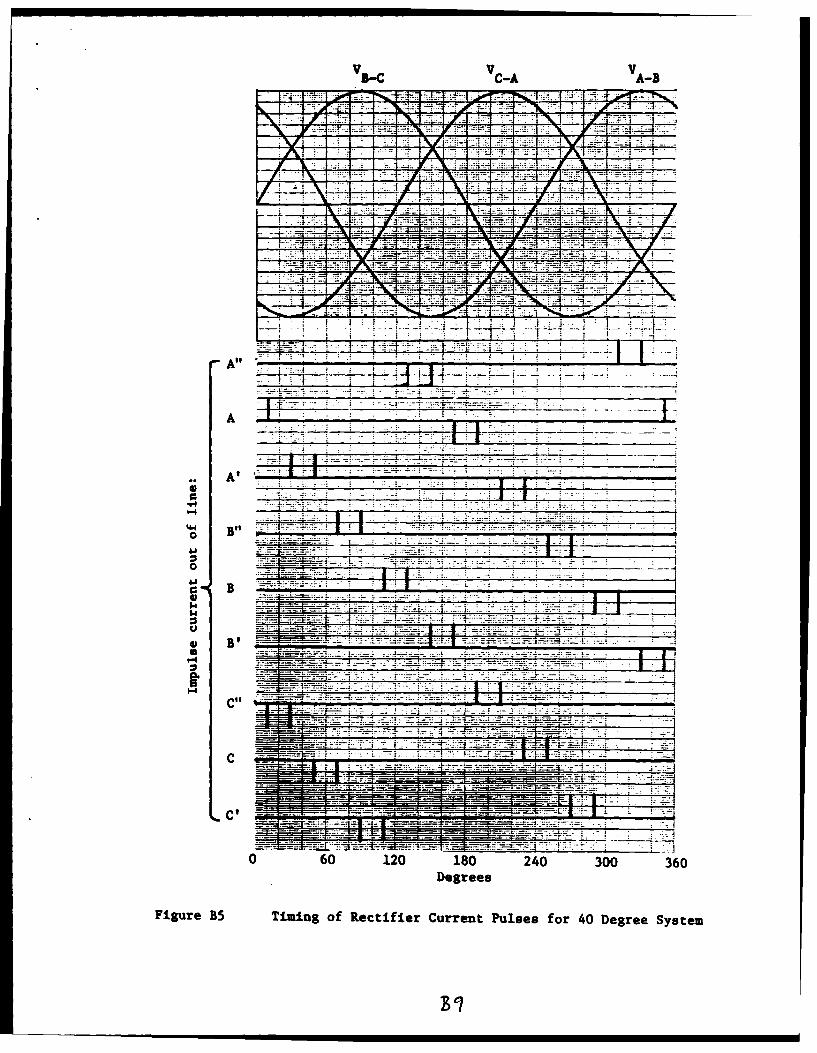
Figure B5 presents the impulse representation of the rectifier currents
for a 40 degree system. Figure B6 illustrates the formation of the actual
time waveform for the phase A input line current for a 40 degree system.
-- ,-m nmun nn lmm
vCv C-A VA-B
FMOMA'#
0 B"
B5
B1
4O
C,'
0 60 120 180 240 300 360Degrees
Figure B2 Timing of Rectifier Current Pulses for 20 Degree System

0 60 120 180 240 300 360
Axl.0 1.00
AxO40 0
-1 0000
1.000
-1.0000
0 60 120 180 240 300 360Degrees
Figure B3 Formation of Phase A Line Current Waveform by SimmationOf Component Impulses and Convolution with RectifierCurrent Pulseform for 20 Degree System
1B7
0C CR1
A"
0 A
I - +1.137 1 T2A R
B910- B - *B
IB -0.355 I 0C BB R
0 C
T3I C -- 0.782 1
C RB
Current Impulse - 1.0000 IR
Current Impulse - 0.1774 1R0. Current Impulse - 0.0402 R
Figure B4 Trace of Rectifier Impulse Current Flow for 20 Degree Systemat 10 Degrees Rotation of Figure Bl-a Phasor Diagram
B F
vB vCA VA-B
-4
__ .10. \1
A"ll
7.1
A- 171
A' 1 ~.___ ..
0
It TEEM-zlz I L
CL o 71
0 60 10 10 24 0 6Dere
Figur B5 Tmn+fRciirCret ussfr4 ereSse

0 60 120 180 240 300 .360
1.0000 --
AXl.0000 0-1.0000
0. 2931 :
AxO.2931 0 ...........
-0. 2931
0.1560
AxO.1560 0
-1.0000*AW- T__FI____
1. 0000
Lie urn 0 _____
Wa.0eform
-1.0000
ofn Comronen 0musso etfe urn r4 ereSse
Waveform

APPENDIX C
REDUCTION OF 17th AND 19th HARMONIC LINE CURRENTS BY CASCADING3-PHASE TO 9-PHASE AUTOTRANSFORMER CONVERSION SYSTEMS
The 3-phase to 9-phase autotransformer conversion system described
in the body of the report provides a nearly sinusoidal line current
waveform. There is approximately 5 percent residual distortion, however,
which is predominantly 17th and 19th harmonic. These harmonics have
amplitudes of 3.9 percent and 3.0 percent respectively. In large systems
that have a number of power supplies which can be allocated so as to form
three approximately equal loads, approximately 2.3 dB of attenuation of the
17th and 19th harmonic currents can be effected by the use of cascaded
autotransformer conversion systems. Figure Cl presents a block diagram of
such an arrangement.
0A1" 20 ° 0
3B- s 3-phase 30to 'rectifier
JC ,9-phase loads
converter
6.67 0 OA 20°0
A 3-phase 3-phase A tn r 3OB to PB to rectifier
9-phase C 9-phase ,, loadsOC convertercovre
OA' 20°0OBI 3-phase 30
, to ,rectifierOct 9-phase loads
converter,)*
Figure Cl Cascading of 3-phase to 9-phase Autotransformer Conversion Systemsto Provide 23 dB Reduction of 17th and 19th Harmonic Line Current
. . .C Ill
l
6.67 6.670
AA'
7 \,
CI BOO
C BC" YB '
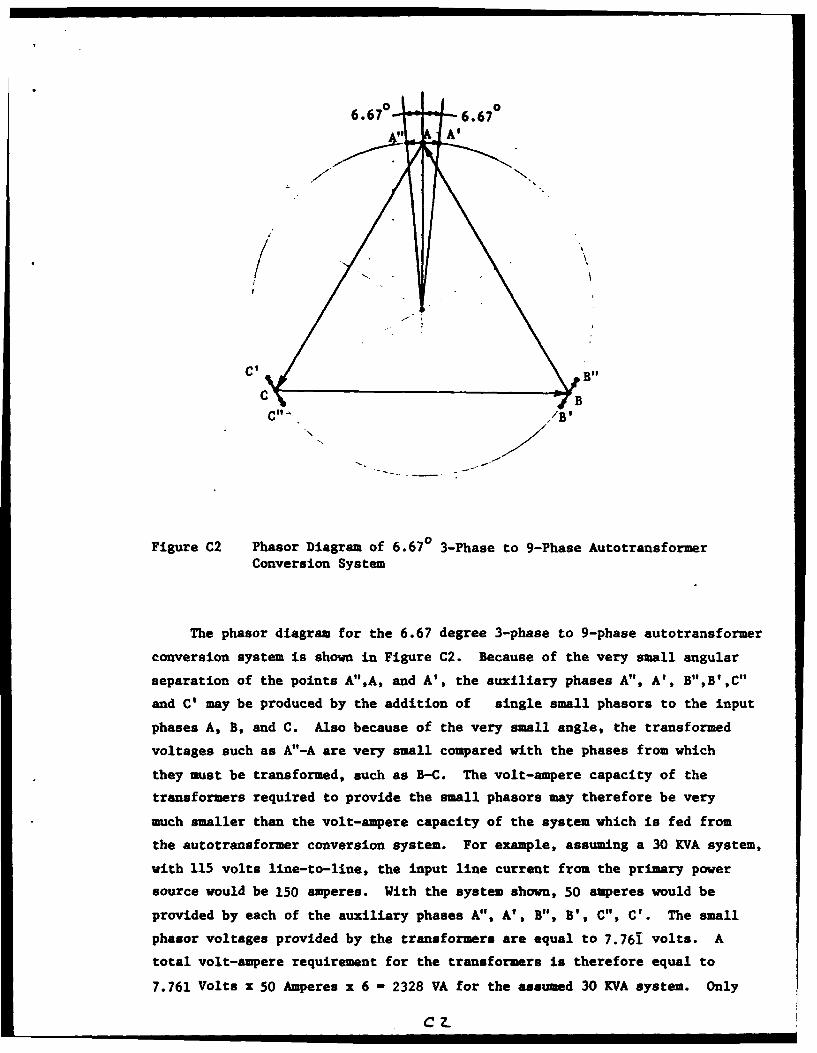
Figure C2 Phasor Diagram of 6.670 3-Phase to 9-Phase AutotransformerConversion System
The phasor diagram for the 6.67 degree 3-phase to 9-phase autotransformer
conversion system is shown in Figure C2. Because of the very small angular
separation of the points A",A, and A', the auxiliary phases A", A', B",B',C"
and C' may be produced by the addition of single small phasors to the input
phases A, B, and C. Also because of the very small angle, the transformed
voltages such as A"-A are very small compared with the phases from which
they must be transformed, such as B-C. The volt-ampere capacity of the
transformers required to provide the small phasors may therefore be very
much smaller than the volt-ampere capacity of the system which is fed from
the autotransformer conversion system. For example, assuming a 30 KVA system,
with 115 volts line-to-line, the input line current from the primary power
source would be 150 amperes. With the system shown, 50 amperes would be
provided by each of the auxiliary phases A", A', B", B', C", C'. The small
phasor voltages provided by the transformers are equal to 7.761 volts. A
total volt-ampere requirement for the transformers is therefore equal to
7.761 Volts x 50 Amperes x 6 - 2328 VA for the assumed 30 KVA system. Only
CL
7.8 percent of the system volt-ampere capacity must be provided by
transformer action of the 6.67 degree 3-phase to 9-phase autotransformer
conversion system.
The 6.67 degree shift of the fundamental would provide a plus and
minus 120 degree shift of the 18th harmonic. When combined with the
unshifted component, complete cancellation of the 18th harmonic would
occur, except for the fact that the 18th harmonic is nonexistent. For the
17th harmonic, a shift of plus or minus 113.33 degrees would occur.
Cancellation would therefore be incomplete, but would amount to a value of
( 1 + 2Cos 113.330)/ 3.0 - 0.0693 - 23.2 dB. For the 19th harmonic
the phase shift is plus or minus 126.67 degrees. Similarly, the attenuation
of the 19th harmonic is 23.8 dB. A detailed analysis of the system shown
in this appendix has yet to be performed. However, it is expected that
a design of this nature could achieve substantial values of attenuation
of the 17th and 19th harmonic currents which are the predominant components
of the 5 percent residual distortion of the line current at the input of
a 20 degree 3-phase to 9-phase autotransformer conversion system. Using
a 3 VA/in3 sizing factor for transformers, the power density of the 6.67
degree converter would be approximately 39 Watts/in 3 . This order of power
density would make such an approach attractive in many applications.
C 3

APPENDIX D
COMPARISON OF RELATIVE AMPLITUDES MND WAVESHAPES OF INPUT LINE CURRENTWITH MND WITHOUT THE 3-PHASE TO 9-PHASE AUTOTRANSFORHE.R CONVERSION SYSTEM
it, 0
Figure Dl Relative Waveforms of Current Flowing in input Power*LinesWith and Without 3-Phase to 9-Phase Autotransforuer ConversionSystem. Relative Magnitudes are Drawn to Scale. -for o.
bc. ifedele I7ue kV&
=(/642 Vbt)1OA% /6 2.
wi - y/. 1 r.()A 2. VA A1wo r7 e CW
. a (Z0?Av)() ~VA 4 f

APPENDIX D
COMPARISON OF RELATIVE AMPLITUDES AND WAVESHAPES OF INPUT LINE CURRENTWITH AND WITHOUT THE 3-PHASE TO 9-PHASE AUTOTRANSFORMER CONVERSION SYSTEM
Figure Dl Relative Waveforms of Current Flowing in Input Power LinesWith and Without 3-Phase to 9-Phase Autotransformer ConversionSystem. Relative Magnitudes are Drawn to Scale.

REFERENCES
1. J. Foutz, Switching-Mode Power Supply TechnologyPaper presented at the Symposium for A Rational Approach to PoweringShipboard Electronics, 5-7 Dec 1978, NSWC, White Oak, Md.
2. F.E. Rock, Suppression of Submarine Power Line Current HarmonicsGenerated by IBM Sonar Power Supplies, IBM No. 78-916-026, 21 Dec 1978
3. R.D. Middlebrook, Input Filter Considerations in the Design andApplication of Switching Regulators, IEEE Industrial ApplicationsSociety Annual Meeting 1976 Record, pp 366-382