Investigation DIFFUSION AND OSMOSIS 4 DIFFUSION AND OSMOSIS 5 Table 1.1 Dialysis bag –vs- Beaker...
14
Investigation 4 DIFFUSION AND OSMOSIS 1 What causes my plants to wilt if I forget to water them? ■BACKGROUND Cells must move materials through membranes and throughout cytoplasm in order to maintain homeostasis. The movement is regulated because cellular membranes, including the plasma and organelle membranes, are selectively permeable. Membranes are phospholipid bilayers containing embedded proteins; the phospholipid fatty acids limit the movement of water because of their hydrophobic characteristics. The cellular environment is aqueous, meaning that the solvent in which the solutes, such as salts and organic molecules, dissolve is water. Water may pass slowly through the membrane by osmosis or through specialized protein channels called aquaporins. Aquaporins allow the water to move more quickly than it would through osmosis. Most other substances, such as ions, move through protein channels, while larger molecules, including carbohydrates, move through transport proteins. The simplest form of movement is diffusion, in which solutes move from an area of high concentration to an area of low concentration; diffusion is directly related to molecular kinetic energy. Diffusion does not require energy input by cells. The movement of a solute from an area of low concentration to an area of high concentration requires energy input in the form of ATP and protein carriers called pumps. Water moves through membranes by diffusion; the movement of water through membranes is called osmosis. Like solutes, water moves down its concentration gradient. Water moves from areas of high potential (high free water concentration) and low solute concentration to areas of low potential (low free water concentration) and high solute concentration. Solutes decrease the concentration of free water, since water molecules surround the solute molecules. The terms hypertonic, hypotonic, and isotonic are used to describe solutions separated by selectively permeable membranes. A hypertonic solution has a higher solute concentration and a lower water potential as compared to the other solution; therefore, water will move into the hypertonic solution through the membrane by osmosis. A hypotonic solution has a lower solute concentration and a higher water potential than the solution on the other side of the membrane; water will move down its concentration gradient into the other solution. Isotonic solutions have equal water potentials. In nonwalled cells, such as animal cells, the movement of water into and out of a cell is affected by the relative solute concentration on either side of the plasma membrane. As water moves out of the cell, the cell shrinks; if water moves into the cell, it swells and may eventually burst. In walled cells, including fungal and plant cells, osmosis is affected not only by the solute concentration, but also by the resistance to water movement in the cell by the cell wall. This resistance is called turgor pressure. The presence of a cell wall prevents the cells from bursting as water enters; however, pressure builds up inside the cell and affects the rate of osmosis. Water movement in plants is important in water transport from the roots into the shoots and leaves. You likely will explore this specialized movement called transpiration in another lab investigation. ■Learning Objectives • To investigate the relationship among surface area, volume, and the rate of diffusion • To design experiments to measure the rate of osmosis in a model system • To investigate osmosis in plant cells • To design an experiment to measure water potential in plant cells • To analyze the data collected in the experiments and make predictions about molecular movement through cellular membranes • To work collaboratively to design experiments and analyze results • To connect the concepts of diffusion and osmosis to the cell structure and function
Transcript of Investigation DIFFUSION AND OSMOSIS 4 DIFFUSION AND OSMOSIS 5 Table 1.1 Dialysis bag –vs- Beaker...

Investigation 4 DIFFUSION AND OSMOSIS
1
What causes my plants to wilt if I forget to water them?
■BACKGROUND Cells must move materials through membranes and throughout cytoplasm in order to maintain homeostasis. The movement is regulated because cellular membranes, including the plasma and organelle membranes, are selectively permeable. Membranes are phospholipid bilayers containing embedded proteins; the phospholipid fatty acids limit the movement of water because of their hydrophobic characteristics. The cellular environment is aqueous, meaning that the solvent in which the solutes, such as salts and organic molecules, dissolve is water. Water may pass slowly through the membrane by osmosis or through specialized protein channels called aquaporins. Aquaporins allow the water to move more quickly than it would through osmosis. Most other substances, such as ions, move through protein channels, while larger molecules, including carbohydrates, move through transport proteins. The simplest form of movement is diffusion, in which solutes move from an area of high concentration to an area of low concentration; diffusion is directly related to molecular kinetic energy. Diffusion does not require energy input by cells. The movement of a solute from an area of low concentration to an area of high concentration requires energy input in the form of ATP and protein carriers called pumps. Water moves through membranes by diffusion; the movement of water through membranes is called osmosis. Like solutes, water moves down its concentration gradient. Water moves from areas of high potential (high free water concentration) and low solute concentration to areas of low potential (low free water concentration) and high solute concentration. Solutes decrease the concentration of free water, since water molecules surround the solute molecules. The terms hypertonic, hypotonic, and isotonic are used to describe solutions separated by selectively permeable membranes. A hypertonic solution has a higher solute concentration and a lower water potential as compared to the other solution; therefore, water will move into the hypertonic solution through the membrane by osmosis. A hypotonic solution has a lower solute concentration and a higher water potential than the solution on the other side of the membrane; water will move down its concentration gradient into the other solution. Isotonic solutions have equal water potentials. In nonwalled cells, such as animal cells, the movement of water into and out of a cell is affected by the relative solute concentration on either side of the plasma membrane. As water moves out of the cell, the cell shrinks; if water moves into the cell, it swells and may eventually burst. In walled cells, including fungal and plant cells, osmosis is affected not only by the solute concentration, but also by the resistance to water movement in the cell by the cell wall. This resistance is called turgor pressure. The presence of a cell wall prevents the cells from bursting as water enters; however, pressure builds up inside the cell and affects the rate of osmosis. Water movement in plants is important in water transport from the roots into the shoots and leaves. You likely will explore this specialized movement called transpiration in another lab investigation.
■Learning Objectives • To investigate the relationship among surface area, volume, and the rate of diffusion • To design experiments to measure the rate of osmosis in a model system • To investigate osmosis in plant cells • To design an experiment to measure water potential in plant cells • To analyze the data collected in the experiments and make predictions about molecular movement through cellular membranes • To work collaboratively to design experiments and analyze results • To connect the concepts of diffusion and osmosis to the cell structure and function

Investigation 4 DIFFUSION AND OSMOSIS
2
■General Safety Precautions You should wear safety glasses or goggles, aprons, and gloves because you will be working with acids and caustic chemicals. The HCl and NaOH solutions will cause chemical burns, and you should use these solutions in spill-proof trays or pans. Follow your teacher’s instructions carefully. Do not work in the laboratory without your teacher’s supervision. Talk to your teacher if you have any questions or concerns about the experiments.
■THE INVESTIGATIONS This investigation consists of three parts. In Procedure 1, you use cell models to study the relationship of surface area and volume. In Procedure 2 and 3, you create models of living cells to explore osmosis and diffusion. You finish by observing osmosis in living cells (Procedure 3). All three sections of the investigation provide opportunities for you to design and conduct your own experiments.
■Getting Started These questions are designed to help you understand kinetic energy, osmosis, and diffusion and to prepare for your investigations. Answer these Pre-Lab questions on a separate sheet of paper, to be turned in to your teacher.
What is kinetic energy, and how does it differ from potential energy?
What environmental factors affect kinetic energy and diffusion?
How do these factors alter diffusion rates?
Why are gradients important in diffusion and osmosis?
What is the explanation for the fact that most cells are small and have cell membranes with many convolutions?
Will water move into or out of a plant cell if the cell has a higher water potential than the surrounding environment?
What would happen if you applied saltwater to a plant?
How does a plant cell control its internal (turgor) pressure?
■Procedure 1: Surface Area and Cell Size Cell size and shape are important factors in determining the rate of diffusion. Think about cells with specialized functions, such as the epithelial cells that line the small intestine or plant root hairs. • What is the shape of these cells? • What size are the cells? • How do small intestinal epithelial and root hair cells function in nutrient procurement?
Materials • 2% agar containing NaOH and phenolphthalein (a pH indicator) • 1% phenolphthalein solution • 0.1M HCl • 0.1 M NaOH • Scalpels • Metric rulers • Petri dishes and test tubes • 2% agar with phenolphthalein preparation

Investigation 4 DIFFUSION AND OSMOSIS
3
Step 1 Place 1 mL of phenolphthalein in two test tubes. Add a few drops of 0.1 M HCl to one test tube, swirl to mix the solutions, and observe the color. Using the same procedure, add 0.1 M NaOH to the other test tube. Remember to record your observations. • Which solution is an acid? • Which solution is a base? • What color is the dye in the base? In the acid? • What color is the dye when mixed with the base?
Step 2 Using a dull knife or a thin strip of hard plastic, cut three blocks of agar of different sizes. These three blocks will be your models for cells. • Create a table (call it Table 1: Cube Calculations) that lists the following for each cube: cube size (cm), cube total volume, cube surface area, cube SA:VOL ratio, cube uncolored volume, cube colored volume, % of cube reached by diffusion. Show your calculations for all work. • After filling out cube size (cm), cube total volume, cube surface area, cube SA:VOL ratio in your table, make a prediction: If you put each of the blocks into a solution, into which block would that solution diffuse throughout the entire block fastest? Slowest? How do you explain the difference?
■Alternative Method Mix one packet of unflavored gelatin with 237 mL of water: add 2.5 mL 1% phenolphthalein and a few drops of 0.1 M NaOH. The solution should be bright pink. Pour the gelatin mixture into shallow pans and refrigerate overnight. You may use white vinegar in place of the 0.1 M HCl.
■ Conducting Your Investigation Using the materials listed earlier, design an experiment to test the predictions you just made regarding the relationship of surface area and volume in the artificial cells to the diffusion rate using the phenolphthalein/NaOH agar and the HCl solution. Once you have finished planning your experiment, have your teacher check your design. When you have an approved design, run your experiment and record your results in your table. Do your experimental results support your predictions? Explain and support!
■ Taking it further DISCUSS (one short paragraph for each) the implications of surface area involving:
Root hairs
Alveoli
Villi
Microvilli Include in your discussion: a description of each, where they are found and why these features have evolved (functionally).

Investigation 4 DIFFUSION AND OSMOSIS
4
■Procedure 2: Modeling Osmosis and Diffusion (adapted from pages 1-4 of Advanced Placement Biology Student Laboratory Manual c2001) In this experiment, you will create models of living cells using dialysis tubing. Like cell membranes, dialysis tubing is made from a material that is selectively permeable to water and some solutes. You will fill your model cells with different solutions and measure diffusion of small molecules through the membrane. The movement of a solute through a semi permeable membrane is called dialysis. The size of the minute pores in the dialysis tubing determines which substance can pass through the membrane. A solution of glucose and starch will be placed inside a bag of dialysis tubing. Distilled water will be placed in a beaker, outside the dialysis bag. After 30 minutes have passed, the solution inside the dialysis tubing and the solution in the beaker will be tested for glucose and starch. The presence of starch will be tested with Benedict's Solution or glucose test strips. The presence of starch will be tested with Lugol's solution (iodine-potassium-iodide). Your teacher will demonstrate what happens when iodine comes in contact with starch. Step 1 Obtain a 30 -cm piece of 2.5-cm dialysis tubing that has been soaking in water. Tie off one end of the tubing to form a bag. To open the other end of the bag, rub the end between your fingers until the edges separate. Step 2 Place approximately 15 mL of 15% glucose/ 1% starch solution in the bag. Tie off the other end of the bag, leaving sufficient space for the expansion of the bag's contents. Record the color of the solution in Table 1.1. Step 3 Test the 15% glucose / 1% starch solution in the bag for the presence of glucose. Your teacher may have you do a Benedict's test or use glucose test strips. Record the results in Table1.1. Step 4 Fill a 250 mL beaker or cup 2/3 full with distilled water. Add approximately 4 mL of Lugol's iodine solution to the distilled water and record the color in Table 1.1. Test the solution for glucose and record the results in Table 1.1. Step 5 Immerse the bag in the beaker of solution.
While you are waiting for your bag “cell” to soak, answer the following.
For each molecule being observed (both inside and outside your bag “cell”), PREDICT their direction of net (overall) diffusion: into the bag, out of the bag, both into and out of the bag equally, or none (will not diffuse across the dialysis membrane). State your reason for each prediction.
Step 6 Allow your set up to stand for approximately 30 minutes or you see a distinct color change in the bag or the beaker. Record the final color of the solution in the bag, and of the solution in the beaker, in Table 1.1. Step 7 Test the liquid in the beaker and in the bag for the presence of glucose. Record the results in Table 1.1.
Figure 3

Investigation 4 DIFFUSION AND OSMOSIS
5
Table 1.1 Dialysis bag –vs- Beaker contents
Initial Contents
Initial Solution Color
Final Solution Color
Initial Presence of Glucose
Final Presence of Glucose
Bag 15% Glucose & 1%
starch v vv vv
Beaker
H2O + IKI
v
vv
■Analysis of Results
1. Which substance(s) are entering the bag and which are leaving the bag? What experimental evidence supports your answer?
2. Explain the results you obtained. Include the concentration differences and membrane pore size in your discussion.
3. Quantitative data uses numbers to measure observed changes. How could this experiment be modified so that quantitative data could be collected to show that water diffused into the dialysis bag?
4. Based on your observations, rank the following by relative size, beginning with the smallest : glucose molecules, water molecules, IKI molecules, membrane pores, starch molecules.
5. What results would you expect if the experiment started with glucose and IKI solution inside the bag and only starch and water outside? Why?
6. Label the sketch (Fig.4) to indicate which solution is hypertonic and which is hypotonic, and draw arrows to show the initial net movement of water.
Figure 4

Investigation 4 DIFFUSION AND OSMOSIS
6
■Procedure 3: Osmosis in a Model System Design an experiment to identify the concentrations of the sucrose solutions For this experiment, you will create models of living cells using dialysis tubing. Like cell membranes, dialysis tubing is made from a material that is selectively permeable to water and some solutes. You will fill your model cells with different solutions and determine how molarity affects osmosis. Color-coded sucrose solutions of different, but unlabeled, concentrations will be prepared by your teacher
Materials • Distilled or tap water • 0.2 M sucrose solution • 0.4 M sucrose solution • 0.6 M sucrose solution • 0.8 M sucrose solution • 1 M sucrose solution • 20 cm-long dialysis tubing • Cups • Balances Step 1 Make dialysis tubing “cells” by tying a knot in one end of six pieces of dialysis tubing. Fill separate “cell” bags with approximately 15- 20 mL of each solution listed above. Remove most of the air from the bag (but leave enough space for water to osmose into the cell) and tie the baggie closed. Rinse the baggie carefully in water to remove any sucrose that may have spilled and carefully blot dry on a paper towel. Step 2 Weigh each “cell” (filled bag), record the initial mass in Table 1.2a. Step 3 Fill six 250 ml beakers two-thirds full with distilled water. See Figure 5. Submerge a bag in each beaker for 30 minutes. While you are waiting for you bag “cells” to soak: Predict what you think will happen during the experiment. (Think about which bags will lose water and which will gain water.)
Step 4 Re-weigh each bag (“cell”) after 30 minutes and record the final weight in Table 1.2a. Step 5 Calculate the percent change in mass using the following formula: (final mass– initial mass)/initial mass X 100. Record your results in Table 1.2a. Step 6 Compare your results with other lab groups. Can you determine the sucrose molarity of each colored solution? Step 7 Re-write your results in Table 1.2b, in order of sucrose molarity and graph these results on Graph 1.1. You should plot both your data AND the class average data on the same graph.
Hypothesis:
Figure 5: lab setup

Investigation 4 DIFFUSION AND OSMOSIS
7
Table 1.2a Dialysis Bag “Cells” by color
Color of sucrose solution
Initial Mass
Final Mass
Mass difference
% Change in Mass
Class Average
Distilled Water
Table 1.2b Dialysis Bag “Cells” by molarity
Contents in Bag Initial Mass
Final Mass
Mass difference
% Change in Mass
Class Average
Distilled Water
0.2 M
0.4 M
0.6 M
0.8 M
1.0 M

Investigation 4 DIFFUSION AND OSMOSIS
8
■Analysis of Results 1. Explain the relationship between the change in mass and the molarity of sucrose within the dialysis bag. 2. Predict what would happen to the mass of each bag in this experiment if all the bags were placed in 0.4 M sucrose solution instead of distilled water. Explain your response.
3. Why did you calculate the percent change in mass rather than simply using the change in mass?
4. A dialysis bag is filled with distilled water and then placed in a sucrose solution. The bag's initial mass is 20 g, and its final mass is 18 g. Calculate the percent change of mass, showing your calculations
5. What factors determine the rate and direction of osmosis?
6. How is the dialysis tubing functionally different from a cellular membrane?
7. When will the net osmosis rate equal zero in cells? Will it ever truly be zero?
Investigation 4 DIFFUSION AND OSMOSIS
9
■Procedure 4: Observing Osmosis in Living Cells ■Understanding Water Potential Water potential predicts which way water diffuses through plant tissues and is abbreviated by the Greek letter psi (ψ). Water potential is the free energy per mole of water and is calculated from two major components: (1) the solute potential (ψS), which is dependent on solute concentration, and (2) the pressure potential (ψP), which results from the exertion of pressure—either positive or negative (tension) — on a solution. The solute potential is also called the osmotic potential.
ψ = ψP + ψS Water Potential = Pressure Potential + Solute Potential
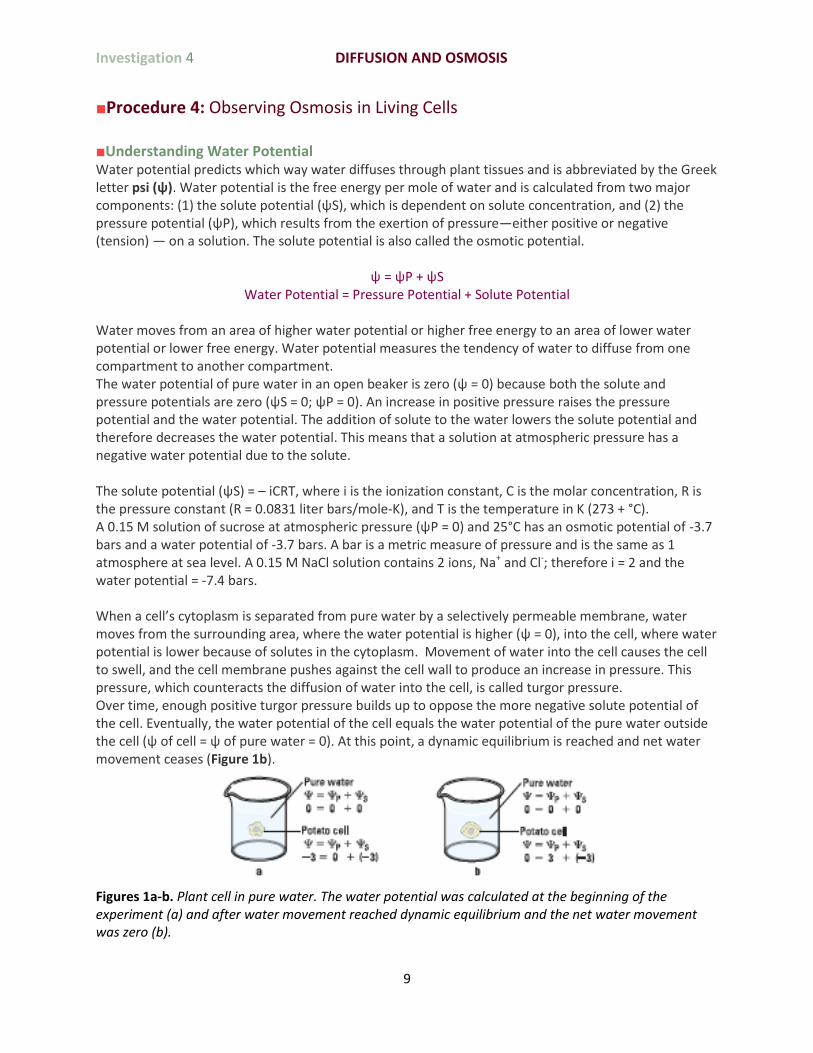
Water moves from an area of higher water potential or higher free energy to an area of lower water potential or lower free energy. Water potential measures the tendency of water to diffuse from one compartment to another compartment. The water potential of pure water in an open beaker is zero (ψ = 0) because both the solute and pressure potentials are zero (ψS = 0; ψP = 0). An increase in positive pressure raises the pressure potential and the water potential. The addition of solute to the water lowers the solute potential and therefore decreases the water potential. This means that a solution at atmospheric pressure has a negative water potential due to the solute. The solute potential (ψS) = – iCRT, where i is the ionization constant, C is the molar concentration, R is the pressure constant (R = 0.0831 liter bars/mole-K), and T is the temperature in K (273 + °C). A 0.15 M solution of sucrose at atmospheric pressure (ψP = 0) and 25°C has an osmotic potential of -3.7 bars and a water potential of -3.7 bars. A bar is a metric measure of pressure and is the same as 1 atmosphere at sea level. A 0.15 M NaCl solution contains 2 ions, Na+ and Cl-; therefore i = 2 and the water potential = -7.4 bars. When a cell’s cytoplasm is separated from pure water by a selectively permeable membrane, water moves from the surrounding area, where the water potential is higher (ψ = 0), into the cell, where water potential is lower because of solutes in the cytoplasm. Movement of water into the cell causes the cell to swell, and the cell membrane pushes against the cell wall to produce an increase in pressure. This pressure, which counteracts the diffusion of water into the cell, is called turgor pressure. Over time, enough positive turgor pressure builds up to oppose the more negative solute potential of the cell. Eventually, the water potential of the cell equals the water potential of the pure water outside the cell (ψ of cell = ψ of pure water = 0). At this point, a dynamic equilibrium is reached and net water movement ceases (Figure 1b).
Figures 1a-b. Plant cell in pure water. The water potential was calculated at the beginning of the experiment (a) and after water movement reached dynamic equilibrium and the net water movement was zero (b).

Investigation 4 DIFFUSION AND OSMOSIS
10
If solute is added to the water surrounding the plant cell, the water potential of the solution surrounding the cell decreases. If enough solute is added, the water potential outside the cell is equal to the water potential inside the cell, and there will be no net movement of water. However, the solute concentrations inside and outside the cell are not equal, because the water potential inside the cell results from the combination of both the turgor pressure (ψP) and the solute pressure (ψS). (See Figure 2.)
Figure 2. Plant cell in an aqueous solution. The water potential of the cell equals that of surrounding solution at dynamic equilibrium. The cell’s water potential equals the sum of the turgor pressure potential plus the solute potential. The solute potentials of the solution and of the cell are not equal.
If more solute is added to the water surrounding the cell, water will leave the cell, moving from an area of higher water potential to an area of lower water potential. The water loss causes the cell to lose turgor. A continued loss of water will cause the cell membrane to shrink away from the cell wall, and the cell will plasmolyze. Question Set 1:
1. Calculate the solute potential of a 0.1 M NaCl solution at 25°C.
2. If the concentration of NaCl inside the plant cell is 0.15 M, which way will the water diffuse if the
cell is placed into the 0.1 M NaCl solution?
3. What must the turgor pressure equal if there is no net diffusion between the solution and the cell?
4. Based upon your observations, can you predict the direction of osmosis in living cells when the
cells are placed in various solutions (distilled water? 0.1 M NaCl)?
The interactions between selectively permeable membranes, water, and solutes are important in cellular and organismal functions. For example, water and nutrients move from plant roots to the leaves and shoots because of differences in water potentials. Question Set 2: Based upon what you know and what you have learned about osmosis, diffusion, and water potential in the course of your investigations, ANSWER the following:
1. What would happen if you applied saltwater to the roots of a plant? Why?
2. What are two different ways a plant could control turgor pressure (the internal water potential within its cells)?
3. Will water move into or out of a plant cell if the cell has a higher water potential than its
surrounding environment?

Investigation 4 DIFFUSION AND OSMOSIS
11
PreLab Start by looking at a plant cell under the light microscope. If you need assistance, your teacher will show you how to place specimens on a slide. Question Set 3:
1. Where is the cell membrane in relation to the cell wall? Can you see the two structures easily? Why or why not?
2. What parts of the cell control the water concentration inside the cell? Can you see these under the microscope?
Back in Procedure 2 you tested diffusion and osmosis properties of several solutions. Now you are going to determine how they affect plant cell turgor pressure using potato cells.
3. What changes do you expect to see when potato cells are exposed to different molarity
solutions (as in Procedure 3 with your dialysis bags)? 4. How will you know if a particular treatment is increasing turgor pressure in the potato? If it is
reducing turgor pressure? (hint: use your senses) 5. How could you determine which solution is isotonic to the cells?
■Conducting Your Investigation Materials • Potatoes, sweet potatoes, or yams • Cork borers or french fry cutter • Balances • Metric rulers • Cups • Sucrose solutions of different concentrations, prepared by your teacher (as in Procedure 3) You will use the sucrose solutions to determine the water potential of the plant tissues. (You might want to review the information on water potential described in “Understanding Water Potential”.)
Use the following questions to guide your investigation: • How can you measure the plant pieces to determine the rate of osmosis? • How would you calculate the water potential in the cells? • Which solution had a water potential equal to that of the plant cells? How do you know? • Is the water potential in the different plants the same? • What would your results be if the potato were placed in a dry area for several days before your experiment? • When potatoes are in the ground, do they swell with water when it rains? If not, how do you explain that, and if so, what would be the advantage or disadvantage?
Determining the Water Potential of Potato Cells
In animal cells, the movement of water into and out of the cell is influenced by the relative concentration of solute on either side of the cell membrane. If water moves out of the cell, the cell will shrink. If water moves into the cell, the cell may swell or even burst. In plant cells, the presence of a cell wall prevents the cells from bursting, but pressure does eventually build up inside the cell and affects the process of osmosis. When the pressure inside the cell becomes large enough, no additional water will accumulate in the cell even the though cell still has a higher solute concentration than does pure

Investigation 4 DIFFUSION AND OSMOSIS
12
water. So movement of water through the plant tissue cannot be predicted simply through knowing the relative solute concentrations on either side of the plant cell wall. Instead, the concept of water potential is used to predict the direction in which water will diffuse through living plant tissues.
In a general sense, the water potential is the tendency of water to diffuse from one area to another under a given set of parameters. Water potential is expression in bars, a metric unit of pressure equal to about 1 atmosphere and measured with a barometer. Water potential is abbreviated by the Greek
letter psi and has two major components:
Step 1 Pour about 100 ml of each sucrose solution into a beaker (it will be one of the six solutions listed in Procedure 3). Slice a potato into pieces the shape of french fries or cylinders of equal length (about 4 cm). Make sure all skin is removed. You’ll need 4 of these pieces to test each solution, so cut 24 altogether. Step 2 Group your potato pieces into six groups of four. Determine the mass of the 4 potato cylinders together and record as “initial mass” in Table 1.3. Place the cylinders into labeled beakers of each sucrose solution and cover with plastic wrap. Leave overnight Step 3 Remove the cylinders from the beakers and carefully blot of any excess solution. Record the room temperature in degrees Celsius. _____. Then determine the final mass of each group of 4 potato cylinder together and record in Table 1.3. Step 4 Calculate the % change in mass for each group of potato pieces for each beaker.
In Figure 1.1, a potato cell is placed in pure water. Initially the water potential outside the cell is 0 and is higher than the water potential inside the cell (-3). Under these conditions there will be a net movement of water into the cell. The pressure potential inside the cell will increase until the cell reaches a state of equilibrium.

Investigation 4 DIFFUSION AND OSMOSIS
13
■Analysis of Results Compare your results with other lab groups. Table 1.3 Potato data
Contents in Beaker
(sucrose molarity)
Initial Mass
Final Mass
Mass difference
% Change in Mass
Class
Average
■Graph the results for both your individual data and class average on one graph. In order to do so, the 0 axis line should actually be in the middle of your graph. The y axis above this line should be labeled % increase in mass while the y axis below this line should be labeled % decrease. The x axis is the sucrose molarity within the beakers.

Investigation 4 DIFFUSION AND OSMOSIS
14
■ Determine the molar concentration of the potato cores. This would be the sucrose molarity in which the mass of the potato core does not change. To find this, draw the straight line on your graph that best fits your data. The point at which this line crosses the x axis represents the molar concentration of sucrose with a water potential that is equal to the potato tissue water potential. At this concentration, there is no net gain or loss of water from the tissue. What is the Molar concentration of the cores? __________
■ Calculate the solute potential for the sucrose solution in which the potato cells are at equilibrium using the formula. Show Calculations!
■Summarize 1. Why are most cells small, and why do they have cell membranes with many convolutions? 2. What organelles inside the cell have membranes with many convolutions? Why? 3. Do you think osmosis occurs when a cell is in an isotonic solution? Explain your reasoning. 4. Explain water potential and describe how it affects osmosis.
■Taking it further You are in the hospital and need intravenous fluids. You read the label on the IV bag, which lists all of the solutes in the water. 1. Why is it important for an IV solution to have salts in it? 2. What would happen if you were given pure water in an IV? 3. How would you determine the best concentration of solutes to give a patient in need of fluids
before you introduced the fluids into the patient’s body?