Investigation and Optimization of Ti-6Al-4V Alloy ... · Optimisation of Fatigue Behaviour of...
139
Optimisation of Fatigue Behaviour of Ti-6Al-4V Alloy Components Fabricated by Metal Injection Moulding Vom Promotionsausschuss der Technischen Universität Hamburg-Harburg zur Erlangung des akademischen Grades Doktor Ingenieur (Dr.-Ing.) genehmigte Dissertation von Orley Milagres Ferri aus Belo Horizonte, Brasil 2010
Transcript of Investigation and Optimization of Ti-6Al-4V Alloy ... · Optimisation of Fatigue Behaviour of...
Optimisation of Fatigue Behaviour of
Ti-6Al-4V Alloy Components
Fabricated by Metal Injection Moulding
Vom Promotionsausschuss der
Technischen Universität Hamburg-Harburg
zur Erlangung des akademischen Grades
Doktor Ingenieur (Dr.-Ing.)
genehmigte Dissertation
von
Orley Milagres Ferri
aus
Belo Horizonte, Brasil
2010

Vorsitzender des Prüfungsausschusses: Prof. Dr.re.nat. G. Schneider
1. Gutachter: Prof. Dr.-Ing. R. Bormann
2. Gutachter: Prof. Dr.-Ing. J. Albrecht
3. Gutachter: Prof. Dr.-Ing. K.U. Kainer
Tag der mündlichen Prüfung: 29 Oktober 2010
Acknowledgments
Many people contributed to my doctoral thesis over the last three years. Especially, I
would like to thank …
... my advisor, Prof. Rüdiger Bormann, for giving me the opportunity to
work on this exciting topic, as well as for his guidance, support and
motivation.
... my co-advisor, Dr. Thomas Ebel, for the excellent orientation and
discussions along experimental and written steps of my doctoral thesis.
... Prof. J. Albrecht and Prof. K.U. Kainer for co-reviewing the thesis.
... present members of the research group of WZM at GKSS: Wolfgang
Limberg, Martin Wolff, Andreas Dobernowsky, Prof. M. Dahms and
Gitta Hillis.
... all former students who worked on term, diploma or master thesis:
Juliano Soyama, Gideon Obasi, Akaichi Haithem, Björn Wiese, Arno
Twardogorski and Sascha Fensky.
... all former students who worked on term of DAAD rise program: Alyson
Liser and William Andrew Sharp II.
... my wife Lígia for her love, unfailing support and encouragement.
Geesthacht, Oktober 2010
CONTENTS
i
1. Introduction .................................................................................................................. 1
1.1. Scope of the work .................................................................................................. 2
2. State of the art ............................................................................................................... 3
2.1. Ti-6Al-4V alloy ..................................................................................................... 3
2.2. Metal injection moulding process.......................................................................... 6
2.2.1. Powders for MIM ........................................................................................... 7
2.2.2. Binder for MIM .............................................................................................. 7
2.2.3. Injection moulding and debinding .................................................................. 8
2.2.4. Sintering ....................................................................................................... 10
2.3. MIM of Ti-6Al-4V alloy ..................................................................................... 13
2.4. Fatigue ................................................................................................................. 14
2.4.1. Fatigue in Ti-6Al-4V alloy ........................................................................... 17
3. Experimental procedures ............................................................................................ 20
3.1. Materials .............................................................................................................. 20
3.2. MIM process ........................................................................................................ 20
3.2.1. Binder content .............................................................................................. 22
3.2.2. Particle size ................................................................................................... 23
3.2.3. Boron addition .............................................................................................. 23
3.3. The hot isostatic pressing .................................................................................... 24
3.3.1. Powder+HIP ................................................................................................. 24
3.3.2. MIM+HIP ..................................................................................................... 25
3.4. Surface modification and characterisation .......................................................... 25
3.5. Characterization of the samples ........................................................................... 26
3.5.1. Impurity levels, microstructural features and relative density ..................... 26
3.5.2. EBSD measurements .................................................................................... 28
3.5.3. Dilatometry ................................................................................................... 28
3.5.4. Tensile test .................................................................................................... 29
3.5.5. Fatigue experiments ...................................................................................... 30
4. Verification of the four-point bending fatigue tests ................................................... 32
4.1. Experimental procedure ....................................................................................... 32
4.2. Results and discussion ......................................................................................... 32
5. Results ........................................................................................................................ 35
CONTENTS
ii
5.1. The MIM31L samples ......................................................................................... 35
5.1.1. Tensile mechanical behaviour ...................................................................... 36
5.1.2. Fatigue behaviour ......................................................................................... 37
5.2. Binder content...................................................................................................... 41
5.2.1. Microstructural features ................................................................................ 41
5.2.2. Tensile properties ......................................................................................... 44
5.2.3. Fatigue behaviour ......................................................................................... 46
5.3. Shot peening as a surface treatment .................................................................... 48
5.3.1. Fatigue behaviour ......................................................................................... 48
5.3.2. The internal stresses promoted by the shot peening ..................................... 52
5.4. Particle size .......................................................................................................... 55
5.4.1. Microstructural features and tensile properties ............................................ 55
5.4.2. Fatigue behaviour ......................................................................................... 57
5.5. The MIM+HIP configuration .............................................................................. 59
5.5.1. Microstructural features ................................................................................ 59
5.5.2. Tensile properties ......................................................................................... 60
5.5.3. Fatigue behaviour ......................................................................................... 61
5.6. The Powder+HIP configuration........................................................................... 64
5.6.1. Microstructural features ................................................................................ 64
5.6.2. Tensile properties ......................................................................................... 66
5.6.3. Fatigue behaviour ......................................................................................... 67
5.7. Addition of boron on Ti-6Al-4V alloy ................................................................ 70
5.7.1. Boron content ............................................................................................... 70
5.7.2. Dilatometry ................................................................................................... 72
5.7.3. Impurity levels and microstructural features ................................................ 74
5.7.4. Tensile properties of the Ti-6Al-4V-0.5B alloy ........................................... 79
5.7.5. Fatigue behaviour ......................................................................................... 80
6. Discussion ................................................................................................................... 84
6.1. The influence of interstitial elements on the mechanical properties of MIM
samples ....................................................................................................................... 84
6.2. Ti-6Al-4V alloy processed by MIM .................................................................... 85
6.2.1. Tensile properties ......................................................................................... 86
CONTENTS
iii
6.2.2. Fatigue behaviour ......................................................................................... 86
6.3. Influence of surface quality ................................................................................. 88
6.3.1. Influence of the binder content ..................................................................... 89
6.3.2. Influence of shot peening ............................................................................. 92
6.4. Influence of the porosity ...................................................................................... 95
6.4.1. Influence of the particle size ......................................................................... 95
6.4.2. Influence of the HIP process ........................................................................ 96
6.5. Influence of the microstructure morphology ....................................................... 98
6.5.1. Microstructural features ................................................................................ 99
6.5.2. Tensile properties ......................................................................................... 99
6.5.3. Fatigue behaviour ....................................................................................... 100
6.6. Enhancement of the high cycle fatigue behaviour of the MIM components by
microstructure design ............................................................................................... 101
6.6.1. Variation of boron content .......................................................................... 102
6.6.2. Sintering process ........................................................................................ 102
6.6.3. The microstructure of Ti-6Al-4V-0.5B alloy sintered at 1400 °C ............. 104
6.6.4. The tensile property of Ti-6Al-4V-0.5B alloy sintered at 1400 °C ............ 106
6.6.5. Fatigue behaviour of Ti-6Al-4V-0.5B alloy sintered at 1400 °C ............... 107
7. Conclusions .............................................................................................................. 109
8. Suggestions for future work ..................................................................................... 112
References .................................................................................................................... 114
Tables ........................................................................................................................... 123
Figures .......................................................................................................................... 125
Abbreviations index ...................................................................................................... 132

INTRODUCTION
1
1. Introduction
Research on titanium and its alloys is of great interest because of their unique
combination of properties such as: high specific strength, outstanding corrosion
resistance and biocompatibility [1]. Titanium is a nearly ideal material for the
development of bone reinforcement and replacement products [2]. Furthermore, special
attention has been given to extending the application of titanium in the automotive
industry due to demands to reduce energy consumption [3]. In terms of space
technologies, e.g. the Ti-6Al-4V alloy has been widely used as a viable engineering
material [4]. However, due to the rather high costs of processing and raw materials, the
use of titanium alloys in mass production remains limited.
Powder metallurgy (PM) has been used to lower the cost of titanium alloy parts since
the 1970s [5]. In contrast to traditional PM techniques such as pressing, metal injection
moulding (MIM) combines the materials flexibility of powder metallurgy with the
design flexibility of plastic injection moulding. Nowadays, it is possible to fabricate Ti-
6Al-4V alloy components produced by MIM with excellent tensile properties (UTS >
800 MPa, > 14%) [6]. However, components such as permanent implants, automotive
parts and some special aerospace parts require extremely high reliability, when e.g.
dynamic loading is applied. Unfortunately, the performance of the MIM components
with respect to fatigue resistance is not as good as demonstrated for the static tensile
behaviour. A recent investigation [7] demonstrated that the fatigue endurance limit of
the Ti-6Al-4V alloy at 107 cycles is approximately 380 MPa. This value is significantly
lower than the value found, typically around 600 MPa, for annealed, wrought material
with its usual lamellar microstructure [8, 9]. Moreover, it is much lower compared to
the thermo-mechanically treated Ti-6Al-4V alloy with an equiaxed microstructure
which exhibits an endurance limit typically above 800 MPa [10-12].
It has been assumed so far, that the main factors responsible for such behaviour are
related to surface quality and the presence of pores. Nevertheless, it is important to point
out that no systematic study of the influence of these features on the fatigue behaviour
of Ti-6Al-4V alloy processed by MIM has been carried out to date. Furthermore, the
interaction between microstructural features such as porosity, grain size and impurity
INTRODUCTION
2
levels with the fatigue behaviour of MIM components remains unclear. Consequently, if
Ti-6Al-4V alloy components fabricated by the MIM technique are to be used in
applications where fatigue resistance in the range of wrought material is required, then
identification of the critical features responsible for the degradation of fatigue behaviour
of the MIM parts is necessary.
1.1. Scope of the work
In the present work, the high cycle fatigue behaviour of Ti-6Al-4V components
fabricated by MIM is investigated in detail. Experiments were conducted in an attempt
to determine the influence of critical features such as surface quality, porosity and
microstructural features on the fatigue behaviour of MIM Ti-6Al-4V components. In
order to identify the crack initiation mechanism, detailed examination of the fatigued
fracture surfaces was performed. In a second step, the fatigue response of different
configurations is described in terms of tensile properties, microstructural features,
surface quality and composition.
The present work contributes to the understanding of the influence of surface quality,
microstructural features and process parameters on the fatigue behaviour of MIM Ti-
6Al-4V components. Based on this comprehensive understanding, an alloy has been
designed with the microstructural features required to minimise the degradation of the
high cycle fatigue behaviour resulting from the presence of inherent MIM processing
defects.
STATE OF THE ART
3
2. State of the art
2.1. Ti-6Al-4V alloy
Titanium was first discovered by the mineralogist and chemist, William Gregor in 1791.
Four years later, Martin Klaproth, based on the story of the Greek mythological
children, the Titans, named the element as titanium. After that, more than 100 years
were necessary to isolate the titanium metal from its oxide. Finally, the first alloys, as
well as the popular Ti-6Al-4V alloy, were developed in the late 1940s. The Ti-6Al-4V
alloy is the most common used alloy among the commercially available titanium alloys.
The reason for this success is the good balance of its properties and the intensive
development and testing of this alloy during the approximately last 60 years [13].
Ti-6Al-4V alloy belongs to the group of + titanium alloys. The aluminium acts as a
stabilizer and the vanadium as a stabilizer. At this specific composition both phases,
and , are presented in the microstructure at room temperature. Typically, three
different microstructure morphologies can be obtained by changing the thermo-
mechanical processing route: fully lamellar structures, fully equiaxed structures, and so-
called bi-modal microstructures [14].
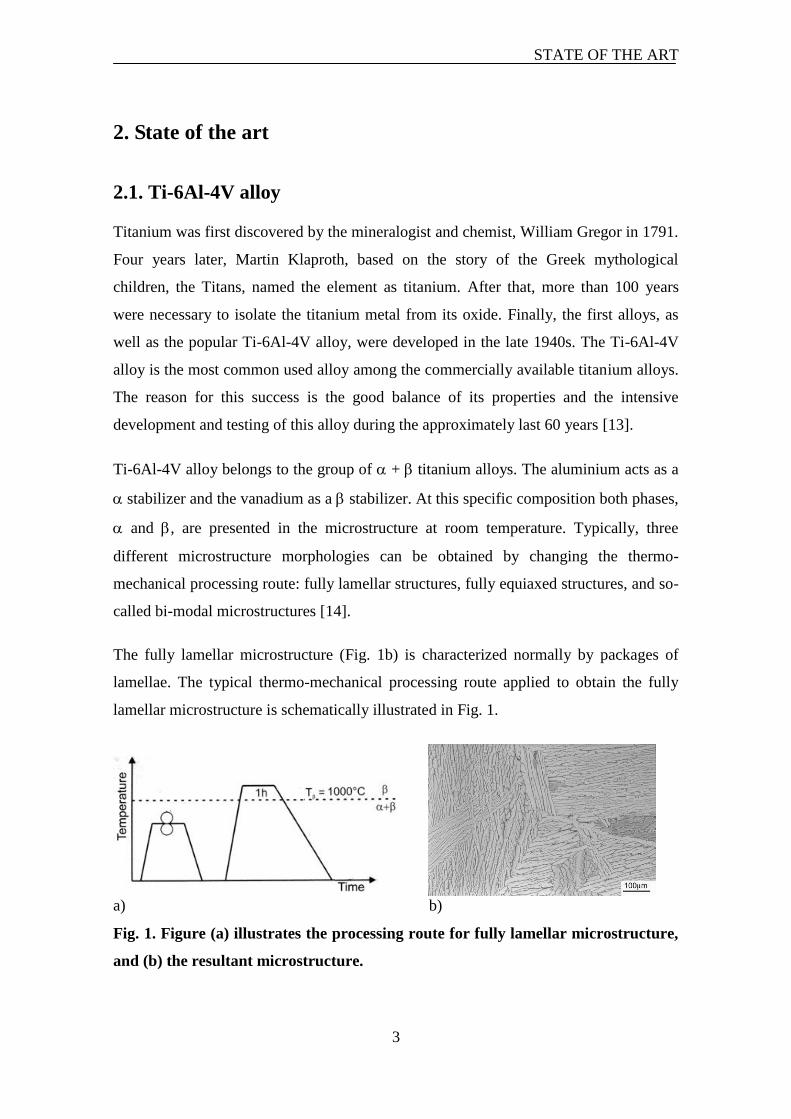
The fully lamellar microstructure (Fig. 1b) is characterized normally by packages of
lamellae. The typical thermo-mechanical processing route applied to obtain the fully
lamellar microstructure is schematically illustrated in Fig. 1.
a) b)
Fig. 1. Figure (a) illustrates the processing route for fully lamellar microstructure,
and (b) the resultant microstructure.
STATE OF THE ART
4
The most important parameter in the processing route is the cooling rate from phase
field during the recrystallization step since it delineates the size of the lamellae, the
colony size and the thickness of the layers at grain boundaries. In the fully lamellar
microstructure the colony size, alternating and plates with distinct orientation
relationship, is the feature that defines a grain, or in other words, the size of the slip
length during plastic deformation. Thus this feature determines mechanical properties
such as tensile yield strength and high cycle fatigue strength.
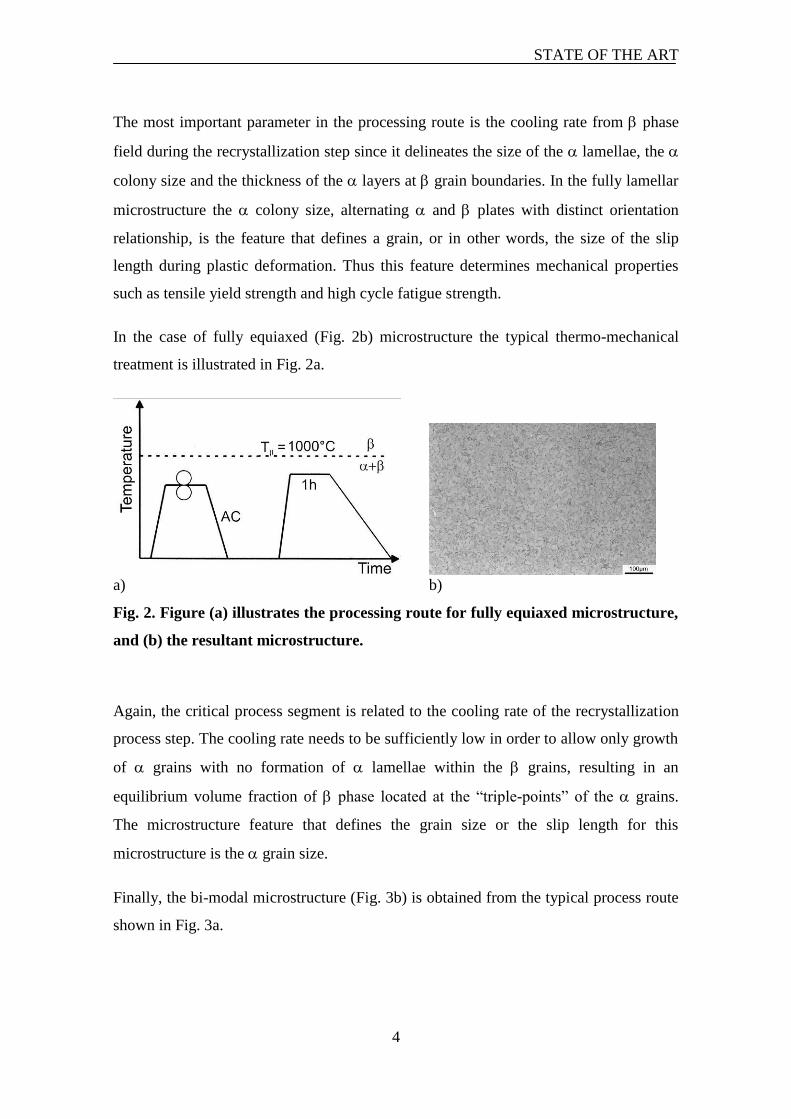
In the case of fully equiaxed (Fig. 2b) microstructure the typical thermo-mechanical
treatment is illustrated in Fig. 2a.
a) b)
Fig. 2. Figure (a) illustrates the processing route for fully equiaxed microstructure,
and (b) the resultant microstructure.
Again, the critical process segment is related to the cooling rate of the recrystallization
process step. The cooling rate needs to be sufficiently low in order to allow only growth
of grains with no formation of lamellae within the grains, resulting in an
equilibrium volume fraction of phase located at the “triple-points” of the grains.
The microstructure feature that defines the grain size or the slip length for this
microstructure is the grain size.
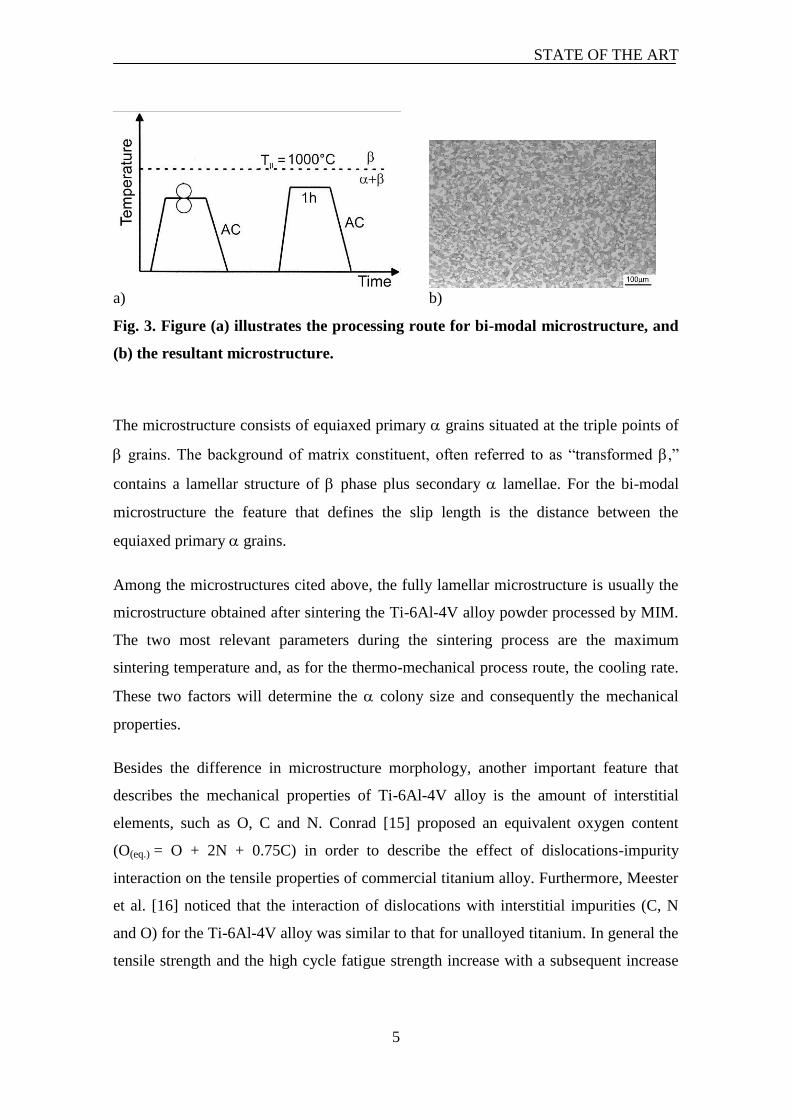
Finally, the bi-modal microstructure (Fig. 3b) is obtained from the typical process route
shown in Fig. 3a.
STATE OF THE ART
5
a) b)
Fig. 3. Figure (a) illustrates the processing route for bi-modal microstructure, and
(b) the resultant microstructure.
The microstructure consists of equiaxed primary grains situated at the triple points of
grains. The background of matrix constituent, often referred to as “transformed ,”
contains a lamellar structure of phase plus secondary lamellae. For the bi-modal
microstructure the feature that defines the slip length is the distance between the
equiaxed primary grains.
Among the microstructures cited above, the fully lamellar microstructure is usually the
microstructure obtained after sintering the Ti-6Al-4V alloy powder processed by MIM.
The two most relevant parameters during the sintering process are the maximum
sintering temperature and, as for the thermo-mechanical process route, the cooling rate.
These two factors will determine the colony size and consequently the mechanical
properties.
Besides the difference in microstructure morphology, another important feature that
describes the mechanical properties of Ti-6Al-4V alloy is the amount of interstitial
elements, such as O, C and N. Conrad [15] proposed an equivalent oxygen content
(O(eq.) = O + 2N + 0.75C) in order to describe the effect of dislocations-impurity
interaction on the tensile properties of commercial titanium alloy. Furthermore, Meester
et al. [16] noticed that the interaction of dislocations with interstitial impurities (C, N
and O) for the Ti-6Al-4V alloy was similar to that for unalloyed titanium. In general the
tensile strength and the high cycle fatigue strength increase with a subsequent increase
STATE OF THE ART
6
of O(eq.) [14, 17] whereas the ductility and specially the fracture toughness decrease with
a higher amount of interstitial elements [18-20].
2.2. Metal injection moulding process
The idea of using thermoplastics as vehicle for metal or ceramic powders to get
moulded parts of a desired shape has been developed since the late 1920’s [21].
Evolution of this process idea in terms of maximization of the solid particles content
and the extraction of the thermoplastic polymer binder during sintering allowed the
production of metals and ceramics parts with a highly complexed shape, low cost
forming, and high performance properties [22]. Consequently, this new process named
powder injection moulding (PIM) combines the advantages of powder metallurgy
process with the design flexibility of thermoplastic injection moulding technique [23,
24]. If ceramics are used, the process is termed “ceramic injection moulding” (CIM) and
if metals are applied the term is “metal injection moulding” (MIM) [23, 25]. The
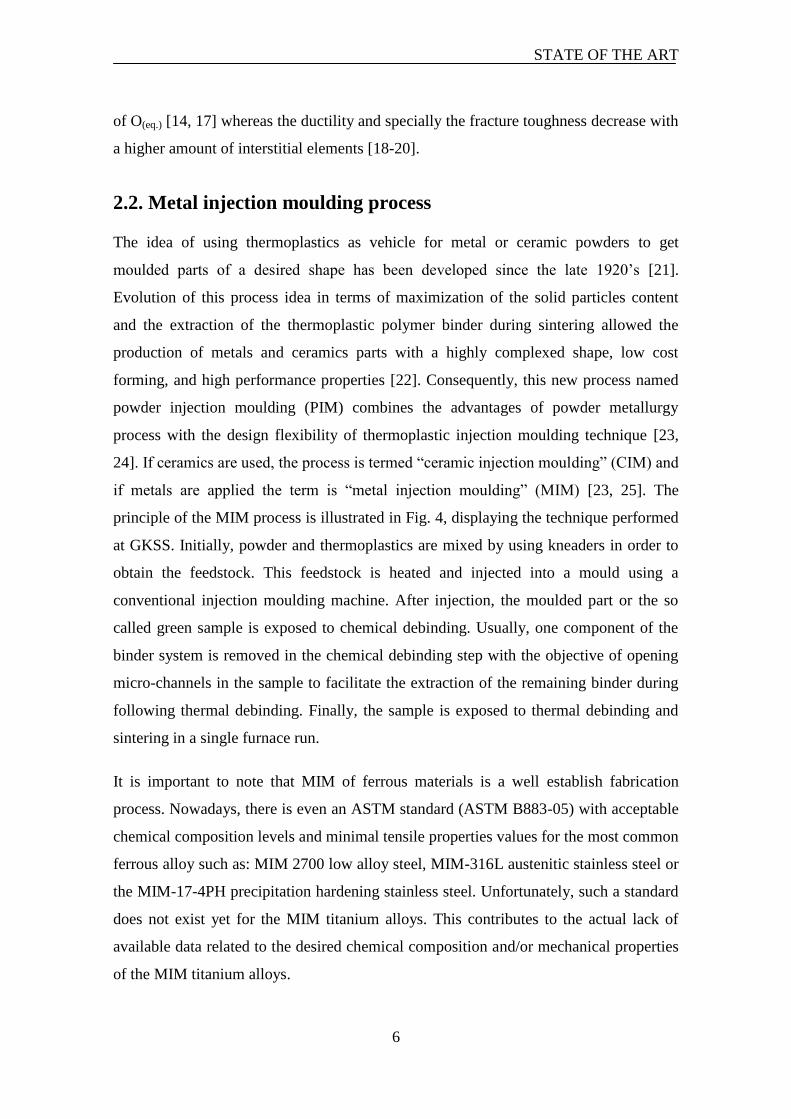
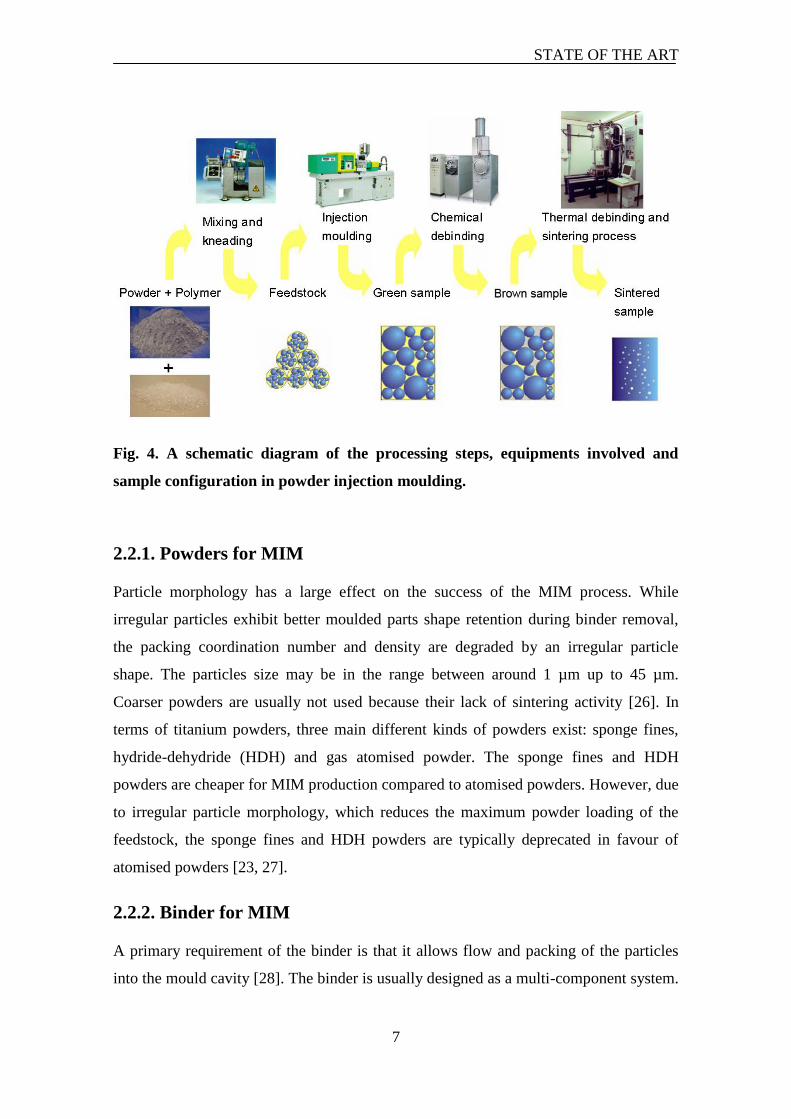
principle of the MIM process is illustrated in Fig. 4, displaying the technique performed
at GKSS. Initially, powder and thermoplastics are mixed by using kneaders in order to
obtain the feedstock. This feedstock is heated and injected into a mould using a
conventional injection moulding machine. After injection, the moulded part or the so
called green sample is exposed to chemical debinding. Usually, one component of the
binder system is removed in the chemical debinding step with the objective of opening
micro-channels in the sample to facilitate the extraction of the remaining binder during
following thermal debinding. Finally, the sample is exposed to thermal debinding and
sintering in a single furnace run.
It is important to note that MIM of ferrous materials is a well establish fabrication
process. Nowadays, there is even an ASTM standard (ASTM B883-05) with acceptable
chemical composition levels and minimal tensile properties values for the most common
ferrous alloy such as: MIM 2700 low alloy steel, MIM-316L austenitic stainless steel or
the MIM-17-4PH precipitation hardening stainless steel. Unfortunately, such a standard
does not exist yet for the MIM titanium alloys. This contributes to the actual lack of
available data related to the desired chemical composition and/or mechanical properties
of the MIM titanium alloys.
STATE OF THE ART
7
Fig. 4. A schematic diagram of the processing steps, equipments involved and
sample configuration in powder injection moulding.
2.2.1. Powders for MIM
Particle morphology has a large effect on the success of the MIM process. While
irregular particles exhibit better moulded parts shape retention during binder removal,
the packing coordination number and density are degraded by an irregular particle
shape. The particles size may be in the range between around 1 µm up to 45 µm.
Coarser powders are usually not used because their lack of sintering activity [26]. In
terms of titanium powders, three main different kinds of powders exist: sponge fines,
hydride-dehydride (HDH) and gas atomised powder. The sponge fines and HDH
powders are cheaper for MIM production compared to atomised powders. However, due
to irregular particle morphology, which reduces the maximum powder loading of the
feedstock, the sponge fines and HDH powders are typically deprecated in favour of
atomised powders [23, 27].
2.2.2. Binder for MIM
A primary requirement of the binder is that it allows flow and packing of the particles
into the mould cavity [28]. The binder is usually designed as a multi-component system.
STATE OF THE ART
8
The backbone component, typically a thermoplastic, retains the moulded shape during
all phases prior to the later stages of debinding. The second component, which is
typically a wax, has the function to improve the flowability of the mixture. Furthermore,
as the wax is the first component to be extracted during debinding, open pores will be
created. This will allow the gaseous products of the remaining polymer to diffuse out of
the structure without generating an internal vapour pressure that might cause compact
failure. In addition, removal of half the amount of binder means to reduce the potential
pick-up of carbon during thermal debinding significantly. Finally, additives such as
surfactants are added in order to reduce the contact angle by lowering the surface energy
of the binder-powder interface [29, 30].
Currently, there are a number of binder systems, e.g. Polyethylene, Paraffin, Stearic
Acid [31], Naphthalene, Stearic Acid, Polyethylene Vinyl Acetate [32] and etc., which
appear to have the necessary characteristics to process titanium alloys by MIM
technology approach.
2.2.3. Injection moulding and debinding
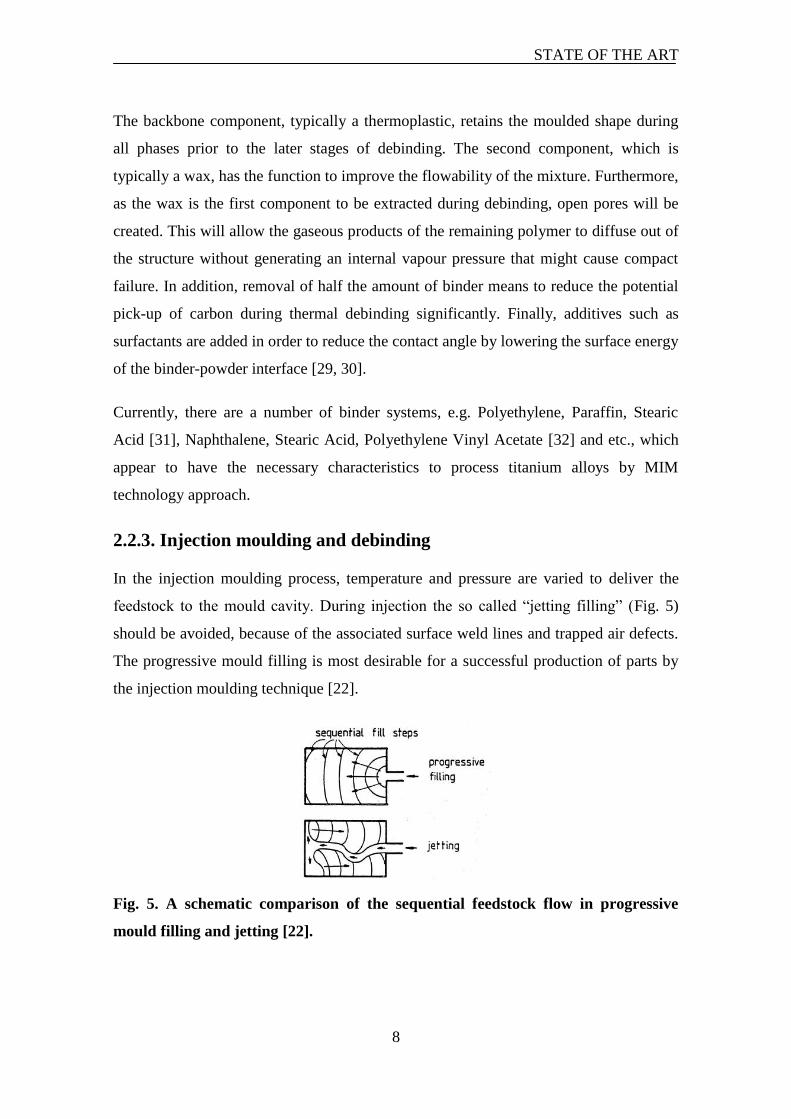
In the injection moulding process, temperature and pressure are varied to deliver the
feedstock to the mould cavity. During injection the so called “jetting filling” (Fig. 5)
should be avoided, because of the associated surface weld lines and trapped air defects.
The progressive mould filling is most desirable for a successful production of parts by
the injection moulding technique [22].
Fig. 5. A schematic comparison of the sequential feedstock flow in progressive
mould filling and jetting [22].
STATE OF THE ART
9
In terms of rheological behaviour, the feedstock should exhibit a pseudo-plastic flow
characteristic [33]. Pseudo-plastic flow refers to a substance that demonstrates a
decrease in viscosity as the shear rate increases. Apart from shear rate, in general the
viscosity of the feedstock is also dependent of temperature, powder loading, powder
characteristics and the binder system composition. It is desirable that the viscosity of the
feedstock should decrease quickly with increasing shear rate during moulding. The
shear shinning of MIM feedstock with the increase of shear rate results from the powder
particle ordering and the binder molecule orientation with flow [34]. Empirical studies
have demonstrated that a viscosity of less than 103 Pa
.sec is desired in order to obtain
flow conditions. Furthermore, during moulding the shear rates usually ranges between
10 and 105 sec
-1, with the low shear rate at the walls and the high shear rate at the gate
[35, 36]. Because of so large variations of the viscosity and non-homogeneous viscosity
distribution during the filling process, it is possible that at critical conditions powder
binder segregation or other defects related to the filling behaviour occur [37].
The binder removal process includes a series of physical or chemical process such as the
transport of the evaporated or decomposed binder phase to the surface through the
connected pore channels inside of the compacts, the flow and redistribution of liquid
binder phase in compacts due to capillary forces and the evaporation or decomposition
of the binder components [38]. The spaces between the powder particles, which are
filled with the binder phase, are opened gradually during the first step of debinding
process. Barone et al. [39] and Cima et al. [40] observed that after approximately 40%
binder extraction the connected pore channels were formed in the moulded parts. These
connected pore channels are essential for the subsequent debinding of the remaining
binder.
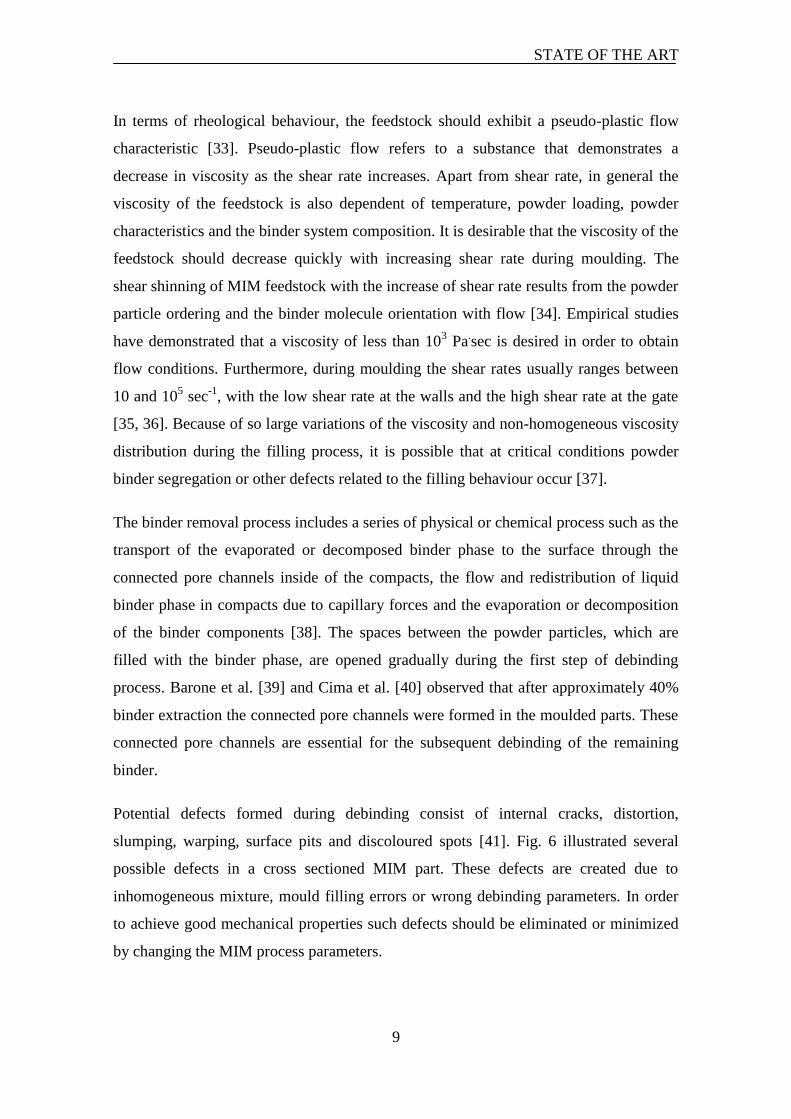
Potential defects formed during debinding consist of internal cracks, distortion,
slumping, warping, surface pits and discoloured spots [41]. Fig. 6 illustrated several
possible defects in a cross sectioned MIM part. These defects are created due to
inhomogeneous mixture, mould filling errors or wrong debinding parameters. In order
to achieve good mechanical properties such defects should be eliminated or minimized
by changing the MIM process parameters.
STATE OF THE ART
10
Fig. 6. Possible defects in a MIM component that might be noted after debinding
or sintering process [22].
2.2.4. Sintering
Sintering is a process where particles bond together by atomic motions acting to reduce
the high surface energy associated with an unsintered powder [42]. Theoretical concepts
of sintering are based on thermally activated processes effecting the growth of contacts
between particles and their coalescence [43]. Thus, local kinetics of the process, contact
formation and driving force nature have been studied to a large degree [44-46]. The
main driving force for the sintering process is the reduction in surface free energy of the
particle. The reduction is achieved mainly by diffusional transport of material from the
centres of particles to the particle-particle necks [47]. Basically, mass transport during
sintering without liquid phases have been discussed under two categories for
polycrystalline materials:
diffusion mechanism and
plastic deformation mechanism.
The first mechanism can be divided in three main segments:
evaporation-condensation mechanism,
surface diffusion mechanism and
volume diffusion mechanism.
Surface diffusion and evaporation-condensation mechanisms are transport mechanisms
that can produce surface smoothing, particle joining and pore rounding, but do not
STATE OF THE ART
11
produce volume shrinkage [48]. Alternatively, the volume diffusion is fairly important
to the densification of sintered materials. The volume diffusion can be further divided in
lattice diffusion and grain boundary diffusion.
The second mechanism was postulated by Lenel [49] and is more applicable to the early
stage of sintering where a dislocation climb mechanism may be rate controlled by the
diffusion of vacancies toward the dislocations. The experimental evidence which has
been presented in support of the deformation mechanism for material transport is strong,
especially under pressure condition, e.g. sintering with hot isostatic pressing (HIP) [46].
However, in the absence of an applied pressure the available stress in the system is
insufficient to nucleate new dislocations [22, 50]. Furthermore, Taskinen [51]
demonstrated for a carbonyl nickel powder that the material transport in the sintering of
normal powder (particle size 50 to 500 µm) is never controlled or dominated by
dislocation motion. Only in the case of micron-size particles is it possible for
dislocations to be the dominated material transport mechanism.
In order to better understand the sintering behaviour of a given material, the process is
typically divided in three stages [42]:
initial stage: the particles form bonds at the particles contacts and a fully
interconnected pore structure with a rough pore shape are presented,
intermediate stage: at this point significant densification occurs, where the
density is normally in the range of 70 to 92% of the bulk value. The interaction
between pores and grain boundaries is crucial for the further densification.
final stage: the pores at this stage tend to be isolated and rounded. Further
densification is nearly inhibited since vacancy diffusion through the lattice to the
grain boundaries is required in order to eliminate the isolated pores. In general
coarsening of the microstructure is also observed at this stage.
During sintering of a powder compact, both densification and grain growth occur
simultaneously [52-54]. It has been recognised that the relationship between
densification and grain growth must be assessed in order to understand and control the
sintering process. A prominent approach is to investigate the interaction between pores
and grain boundaries. These interactions can be expressed into three forms: the pores
STATE OF THE ART
12
can act as a barrier for grain growth [55], the pores can be dragged by the grain
boundaries, or the grain boundaries can break way from the pores, leaving them isolated
in the grain interior [42]. The first and the second situation are favourable to the
densification whereas the third situation supports the coarsening of the microstructure.
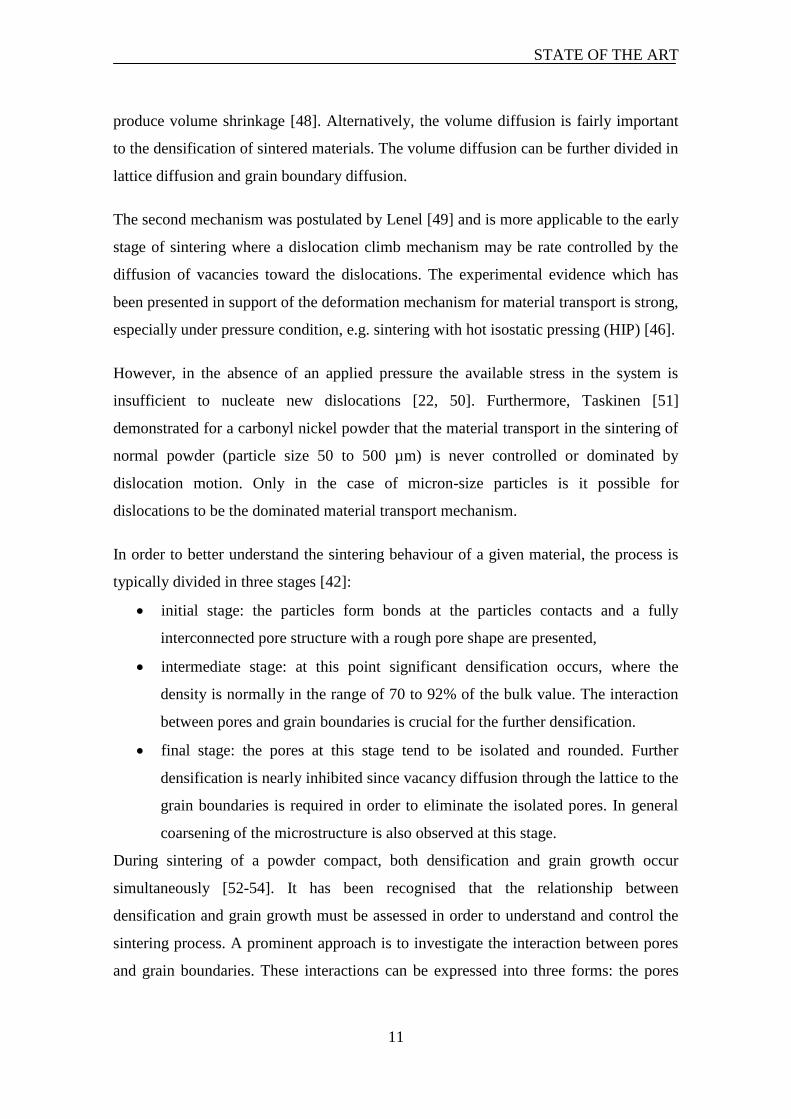
Brook [56] explained the breakaway of the grain boundaries from the pores in terms of
pores and grain boundary mobility. Separation of pores from the grain boundary will
occur, when pore and grain boundary velocity become different. Additionally, he
demonstrated that the pore and the grain boundary mobility are related to the size of
these features. Fig. 7 illustrated schematically when the breakaway occurs as a function
of grain and pore sizes for a hypothetic system.
Fig. 7. Grain size and pore size interaction during sintering, showing the condition
where breakaway may occur [56].
Pores and second phase inclusions may inhibit the grain boundary migration and can be
used to improve densification since the pores located at grain boundaries can be
removed faster by grain boundary diffusion than those located in the interior of the
grains [54].
Another attractive option for increasing the final densification of sintered parts is the
utilization of additional phases which improve the diffusion rates by stabilizing
desirable crystal structures or, more typically, to form a liquid phase to increase the
sintering rate [57].
STATE OF THE ART
13
Despite a strong research activity for decades, numerous questions remain open, in
particular when real systems are concerned. The main problem of real system is the fact
that the sintering kinetics of real porous bodies is determined not only by the properties
of the particles and the nature of their interaction, but also by macroscopic factors such
as defects due to powder packing faults, presence of inclusions, particle rearrangement
and anisotropic shrinkage [43].
2.3. MIM of Ti-6Al-4V alloy
A major concern of titanium alloys is their high manufacture cost compared to steels or
aluminium alloys. In order to reduce these cost near net shape techniques such as MIM
and precision casting have been successfully applied in the fabrication e.g. of Ti-6Al-4V
alloy [8, 27, 58, 59]. MIM is basically the approach of choice when a large number of
small parts of highly complex shape are required [60]. However, the unsuccessful
application of MIM technology in the mass production of titanium parts during the last
decades was mainly related to the unavailability of suitable powder and to inadequate
sintering atmosphere and binders for a material as reactive as titanium [61]. However,
nowadays it is possible to produce Ti-6Al-4V components fabricated by MIM with
excellent mechanical properties at a tolerable impurity level [6, 62-65]. Gas atomised
spherical and prealloyed titanium powders are currently the best option among the
available powders for obtaining MIM components. A maximum oxygen content of 0.2
wt.% and tensile elongation in the range of 15 % [62] are achievable. Nevertheless, the
powder cost is a barrier to widespread applications. An alternative could be the use of
HDH titanium powder. Unfortunately, poor rheological properties and sintering activity
due to irregular particle shape and often too contaminated powders leading to
insufficient tensile properties are obstacles for the application of HDH titanium powder
in MIM process for commercial applications [66, 67].
An essential problem in using the MIM technology for small and complicated titanium
parts is the high affinity of the powder towards carbon, oxygen and nitrogen. As
discussed in section 2.1 these elements tend to affect the mechanical properties of
titanium alloys and for many applications the loss of ductility due to high impurities
level is unacceptable [68]. Recently, much effort has been put into regulating powders,
STATE OF THE ART
14
modifying binders and optimising other MIM process steps in order to reduce
contamination [69].
2.4. Fatigue
The study of the fatigue of materials and structures started in the nineteenth century
because of the appearance of service fractures during cyclic loading of components at
relative low loads e.g. below the yield strength [70]. One of the first studies concerned
with the identification of the phenomenon of fatigue was carried out by Wöhler [71]. In
his study Wöhler investigated the dependence of the stress on the number of loading
cycles to complete fracture. The maximum stress at which fracture does not occur even
after a very high number of loading cycles (of the order of 107) was assumed to be the
fatigue limit. The relationship between stress and cycles was believed to be as a
rectangular hyperbolic relationship with a horizontal asymptote (fatigue limit) [70].
However, such condition may not exist for all metallic materials as reported by Bathias
[72]. He noticed that for the Ti-6Al-4V alloy fatigued up to 109 cycles the fatigue limit
was approximately 100 MPa lower than the values obtained at 107 cycles.
The fatigue process has proved to be very difficult to study. Nonetheless, the basic
principles of fatigue behaviour of metallic materials has been summarised in numerous
publications [73, 74]. Now, it is generally agreed that four distinct phases of fatigue
may occur [17]:
nucleation,
structurally dependent crack propagation (microstructurally short cracks phase),
crack propagation that is described by either linear elastic, elastic-plastic or fully
plastic fracture mechanics and
final instability.
A more general approach separates the fatigue life of a component in two parts: the
fatigue crack initiation and the fatigue crack propagation. During high cycle fatigue
regime the crack initiation phase, which includes nucleation and propagation of
microstructurally short cracks, is the determinant phase. In case of normally processed
samples, it is assumed that approximately 90 % of the total fatigue life is determined by
the crack initiation phase [75]. Additionally, the period of crack nucleation in smooth
STATE OF THE ART
15
specimens without defects is assumed to be in the range of 5-20 % of the fatigue life.
The major part of the life is spent in the growth of microstructurally short cracks [76].
Consequently, in order to predict the fatigue response of a given material it is essential
to identify and understand the dominant mechanisms during nucleation and propagation
of microstructurally short cracks propagation.
Crack nucleation in ductile metals is often associated with local plastic deformation. In
the absence of metallurgical defects such as casting pores or impurity inclusions, fatigue
crack in single-phase materials initiate at the surface [77]. Surface cracks are typically
observed to form at the following sites: slip bands, grain boundaries, precipitates,
dispersoids and twin boundaries. All of these regions are subject to stress concentrations
and thus to a possible localized plastic deformation.
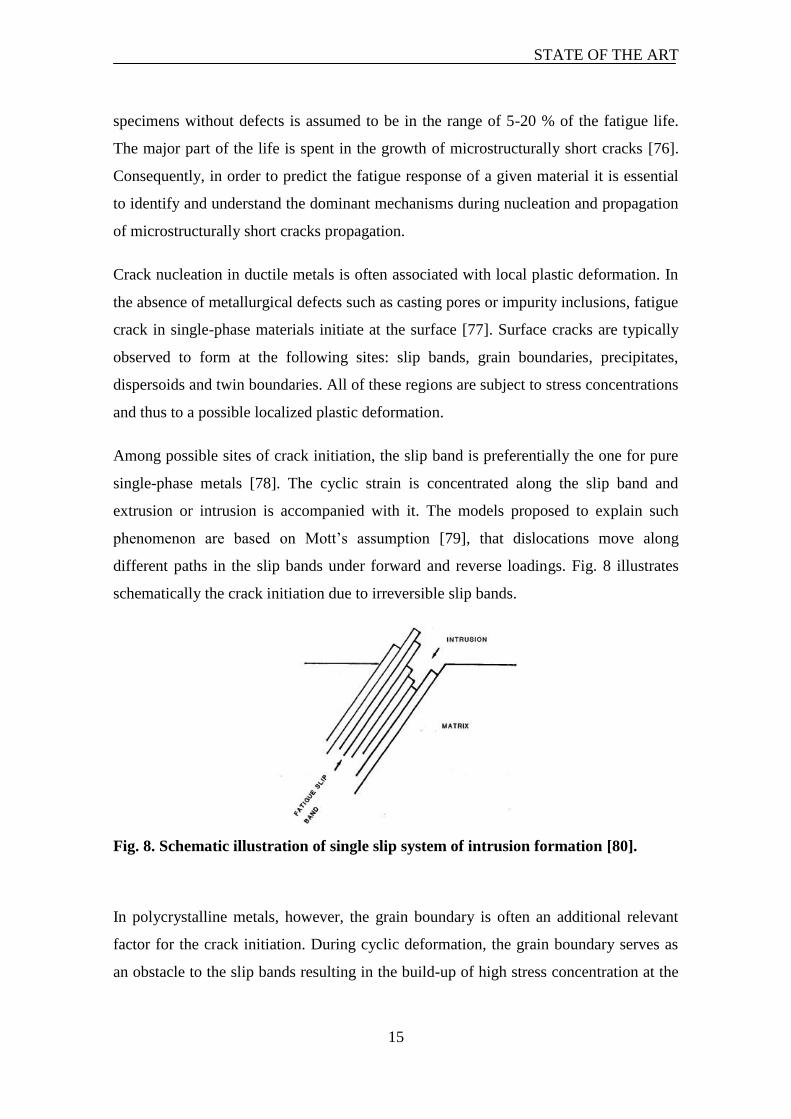
Among possible sites of crack initiation, the slip band is preferentially the one for pure
single-phase metals [78]. The cyclic strain is concentrated along the slip band and
extrusion or intrusion is accompanied with it. The models proposed to explain such
phenomenon are based on Mott’s assumption [79], that dislocations move along
different paths in the slip bands under forward and reverse loadings. Fig. 8 illustrates
schematically the crack initiation due to irreversible slip bands.
Fig. 8. Schematic illustration of single slip system of intrusion formation [80].
In polycrystalline metals, however, the grain boundary is often an additional relevant
factor for the crack initiation. During cyclic deformation, the grain boundary serves as
an obstacle to the slip bands resulting in the build-up of high stress concentration at the
STATE OF THE ART
16
boundary. Such high stress concentrations promote early crack initiation during fatigue
[76, 81].
Recently, Miller [82] introduced the concept of microstructure fracture mechanics
(MFM) which is essential in order to understand the very long-life fatigue failures (106
– 1012
cycles). Basically, he emphasized the existence of two fundamentally different
conditions in polycrystalline metals, one related to long crack growth behaviour
involving minimal effects of microstructure, and another concerned with microstructure
dominated threshold condition. Furthermore, he pointed out that the fatigue limit of
most materials does not reflect the critical stress for crack initiation, but the threshold
stress for non-propagation of the crack emanating from original cracks, defects or
inhomogeneities. Finally, he highlighted the statement of Kitagawa and Takahashi [83]
that linear elastic fracture mechanics (LEFM) should not be applied to either physically
small or microstructurally short cracks since the assumption of small-scale yielding
conditions at such short cracks does not apply.
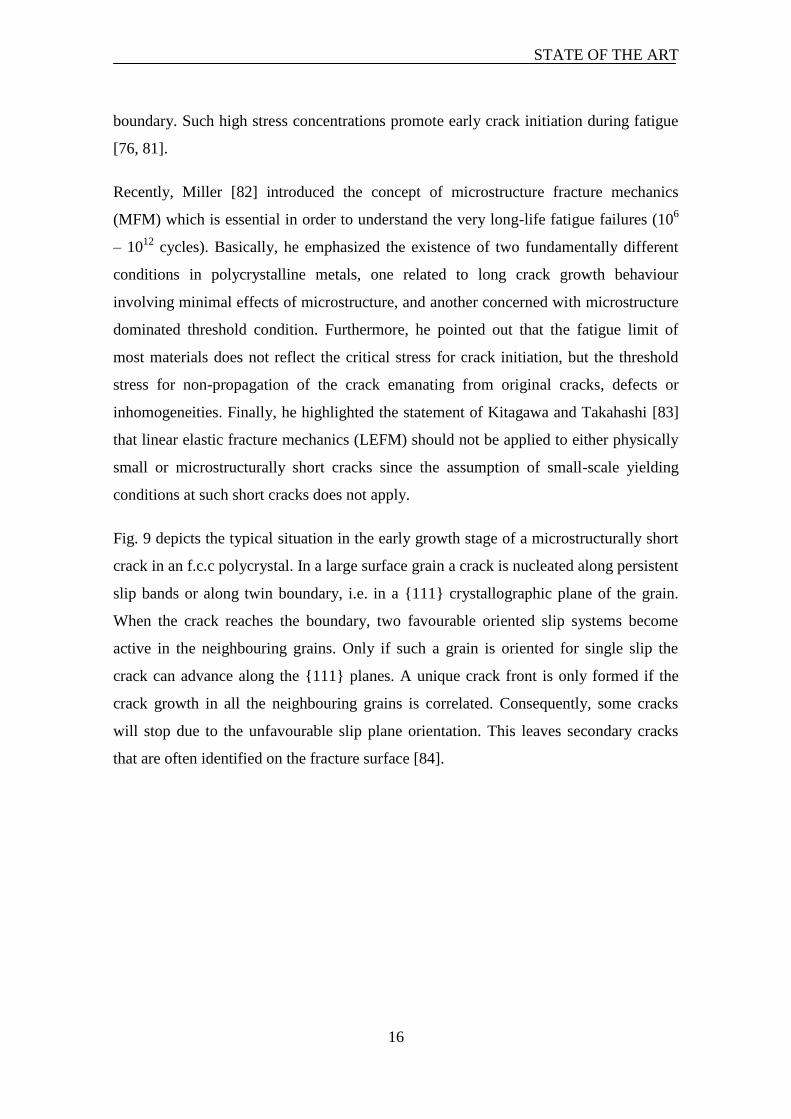
Fig. 9 depicts the typical situation in the early growth stage of a microstructurally short
crack in an f.c.c polycrystal. In a large surface grain a crack is nucleated along persistent
slip bands or along twin boundary, i.e. in a {111} crystallographic plane of the grain.
When the crack reaches the boundary, two favourable oriented slip systems become
active in the neighbouring grains. Only if such a grain is oriented for single slip the
crack can advance along the {111} planes. A unique crack front is only formed if the
crack growth in all the neighbouring grains is correlated. Consequently, some cracks
will stop due to the unfavourable slip plane orientation. This leaves secondary cracks
that are often identified on the fracture surface [84].
STATE OF THE ART
17
Fig. 9. Schematic of the growth of microstructurally short cracks in a polycrystal.
2.4.1. Fatigue in Ti-6Al-4V alloy
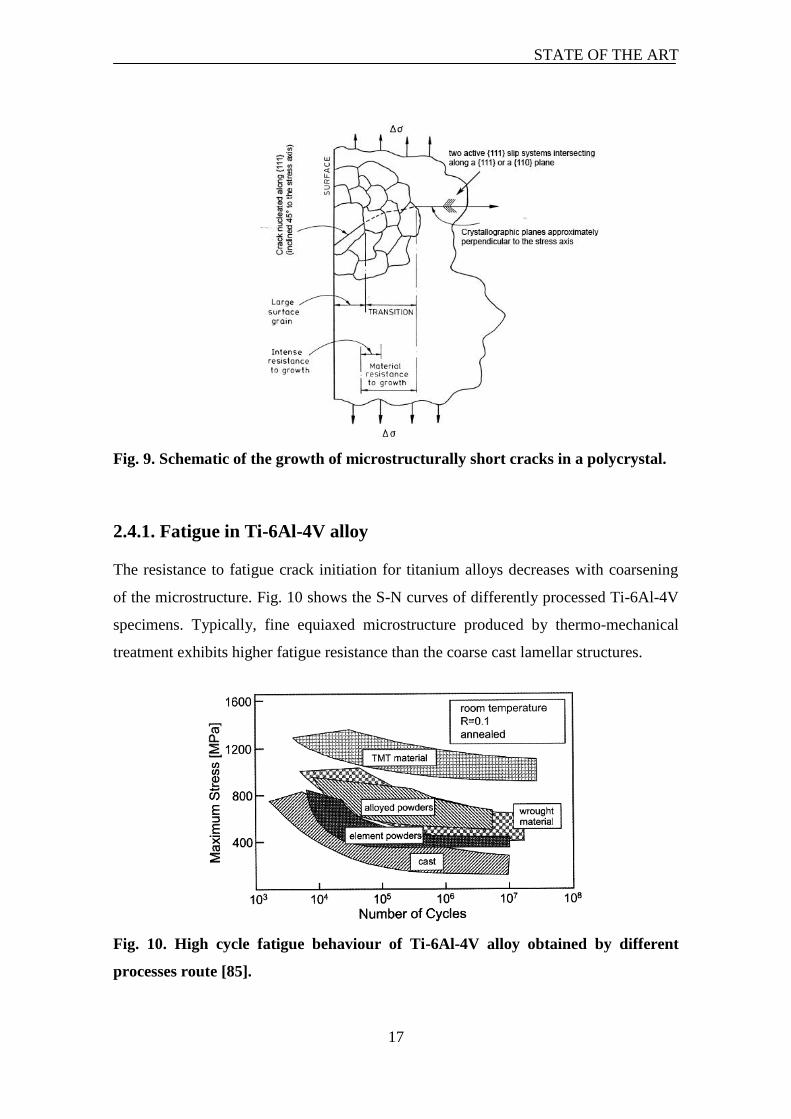
The resistance to fatigue crack initiation for titanium alloys decreases with coarsening
of the microstructure. Fig. 10 shows the S-N curves of differently processed Ti-6Al-4V
specimens. Typically, fine equiaxed microstructure produced by thermo-mechanical
treatment exhibits higher fatigue resistance than the coarse cast lamellar structures.
Fig. 10. High cycle fatigue behaviour of Ti-6Al-4V alloy obtained by different
processes route [85].
STATE OF THE ART
18
Stubbington and Bowen [86] investigated the influence of microstructure size on the
fatigue behaviour of Ti-6Al-4V alloy. They conclude that by refinement of the
microstructure from fully lamellar to an equiaxed microstructure, the fatigue strength
could be improved from 440 MPa to 670 MPa.
Generally, the high cycle fatigue strength at 107 cycles is directly related to the
resistance against fatigue crack nucleation [14]. In terms of fatigued fracture surfaces,
normally the crack initiation sites are characterized by a faceted fracture surface [87].
For example, fatigue cracks in fully lamellar microstructure nucleate at slip bands
within the lamellae or at zones along beta grain boundaries [17].
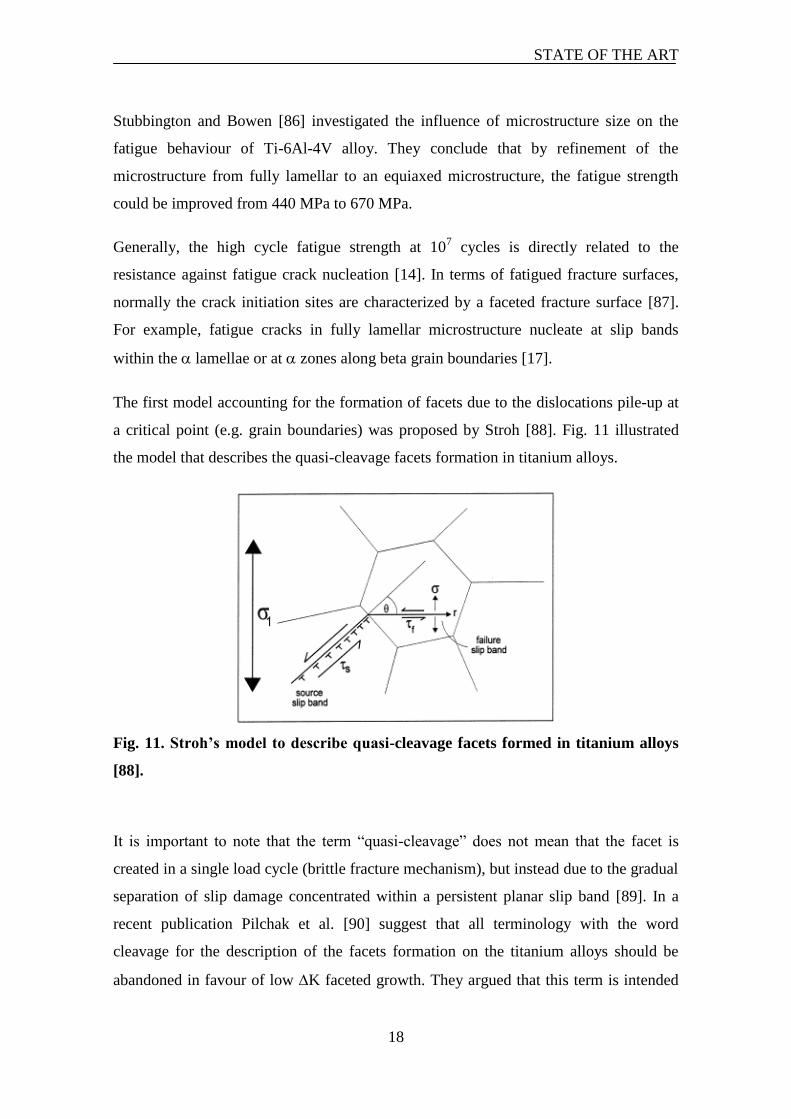
The first model accounting for the formation of facets due to the dislocations pile-up at
a critical point (e.g. grain boundaries) was proposed by Stroh [88]. Fig. 11 illustrated
the model that describes the quasi-cleavage facets formation in titanium alloys.
Fig. 11. Stroh’s model to describe quasi-cleavage facets formed in titanium alloys
[88].
It is important to note that the term “quasi-cleavage” does not mean that the facet is
created in a single load cycle (brittle fracture mechanism), but instead due to the gradual
separation of slip damage concentrated within a persistent planar slip band [89]. In a
recent publication Pilchak et al. [90] suggest that all terminology with the word
cleavage for the description of the facets formation on the titanium alloys should be
abandoned in favour of low K faceted growth. They argued that this term is intended
STATE OF THE ART
19
to be a phenomenological descriptor that does not imply anything about the number of
load cycles required to produce the facet.
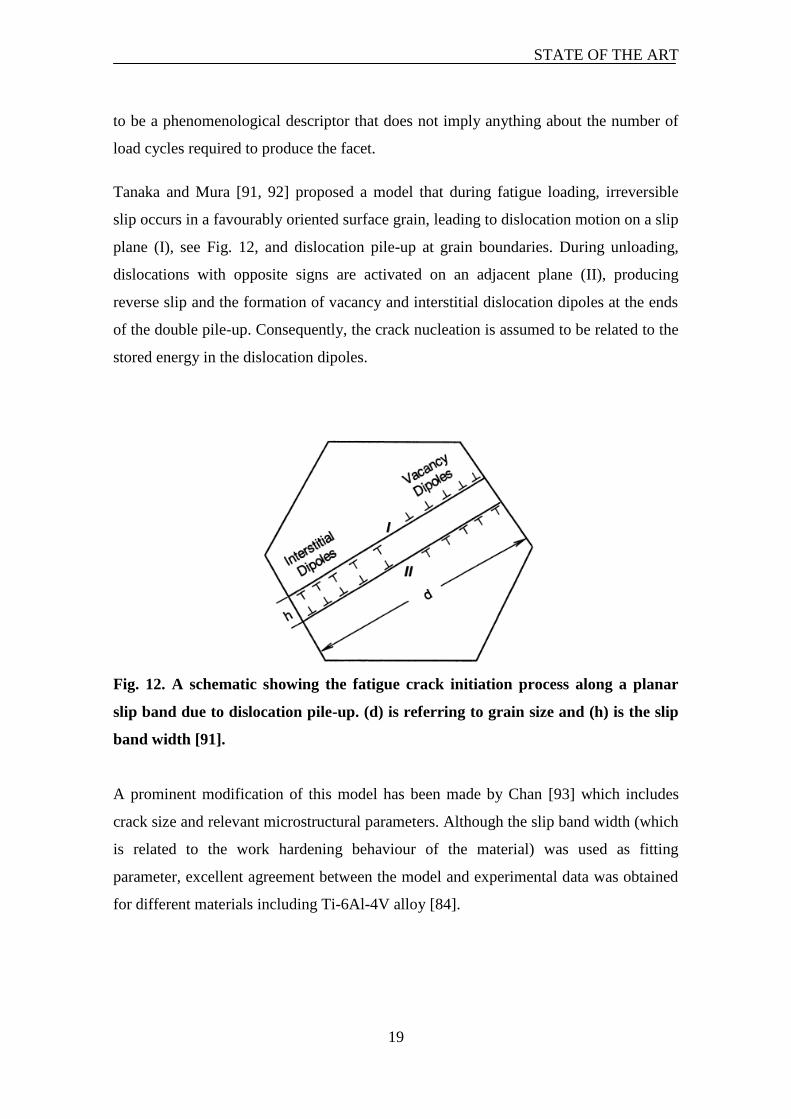
Tanaka and Mura [91, 92] proposed a model that during fatigue loading, irreversible
slip occurs in a favourably oriented surface grain, leading to dislocation motion on a slip
plane (I), see Fig. 12, and dislocation pile-up at grain boundaries. During unloading,
dislocations with opposite signs are activated on an adjacent plane (II), producing
reverse slip and the formation of vacancy and interstitial dislocation dipoles at the ends
of the double pile-up. Consequently, the crack nucleation is assumed to be related to the
stored energy in the dislocation dipoles.
Fig. 12. A schematic showing the fatigue crack initiation process along a planar
slip band due to dislocation pile-up. (d) is referring to grain size and (h) is the slip
band width [91].
A prominent modification of this model has been made by Chan [93] which includes
crack size and relevant microstructural parameters. Although the slip band width (which
is related to the work hardening behaviour of the material) was used as fitting
parameter, excellent agreement between the model and experimental data was obtained
for different materials including Ti-6Al-4V alloy [84].
EXPERIMENTAL PROCEDURES
20
3. Experimental procedures
3.1. Materials
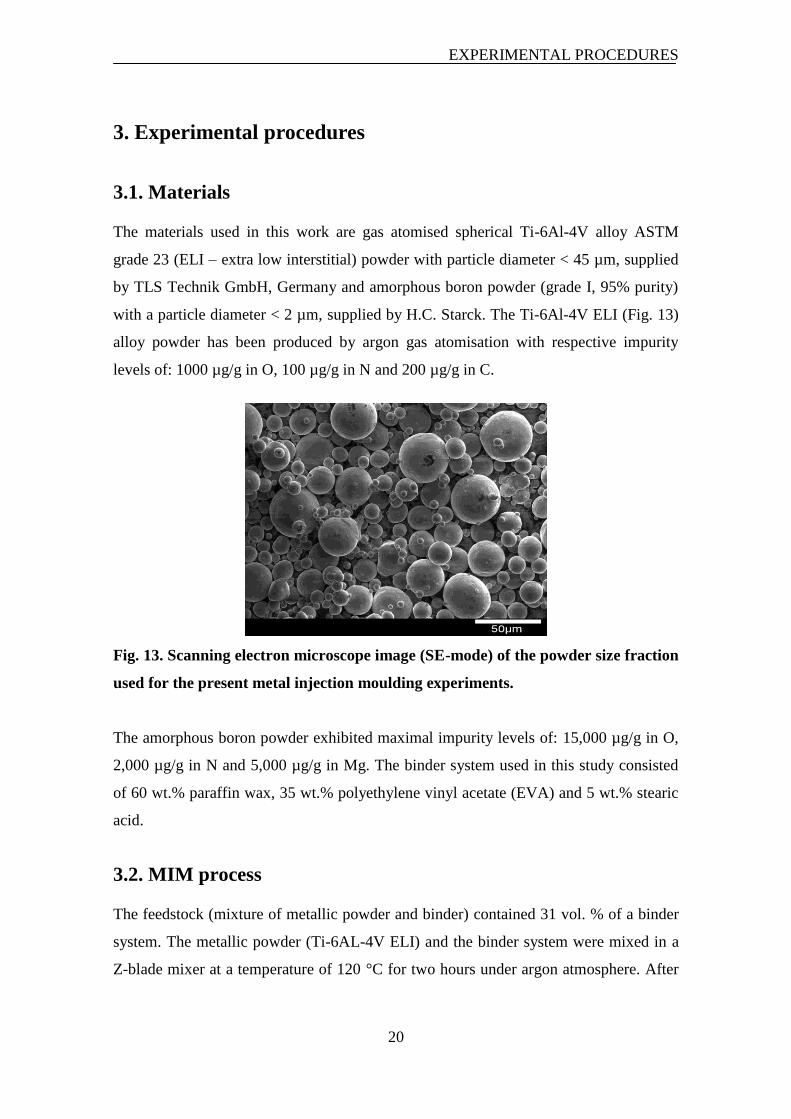
The materials used in this work are gas atomised spherical Ti-6Al-4V alloy ASTM
grade 23 (ELI – extra low interstitial) powder with particle diameter < 45 µm, supplied
by TLS Technik GmbH, Germany and amorphous boron powder (grade I, 95% purity)
with a particle diameter < 2 µm, supplied by H.C. Starck. The Ti-6Al-4V ELI (Fig. 13)
alloy powder has been produced by argon gas atomisation with respective impurity
levels of: 1000 µg/g in O, 100 µg/g in N and 200 µg/g in C.
Fig. 13. Scanning electron microscope image (SE-mode) of the powder size fraction
used for the present metal injection moulding experiments.
The amorphous boron powder exhibited maximal impurity levels of: 15,000 µg/g in O,
2,000 µg/g in N and 5,000 µg/g in Mg. The binder system used in this study consisted
of 60 wt.% paraffin wax, 35 wt.% polyethylene vinyl acetate (EVA) and 5 wt.% stearic
acid.
3.2. MIM process
The feedstock (mixture of metallic powder and binder) contained 31 vol. % of a binder
system. The metallic powder (Ti-6AL-4V ELI) and the binder system were mixed in a
Z-blade mixer at a temperature of 120 °C for two hours under argon atmosphere. After
EXPERIMENTAL PROCEDURES
21
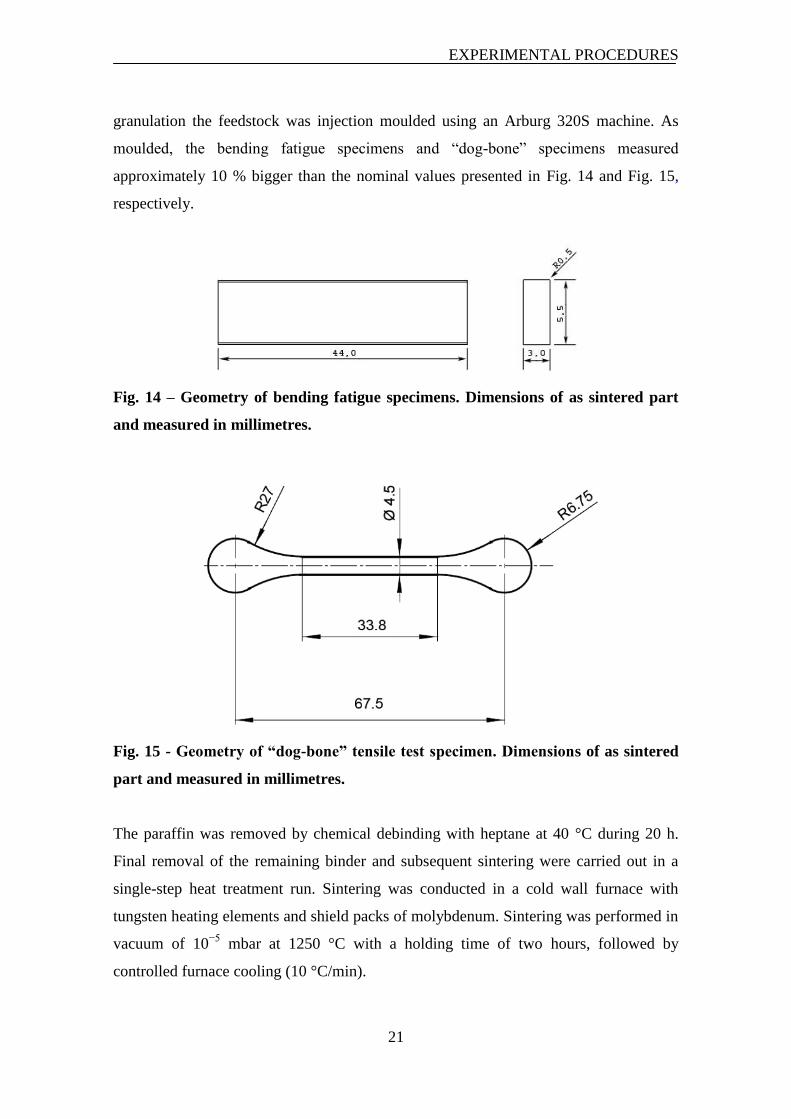
granulation the feedstock was injection moulded using an Arburg 320S machine. As
moulded, the bending fatigue specimens and “dog-bone” specimens measured
approximately 10 % bigger than the nominal values presented in Fig. 14 and Fig. 15,
respectively.
Fig. 14 – Geometry of bending fatigue specimens. Dimensions of as sintered part
and measured in millimetres.
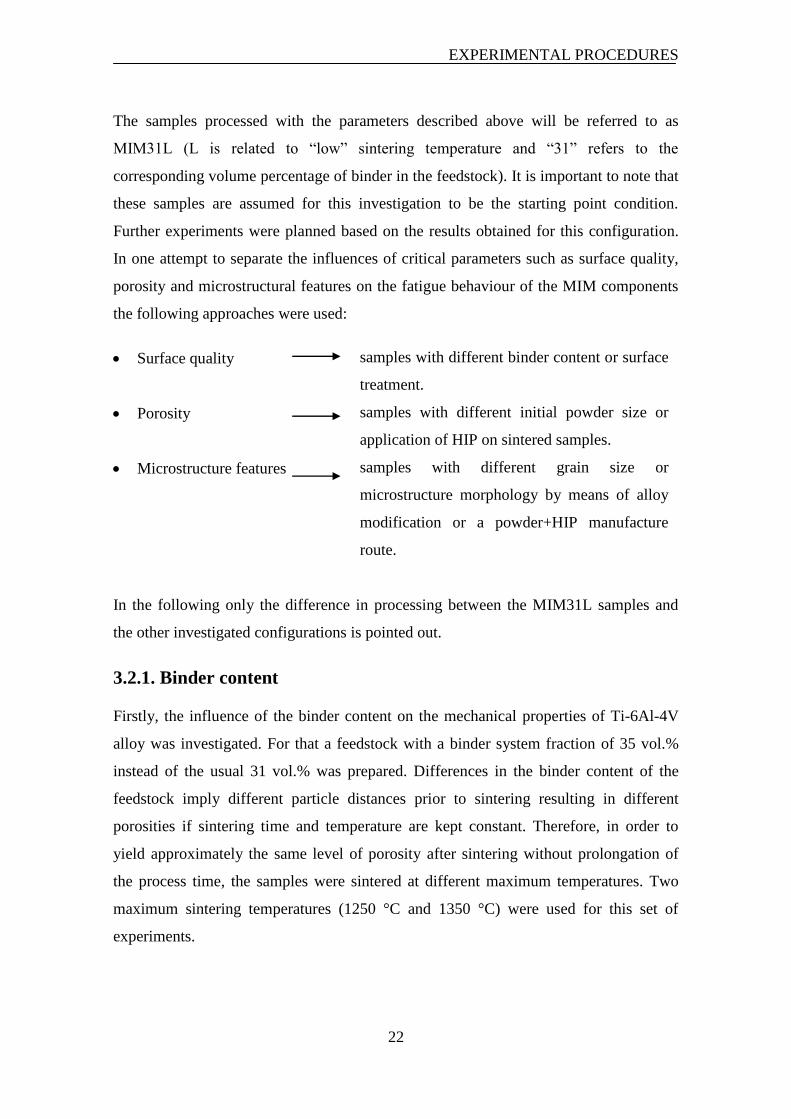
Fig. 15 - Geometry of “dog-bone” tensile test specimen. Dimensions of as sintered
part and measured in millimetres.
The paraffin was removed by chemical debinding with heptane at 40 °C during 20 h.
Final removal of the remaining binder and subsequent sintering were carried out in a
single-step heat treatment run. Sintering was conducted in a cold wall furnace with
tungsten heating elements and shield packs of molybdenum. Sintering was performed in
vacuum of 10−5
mbar at 1250 °C with a holding time of two hours, followed by
controlled furnace cooling (10 °C/min).
EXPERIMENTAL PROCEDURES
22
The samples processed with the parameters described above will be referred to as
MIM31L (L is related to “low” sintering temperature and “31” refers to the
corresponding volume percentage of binder in the feedstock). It is important to note that
these samples are assumed for this investigation to be the starting point condition.
Further experiments were planned based on the results obtained for this configuration.
In one attempt to separate the influences of critical parameters such as surface quality,
porosity and microstructural features on the fatigue behaviour of the MIM components
the following approaches were used:
Surface quality samples with different binder content or surface
treatment.
Porosity samples with different initial powder size or
application of HIP on sintered samples.
Microstructure features samples with different grain size or
microstructure morphology by means of alloy
modification or a powder+HIP manufacture
route.
In the following only the difference in processing between the MIM31L samples and
the other investigated configurations is pointed out.
3.2.1. Binder content
Firstly, the influence of the binder content on the mechanical properties of Ti-6Al-4V
alloy was investigated. For that a feedstock with a binder system fraction of 35 vol.%
instead of the usual 31 vol.% was prepared. Differences in the binder content of the
feedstock imply different particle distances prior to sintering resulting in different
porosities if sintering time and temperature are kept constant. Therefore, in order to
yield approximately the same level of porosity after sintering without prolongation of
the process time, the samples were sintered at different maximum temperatures. Two
maximum sintering temperatures (1250 °C and 1350 °C) were used for this set of
experiments.
EXPERIMENTAL PROCEDURES
23
One complete S-N curve was measured for the samples with a binder system fraction of
35 vol. % sintered at 1350 °C. Additionally, nine of those samples were sintered at
1250 °C and tested at three different stress levels. This last experiment was carried out
in order to evaluate the influence of maximum sinter temperature on the mechanical
properties.
In the following the samples fabricated with a binder system fraction of 35 vol. %
sintered at 1250 °C and 1350 °C will be referred to as MIM35L and MIM35H,
respectively, with “H” corresponding to “high” temperature and “35” is associated to
volume fraction of binder.
3.2.2. Particle size
In order to decrease the total amount of remaining porosity samples with a smaller
particle size were fabricated. A feedstock with metal powder size below 25 µm and with
binder content of 35 vol.% was used. Sintering was performed at 1250 °C for two hours
followed by controlled furnace cooling (10 °C/min).
In the following, the samples with a powder size below 25 µm and with 35 vol.% of
binder will be referred to as 25MIM35L (25 is referring to powder size, L is related to
the “low” sinter temperature and 35 is associated to the binder content).
3.2.3. Boron addition
It is well known that during casting small addition of about 0.1 wt.% of boron to the Ti-
6Al-4V alloy decreases the grain size by approximately one order of magnitude [94].
However, it is unclear if during a sintering process such an effect occurs too. Therefore,
in order to evaluate possible changes in microstructure of MIM Ti-6Al-4V alloy
samples with 0, 0.1 and 0.5 wt.% boron added were sintered at 1250 °C. Moreover,
samples with 0 and 0.5 wt.% of boron addition were also sintered at high temperatures
of 1400 °C.
Addition of amorphous boron powder was carried out during the mixture of the powders
and the binder system (feedstock preparation). The feedstock contained 35 vol.% of
binder system. The further process, apart from maximum sintering temperature, was
EXPERIMENTAL PROCEDURES
24
carried out as described for the MIM31L samples in section 3.2. The maximum
sintering temperature of 1400 °C was defined on ground of the dilatometry experiments
(see 3.5.3).
3.3. The hot isostatic pressing
The HIP process was applied to fabricate components from Ti-6Al-4V alloy powder
without pores.
3.3.1. Powder+HIP
A HIP process was applied on the Ti-6Al-4V alloy powder with particle size < 45 µm
(same powder used to fabricated the MIM components) to produce samples for micro-
tensile test and for the four-point bending fatigue experiments. The HIP process was
carried out at Jülich Forschungszentrum. The powder (1.13 kg) was packed inside a
thick-walled titanium can of 50.8 mm diameter and 211 mm length. This container was
evacuated during eight hours at room temperature and sealed after six hours at 400 °C.
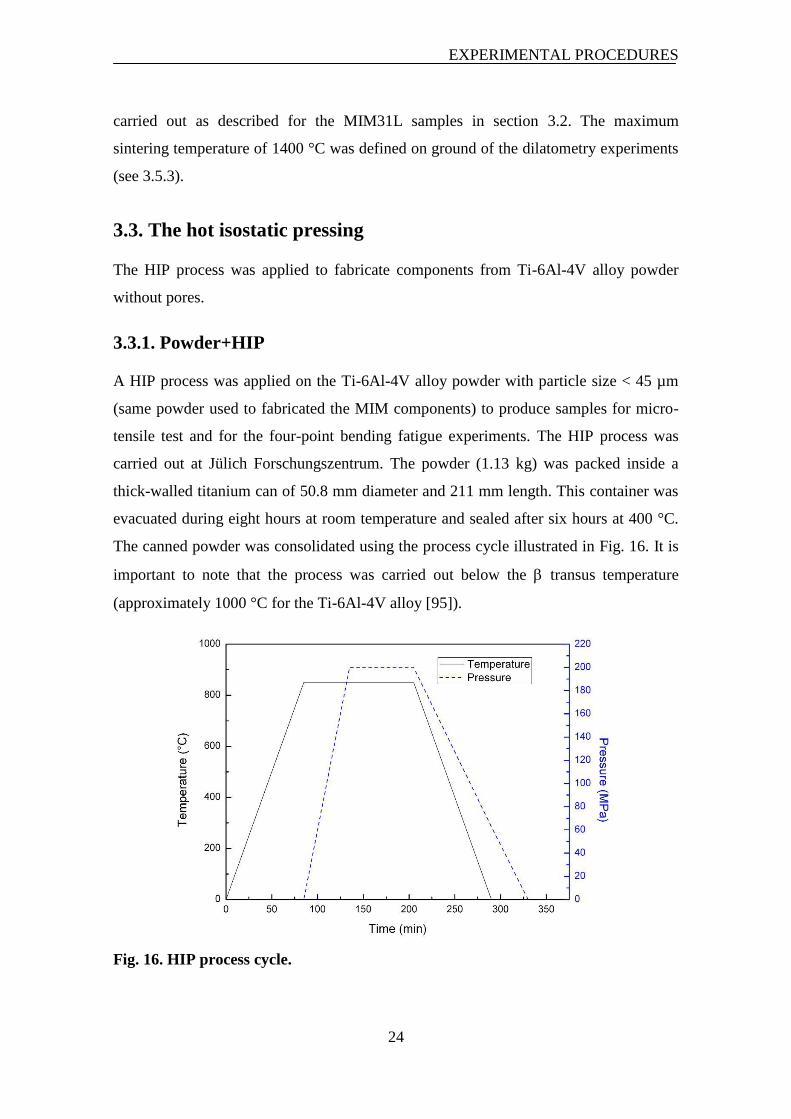
The canned powder was consolidated using the process cycle illustrated in Fig. 16. It is
important to note that the process was carried out below the transus temperature
(approximately 1000 °C for the Ti-6Al-4V alloy [95]).
Fig. 16. HIP process cycle.
EXPERIMENTAL PROCEDURES
25
After the HIP process the impurity levels and the final microstructure were investigated.
The samples for micro-tensile and fatigue tests were spark eroded to the final geometry
shown in Fig. 14 (fatigue samples) and Fig. 19 (micro-tensile samples). These samples
will be referred to as Powder+HIP.
3.3.2. MIM+HIP
In order to obtain specimens fabricated by MIM process with no remaining pores a HIP
process was applied on some of the MIM35H samples after sintering. The HIP process
was carried out in a shared titanium cycle running at Bodycote HIP N.V., Belgium, with
a maximum temperature of 915 °C for two hours at 100 MPa. Microstructural features
and impurity levels were evaluated after the HIP process. Tensile and fatigue tests were
carried out.
In the following the samples fabricated by MIM and exposed to a HIP process will be
referred to as MIM35H+HIP.
3.4. Surface modification and characterisation
Fatigue properties of titanium alloys are largely determined by surface defects [96],
microstructures [86], and crystallographic textures [97]. In order to evaluate the
influence of surface quality on the fatigue behaviour some of the samples were exposed
to shot peening. The shot peening was conducted on an air-blast machine using
zirconium oxide particles with a diameter of 500 µm. The air pressure was 4 bar with an
exposure time of 10 seconds for each surface sample. The nozzle diameter was 6 mm
and the work distance applied was 50 mm.
Light microscopy was used to investigate the influence of shot peening on the surface
quality of MIM samples. The surface roughness was estimated by using a Hommel
tester T1000.
Four MIM35H samples with shot peening were subjected to a further heat treatment.
The samples were heated up to 915 °C for 30 min in vacuum of approximately 10-5
mbar. The furnace used was the same applied for the sintering process. After the heat
treatment the samples were exposed to fatigue loading under four-point bending
EXPERIMENTAL PROCEDURES
26
configuration. This experiment was carried out in order to relieve possible compressive
stresses in the surface. Furthermore, if the samples after the shot peening application
content a higher degree of local plastic deformation it might be possible to do a
recrystallization of the microstructure (finer microstructure at the deformed regions).
The microstructure at the surface and the fatigue fracture surfaces were investigated by
using light microscopy and SEM.
3.5. Characterization of the samples
3.5.1. Impurity levels, microstructural features and relative density
The impurity levels such as oxygen, nitrogen and carbon of the specimens were
determined using a conventional LECO melt extraction system. The TC – 436AR
equipment was used to analyse the nitrogen and oxygen levels. The CS – 444 was
applied in order to determine the carbon content. In an attempt to evaluate the influence
of these elements on the mechanical properties of samples processed with different
parameters, the concept of oxygen equivalent O(eq.) introduced in section 2.1. was
applied. It is important to note that at least three samples were examined for each
different sintering furnace run (batch). Consequently, the impurity level values
presented for this investigation are average from these samples.
The microstructure of the samples was examined by optical microscopy after polishing
and etching in Kroll’s reagent (containing 3% HF and 10% HNO3). The average grain
size was measured using an image analysis system (Olympus Soft Image Solution,
analysis pro). A linear intercept technique (ASTM E112-96) was applied in order to
determine the grain size. For this investigation, the grain size was assumed to be the
microstructural feature that defines the slip length. Therefore, the colony size (Fig. 17,
length a)) and the phase (Fig. 18, length a)) or colony (Fig. 18, length b)) sizes are
the features that define a grain for lamellar and quasi equiaxed microstructures,
respectively.
EXPERIMENTAL PROCEDURES
27
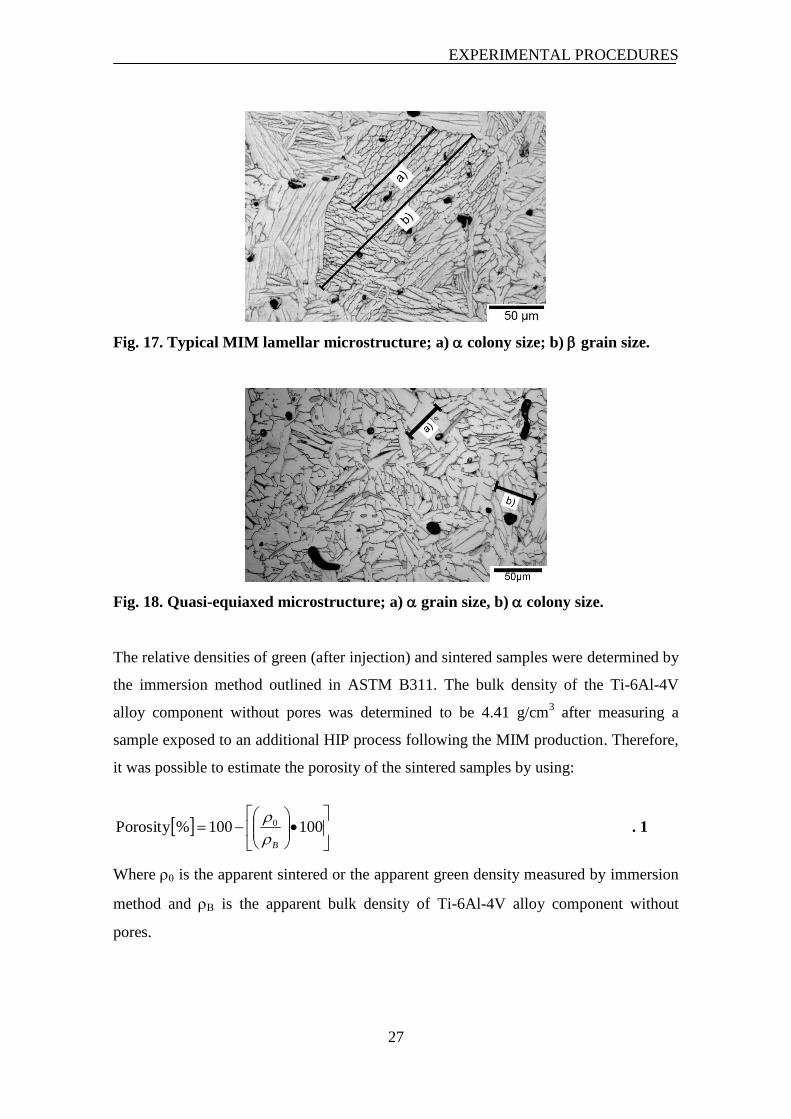
Fig. 17. Typical MIM lamellar microstructure; a) colony size; b) grain size.
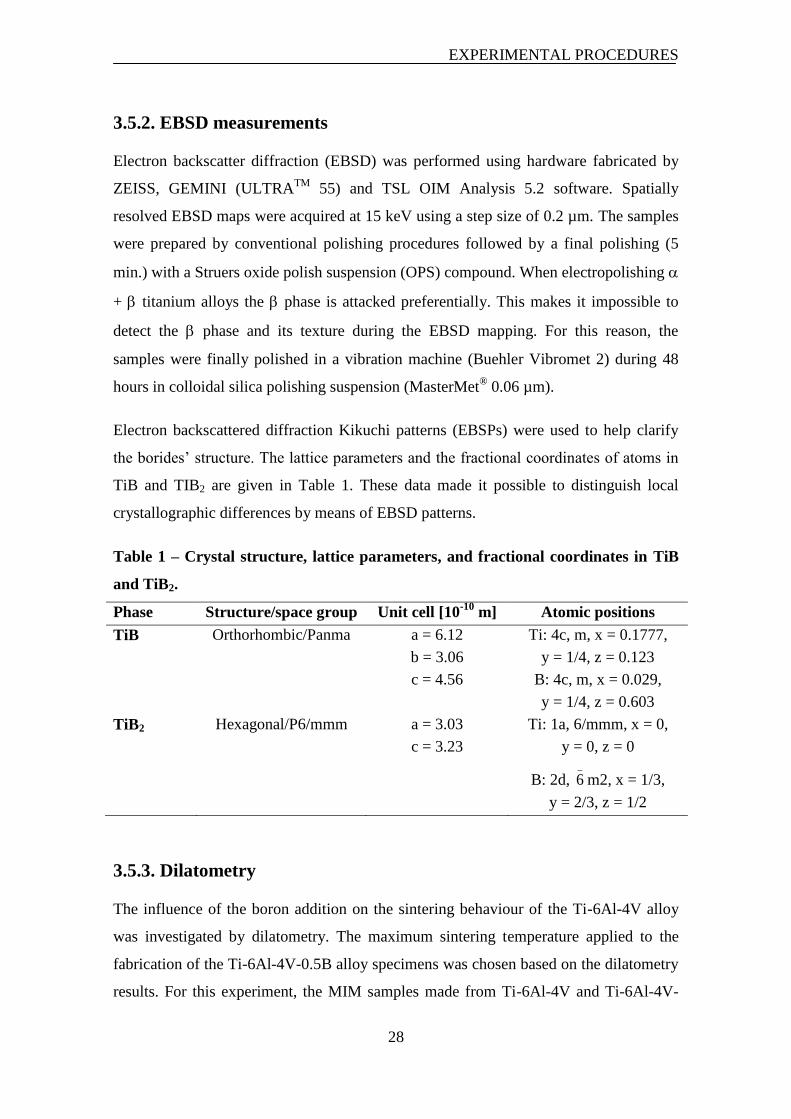
Fig. 18. Quasi-equiaxed microstructure; a) grain size, b) colony size.
The relative densities of green (after injection) and sintered samples were determined by
the immersion method outlined in ASTM B311. The bulk density of the Ti-6Al-4V
alloy component without pores was determined to be 4.41 g/cm3 after measuring a
sample exposed to an additional HIP process following the MIM production. Therefore,
it was possible to estimate the porosity of the sintered samples by using:
100100%Porosity 0
B
. 1
Where is the apparent sintered or the apparent green density measured by immersion
method and is the apparent bulk density of Ti-6Al-4V alloy component without
pores.
EXPERIMENTAL PROCEDURES
28
3.5.2. EBSD measurements
Electron backscatter diffraction (EBSD) was performed using hardware fabricated by
ZEISS, GEMINI (ULTRATM
55) and TSL OIM Analysis 5.2 software. Spatially
resolved EBSD maps were acquired at 15 keV using a step size of 0.2 µm. The samples
were prepared by conventional polishing procedures followed by a final polishing (5
min.) with a Struers oxide polish suspension (OPS) compound. When electropolishing
+ titanium alloys the phase is attacked preferentially. This makes it impossible to
detect the phase and its texture during the EBSD mapping. For this reason, the
samples were finally polished in a vibration machine (Buehler Vibromet 2) during 48
hours in colloidal silica polishing suspension (MasterMet® 0.06 µm).
Electron backscattered diffraction Kikuchi patterns (EBSPs) were used to help clarify
the borides’ structure. The lattice parameters and the fractional coordinates of atoms in
TiB and TIB2 are given in Table 1. These data made it possible to distinguish local
crystallographic differences by means of EBSD patterns.
Table 1 – Crystal structure, lattice parameters, and fractional coordinates in TiB
and TiB2.
Phase Structure/space group Unit cell [10-10
m] Atomic positions
TiB Orthorhombic/Panma a = 6.12
b = 3.06
c = 4.56
Ti: 4c, m, x = 0.1777,
y = 1/4, z = 0.123
B: 4c, m, x = 0.029,
y = 1/4, z = 0.603
TiB2 Hexagonal/P6/mmm a = 3.03
c = 3.23
Ti: 1a, 6/mmm, x = 0,
y = 0, z = 0
B: 2d, _
6 m2, x = 1/3,
y = 2/3, z = 1/2
3.5.3. Dilatometry
The influence of the boron addition on the sintering behaviour of the Ti-6Al-4V alloy
was investigated by dilatometry. The maximum sintering temperature applied to the
fabrication of the Ti-6Al-4V-0.5B alloy specimens was chosen based on the dilatometry
results. For this experiment, the MIM samples made from Ti-6Al-4V and Ti-6Al-4V-
EXPERIMENTAL PROCEDURES
29
0.5B were chemically and thermally debinded followed by pre-sintering at 700 °C for 1
hour. The diameter of the samples was approximately 5 mm with a length of 10 mm.
The dilatometer used was a vertical configuration dilatometer fabricated by LINSEIS
(L70/2171). A heating rate of 10 °C/min and an isotherm of 1400 °C for two hours were
used. Argon atmosphere was applied during the heating and cooling processes of the
dilatometry experiments.
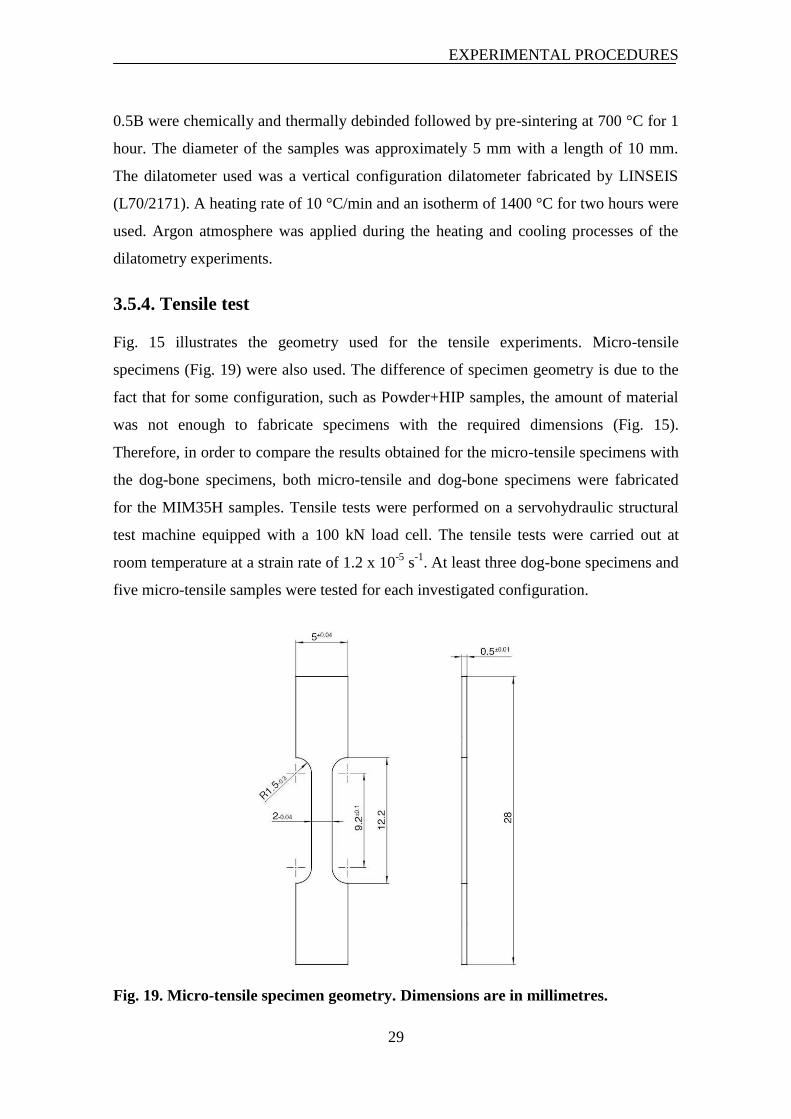
3.5.4. Tensile test
Fig. 15 illustrates the geometry used for the tensile experiments. Micro-tensile
specimens (Fig. 19) were also used. The difference of specimen geometry is due to the
fact that for some configuration, such as Powder+HIP samples, the amount of material
was not enough to fabricate specimens with the required dimensions (Fig. 15).
Therefore, in order to compare the results obtained for the micro-tensile specimens with
the dog-bone specimens, both micro-tensile and dog-bone specimens were fabricated
for the MIM35H samples. Tensile tests were performed on a servohydraulic structural
test machine equipped with a 100 kN load cell. The tensile tests were carried out at
room temperature at a strain rate of 1.2 x 10⁻⁵
s-1
. At least three dog-bone specimens and
five micro-tensile samples were tested for each investigated configuration.
Fig. 19. Micro-tensile specimen geometry. Dimensions are in millimetres.
EXPERIMENTAL PROCEDURES
30
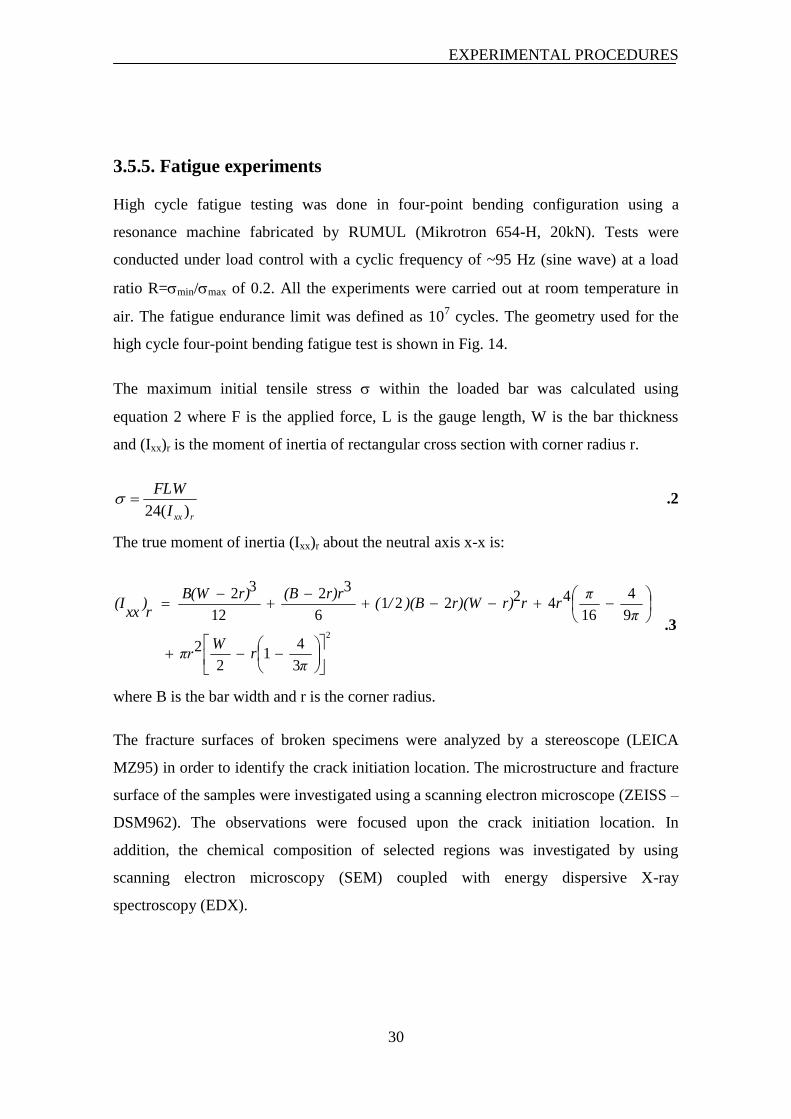
3.5.5. Fatigue experiments
High cycle fatigue testing was done in four-point bending configuration using a
resonance machine fabricated by RUMUL (Mikrotron 654-H, 20kN). Tests were
conducted under load control with a cyclic frequency of ~95 Hz (sine wave) at a load
ratio R=min/max of 0.2. All the experiments were carried out at room temperature in
air. The fatigue endurance limit was defined as 107 cycles. The geometry used for the
high cycle four-point bending fatigue test is shown in Fig. 14.
The maximum initial tensile stress within the loaded bar was calculated using
equation 2 where F is the applied force, L is the gauge length, W is the bar thickness
and (Ixx)r is the moment of inertia of rectangular cross section with corner radius r.
rxxI
FLW
)(24 .2
The true moment of inertia (Ixx)r about the neutral axis x-x is:
2
3
41
2
2
9
4
16
4422216
32
12
32
πr
Wπr
π
πrrr)r)(W)(B/(
r)r(Br)B(W
r)
xx(I
.3
where B is the bar width and r is the corner radius.
The fracture surfaces of broken specimens were analyzed by a stereoscope (LEICA
MZ95) in order to identify the crack initiation location. The microstructure and fracture
surface of the samples were investigated using a scanning electron microscope (ZEISS –
DSM962). The observations were focused upon the crack initiation location. In
addition, the chemical composition of selected regions was investigated by using
scanning electron microscopy (SEM) coupled with energy dispersive X-ray
spectroscopy (EDX).

EXPERIMENTAL PROCEDURES
31
In an effort to better understand the influence of the microstructural features on the
fatigue crack nucleation and propagation, crack front profiles at the possible crack
nucleation site were investigated for samples with and without boron addition.
VERIFICATION OF THE FATIGUE EXPERIMENTS
32
4. Verification of the four-point bending fatigue tests
Usually, the high cycle fatigue tests are performed in a constant amplitude axial fatigue
test machine following the ASTM standard (E466). According to this standard to ensure
test section failure, the grip cross-sectional area should be at least four times the test
section area. However, the manufacture of such component by MIM technique is
complicated due to problems related to sample integrity after injection and sinter
processes. Therefore, in this work as a first step on the investigation of fatigue
behaviour of Ti-6Al-4V components fabricated by MIM technique, the high cycle
fatigue tests were performed in a four-point bending configuration. Bending fatigue test
requires a simple geometry, which can be easily processed by MIM technology.
4.1. Experimental procedure
A hot rolled and annealed commercial Ti-6Al-4V ELI (ASTM grade 23) alloy cylinder
with a diameter of 55 mm and a length of 250 mm supplied by Enpar, Germany was
used to fabricate the specimens for the verification of the fatigue experiments. The
samples were machined in the rolled direction to the final geometry shown in Fig. 14
via electric discharge machining. In order to minimize the influence of surface
difference on the fatigue behaviour, the samples were exposed to shot peening. The shot
peening was conducted on an air-blast machine and the same parameters used for the
MIM samples were also applied here. In the following, these samples will be referred to
as reference material.
The fatigue tests were performed with the same parameters applied for MIM samples, as
described in 3.5.5.
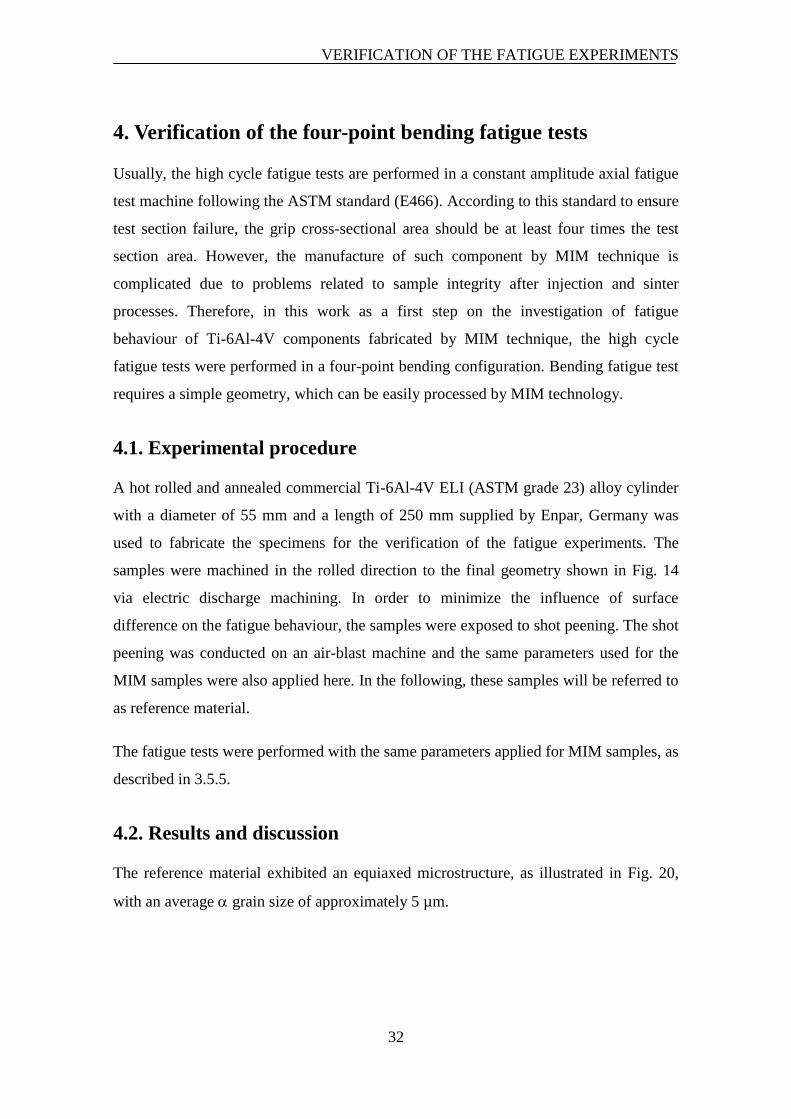
4.2. Results and discussion
The reference material exhibited an equiaxed microstructure, as illustrated in Fig. 20,
with an average grain size of approximately 5 µm.
VERIFICATION OF THE FATIGUE EXPERIMENTS
33
Fig. 20. BSE image of the reference material microstructure (equiaxed
microstructure).
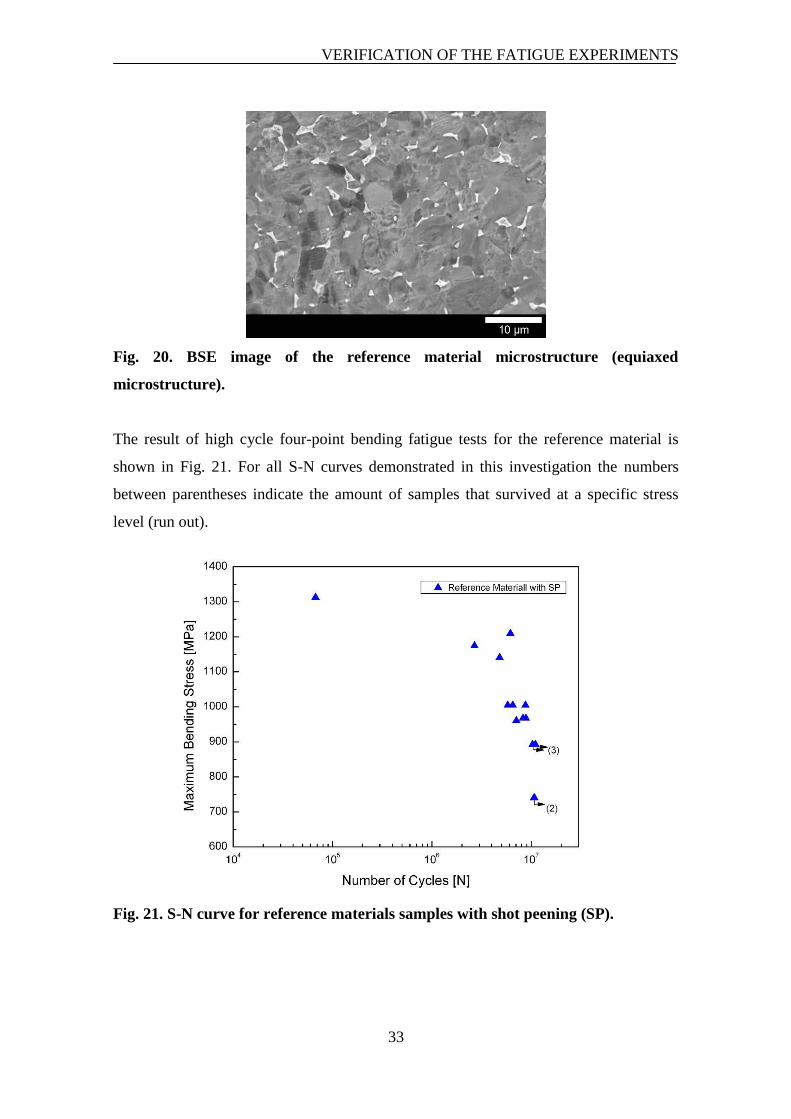
The result of high cycle four-point bending fatigue tests for the reference material is
shown in Fig. 21. For all S-N curves demonstrated in this investigation the numbers
between parentheses indicate the amount of samples that survived at a specific stress
level (run out).
Fig. 21. S-N curve for reference materials samples with shot peening (SP).
VERIFICATION OF THE FATIGUE EXPERIMENTS
34
The reference samples with shot peening demonstrated a fatigue endurance limit of
approximately 890 MPa. Unfortunately, it is not possible to compare directly this result
with literature values due to the lack of data related to high cycle four-point bending
fatigue test of Ti-6Al-4V alloy. Akahori et al. [10] carried out high cycle axial fatigue
test with R=0.1 and found a value of 800 MPa for fatigue endurance limit of Ti-6Al-4V
alloy with equiaxed microstructure. This lower literature value of fatigue endurance
limit compared to our reference material is expected. Morrisey et al. [98] described the
influence of stress ratio R on mean and amplitude stresses for Ti-6Al-4V alloy at fatigue
life of 107 cycles. Increasing of R leads to a decrease of stress amplitude and an increase
of mean stress. Therefore, it is expected that tests with higher R values cause greater
values for maximum stress. Moreover, it should be pointed out that the shot peening
promoted an increase in the fatigue strength which could be an additional reason for the
higher fatigue endurance limit observed for our reference material compared to
literature values. Thus, it is possible to assume that the results demonstrated in this work
are in an acceptable range with literature data.
RESULTS
35
5. Results
5.1. The MIM31L samples
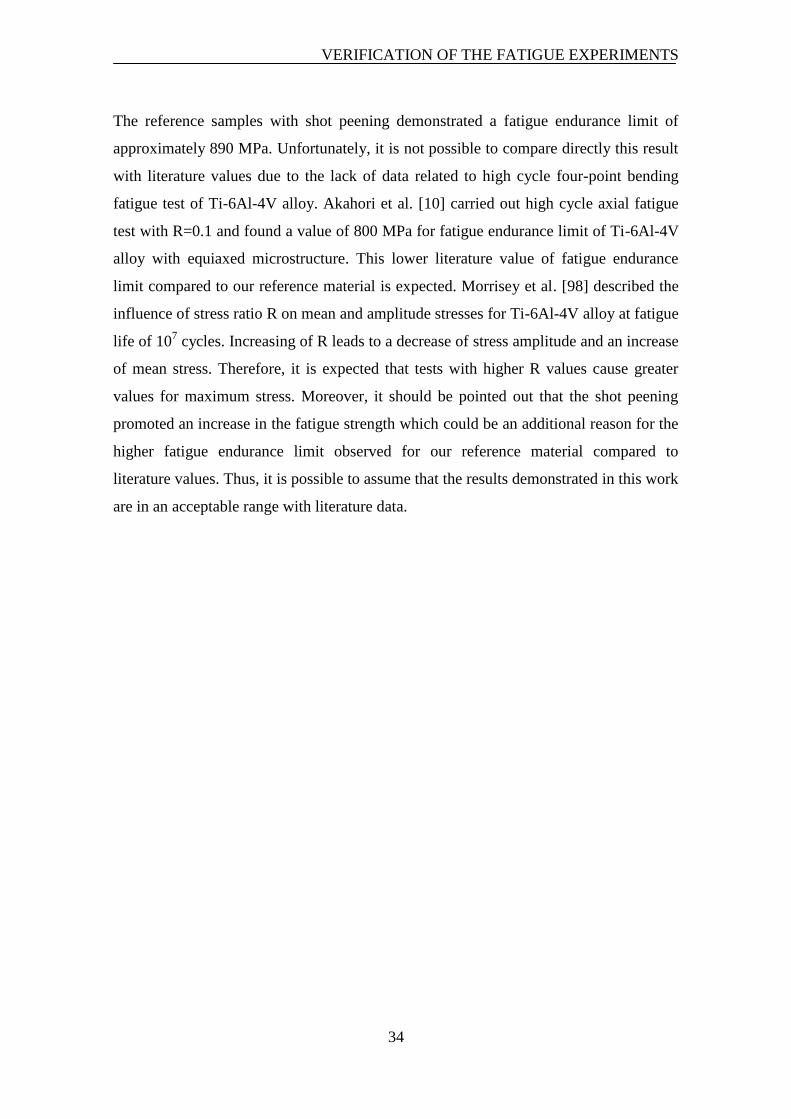
The MIM31L sintered samples presented a fully lamellar microstructure, as illustrated
in Fig. 22. The colony size, alternating and with distinct orientation relationship,
was approximately 100 µm. The apparent densification was 96.6 % (3.4 vol.% of
remaining porosity).
Fig. 22. Microstructure of MIM Ti-6Al-4V with 31 vol.% of binder and sintered at
1250 °C for two hours (MIM31L).
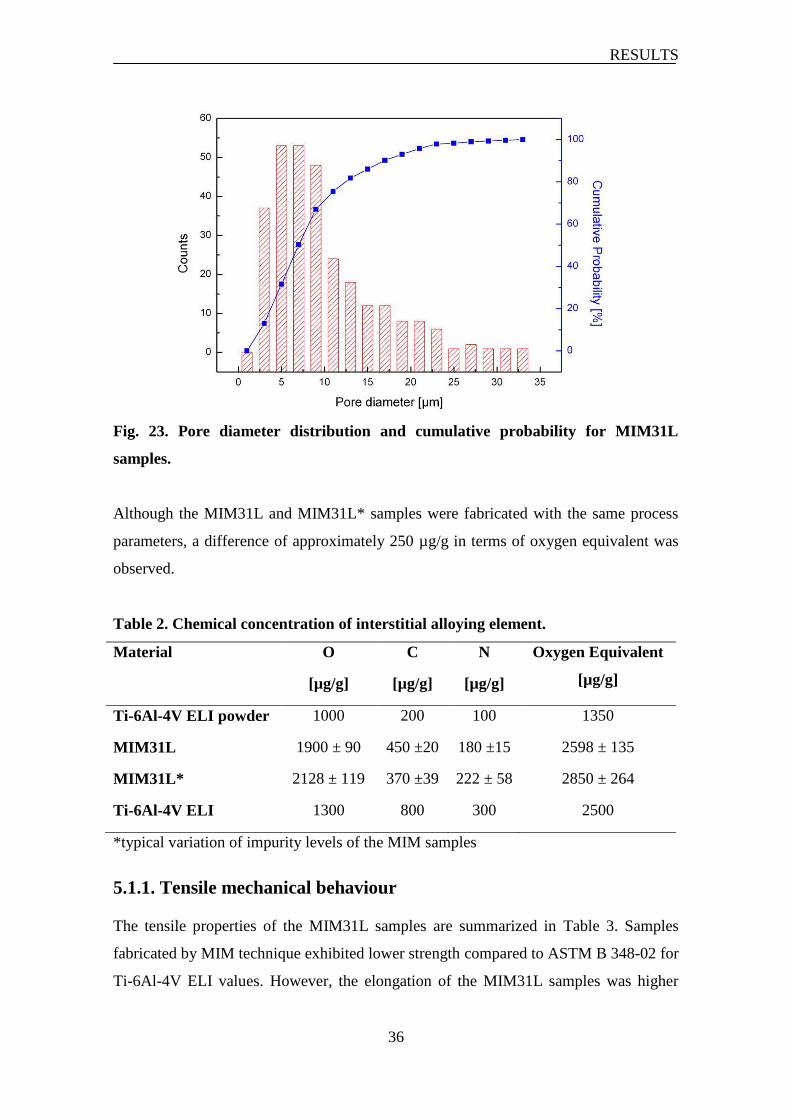
The porosity was near-circle shape with diameter size of approximately 9 µm. The pore
size distribution and the cumulative probability are illustrated in Fig. 23. The maximum
pore diameter measured was 33 µm (almost 300 pores were evaluated for this
configuration).
The oxygen, carbon, nitrogen and the oxygen equivalent contents of the applied powder,
sintered MIM31L samples and the Ti-6Al-4V ELI alloy (ASTM grade 23) are given in
Table 2. An expected increase of impurity levels due to the MIM process was observed.
RESULTS
36
Fig. 23. Pore diameter distribution and cumulative probability for MIM31L
samples.
Although the MIM31L and MIM31L* samples were fabricated with the same process
parameters, a difference of approximately 250 µg/g in terms of oxygen equivalent was
observed.
Table 2. Chemical concentration of interstitial alloying element.
Material O
[µg/g]
C
[µg/g]
N
[µg/g]
Oxygen Equivalent
[µg/g]
Ti-6Al-4V ELI powder 1000 200 100 1350
MIM31L 1900 ± 90 450 ±20 180 ±15 2598 ± 135
MIM31L* 2128 ± 119 370 ±39 222 ± 58 2850 ± 264
Ti-6Al-4V ELI 1300 800 300 2500
*typical variation of impurity levels of the MIM samples
5.1.1. Tensile mechanical behaviour
The tensile properties of the MIM31L samples are summarized in Table 3. Samples
fabricated by MIM technique exhibited lower strength compared to ASTM B 348-02 for
Ti-6Al-4V ELI values. However, the elongation of the MIM31L samples was higher
RESULTS
37
than the minimal values accepted for this alloy. It is important to note that the interstitial
elements concentration for the MIM31L samples (Table 2) was higher than the accepted
concentrations of Ti-6Al-4V ELI as described in ASTM B348-02.
Table 3. Tensile properties of the Ti-6Al-4V ELI (ASTM Grade 23) and the
MIM31L samples.
Material y [MPa] UTS [MPa] Elongation [%]
Ti-6Al-4V ELI Min. 759 Min. 828 Min. 10
MIM31L 700 ± 5 800 ± 1 15.1 ± 1
MIM31L* 703 ± 3 806 ± 3 13.7 ± 1
The difference of approximately 250 µg/g in oxygen equivalent between MIM31L and
MIM31L* samples was not enough to significantly affect the mechanical properties.
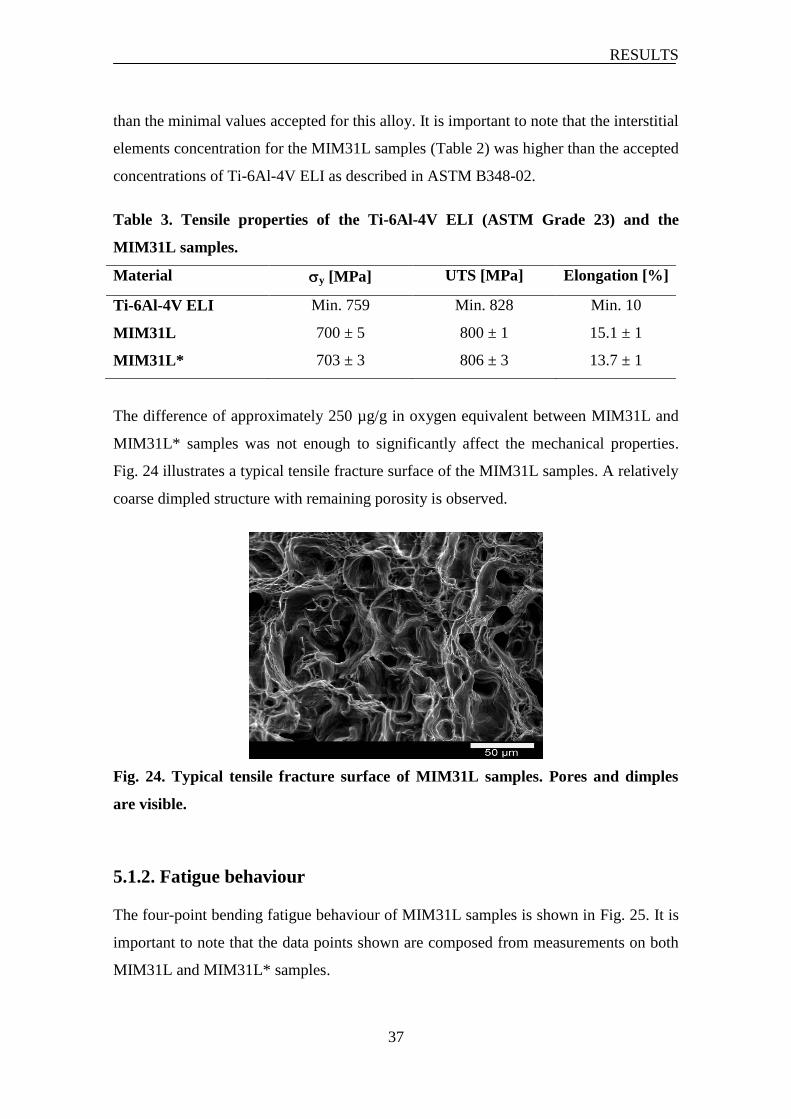
Fig. 24 illustrates a typical tensile fracture surface of the MIM31L samples. A relatively
coarse dimpled structure with remaining porosity is observed.
Fig. 24. Typical tensile fracture surface of MIM31L samples. Pores and dimples
are visible.
5.1.2. Fatigue behaviour
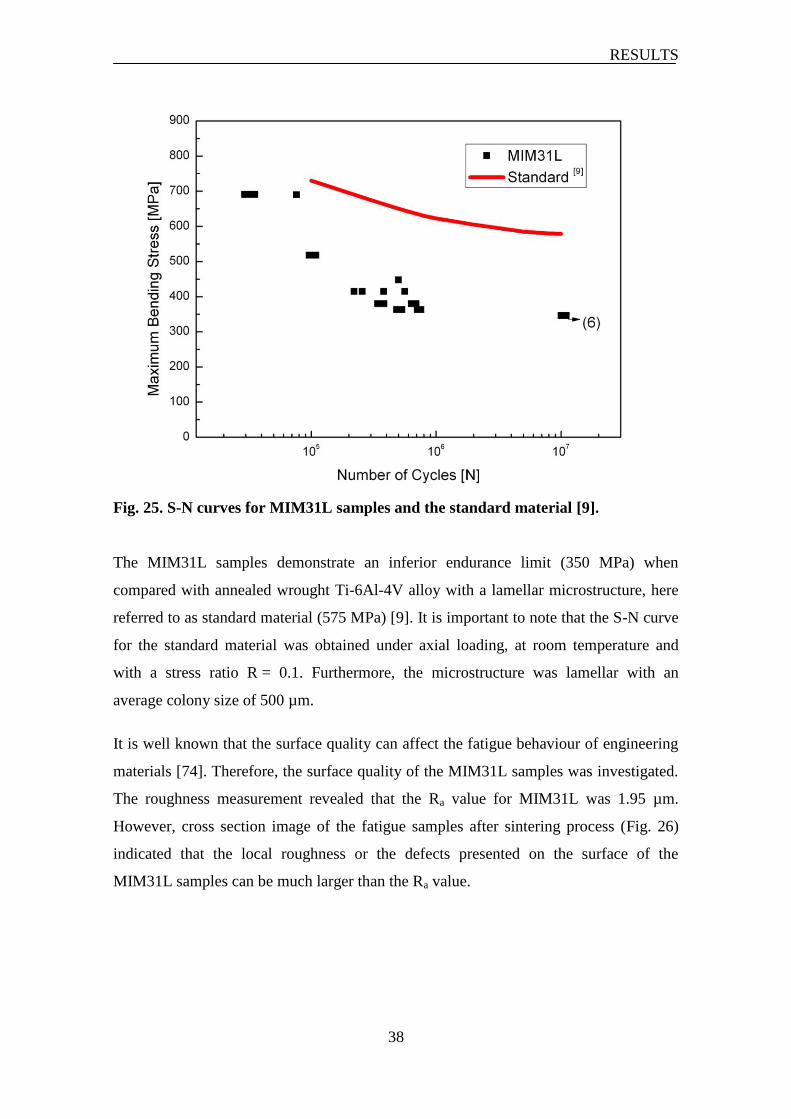
The four-point bending fatigue behaviour of MIM31L samples is shown in Fig. 25. It is
important to note that the data points shown are composed from measurements on both
MIM31L and MIM31L* samples.
RESULTS
38
Fig. 25. S-N curves for MIM31L samples and the standard material [9].
The MIM31L samples demonstrate an inferior endurance limit (350 MPa) when
compared with annealed wrought Ti-6Al-4V alloy with a lamellar microstructure, here
referred to as standard material (575 MPa) [9]. It is important to note that the S-N curve
for the standard material was obtained under axial loading, at room temperature and
with a stress ratio R = 0.1. Furthermore, the microstructure was lamellar with an
average colony size of 500 µm.
It is well known that the surface quality can affect the fatigue behaviour of engineering
materials [74]. Therefore, the surface quality of the MIM31L samples was investigated.
The roughness measurement revealed that the Ra value for MIM31L was 1.95 µm.
However, cross section image of the fatigue samples after sintering process (Fig. 26)
indicated that the local roughness or the defects presented on the surface of the
MIM31L samples can be much larger than the Ra value.

RESULTS
39
Fig. 26. Surface quality of MIM31L samples.
The fracture surfaces of broken fatigue specimens were investigated. Fig. 27 illustrated
a typical fracture surface, indicating that the fatigue crack nucleation started at the
surface.
Fig. 27. Typical fracture surface of MIM31L samples. The black line indicates the
position where the crack front profile (Fig. 29) was evaluated.
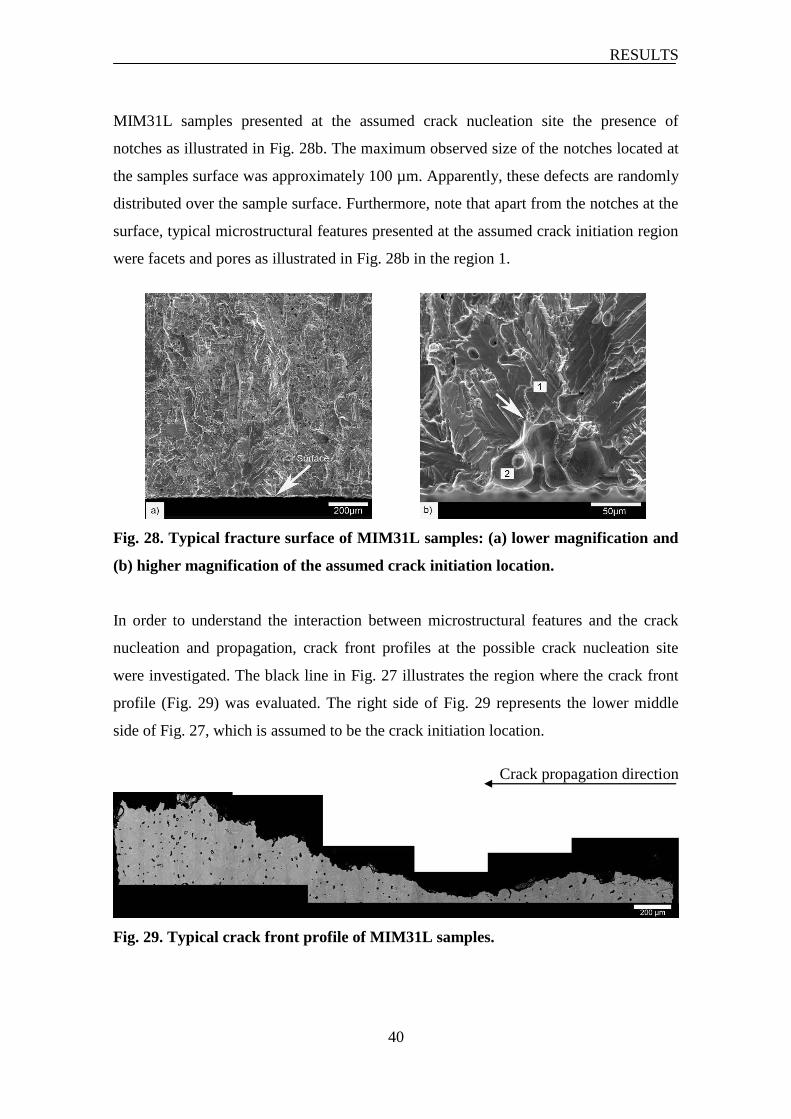
The white arrow in Fig. 28a indicated the surface exposed to tensile stress during four-
point bending fatigue test. The white arrow in Fig. 28b appoints for the assumed crack
initiation location. Two distinct regions are visible: one region shows a normal fracture
surface, where it is possible to identify lamellae boundaries (area 1). The other region
illustrates the original powder surface (area 2), which demonstrates that in this region
the particles were not connected.
This disconnection of the particles resembles a notch located at surface sample, as
illustrated by Fig. 26. It is important to note that all investigated fracture surfaces of the
RESULTS
40
MIM31L samples presented at the assumed crack nucleation site the presence of
notches as illustrated in Fig. 28b. The maximum observed size of the notches located at
the samples surface was approximately 100 µm. Apparently, these defects are randomly
distributed over the sample surface. Furthermore, note that apart from the notches at the
surface, typical microstructural features presented at the assumed crack initiation region
were facets and pores as illustrated in Fig. 28b in the region 1.
Fig. 28. Typical fracture surface of MIM31L samples: (a) lower magnification and
(b) higher magnification of the assumed crack initiation location.
In order to understand the interaction between microstructural features and the crack
nucleation and propagation, crack front profiles at the possible crack nucleation site
were investigated. The black line in Fig. 27 illustrates the region where the crack front
profile (Fig. 29) was evaluated. The right side of Fig. 29 represents the lower middle
side of Fig. 27, which is assumed to be the crack initiation location.
Crack propagation direction
Fig. 29. Typical crack front profile of MIM31L samples.
RESULTS
41
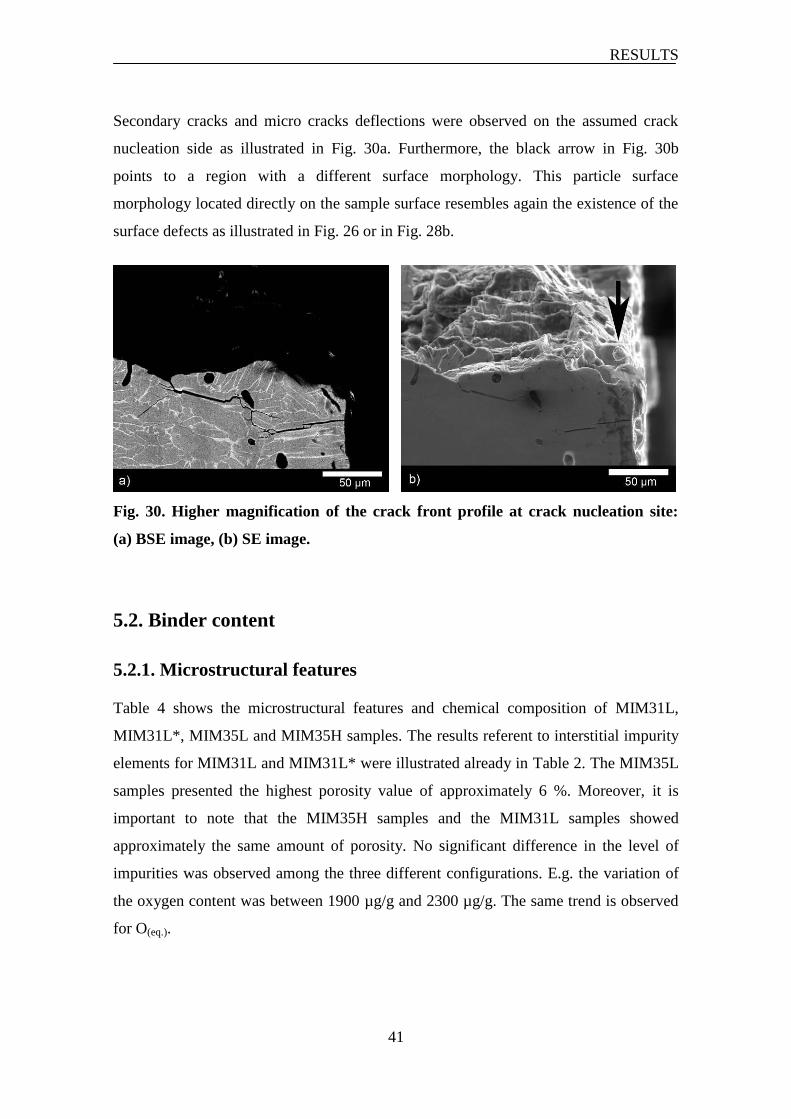
Secondary cracks and micro cracks deflections were observed on the assumed crack
nucleation side as illustrated in Fig. 30a. Furthermore, the black arrow in Fig. 30b
points to a region with a different surface morphology. This particle surface
morphology located directly on the sample surface resembles again the existence of the
surface defects as illustrated in Fig. 26 or in Fig. 28b.
Fig. 30. Higher magnification of the crack front profile at crack nucleation site:
(a) BSE image, (b) SE image.
5.2. Binder content
5.2.1. Microstructural features
Table 4 shows the microstructural features and chemical composition of MIM31L,
MIM31L*, MIM35L and MIM35H samples. The results referent to interstitial impurity
elements for MIM31L and MIM31L* were illustrated already in Table 2. The MIM35L
samples presented the highest porosity value of approximately 6 %. Moreover, it is
important to note that the MIM35H samples and the MIM31L samples showed
approximately the same amount of porosity. No significant difference in the level of
impurities was observed among the three different configurations. E.g. the variation of
the oxygen content was between 1900 µg/g and 2300 µg/g. The same trend is observed
for O(eq.).
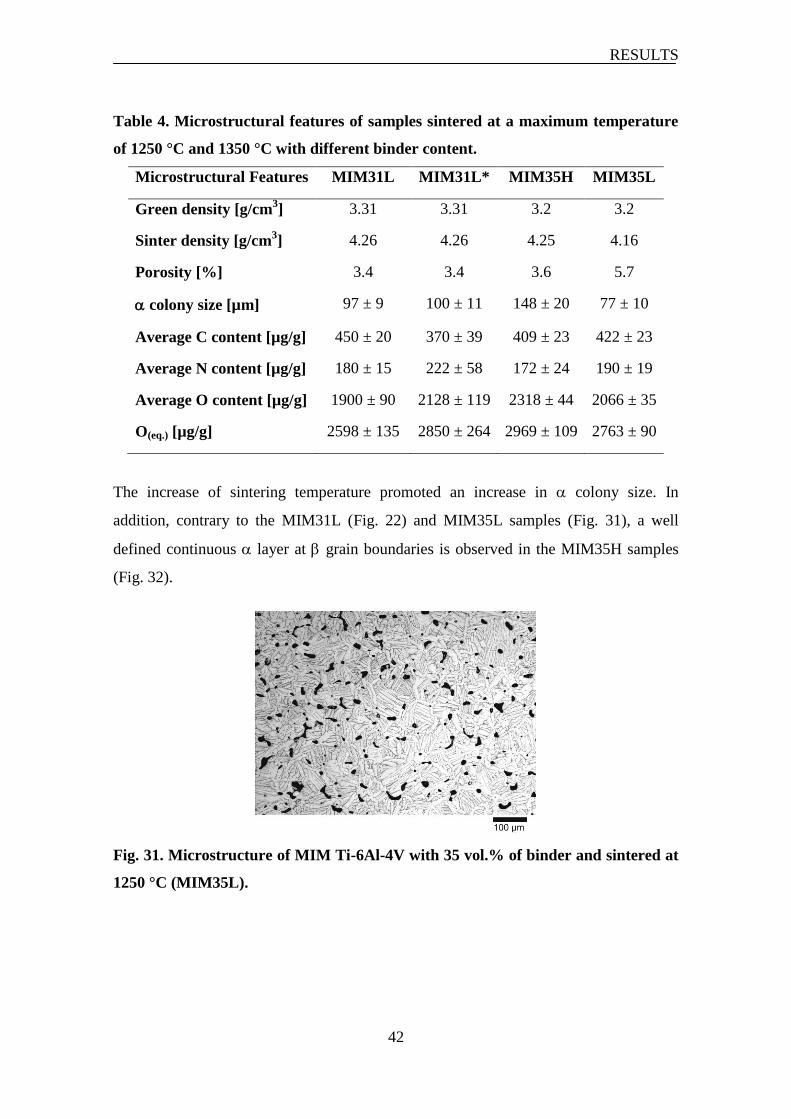
RESULTS
42
Table 4. Microstructural features of samples sintered at a maximum temperature
of 1250 °C and 1350 °C with different binder content.
Microstructural Features MIM31L MIM31L* MIM35H MIM35L
Green density [g/cm3] 3.31 3.31 3.2 3.2
Sinter density [g/cm3] 4.26 4.26 4.25 4.16
Porosity [%] 3.4 3.4 3.6 5.7
colony size [µm] 97 ± 9 100 ± 11 148 ± 20 77 ± 10
Average C content [µg/g] 450 ± 20 370 ± 39 409 ± 23 422 ± 23
Average N content [µg/g] 180 ± 15 222 ± 58 172 ± 24 190 ± 19
Average O content [µg/g] 1900 ± 90 2128 ± 119 2318 ± 44 2066 ± 35
O(eq.) [µg/g] 2598 ± 135 2850 ± 264 2969 ± 109 2763 ± 90
The increase of sintering temperature promoted an increase in colony size. In
addition, contrary to the MIM31L (Fig. 22) and MIM35L samples (Fig. 31), a well
defined continuous layer at grain boundaries is observed in the MIM35H samples
(Fig. 32).
Fig. 31. Microstructure of MIM Ti-6Al-4V with 35 vol.% of binder and sintered at
1250 °C (MIM35L).
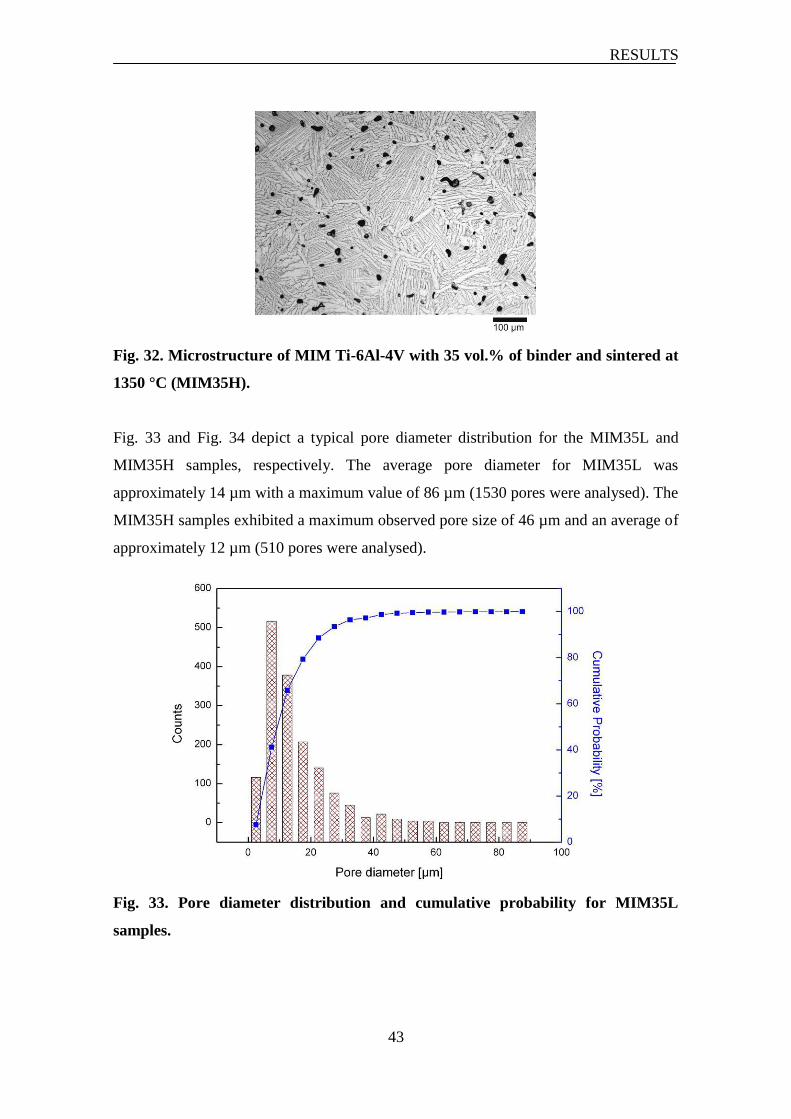
RESULTS
43
Fig. 32. Microstructure of MIM Ti-6Al-4V with 35 vol.% of binder and sintered at
1350 °C (MIM35H).
Fig. 33 and Fig. 34 depict a typical pore diameter distribution for the MIM35L and
MIM35H samples, respectively. The average pore diameter for MIM35L was
approximately 14 µm with a maximum value of 86 µm (1530 pores were analysed). The
MIM35H samples exhibited a maximum observed pore size of 46 µm and an average of
approximately 12 µm (510 pores were analysed).
Fig. 33. Pore diameter distribution and cumulative probability for MIM35L
samples.
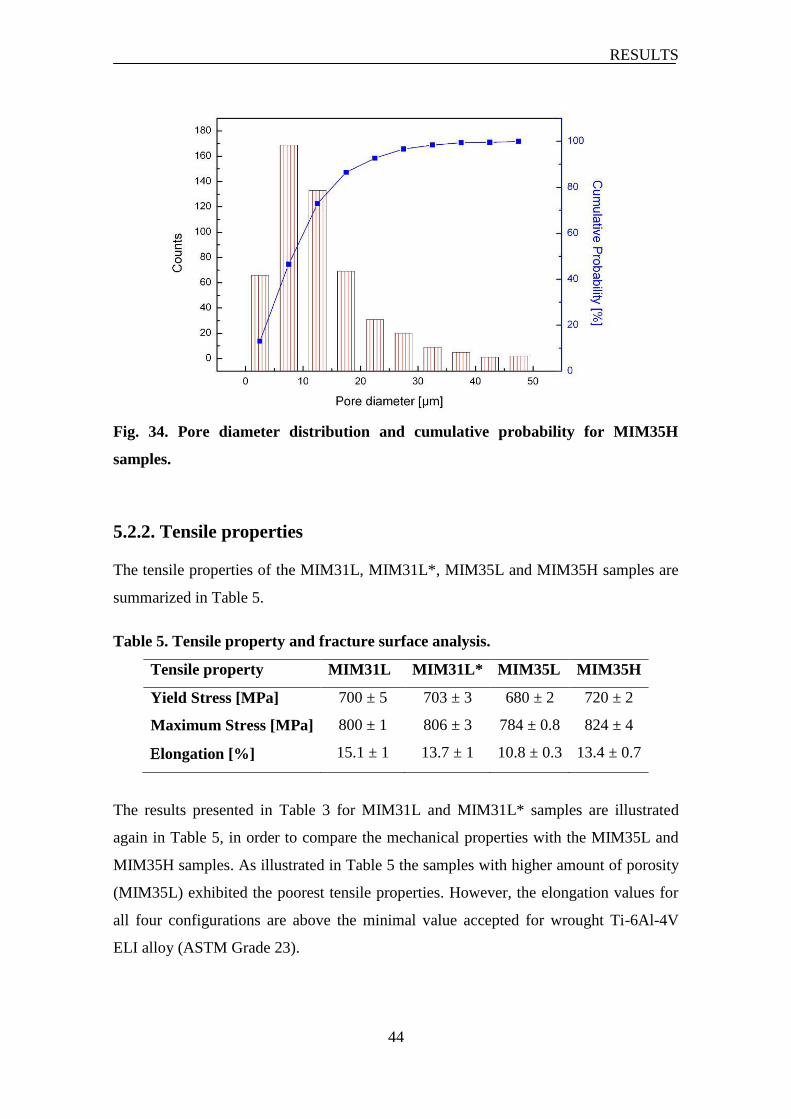
RESULTS
44
Fig. 34. Pore diameter distribution and cumulative probability for MIM35H
samples.
5.2.2. Tensile properties
The tensile properties of the MIM31L, MIM31L*, MIM35L and MIM35H samples are
summarized in Table 5.
Table 5. Tensile property and fracture surface analysis.
Tensile property MIM31L MIM31L* MIM35L MIM35H
Yield Stress [MPa] 700 ± 5 703 ± 3 680 ± 2 720 ± 2
Maximum Stress [MPa] 800 ± 1 806 ± 3 784 ± 0.8 824 ± 4
longation [%] 15.1 ± 1 13.7 ± 1 10.8 ± 0.3 13.4 ± 0.7
The results presented in Table 3 for MIM31L and MIM31L* samples are illustrated
again in Table 5, in order to compare the mechanical properties with the MIM35L and
MIM35H samples. As illustrated in Table 5 the samples with higher amount of porosity
(MIM35L) exhibited the poorest tensile properties. However, the elongation values for
all four configurations are above the minimal value accepted for wrought Ti-6Al-4V
ELI alloy (ASTM Grade 23).
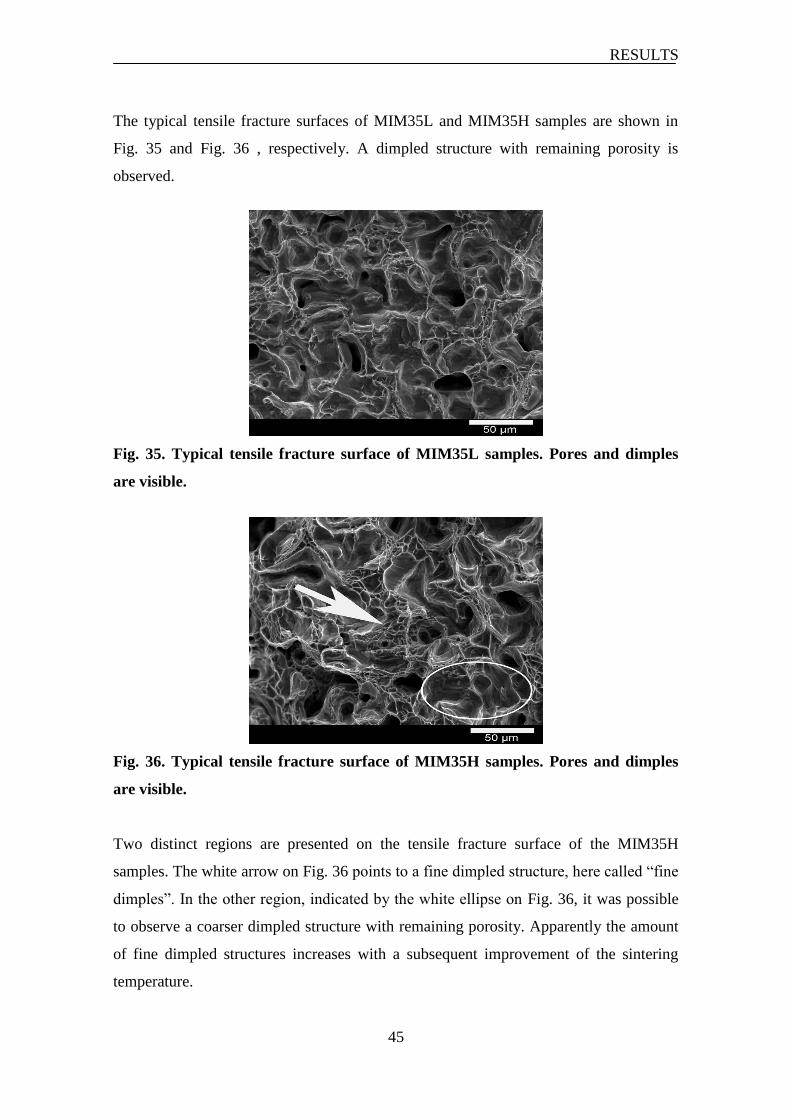
RESULTS
45
The typical tensile fracture surfaces of MIM35L and MIM35H samples are shown in
Fig. 35 and Fig. 36 , respectively. A dimpled structure with remaining porosity is
observed.
Fig. 35. Typical tensile fracture surface of MIM35L samples. Pores and dimples
are visible.
Fig. 36. Typical tensile fracture surface of MIM35H samples. Pores and dimples
are visible.
Two distinct regions are presented on the tensile fracture surface of the MIM35H
samples. The white arrow on Fig. 36 points to a fine dimpled structure, here called “fine
dimples”. In the other region, indicated by the white ellipse on Fig. 36, it was possible
to observe a coarser dimpled structure with remaining porosity. Apparently the amount
of fine dimpled structures increases with a subsequent improvement of the sintering
temperature.
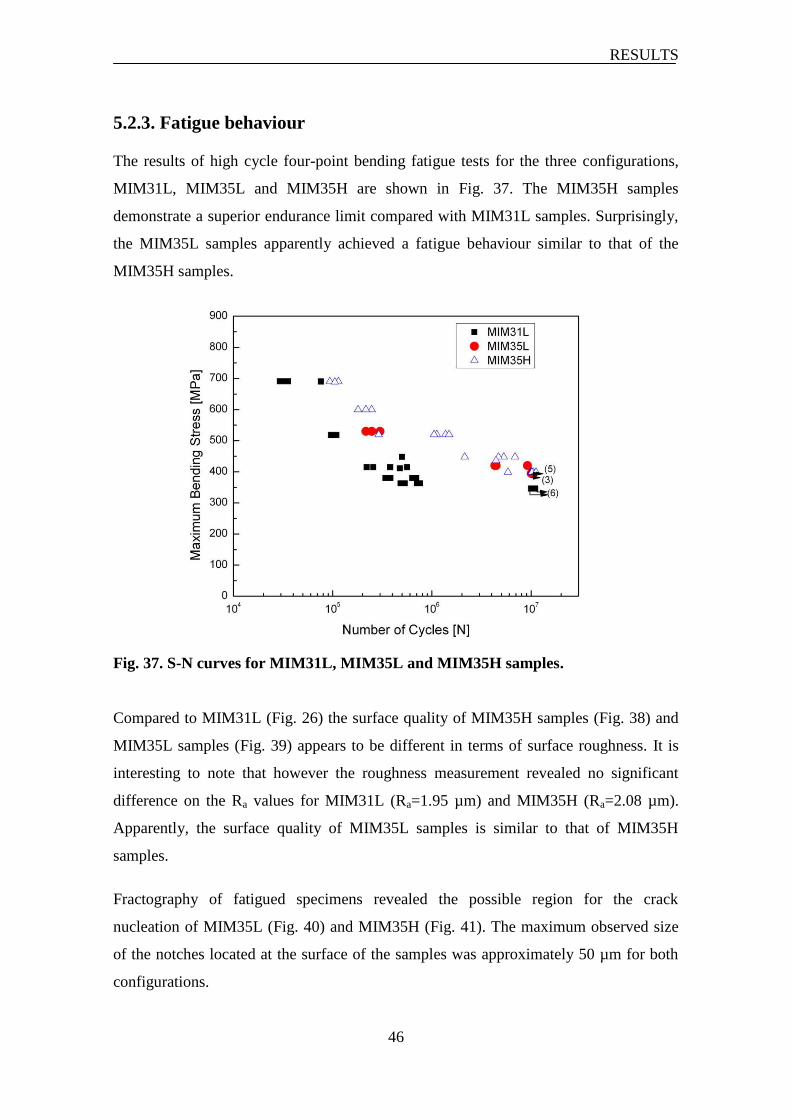
RESULTS
46
5.2.3. Fatigue behaviour
The results of high cycle four-point bending fatigue tests for the three configurations,
MIM31L, MIM35L and MIM35H are shown in Fig. 37. The MIM35H samples
demonstrate a superior endurance limit compared with MIM31L samples. Surprisingly,
the MIM35L samples apparently achieved a fatigue behaviour similar to that of the
MIM35H samples.
Fig. 37. S-N curves for MIM31L, MIM35L and MIM35H samples.
Compared to MIM31L (Fig. 26) the surface quality of MIM35H samples (Fig. 38) and
MIM35L samples (Fig. 39) appears to be different in terms of surface roughness. It is
interesting to note that however the roughness measurement revealed no significant
difference on the Ra values for MIM31L (Ra=1.95 µm) and MIM35H (Ra=2.08 µm).
Apparently, the surface quality of MIM35L samples is similar to that of MIM35H
samples.
Fractography of fatigued specimens revealed the possible region for the crack
nucleation of MIM35L (Fig. 40) and MIM35H (Fig. 41). The maximum observed size
of the notches located at the surface of the samples was approximately 50 µm for both
configurations.

RESULTS
47
Fig. 38. Surface quality of the MIM35H samples.
Fig. 39. Surface quality of the MIM35L samples.
It was possible to identify in Fig. 40 and Fig. 41 the presence of facets regions. Such a
microstructural feature at the assumed crack initiation region was also observed for the
MIM31L samples (Fig. 28b). However, the size of the facets for the MIM35H samples
was apparently bigger than the MIM35L samples.
Fig. 40. Typical fracture surface of MIM35L samples. Possible crack nucleation
region.
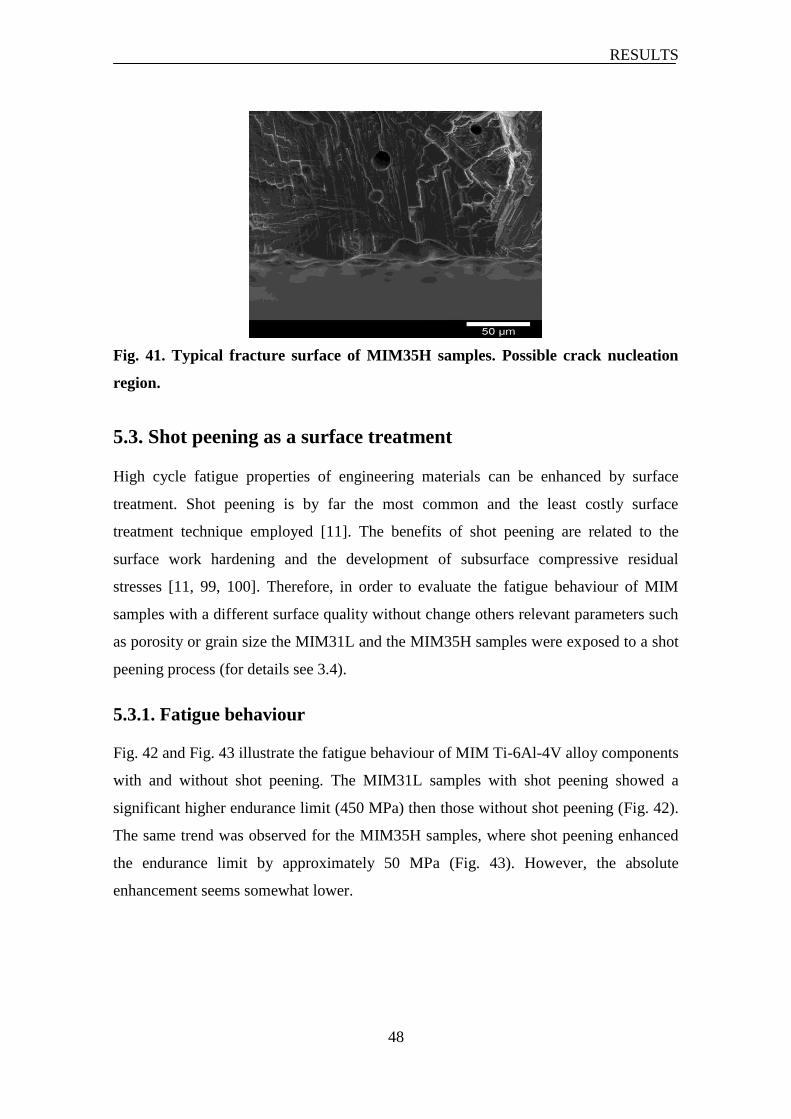
RESULTS
48
Fig. 41. Typical fracture surface of MIM35H samples. Possible crack nucleation
region.
5.3. Shot peening as a surface treatment
High cycle fatigue properties of engineering materials can be enhanced by surface
treatment. Shot peening is by far the most common and the least costly surface
treatment technique employed [11]. The benefits of shot peening are related to the
surface work hardening and the development of subsurface compressive residual
stresses [11, 99, 100]. Therefore, in order to evaluate the fatigue behaviour of MIM
samples with a different surface quality without change others relevant parameters such
as porosity or grain size the MIM31L and the MIM35H samples were exposed to a shot
peening process (for details see 3.4).
5.3.1. Fatigue behaviour
Fig. 42 and Fig. 43 illustrate the fatigue behaviour of MIM Ti-6Al-4V alloy components
with and without shot peening. The MIM31L samples with shot peening showed a
significant higher endurance limit (450 MPa) then those without shot peening (Fig. 42).
The same trend was observed for the MIM35H samples, where shot peening enhanced
the endurance limit by approximately 50 MPa (Fig. 43). However, the absolute
enhancement seems somewhat lower.
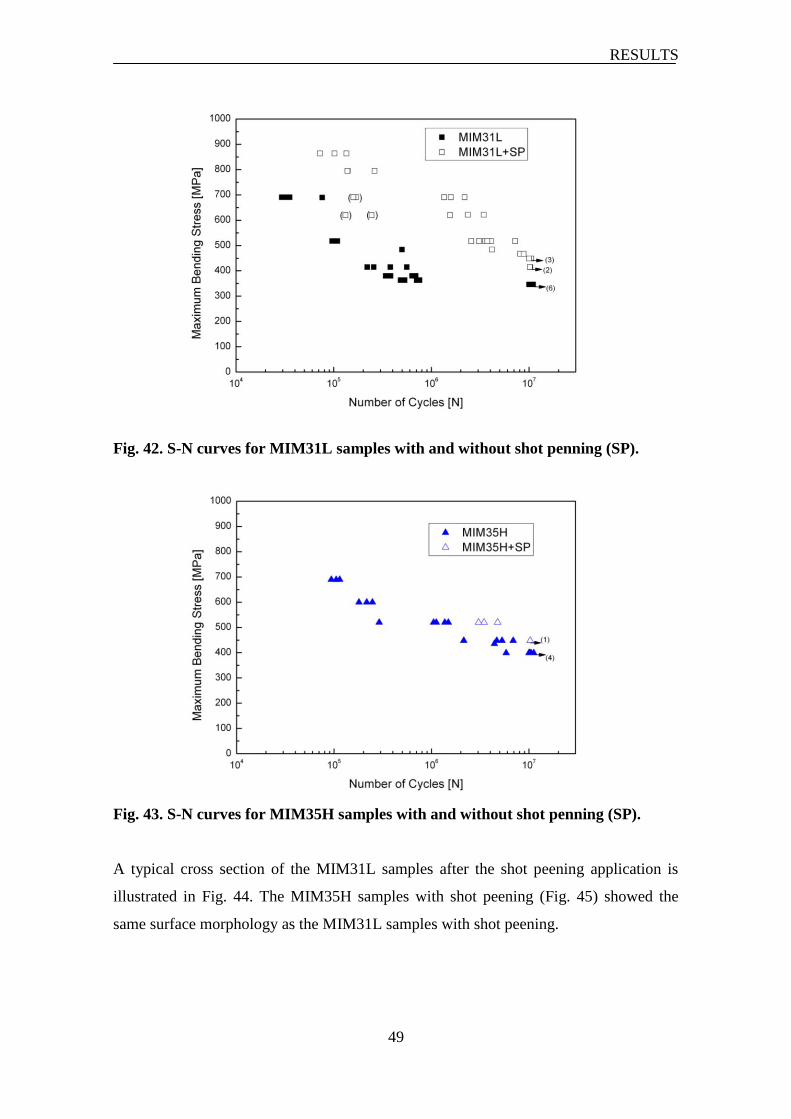
RESULTS
49
Fig. 42. S-N curves for MIM31L samples with and without shot penning (SP).
Fig. 43. S-N curves for MIM35H samples with and without shot penning (SP).
A typical cross section of the MIM31L samples after the shot peening application is
illustrated in Fig. 44. The MIM35H samples with shot peening (Fig. 45) showed the
same surface morphology as the MIM31L samples with shot peening.
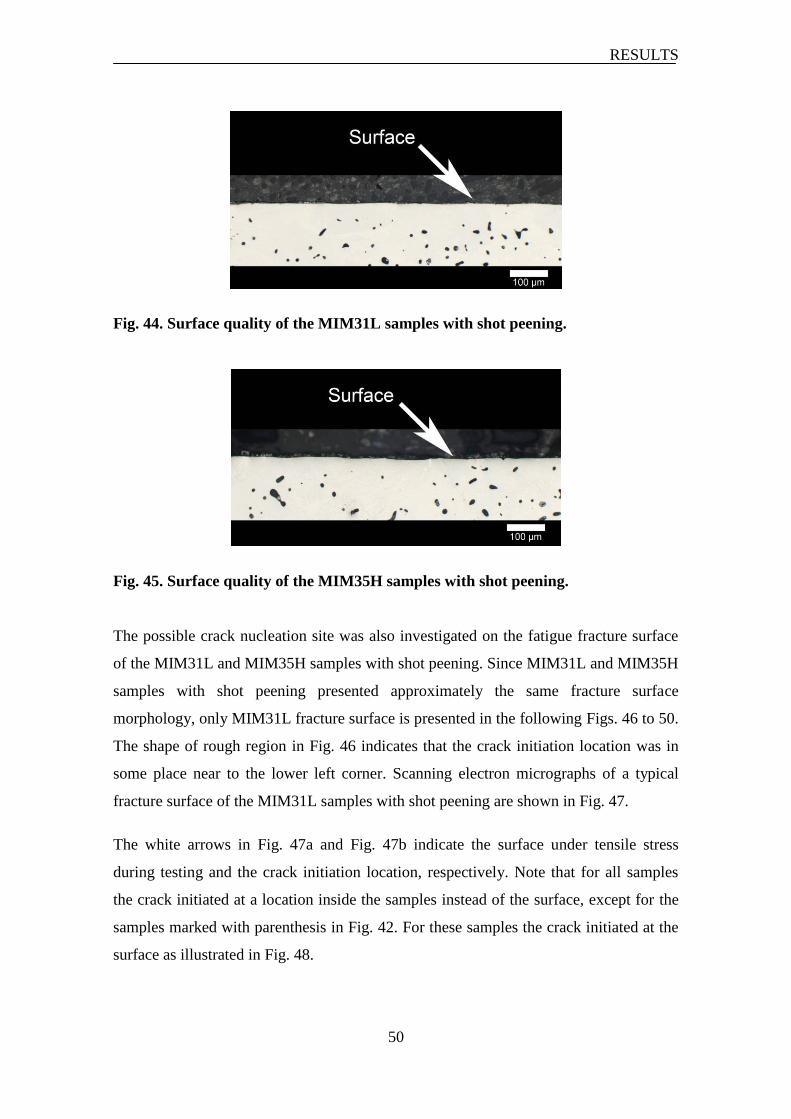
RESULTS
50
Fig. 44. Surface quality of the MIM31L samples with shot peening.
Fig. 45. Surface quality of the MIM35H samples with shot peening.
The possible crack nucleation site was also investigated on the fatigue fracture surface
of the MIM31L and MIM35H samples with shot peening. Since MIM31L and MIM35H
samples with shot peening presented approximately the same fracture surface
morphology, only MIM31L fracture surface is presented in the following Figs. 46 to 50.
The shape of rough region in Fig. 46 indicates that the crack initiation location was in
some place near to the lower left corner. Scanning electron micrographs of a typical
fracture surface of the MIM31L samples with shot peening are shown in Fig. 47.
The white arrows in Fig. 47a and Fig. 47b indicate the surface under tensile stress
during testing and the crack initiation location, respectively. Note that for all samples
the crack initiated at a location inside the samples instead of the surface, except for the
samples marked with parenthesis in Fig. 42. For these samples the crack initiated at the
surface as illustrated in Fig. 48.
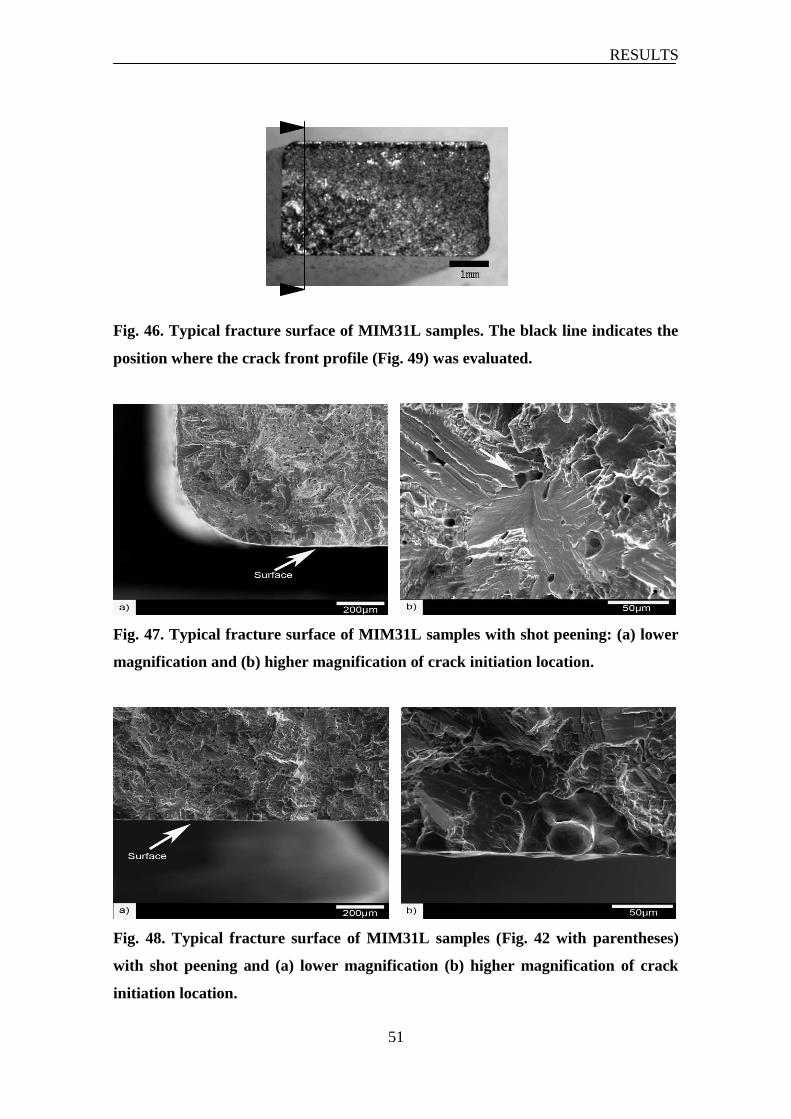
RESULTS
51
Fig. 46. Typical fracture surface of MIM31L samples. The black line indicates the
position where the crack front profile (Fig. 49) was evaluated.
Fig. 47. Typical fracture surface of MIM31L samples with shot peening: (a) lower
magnification and (b) higher magnification of crack initiation location.
Fig. 48. Typical fracture surface of MIM31L samples (Fig. 42 with parentheses)
with shot peening and (a) lower magnification (b) higher magnification of crack
initiation location.
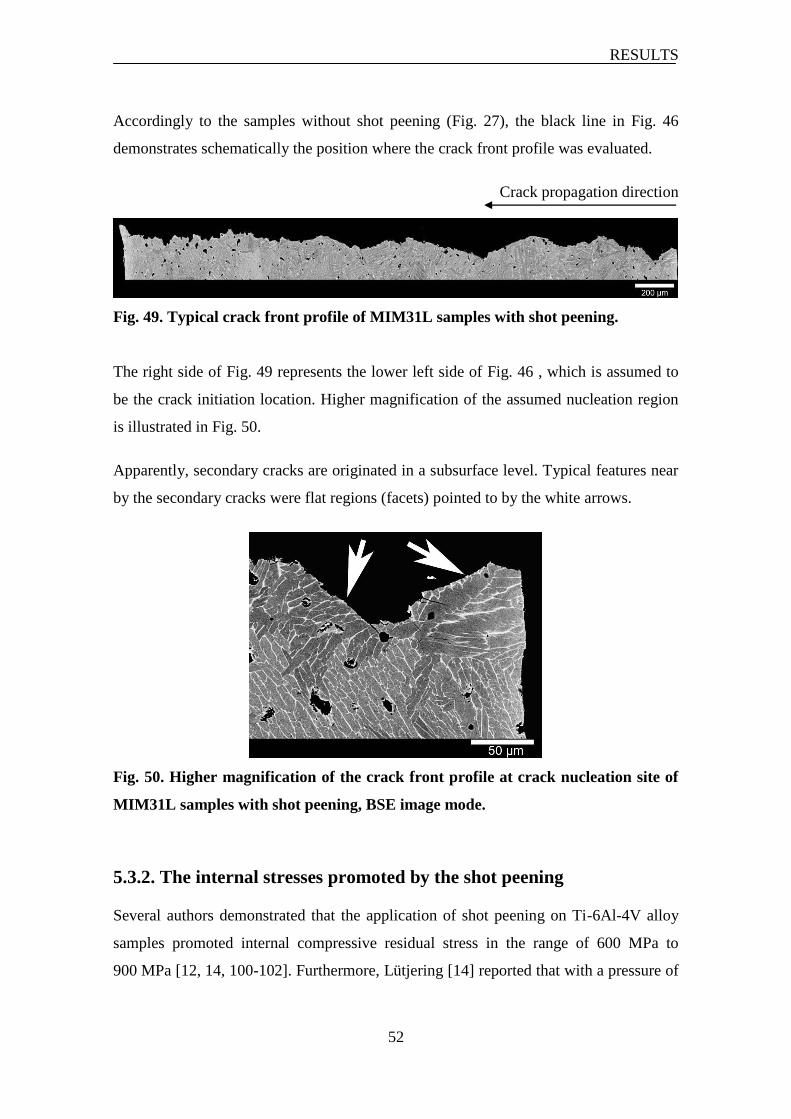
RESULTS
52
Accordingly to the samples without shot peening (Fig. 27), the black line in Fig. 46
demonstrates schematically the position where the crack front profile was evaluated.
Crack propagation direction
Fig. 49. Typical crack front profile of MIM31L samples with shot peening.
The right side of Fig. 49 represents the lower left side of Fig. 46 , which is assumed to
be the crack initiation location. Higher magnification of the assumed nucleation region
is illustrated in Fig. 50.
Apparently, secondary cracks are originated in a subsurface level. Typical features near
by the secondary cracks were flat regions (facets) pointed to by the white arrows.
Fig. 50. Higher magnification of the crack front profile at crack nucleation site of
MIM31L samples with shot peening, BSE image mode.
5.3.2. The internal stresses promoted by the shot peening
Several authors demonstrated that the application of shot peening on Ti-6Al-4V alloy
samples promoted internal compressive residual stress in the range of 600 MPa to
900 MPa [12, 14, 100-102]. Furthermore, Lütjering [14] reported that with a pressure of
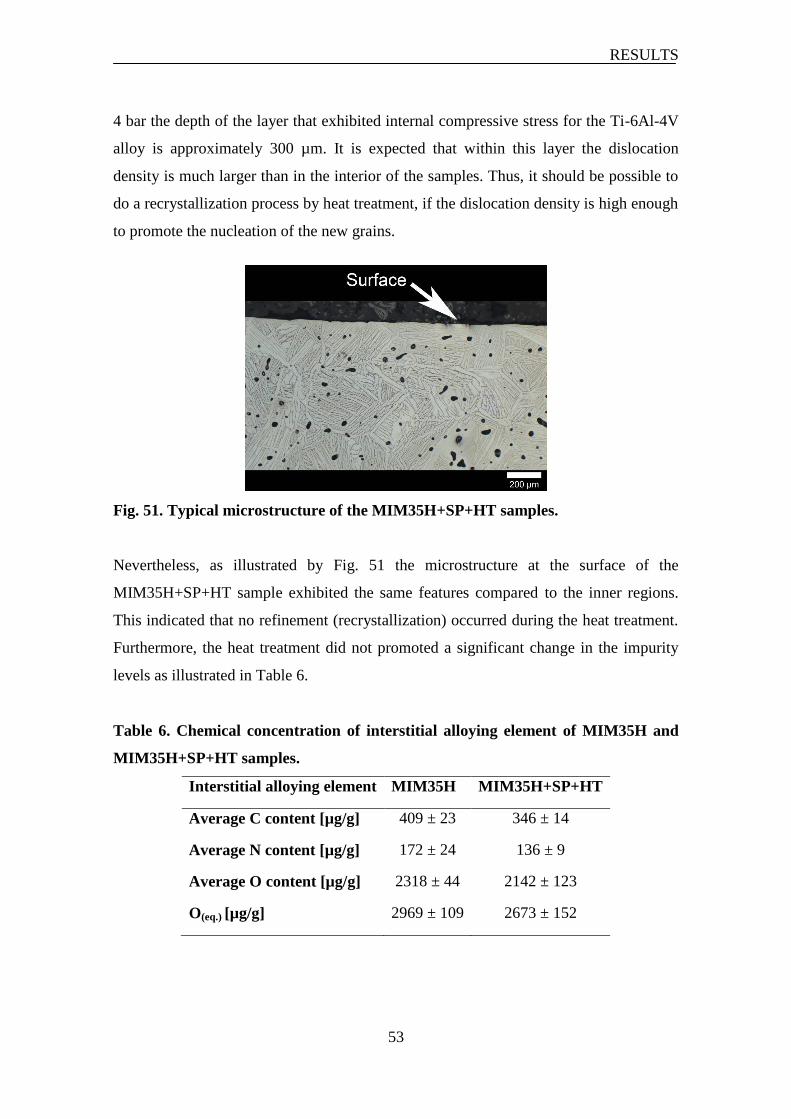
RESULTS
53
4 bar the depth of the layer that exhibited internal compressive stress for the Ti-6Al-4V
alloy is approximately 300 µm. It is expected that within this layer the dislocation
density is much larger than in the interior of the samples. Thus, it should be possible to
do a recrystallization process by heat treatment, if the dislocation density is high enough
to promote the nucleation of the new grains.
Fig. 51. Typical microstructure of the MIM35H+SP+HT samples.
Nevertheless, as illustrated by Fig. 51 the microstructure at the surface of the
MIM35H+SP+HT sample exhibited the same features compared to the inner regions.
This indicated that no refinement (recrystallization) occurred during the heat treatment.
Furthermore, the heat treatment did not promoted a significant change in the impurity
levels as illustrated in Table 6.
Table 6. Chemical concentration of interstitial alloying element of MIM35H and
MIM35H+SP+HT samples.
Interstitial alloying element MIM35H MIM35H+SP+HT
Average C content [µg/g] 409 ± 23 346 ± 14
Average N content [µg/g] 172 ± 24 136 ± 9
Average O content [µg/g] 2318 ± 44 2142 ± 123
O(eq.) [µg/g] 2969 ± 109 2673 ± 152
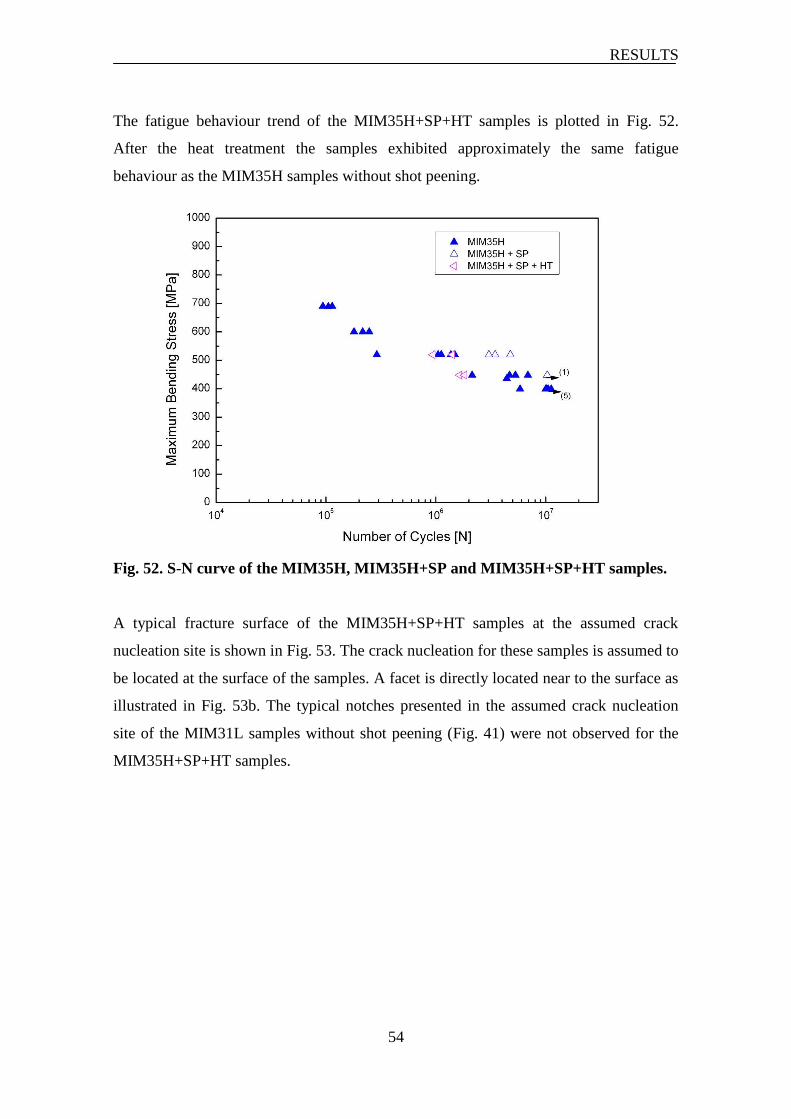
RESULTS
54
The fatigue behaviour trend of the MIM35H+SP+HT samples is plotted in Fig. 52.
After the heat treatment the samples exhibited approximately the same fatigue
behaviour as the MIM35H samples without shot peening.
Fig. 52. S-N curve of the MIM35H, MIM35H+SP and MIM35H+SP+HT samples.
A typical fracture surface of the MIM35H+SP+HT samples at the assumed crack
nucleation site is shown in Fig. 53. The crack nucleation for these samples is assumed to
be located at the surface of the samples. A facet is directly located near to the surface as
illustrated in Fig. 53b. The typical notches presented in the assumed crack nucleation
site of the MIM31L samples without shot peening (Fig. 41) were not observed for the
MIM35H+SP+HT samples.
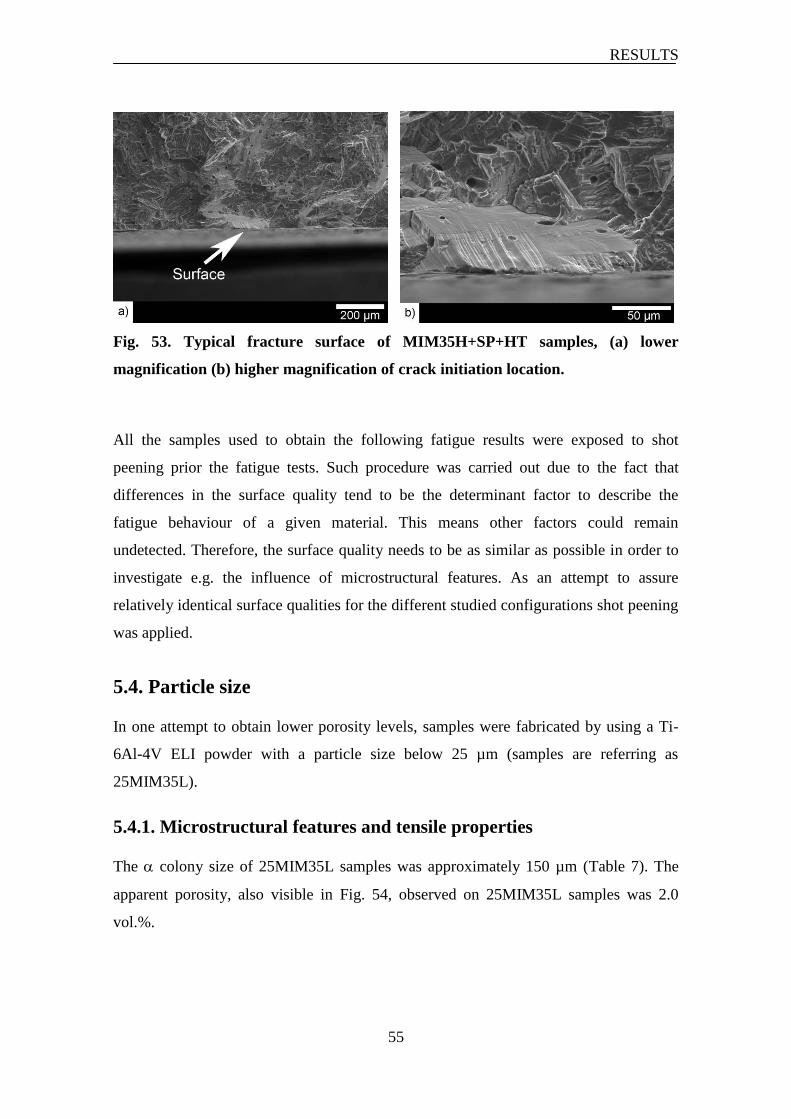
RESULTS
55
Fig. 53. Typical fracture surface of MIM35H+SP+HT samples, (a) lower
magnification (b) higher magnification of crack initiation location.
All the samples used to obtain the following fatigue results were exposed to shot
peening prior the fatigue tests. Such procedure was carried out due to the fact that
differences in the surface quality tend to be the determinant factor to describe the
fatigue behaviour of a given material. This means other factors could remain
undetected. Therefore, the surface quality needs to be as similar as possible in order to
investigate e.g. the influence of microstructural features. As an attempt to assure
relatively identical surface qualities for the different studied configurations shot peening
was applied.
5.4. Particle size
In one attempt to obtain lower porosity levels, samples were fabricated by using a Ti-
6Al-4V ELI powder with a particle size below 25 µm (samples are referring as
25MIM35L).
5.4.1. Microstructural features and tensile properties
The colony size of 25MIM35L samples was approximately 150 µm (Table 7). The
apparent porosity, also visible in Fig. 54, observed on 25MIM35L samples was 2.0
vol.%.
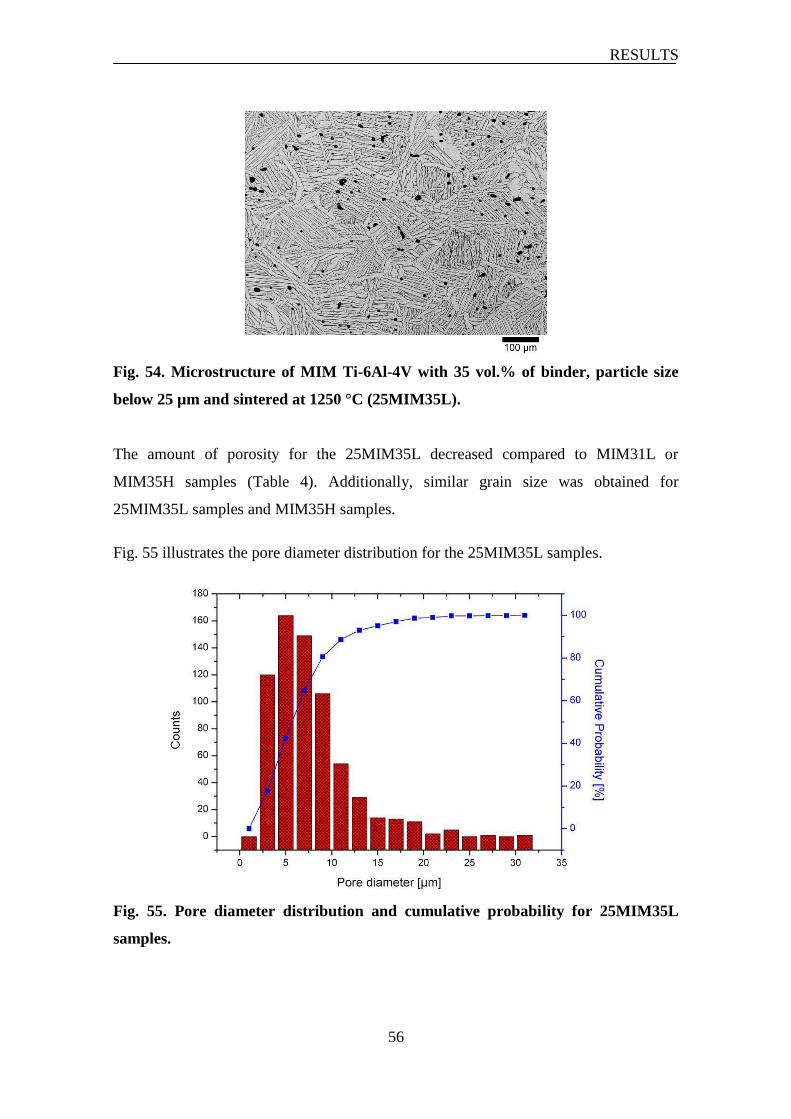
RESULTS
56
Fig. 54. Microstructure of MIM Ti-6Al-4V with 35 vol.% of binder, particle size
below 25 µm and sintered at 1250 °C (25MIM35L).
The amount of porosity for the 25MIM35L decreased compared to MIM31L or
MIM35H samples (Table 4). Additionally, similar grain size was obtained for
25MIM35L samples and MIM35H samples.
Fig. 55 illustrates the pore diameter distribution for the 25MIM35L samples.
Fig. 55. Pore diameter distribution and cumulative probability for 25MIM35L
samples.
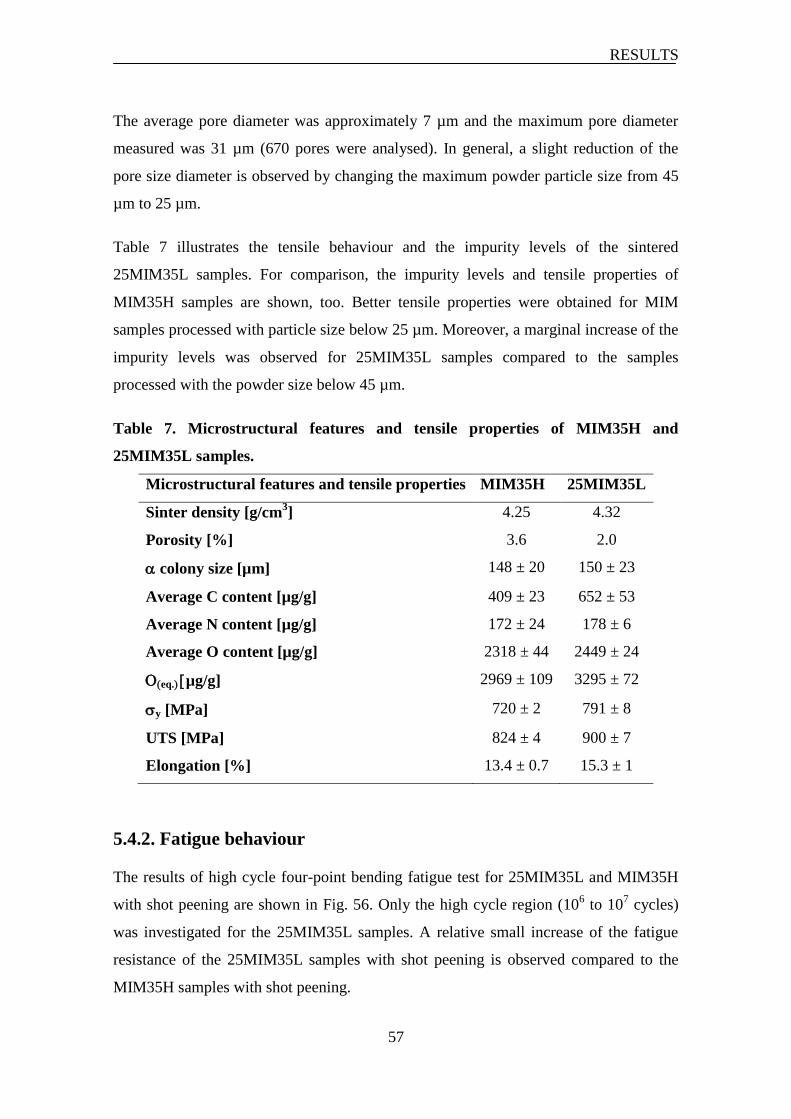
RESULTS
57
The average pore diameter was approximately 7 µm and the maximum pore diameter
measured was 31 µm (670 pores were analysed). In general, a slight reduction of the
pore size diameter is observed by changing the maximum powder particle size from 45
µm to 25 µm.
Table 7 illustrates the tensile behaviour and the impurity levels of the sintered
25MIM35L samples. For comparison, the impurity levels and tensile properties of
MIM35H samples are shown, too. Better tensile properties were obtained for MIM
samples processed with particle size below 25 µm. Moreover, a marginal increase of the
impurity levels was observed for 25MIM35L samples compared to the samples
processed with the powder size below 45 µm.
Table 7. Microstructural features and tensile properties of MIM35H and
25MIM35L samples.
Microstructural features and tensile properties MIM35H 25MIM35L
Sinter density [g/cm3] 4.25 4.32
Porosity [%] 3.6 2.0
colony size [µm] 148 ± 20 150 ± 23
Average C content [µg/g] 409 ± 23 652 ± 53
Average N content [µg/g] 172 ± 24 178 ± 6
Average O content [µg/g] 2318 ± 44 2449 ± 24
eq.µg/g] 2969 ± 109 3295 ± 72
y [MPa] 720 ± 2 791 ± 8
UTS [MPa] 824 ± 4 900 ± 7
Elongation [%] 13.4 ± 0.7 15.3 ± 1
5.4.2. Fatigue behaviour
The results of high cycle four-point bending fatigue test for 25MIM35L and MIM35H
with shot peening are shown in Fig. 56. Only the high cycle region (106 to 10
7 cycles)
was investigated for the 25MIM35L samples. A relative small increase of the fatigue
resistance of the 25MIM35L samples with shot peening is observed compared to the
MIM35H samples with shot peening.
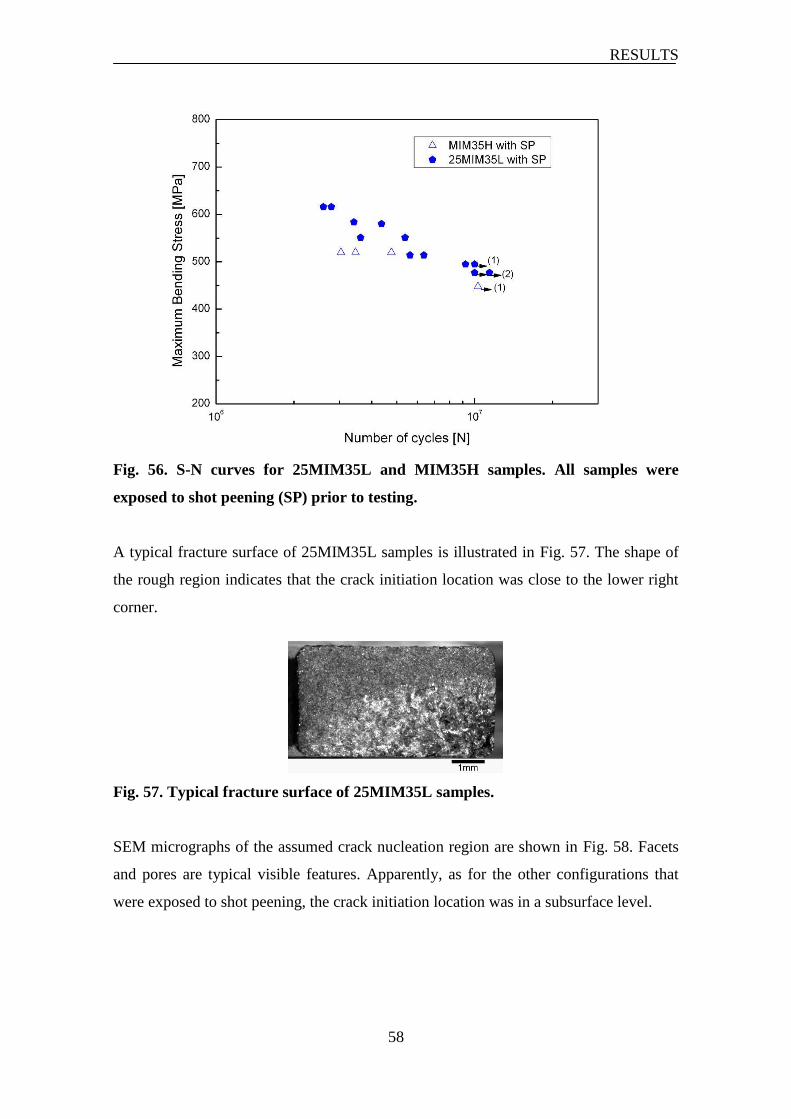
RESULTS
58
Fig. 56. S-N curves for 25MIM35L and MIM35H samples. All samples were
exposed to shot peening (SP) prior to testing.
A typical fracture surface of 25MIM35L samples is illustrated in Fig. 57. The shape of
the rough region indicates that the crack initiation location was close to the lower right
corner.
Fig. 57. Typical fracture surface of 25MIM35L samples.
SEM micrographs of the assumed crack nucleation region are shown in Fig. 58. Facets
and pores are typical visible features. Apparently, as for the other configurations that
were exposed to shot peening, the crack initiation location was in a subsurface level.
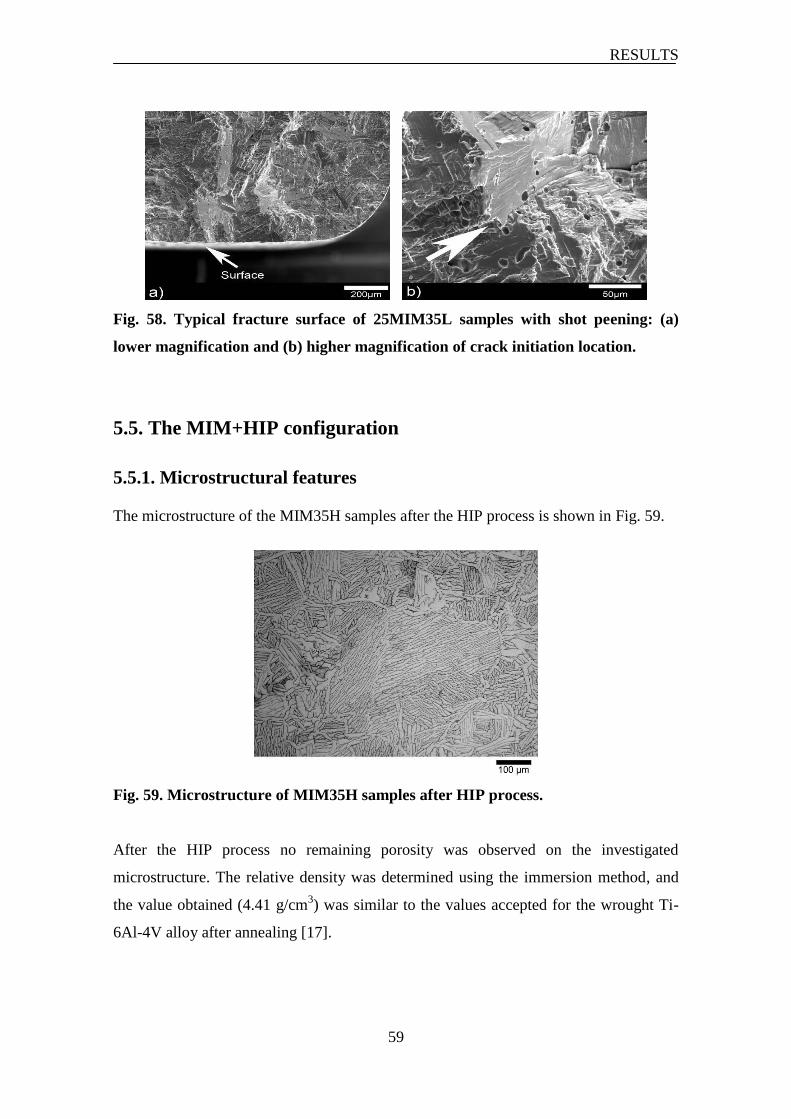
RESULTS
59
Fig. 58. Typical fracture surface of 25MIM35L samples with shot peening: (a)
lower magnification and (b) higher magnification of crack initiation location.
5.5. The MIM+HIP configuration
5.5.1. Microstructural features
The microstructure of the MIM35H samples after the HIP process is shown in Fig. 59.
Fig. 59. Microstructure of MIM35H samples after HIP process.
After the HIP process no remaining porosity was observed on the investigated
microstructure. The relative density was determined using the immersion method, and
the value obtained (4.41 g/cm3) was similar to the values accepted for the wrought Ti-
6Al-4V alloy after annealing [17].
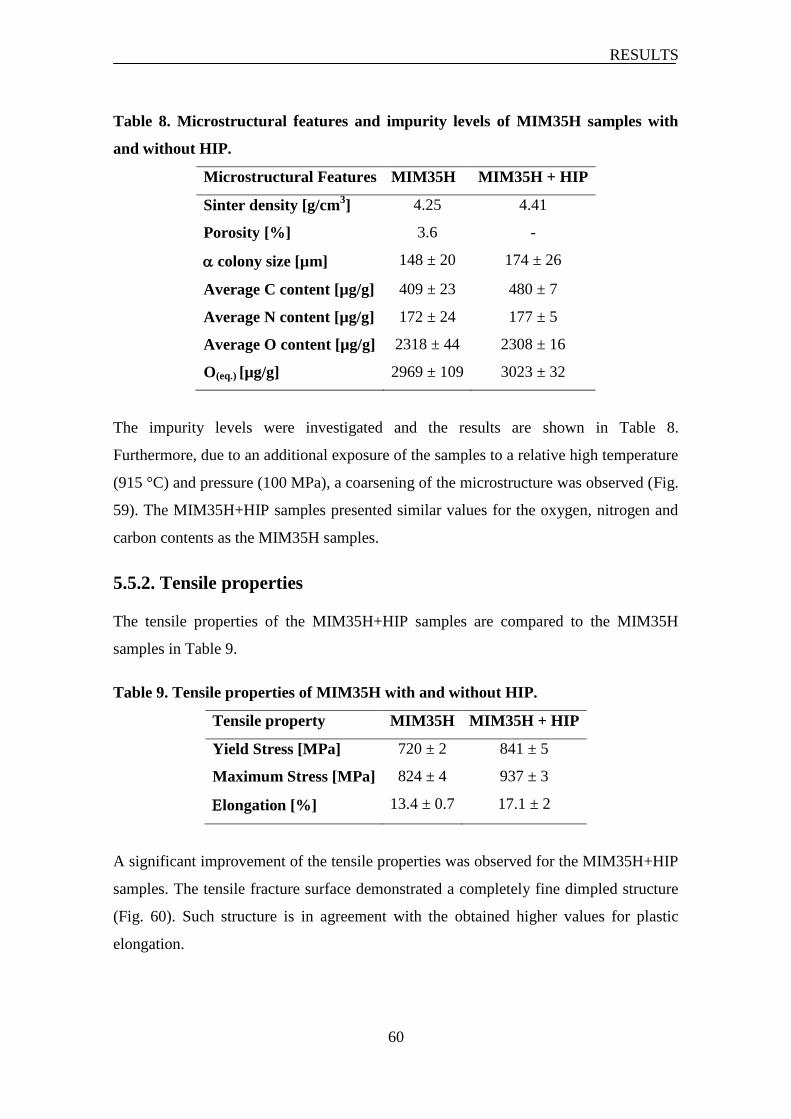
RESULTS
60
Table 8. Microstructural features and impurity levels of MIM35H samples with
and without HIP.
Microstructural Features MIM35H MIM35H + HIP
Sinter density [g/cm3] 4.25 4.41
Porosity [%] 3.6 -
colony size [µm] 148 ± 20 174 ± 26
Average C content [µg/g] 409 ± 23 480 ± 7
Average N content [µg/g] 172 ± 24 177 ± 5
Average O content [µg/g] 2318 ± 44 2308 ± 16
O(eq.) [µg/g] 2969 ± 109 3023 ± 32
The impurity levels were investigated and the results are shown in Table 8.
Furthermore, due to an additional exposure of the samples to a relative high temperature
(915 °C) and pressure (100 MPa), a coarsening of the microstructure was observed (Fig.
59). The MIM35H+HIP samples presented similar values for the oxygen, nitrogen and
carbon contents as the MIM35H samples.
5.5.2. Tensile properties
The tensile properties of the MIM35H+HIP samples are compared to the MIM35H
samples in Table 9.
Table 9. Tensile properties of MIM35H with and without HIP.
Tensile property MIM35H MIM35H + HIP
Yield Stress [MPa] 720 ± 2 841 ± 5
Maximum Stress [MPa] 824 ± 4 937 ± 3
longation [%] 13.4 ± 0.7 17.1 ± 2
A significant improvement of the tensile properties was observed for the MIM35H+HIP
samples. The tensile fracture surface demonstrated a completely fine dimpled structure
(Fig. 60). Such structure is in agreement with the obtained higher values for plastic
elongation.
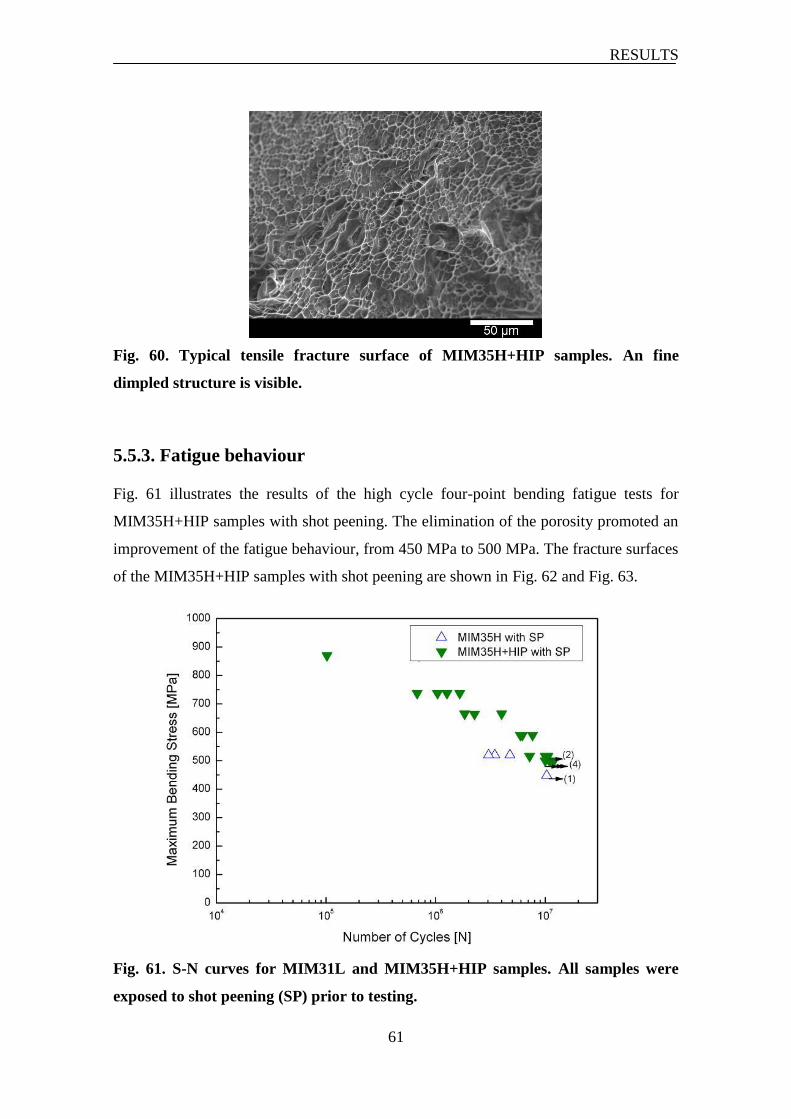
RESULTS
61
Fig. 60. Typical tensile fracture surface of MIM35H+HIP samples. An fine
dimpled structure is visible.
5.5.3. Fatigue behaviour
Fig. 61 illustrates the results of the high cycle four-point bending fatigue tests for
MIM35H+HIP samples with shot peening. The elimination of the porosity promoted an
improvement of the fatigue behaviour, from 450 MPa to 500 MPa. The fracture surfaces
of the MIM35H+HIP samples with shot peening are shown in Fig. 62 and Fig. 63.
Fig. 61. S-N curves for MIM31L and MIM35H+HIP samples. All samples were
exposed to shot peening (SP) prior to testing.
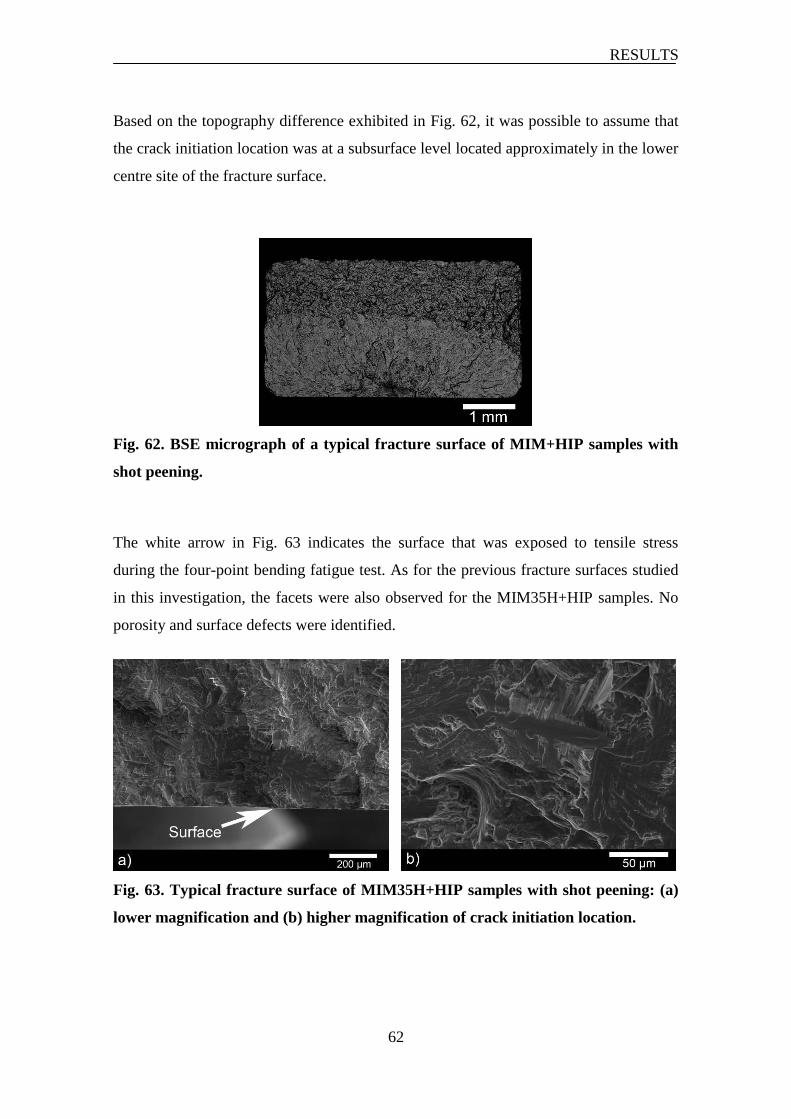
RESULTS
62
Based on the topography difference exhibited in Fig. 62, it was possible to assume that
the crack initiation location was at a subsurface level located approximately in the lower
centre site of the fracture surface.
Fig. 62. BSE micrograph of a typical fracture surface of MIM+HIP samples with
shot peening.
The white arrow in Fig. 63 indicates the surface that was exposed to tensile stress
during the four-point bending fatigue test. As for the previous fracture surfaces studied
in this investigation, the facets were also observed for the MIM35H+HIP samples. No
porosity and surface defects were identified.
Fig. 63. Typical fracture surface of MIM35H+HIP samples with shot peening: (a)
lower magnification and (b) higher magnification of crack initiation location.
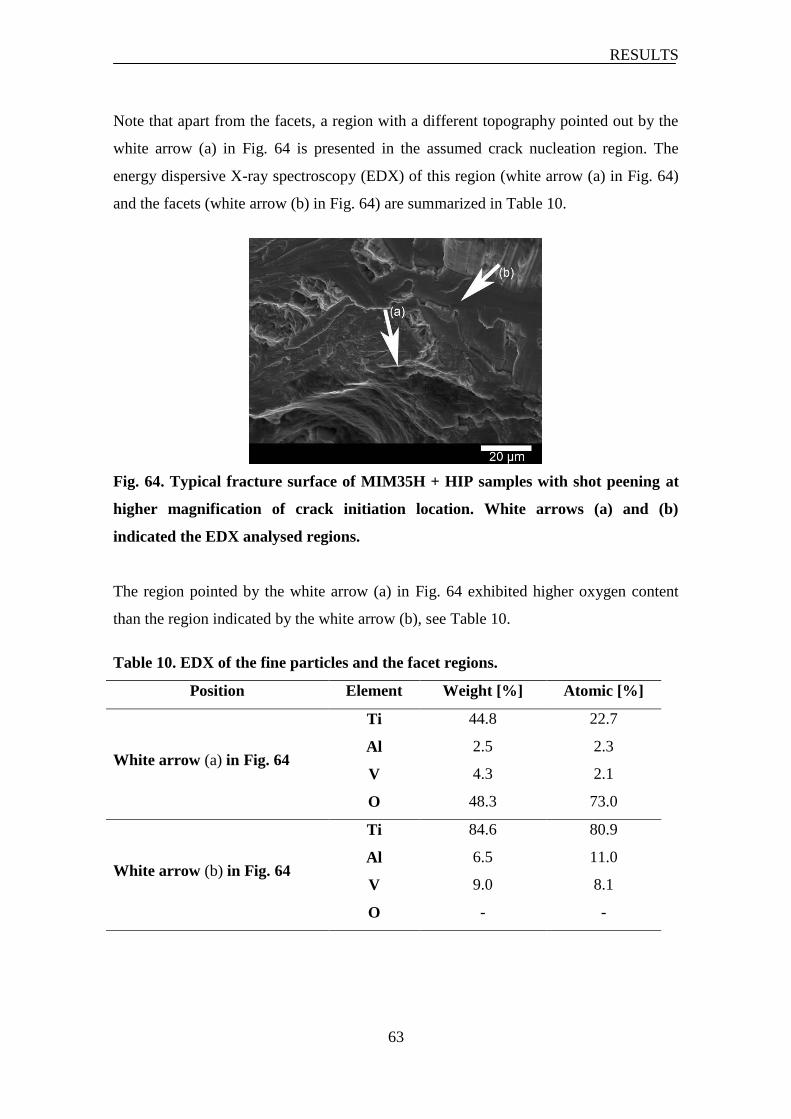
RESULTS
63
Note that apart from the facets, a region with a different topography pointed out by the
white arrow (a) in Fig. 64 is presented in the assumed crack nucleation region. The
energy dispersive X-ray spectroscopy (EDX) of this region (white arrow (a) in Fig. 64)
and the facets (white arrow (b) in Fig. 64) are summarized in Table 10.
Fig. 64. Typical fracture surface of MIM35H + HIP samples with shot peening at
higher magnification of crack initiation location. White arrows (a) and (b)
indicated the EDX analysed regions.
The region pointed by the white arrow (a) in Fig. 64 exhibited higher oxygen content
than the region indicated by the white arrow (b), see Table 10.
Table 10. EDX of the fine particles and the facet regions.
Position Element Weight [%] Atomic [%]
White arrow (a) in Fig. 64
Ti 44.8 22.7
Al 2.5 2.3
V 4.3 2.1
O 48.3 73.0
White arrow (b) in Fig. 64
Ti 84.6 80.9
Al 6.5 11.0
V 9.0 8.1
O - -
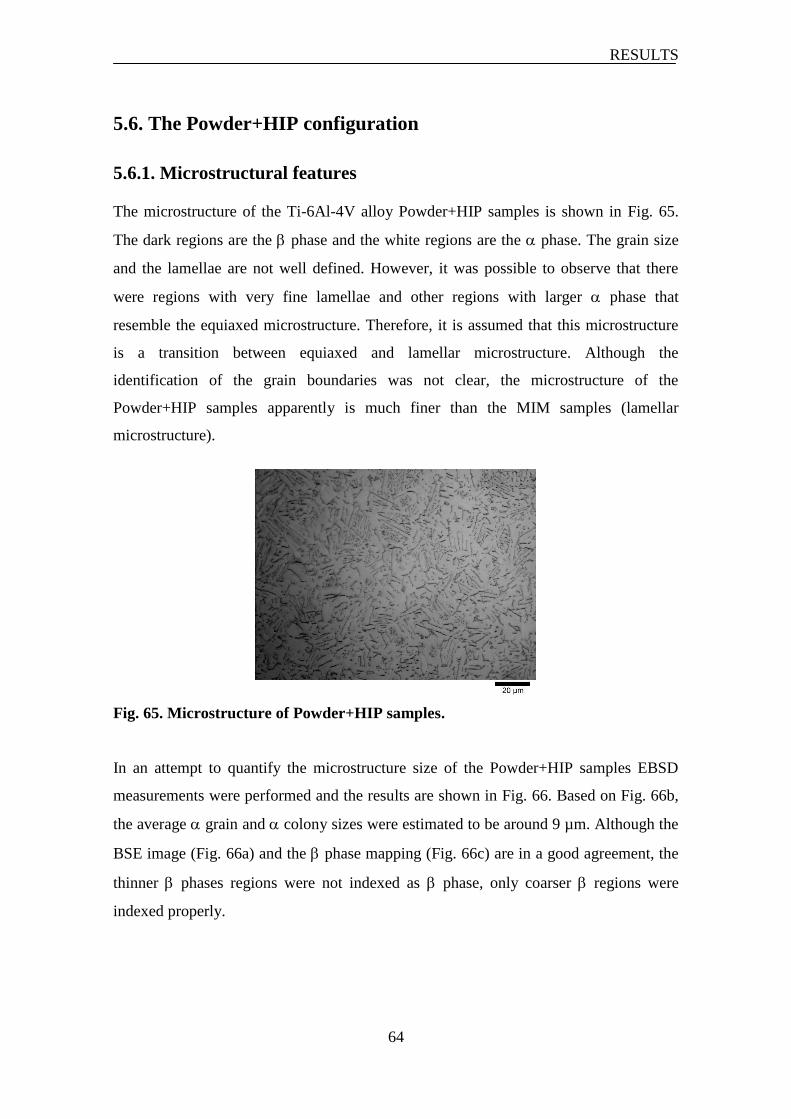
RESULTS
64
5.6. The Powder+HIP configuration
5.6.1. Microstructural features
The microstructure of the Ti-6Al-4V alloy Powder+HIP samples is shown in Fig. 65.
The dark regions are the phase and the white regions are the phase. The grain size
and the lamellae are not well defined. However, it was possible to observe that there
were regions with very fine lamellae and other regions with larger phase that
resemble the equiaxed microstructure. Therefore, it is assumed that this microstructure
is a transition between equiaxed and lamellar microstructure. Although the
identification of the grain boundaries was not clear, the microstructure of the
Powder+HIP samples apparently is much finer than the MIM samples (lamellar
microstructure).
Fig. 65. Microstructure of Powder+HIP samples.
In an attempt to quantify the microstructure size of the Powder+HIP samples EBSD
measurements were performed and the results are shown in Fig. 66. Based on Fig. 66b,
the average grain and colony sizes were estimated to be around 9 µm. Although the
BSE image (Fig. 66a) and the phase mapping (Fig. 66c) are in a good agreement, the
thinner phases regions were not indexed as phase, only coarser regions were
indexed properly.
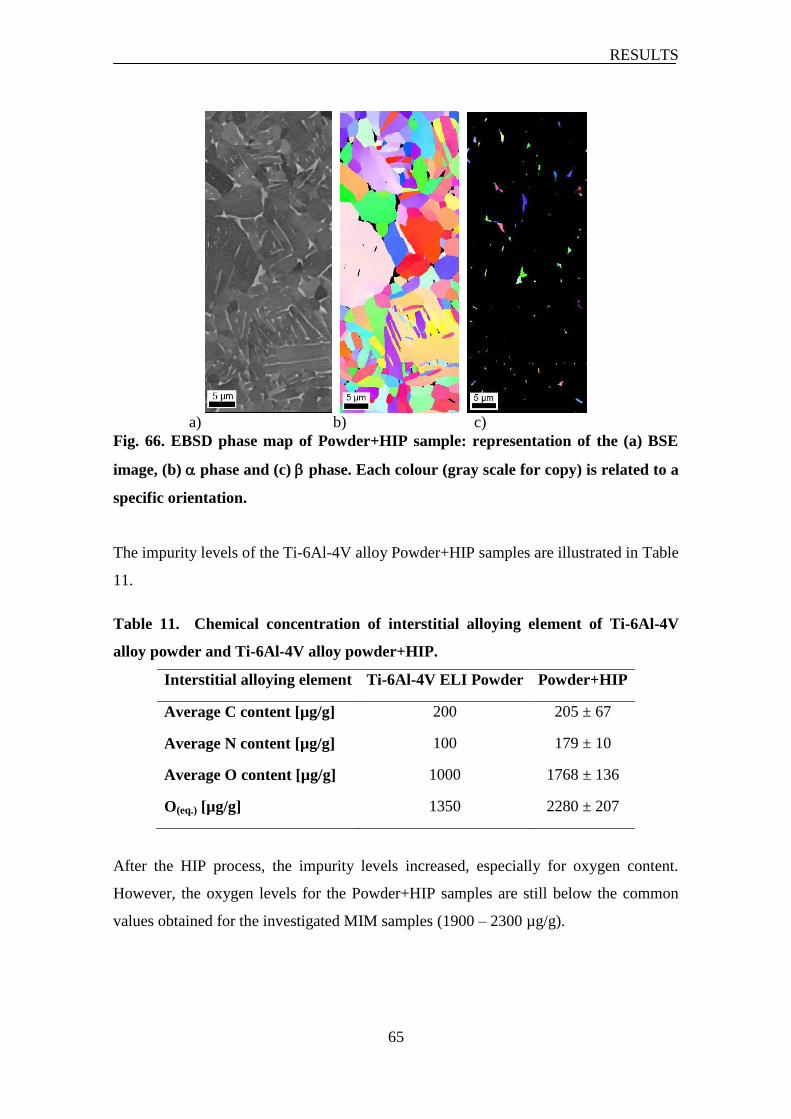
RESULTS
65
a) b) c)
Fig. 66. EBSD phase map of Powder+HIP sample: representation of the (a) BSE
image, (b) phase and (c) phase. Each colour (gray scale for copy) is related to a
specific orientation.
The impurity levels of the Ti-6Al-4V alloy Powder+HIP samples are illustrated in Table
11.
Table 11. Chemical concentration of interstitial alloying element of Ti-6Al-4V
alloy powder and Ti-6Al-4V alloy powder+HIP.
Interstitial alloying element Ti-6Al-4V ELI Powder Powder+HIP
Average C content [µg/g] 200 205 ± 67
Average N content [µg/g] 100 179 ± 10
Average O content [µg/g] 1000 1768 ± 136
O(eq.) [µg/g] 1350 2280 ± 207
After the HIP process, the impurity levels increased, especially for oxygen content.
However, the oxygen levels for the Powder+HIP samples are still below the common
values obtained for the investigated MIM samples (1900 – 2300 µg/g).

RESULTS
66
5.6.2. Tensile properties
The tensile properties of the Powder+HIP samples were obtained by using micro-tensile
specimens. In order to compare the properties with the MIM dog-bone shaped samples,
micro-tensile specimens from MIM35H samples were also investigated. Table 12
illustrates the results for Powder+HIP samples and MIM35H samples.
Table 12. Tensile properties of Powder+HIP and MIM35H samples
Tensile property Powder+HIP* MIM35H* MIM35H
Yield Stress [MPa] 772 ± 18 655 ± 48 720 ± 2
Maximum Stress [MPa] 832 ± 20 750 ± 14 824 ± 4
longation [%] 13.9 ± 4 8.2 ± 1.1 13.4 ± 0.7
*values obtained by using micro-tensile specimens.
The tensile behaviour was affected by the specimen geometry. The tensile property for
the MIM35H samples using the micro-tensile specimens exhibited poorer values and
larger scatter than the values obtained for the dog-bone specimens. Considering the
elongation values, even larger scatter was observed for the Powder+HIP samples
compared to the MIM35H samples. The tensile elongation scattering for the
Powder+HIP samples is significant and a more detailed analysis was required. Tensile
fracture surfaces of the Powder+HIP samples, that demonstrated different plastic
elongation, were investigated in order to describe such phenomenon. Fig. 67 shows two
tensile fracture surfaces of Powder+HIP samples: (a) is referring to 10 % of plastic
elongation and (b) to 17 % of plastic elongation.
A fine dimpled structure is observed for both fracture surfaces. However, a particle
surrounded by a flat region (white arrow in Fig. 67a indicated this defect) is observed
on the tensile fracture surface of the sample that exhibited only 10 % of plastic
elongation. Such a defect was not identified on the tensile fracture surface of the
samples that presented higher plastic elongation.
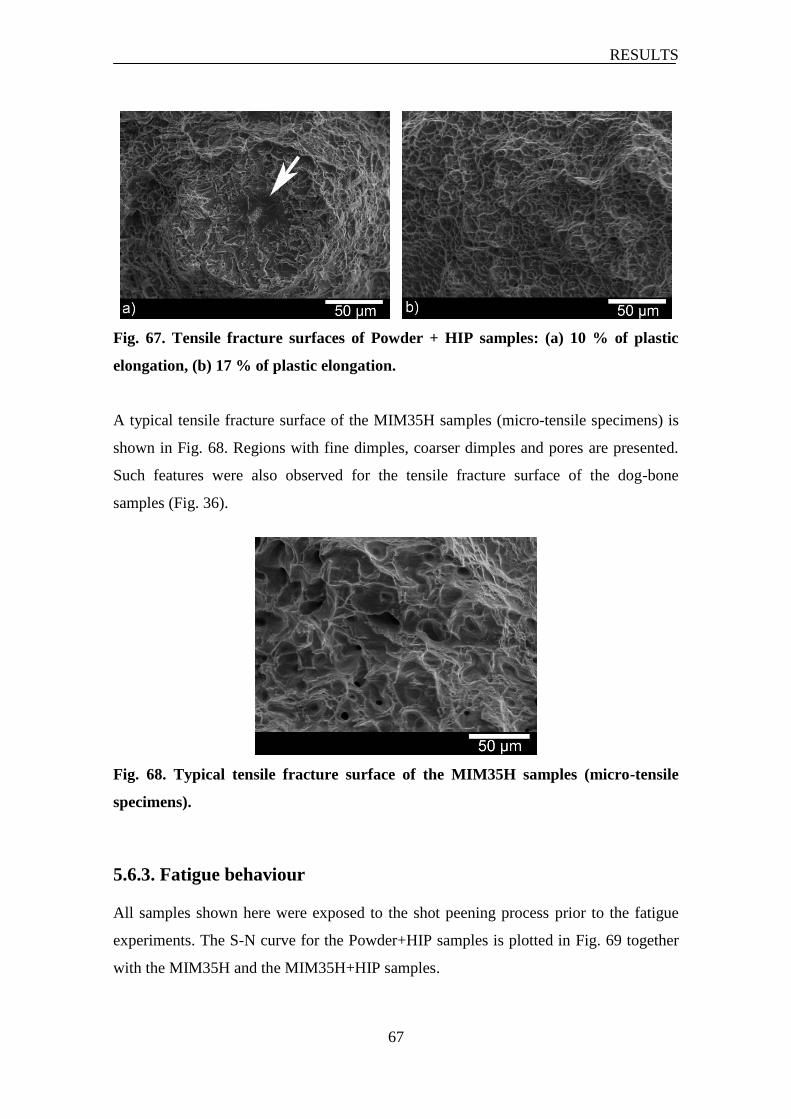
RESULTS
67
Fig. 67. Tensile fracture surfaces of Powder + HIP samples: (a) 10 % of plastic
elongation, (b) 17 % of plastic elongation.
A typical tensile fracture surface of the MIM35H samples (micro-tensile specimens) is
shown in Fig. 68. Regions with fine dimples, coarser dimples and pores are presented.
Such features were also observed for the tensile fracture surface of the dog-bone
samples (Fig. 36).
Fig. 68. Typical tensile fracture surface of the MIM35H samples (micro-tensile
specimens).
5.6.3. Fatigue behaviour
All samples shown here were exposed to the shot peening process prior to the fatigue
experiments. The S-N curve for the Powder+HIP samples is plotted in Fig. 69 together
with the MIM35H and the MIM35H+HIP samples.
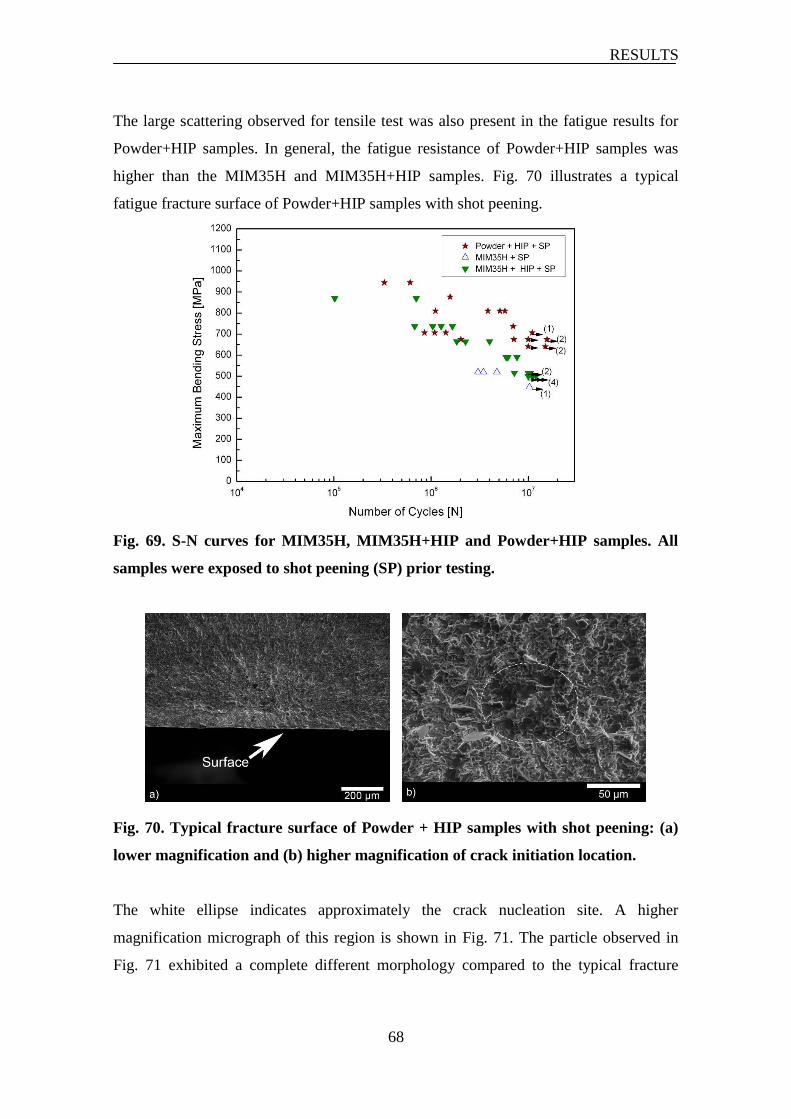
RESULTS
68
The large scattering observed for tensile test was also present in the fatigue results for
Powder+HIP samples. In general, the fatigue resistance of Powder+HIP samples was
higher than the MIM35H and MIM35H+HIP samples. Fig. 70 illustrates a typical
fatigue fracture surface of Powder+HIP samples with shot peening.
Fig. 69. S-N curves for MIM35H, MIM35H+HIP and Powder+HIP samples. All
samples were exposed to shot peening (SP) prior testing.
Fig. 70. Typical fracture surface of Powder + HIP samples with shot peening: (a)
lower magnification and (b) higher magnification of crack initiation location.
The white ellipse indicates approximately the crack nucleation site. A higher
magnification micrograph of this region is shown in Fig. 71. The particle observed in
Fig. 71 exhibited a complete different morphology compared to the typical fracture
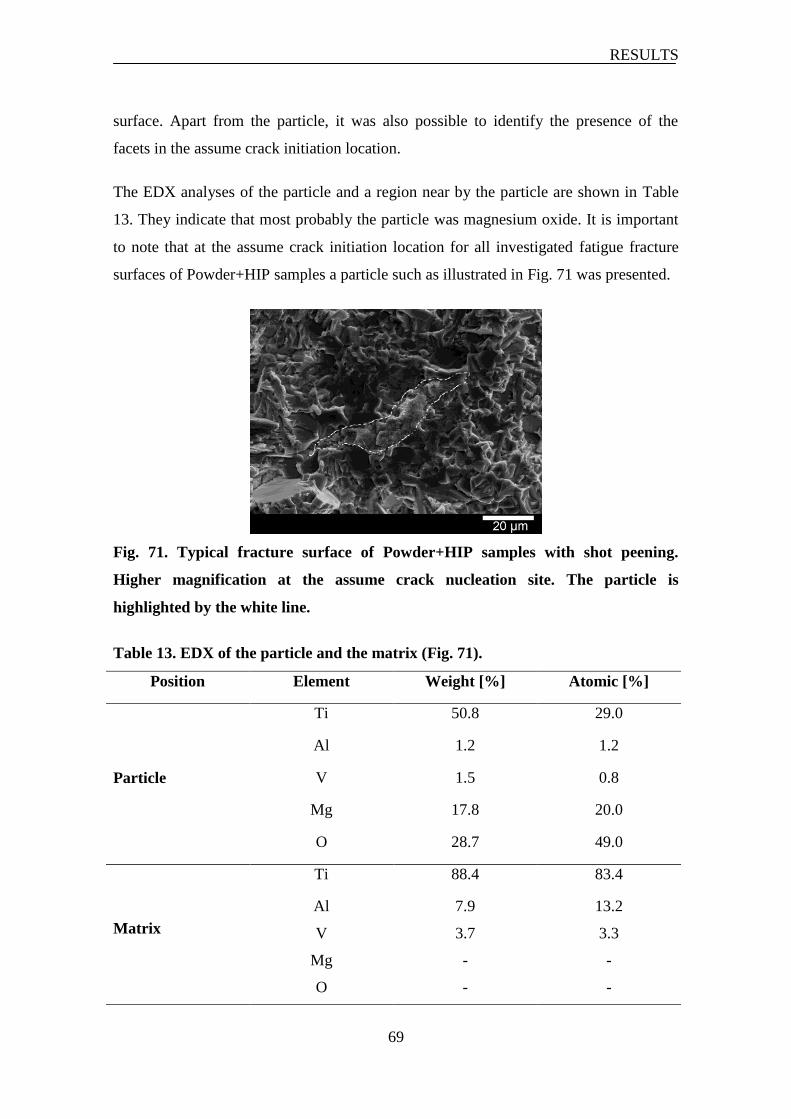
RESULTS
69
surface. Apart from the particle, it was also possible to identify the presence of the
facets in the assume crack initiation location.
The EDX analyses of the particle and a region near by the particle are shown in Table
13. They indicate that most probably the particle was magnesium oxide. It is important
to note that at the assume crack initiation location for all investigated fatigue fracture
surfaces of Powder+HIP samples a particle such as illustrated in Fig. 71 was presented.
Fig. 71. Typical fracture surface of Powder+HIP samples with shot peening.
Higher magnification at the assume crack nucleation site. The particle is
highlighted by the white line.
Table 13. EDX of the particle and the matrix (Fig. 71).
Position Element Weight [%] Atomic [%]
Particle
Ti 50.8 29.0
Al 1.2 1.2
V 1.5 0.8
Mg 17.8 20.0
O 28.7 49.0
Matrix
Ti 88.4 83.4
Al 7.9 13.2
V 3.7 3.3
Mg - -
O - -

RESULTS
70
5.7. Addition of boron on Ti-6Al-4V alloy
5.7.1. Boron content
The influence of small boron additions on the microstructure evolution during sintering
process of the Ti-6Al-4V alloy processed by MIM was investigated. The microstructure
of samples with additions of 0, 0.1 and 0.5 wt. % of boron on the Ti-6Al-4V alloy
sintered at 1250 °C are shown in Fig. 72, Fig. 73 and Fig. 74, respectively.
Fig. 72. Microstructure of Ti-6Al-4V alloy sintered at 1250 °C for two hours and
10 °C/min cooling rate.
As it can be seen in all figures, the addition of boron significantly modifies a number of
microstructural features. In terms of colony size the Ti-6Al-4V alloy samples with no
addition of boron showed values of approximately 100 µm. With the addition of 0.1
wt.% of boron, the colony size was reduced to approximately 80 µm.
The samples with 0.5 wt.% of boron addition exhibited a microstructure with no well
defined colony: in other words, the lamellar structure was suppressed. Because the
grain boundaries were not clearly detectable by common microscopy, the grain size was
quantified by EBSD measurements. The results are shown in section 5.7.3.
The white arrows in Fig. 73 and Fig. 74 indicate the TiBw particles (w = 1 or 2) formed
during the sintering process (in situ reaction). The increase of boron content apparently
promoted a refinement of the microstructure; however, at this maximum sintering
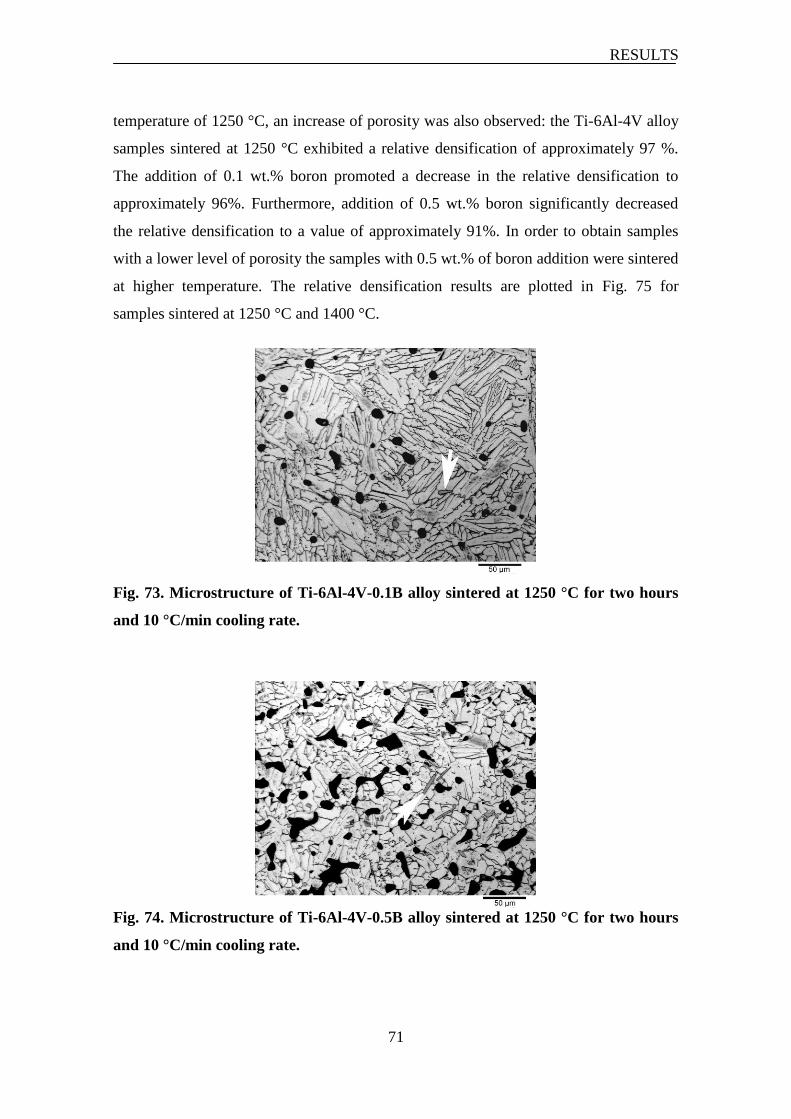
RESULTS
71
temperature of 1250 °C, an increase of porosity was also observed: the Ti-6Al-4V alloy
samples sintered at 1250 °C exhibited a relative densification of approximately 97 %.
The addition of 0.1 wt.% boron promoted a decrease in the relative densification to
approximately 96%. Furthermore, addition of 0.5 wt.% boron significantly decreased
the relative densification to a value of approximately 91%. In order to obtain samples
with a lower level of porosity the samples with 0.5 wt.% of boron addition were sintered
at higher temperature. The relative densification results are plotted in Fig. 75 for
samples sintered at 1250 °C and 1400 °C.
Fig. 73. Microstructure of Ti-6Al-4V-0.1B alloy sintered at 1250 °C for two hours
and 10 °C/min cooling rate.
Fig. 74. Microstructure of Ti-6Al-4V-0.5B alloy sintered at 1250 °C for two hours
and 10 °C/min cooling rate.
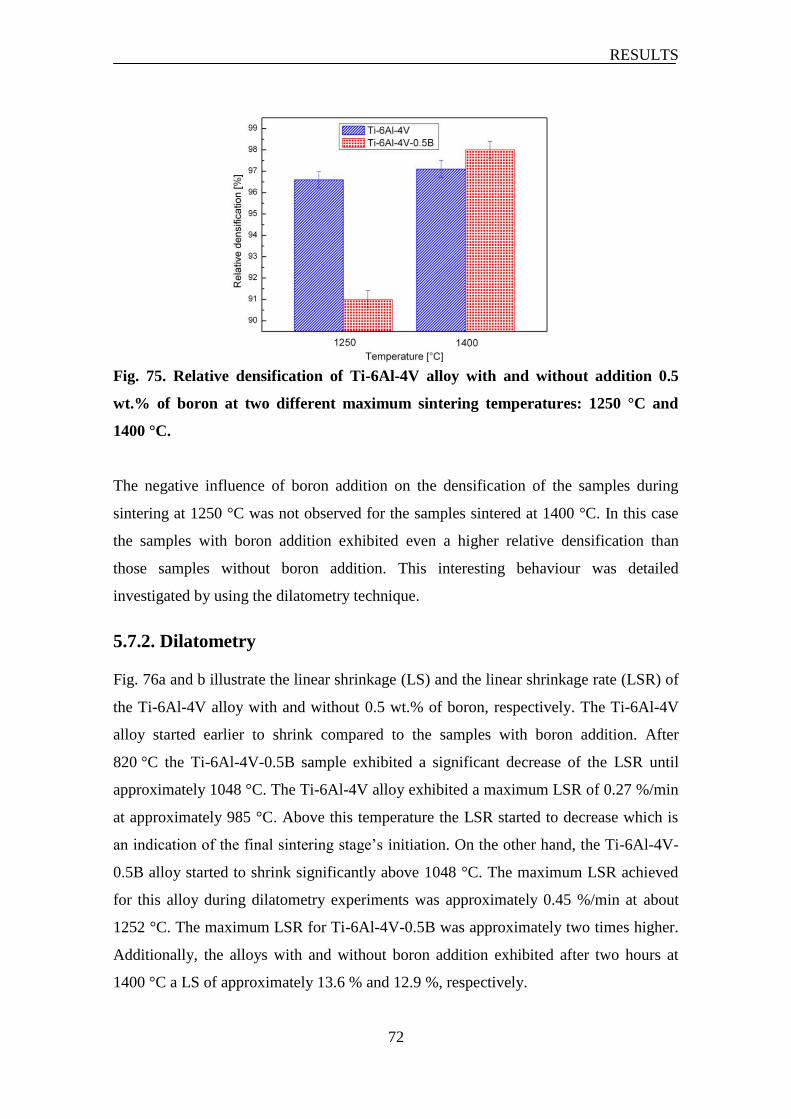
RESULTS
72
Fig. 75. Relative densification of Ti-6Al-4V alloy with and without addition 0.5
wt.% of boron at two different maximum sintering temperatures: 1250 °C and
1400 °C.
The negative influence of boron addition on the densification of the samples during
sintering at 1250 °C was not observed for the samples sintered at 1400 °C. In this case
the samples with boron addition exhibited even a higher relative densification than
those samples without boron addition. This interesting behaviour was detailed
investigated by using the dilatometry technique.
5.7.2. Dilatometry
Fig. 76a and b illustrate the linear shrinkage (LS) and the linear shrinkage rate (LSR) of
the Ti-6Al-4V alloy with and without 0.5 wt.% of boron, respectively. The Ti-6Al-4V
alloy started earlier to shrink compared to the samples with boron addition. After
820 °C the Ti-6Al-4V-0.5B sample exhibited a significant decrease of the LSR until
approximately 1048 °C. The Ti-6Al-4V alloy exhibited a maximum LSR of 0.27 %/min
at approximately 985 °C. Above this temperature the LSR started to decrease which is
an indication of the final sintering stage’s initiation. On the other hand, the Ti-6Al-4V-
0.5B alloy started to shrink significantly above 1048 °C. The maximum LSR achieved
for this alloy during dilatometry experiments was approximately 0.45 %/min at about
1252 °C. The maximum LSR for Ti-6Al-4V-0.5B was approximately two times higher.
Additionally, the alloys with and without boron addition exhibited after two hours at
1400 °C a LS of approximately 13.6 % and 12.9 %, respectively.
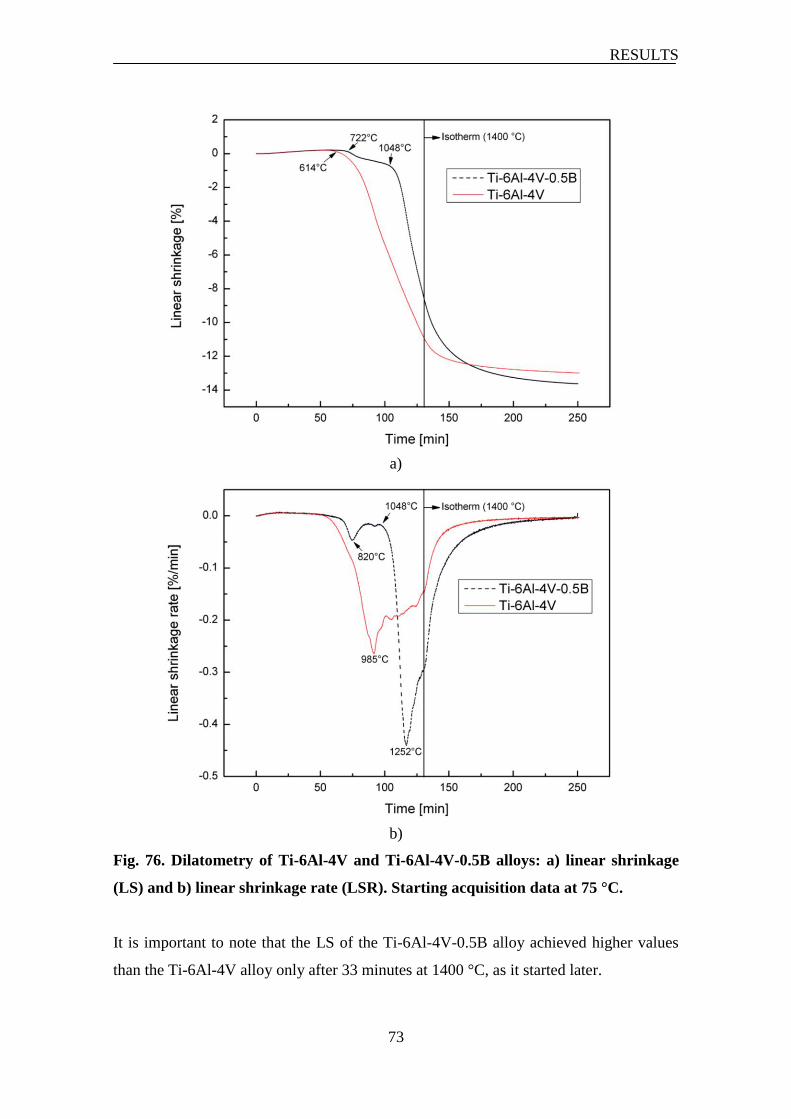
RESULTS
73
a)
b)
Fig. 76. Dilatometry of Ti-6Al-4V and Ti-6Al-4V-0.5B alloys: a) linear shrinkage
(LS) and b) linear shrinkage rate (LSR). Starting acquisition data at 75 °C.
It is important to note that the LS of the Ti-6Al-4V-0.5B alloy achieved higher values
than the Ti-6Al-4V alloy only after 33 minutes at 1400 °C, as it started later.
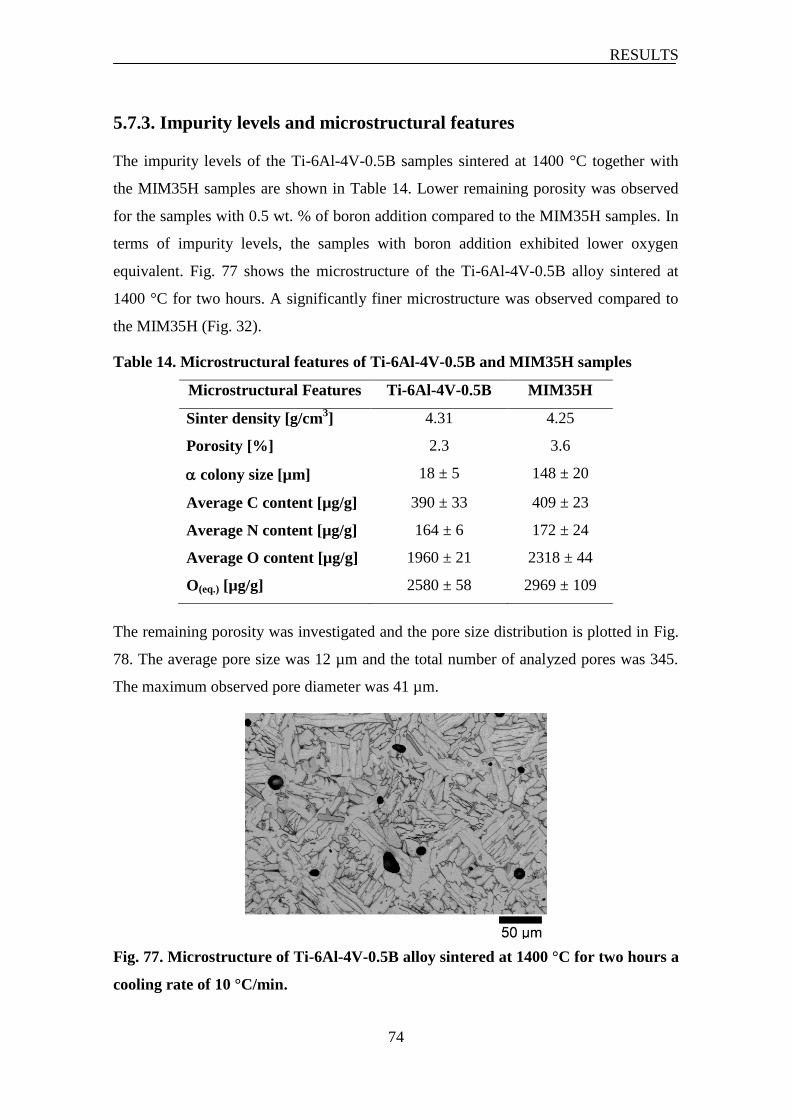
RESULTS
74
5.7.3. Impurity levels and microstructural features
The impurity levels of the Ti-6Al-4V-0.5B samples sintered at 1400 °C together with
the MIM35H samples are shown in Table 14. Lower remaining porosity was observed
for the samples with 0.5 wt. % of boron addition compared to the MIM35H samples. In
terms of impurity levels, the samples with boron addition exhibited lower oxygen
equivalent. Fig. 77 shows the microstructure of the Ti-6Al-4V-0.5B alloy sintered at
1400 °C for two hours. A significantly finer microstructure was observed compared to
the MIM35H (Fig. 32).
Table 14. Microstructural features of Ti-6Al-4V-0.5B and MIM35H samples
Microstructural Features Ti-6Al-4V-0.5B MIM35H
Sinter density [g/cm3] 4.31 4.25
Porosity [%] 2.3 3.6
colony size [µm] 18 ± 5 148 ± 20
Average C content [µg/g] 390 ± 33 409 ± 23
Average N content [µg/g] 164 ± 6 172 ± 24
Average O content [µg/g] 1960 ± 21 2318 ± 44
O(eq.) [µg/g] 2580 ± 58 2969 ± 109
The remaining porosity was investigated and the pore size distribution is plotted in Fig.
78. The average pore size was 12 µm and the total number of analyzed pores was 345.
The maximum observed pore diameter was 41 µm.
Fig. 77. Microstructure of Ti-6Al-4V-0.5B alloy sintered at 1400 °C for two hours a
cooling rate of 10 °C/min.
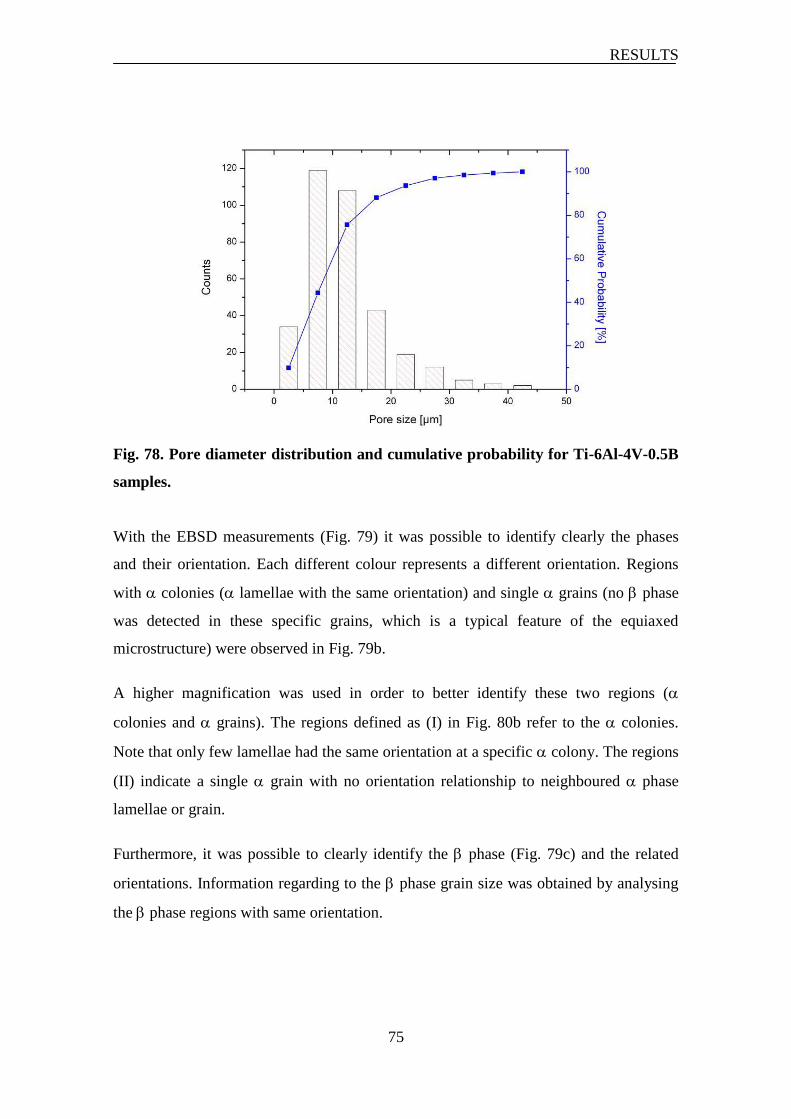
RESULTS
75
Fig. 78. Pore diameter distribution and cumulative probability for Ti-6Al-4V-0.5B
samples.
With the EBSD measurements (Fig. 79) it was possible to identify clearly the phases
and their orientation. Each different colour represents a different orientation. Regions
with colonies ( lamellae with the same orientation) and single grains (no phase
was detected in these specific grains, which is a typical feature of the equiaxed
microstructure) were observed in Fig. 79b.
A higher magnification was used in order to better identify these two regions (
colonies and grains). The regions defined as (I) in Fig. 80b refer to the colonies.
Note that only few lamellae had the same orientation at a specific colony. The regions
(II) indicate a single grain with no orientation relationship to neighboured phase
lamellae or grain.
Furthermore, it was possible to clearly identify the phase (Fig. 79c) and the related
orientations. Information regarding to the phase grain size was obtained by analysing
the phase regions with same orientation.
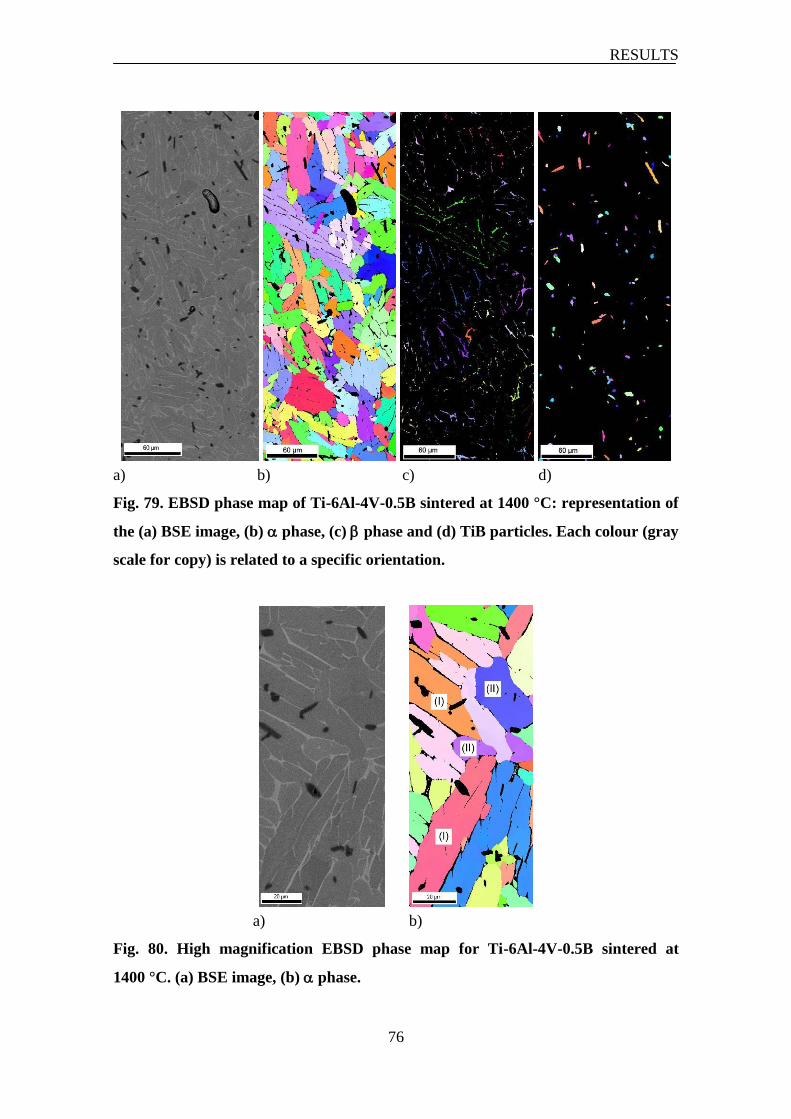
RESULTS
76
a) b) c) d)
Fig. 79. EBSD phase map of Ti-6Al-4V-0.5B sintered at 1400 °C: representation of
the (a) BSE image, (b) phase, (c) phase and (d) TiB particles. Each colour (gray
scale for copy) is related to a specific orientation.
a) b)
Fig. 80. High magnification EBSD phase map for Ti-6Al-4V-0.5B sintered at
1400 °C. (a) BSE image, (b) phase.
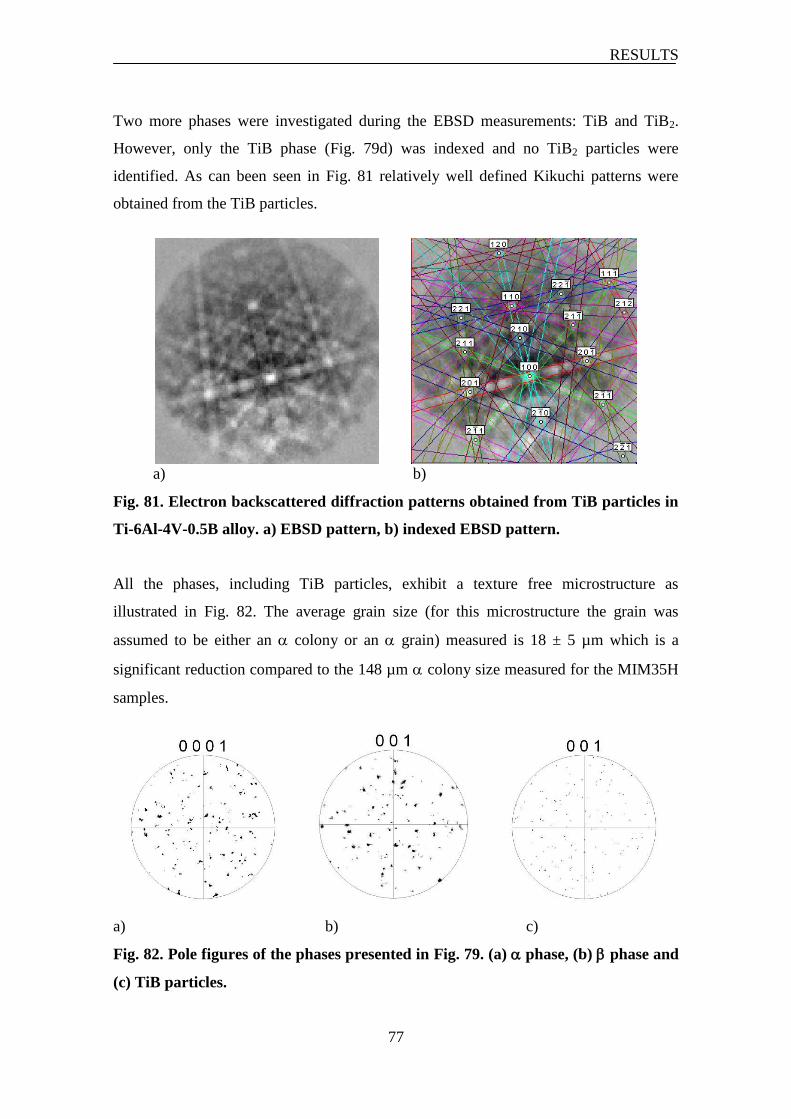
RESULTS
77
Two more phases were investigated during the EBSD measurements: TiB and TiB2.
However, only the TiB phase (Fig. 79d) was indexed and no TiB2 particles were
identified. As can been seen in Fig. 81 relatively well defined Kikuchi patterns were
obtained from the TiB particles.
a) b)
Fig. 81. Electron backscattered diffraction patterns obtained from TiB particles in
Ti-6Al-4V-0.5B alloy. a) EBSD pattern, b) indexed EBSD pattern.
All the phases, including TiB particles, exhibit a texture free microstructure as
illustrated in Fig. 82. The average grain size (for this microstructure the grain was
assumed to be either an colony or an grain) measured is 18 ± 5 µm which is a
significant reduction compared to the 148 µm colony size measured for the MIM35H
samples.
a) b) c)
Fig. 82. Pole figures of the phases presented in Fig. 79. (a) phase, (b) phase and
(c) TiB particles.
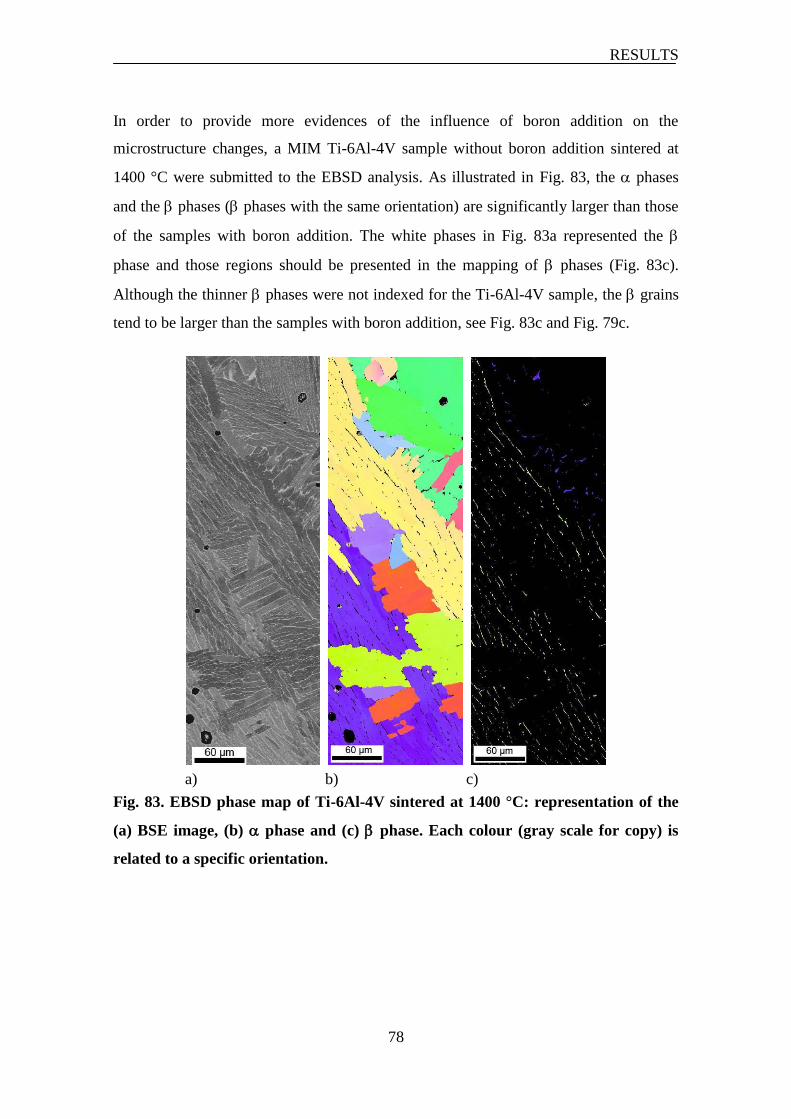
RESULTS
78
In order to provide more evidences of the influence of boron addition on the
microstructure changes, a MIM Ti-6Al-4V sample without boron addition sintered at
1400 °C were submitted to the EBSD analysis. As illustrated in Fig. 83, the phases
and the phases ( phases with the same orientation) are significantly larger than those
of the samples with boron addition. The white phases in Fig. 83a represented the
phase and those regions should be presented in the mapping of phases (Fig. 83c).
Although the thinner phases were not indexed for the Ti-6Al-4V sample, the grains
tend to be larger than the samples with boron addition, see Fig. 83c and Fig. 79c.
a) b) c)
Fig. 83. EBSD phase map of Ti-6Al-4V sintered at 1400 °C: representation of the
(a) BSE image, (b) phase and (c) phase. Each colour (gray scale for copy) is
related to a specific orientation.
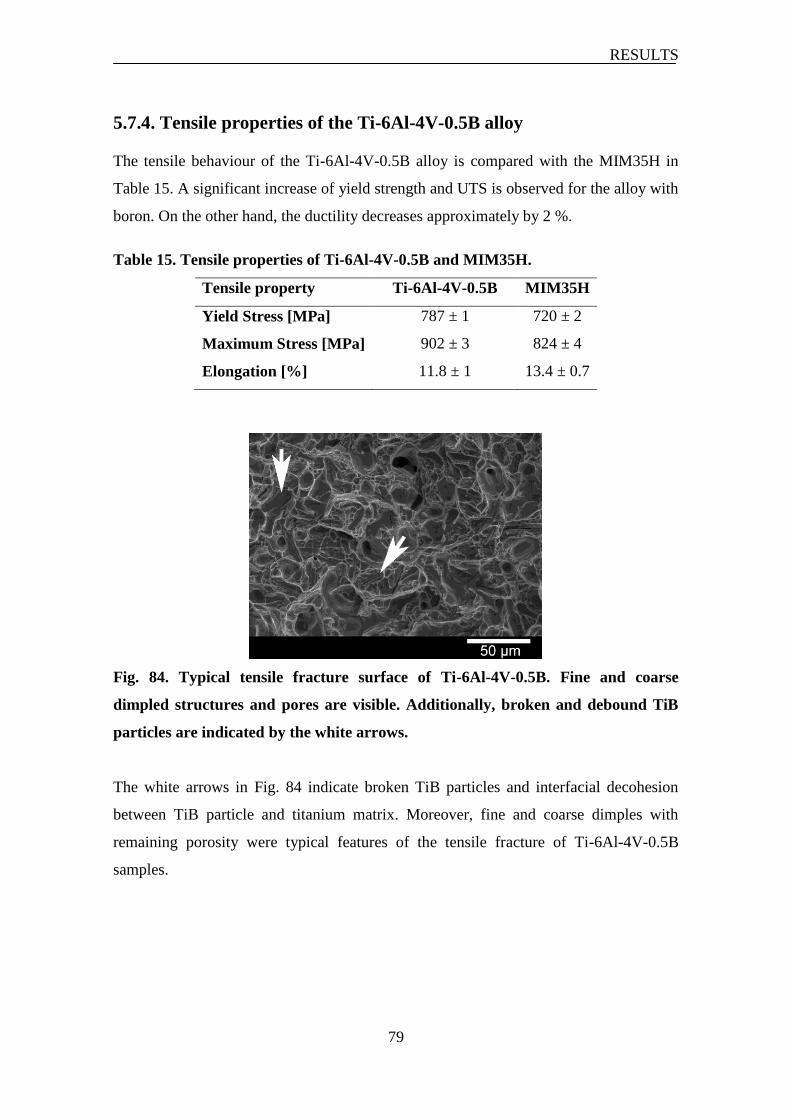
RESULTS
79
5.7.4. Tensile properties of the Ti-6Al-4V-0.5B alloy
The tensile behaviour of the Ti-6Al-4V-0.5B alloy is compared with the MIM35H in
Table 15. A significant increase of yield strength and UTS is observed for the alloy with
boron. On the other hand, the ductility decreases approximately by 2 %.
Table 15. Tensile properties of Ti-6Al-4V-0.5B and MIM35H.
Tensile property Ti-6Al-4V-0.5B MIM35H
Yield Stress [MPa] 787 ± 1 720 ± 2
Maximum Stress [MPa] 902 ± 3 824 ± 4
Elongation [%] 11.8 ± 1 13.4 ± 0.7
Fig. 84. Typical tensile fracture surface of Ti-6Al-4V-0.5B. Fine and coarse
dimpled structures and pores are visible. Additionally, broken and debound TiB
particles are indicated by the white arrows.
The white arrows in Fig. 84 indicate broken TiB particles and interfacial decohesion
between TiB particle and titanium matrix. Moreover, fine and coarse dimples with
remaining porosity were typical features of the tensile fracture of Ti-6Al-4V-0.5B
samples.

RESULTS
80
5.7.5. Fatigue behaviour
The four-point bending fatigue life response of the Ti-6Al-4V-0.5B alloy with shot
peening is shown in Fig. 85. This figure also presents the S-N curve of MIM35H with
shot peening and the MIM35H+HIP with shot peening.
The addition of boron promoted a significant increase of the fatigue resistance. The
endurance limit was approximately 640 MPa. Even the MIM35H+HIP samples without
pores exhibited a substantially lower endurance limit.
Fig. 85. S-N curves for MIM35H, MIM35H+HIP and Ti-6Al-4V-0.5B alloy. All
samples were exposed to shot peening (SP) prior to testing.
As for the previous experiments the fracture surfaces of broken samples were
investigated. Fig. 86 shows the overview of the fracture surface, indicating that the
crack initiated in some place near the lower right corner.
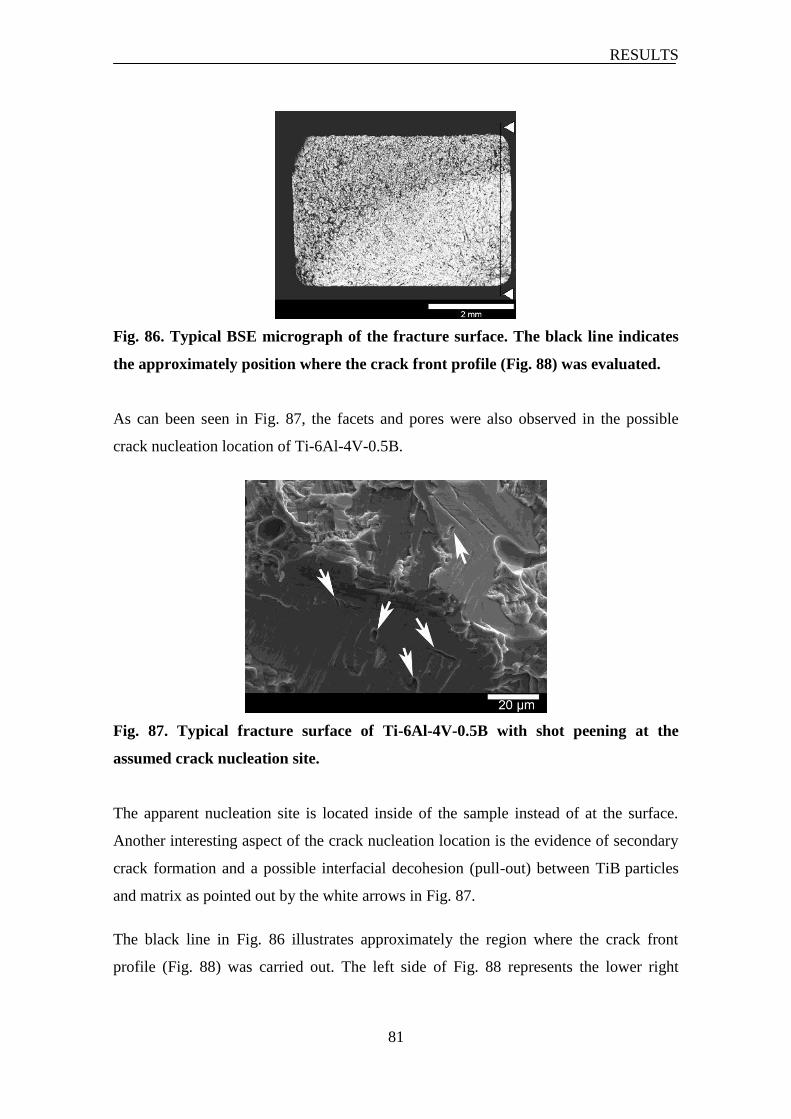
RESULTS
81
Fig. 86. Typical BSE micrograph of the fracture surface. The black line indicates
the approximately position where the crack front profile (Fig. 88) was evaluated.
As can been seen in Fig. 87, the facets and pores were also observed in the possible
crack nucleation location of Ti-6Al-4V-0.5B.
Fig. 87. Typical fracture surface of Ti-6Al-4V-0.5B with shot peening at the
assumed crack nucleation site.
The apparent nucleation site is located inside of the sample instead of at the surface.
Another interesting aspect of the crack nucleation location is the evidence of secondary
crack formation and a possible interfacial decohesion (pull-out) between TiB particles
and matrix as pointed out by the white arrows in Fig. 87.
The black line in Fig. 86 illustrates approximately the region where the crack front
profile (Fig. 88) was carried out. The left side of Fig. 88 represents the lower right
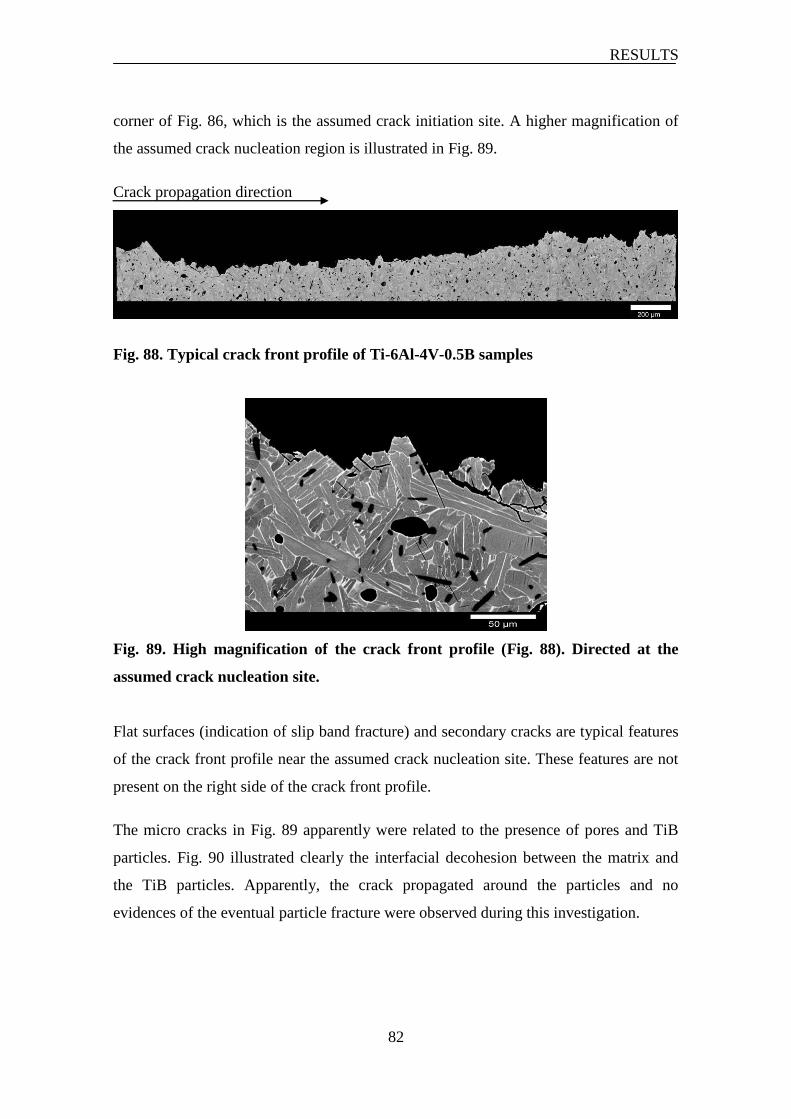
RESULTS
82
corner of Fig. 86, which is the assumed crack initiation site. A higher magnification of
the assumed crack nucleation region is illustrated in Fig. 89.
Crack propagation direction
Fig. 88. Typical crack front profile of Ti-6Al-4V-0.5B samples
Fig. 89. High magnification of the crack front profile (Fig. 88). Directed at the
assumed crack nucleation site.
Flat surfaces (indication of slip band fracture) and secondary cracks are typical features
of the crack front profile near the assumed crack nucleation site. These features are not
present on the right side of the crack front profile.
The micro cracks in Fig. 89 apparently were related to the presence of pores and TiB
particles. Fig. 90 illustrated clearly the interfacial decohesion between the matrix and
the TiB particles. Apparently, the crack propagated around the particles and no
evidences of the eventual particle fracture were observed during this investigation.
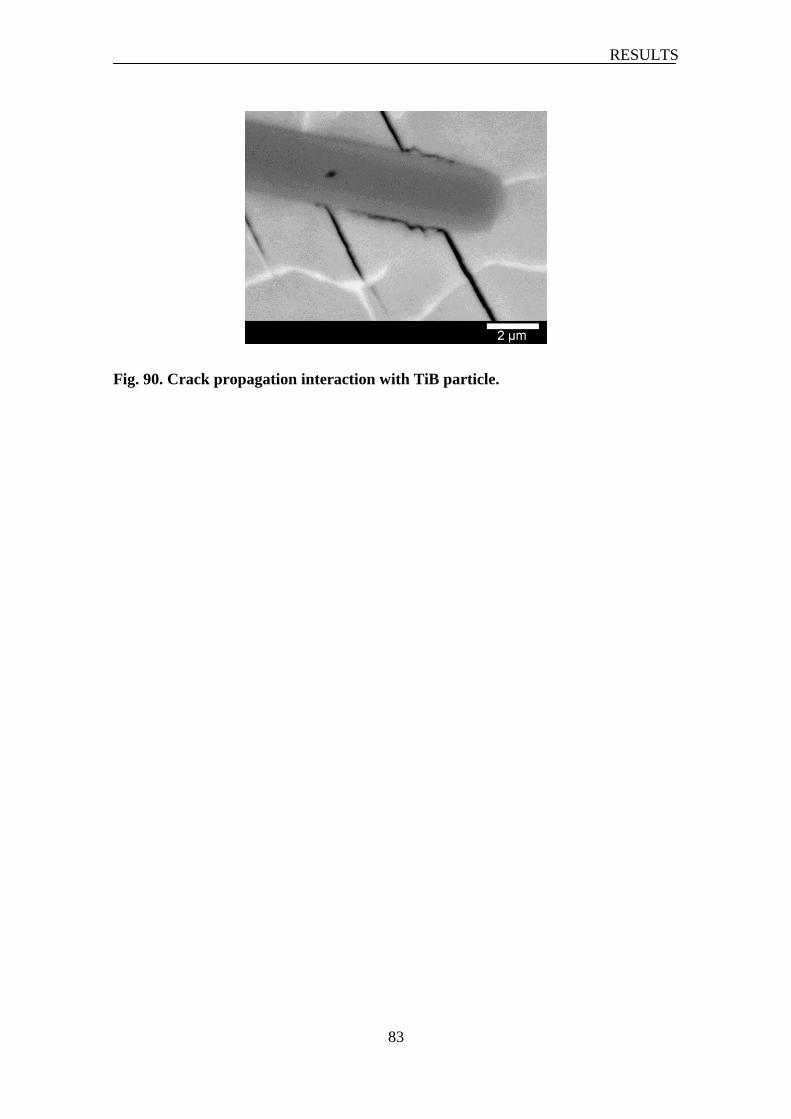
RESULTS
83
Fig. 90. Crack propagation interaction with TiB particle.
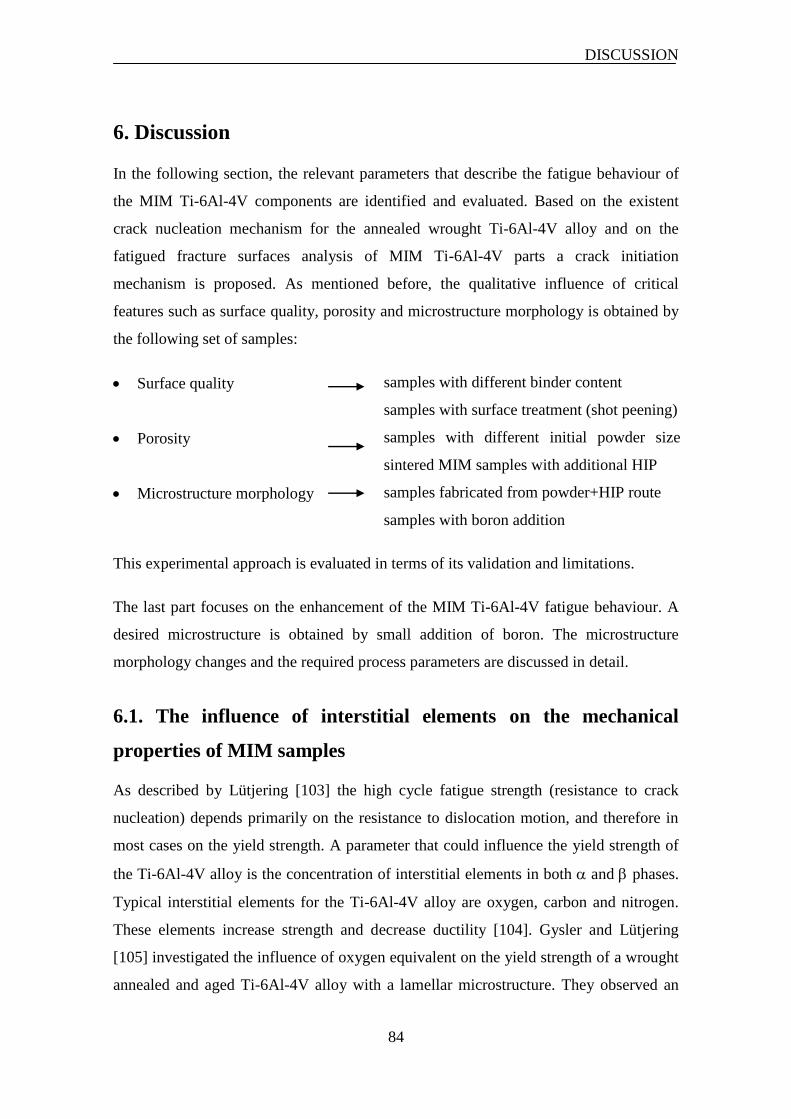
DISCUSSION
84
6. Discussion
In the following section, the relevant parameters that describe the fatigue behaviour of
the MIM Ti-6Al-4V components are identified and evaluated. Based on the existent
crack nucleation mechanism for the annealed wrought Ti-6Al-4V alloy and on the
fatigued fracture surfaces analysis of MIM Ti-6Al-4V parts a crack initiation
mechanism is proposed. As mentioned before, the qualitative influence of critical
features such as surface quality, porosity and microstructure morphology is obtained by
the following set of samples:
Surface quality samples with different binder content
samples with surface treatment (shot peening)
Porosity samples with different initial powder size
sintered MIM samples with additional HIP
Microstructure morphology samples fabricated from powder+HIP route
samples with boron addition
This experimental approach is evaluated in terms of its validation and limitations.
The last part focuses on the enhancement of the MIM Ti-6Al-4V fatigue behaviour. A
desired microstructure is obtained by small addition of boron. The microstructure
morphology changes and the required process parameters are discussed in detail.
6.1. The influence of interstitial elements on the mechanical
properties of MIM samples
As described by Lütjering [103] the high cycle fatigue strength (resistance to crack
nucleation) depends primarily on the resistance to dislocation motion, and therefore in
most cases on the yield strength. A parameter that could influence the yield strength of
the Ti-6Al-4V alloy is the concentration of interstitial elements in both and phases.
Typical interstitial elements for the Ti-6Al-4V alloy are oxygen, carbon and nitrogen.
These elements increase strength and decrease ductility [104]. Gysler and Lütjering
[105] investigated the influence of oxygen equivalent on the yield strength of a wrought
annealed and aged Ti-6Al-4V alloy with a lamellar microstructure. They observed an
DISCUSSION
85
increase in the yield strength from 800 MPa to 940 MPa by changing the oxygen
equivalent from 990 µg/g to 2390 µg/g, respectively. In a first approach, it is possible to
assume that this relationship might be proportional, as suggested by Meester [16].
Therefore, for an increase of 100 µg/g in the oxygen equivalent an enhancement in the
yield strength of around 10 MPa is expected.
However, in the case of the MIM samples, the situation seems to be different. For the
MIM31L and MIM31L* samples a variation of approximately 250 µg/g did not
promote any increase in the yield strength (see Table 2 and Table 3). This difference in
the amount of interstitial elements between the MIM31L and MIM31L* samples is
related to the process conditions. Although same process parameters are used to
fabricate a specific set of samples, the samples processed at different sintering runs
usually exhibited a variation in the amount of interstitial elements. Previous work
performed at GKSS with the same process parameters applied for the fabrication of the
MIM31L samples reported an oxygen equivalent value of 2069 µg/g and a respective
yield strength of 698 MPa. This result suggested that even a variation of approximately
800 µg/g does not significantly affect the yield strength of the MIM Ti-6Al-4V alloy.
Thus it is possible to propose that the observed variation of oxygen equivalent between
the MIM samples promoted a minor influence on the yield strength and consequently on
the fatigue behaviour. Most probably two factors contributed to the observed difference
between MIM samples and the results reported by Gysler and Lütjering [105]: in the
case of MIM samples the existence of pores and for the Gysler and Lütjering results the
effect of annealed and aged microstructure condition.
As a result, predominant parameters that explain the mechanical properties of the
studied materials are most likely the surface quality, the existence of residual
compressive stresses, porosity and microstructure morphology rather than an interstitial
alloying elements effect.
6.2. Ti-6Al-4V alloy processed by MIM
In this section the influence of the MIM process on the microstructural features and
mechanical properties are discussed. Comparison between the MIM process results and
DISCUSSION
86
standard literature values for wrought annealed Ti-6Al-4V alloy with a lamellar
microstructure is carried out.
6.2.1. Tensile properties
As illustrated in Table 3 lower tensile strength was observed for the MIM31L samples
compared to wrought Ti-6Al-4V ELI (grade 23), here referred to as standard material.
This behaviour is expected. Previous studies [7, 61, 106] reported similar values for
tensile strength of Ti-6Al-4V components fabricated by MIM and obviously, this
degradation of tensile property was related to the presence of the pores. Under tensile
test, porosity reduces the effective load bearing cross-section area and acts as a stress
concentration site for strain localization and damage, decreasing both strength and
ductility [107]. Other features such as grain size and impurity levels were assumed to be
of minor relevance compare to the porosity effect. As a matter of fact, the amount,
shape and distribution of the pores are very important parameters in order to describe
the mechanical properties of sintered materials [108]. For the MIM31L samples the
volume percentage of remaining porosity was approximately 3.5%, meaning the
porosity being most probably closed. For porous materials it is commonly accepted that
the limit between open and closed porosity is around 5 vol.% as reported by several
authors [107-111]. The porosity morphology exhibited in Fig. 22 for MIM31L samples
contributes to the assumption of closed porosity, because another typical characteristic
of a closed porosity is the fact that the pores are usually isolated and rounded [111].
It is expected that a closed porosity will not promote a severe degradation of the
ductility [110] and indeed the elongation of MIM31L samples (Table 3) was greater
than the minimal value tolerated for this alloy (10%). Additionally, the dimpled tensile
fracture surface structure observed in Fig. 24 indicated that predominantly ductile
fracture occurred.
6.2.2. Fatigue behaviour
A reduction of approximately 9 % is observed for the yield strength of the MIM31L
samples compared to the wrought Ti-6Al-4V ELI (grade 23) alloy. A proportional
reduction is expected for the fatigue strength; however, the results indicated that a
degradation of approximately 39 % occurred.
DISCUSSION
87
The significant lower endurance limit of 350 MPa compared to 575 MPa of the standard
material (Fig. 25) can be explained in terms of surface quality and crack initiation
mechanisms. It is well known that surface quality can affect the fatigue behaviour of
engineering materials dramatically [112]. As illustrated in Fig. 26 the surface of
MIM31L samples exhibited notches. The presence of these notches can be related to
injection and debinding steps of MIM processing. During injection, the sample surface
is exposed to higher shear stress compared to the interior regions of the sample due to
turbulence effects promoted by fluid (hot feedstock) and mould wall interaction. Such
shear stress could promote local separation of binder/powder mixture. This separation
leads to regions where only binder is present with no powder particles. Consequently,
the notches are formed during thermal debinding and sintering in these specific surface
regions due to missing particle powder contact. Another possibility is the fact that the
powder particles, on specific surface sample regions after injection, could be surrounded
by only one binder component of the binder system, e.g. paraffin. Therefore, during
chemical debinding these particles will be removed together with the paraffin which
leads to a local empty space.
Another result that supports the assumption that the notches are created during the
injection and debinding processes is the fact that the maximum notch size observed on
the fracture surface of MIM31L samples was around 100 µm, which was much larger
than the maximum analysed pore size (approximately 33 µm, see Fig. 23).
These notches are, from the fracture mechanical point of view, cracks located directly
on the samples surface. Consequently, the high cycle fatigue behaviour will be affected
by the presence of such notches. Evidence of the presence of these notches on the
assumed crack nucleation site of the MIM31L samples fracture surfaces is depicted in
Fig. 28 and Fig. 30.
Crack initiation in a wrought Ti-6Al-4V alloy is invariably associated with the
formation of facets [89]. The formation of such facets is related to the fact that the weak
grains, favourably orientated for slip, generate a dislocation pile-up at the boundary with
the neighbouring strong grain. The pile-up leads to the required combination of shear
and tensile stresses on the unfavourably plane which induces facet formation. This
mechanism was proposed for the first time by Stroh [88] describing the fatigue
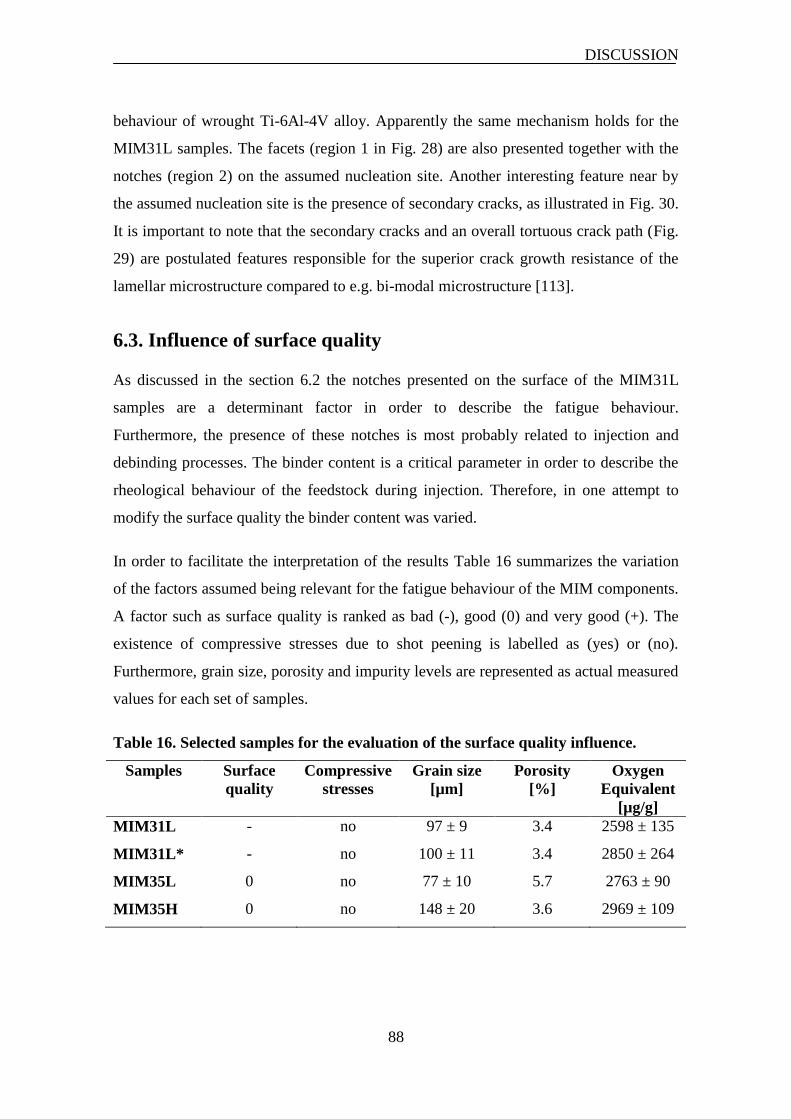
DISCUSSION
88
behaviour of wrought Ti-6Al-4V alloy. Apparently the same mechanism holds for the
MIM31L samples. The facets (region 1 in Fig. 28) are also presented together with the
notches (region 2) on the assumed nucleation site. Another interesting feature near by
the assumed nucleation site is the presence of secondary cracks, as illustrated in Fig. 30.
It is important to note that the secondary cracks and an overall tortuous crack path (Fig.
29) are postulated features responsible for the superior crack growth resistance of the
lamellar microstructure compared to e.g. bi-modal microstructure [113].
6.3. Influence of surface quality
As discussed in the section 6.2 the notches presented on the surface of the MIM31L
samples are a determinant factor in order to describe the fatigue behaviour.
Furthermore, the presence of these notches is most probably related to injection and
debinding processes. The binder content is a critical parameter in order to describe the
rheological behaviour of the feedstock during injection. Therefore, in one attempt to
modify the surface quality the binder content was varied.
In order to facilitate the interpretation of the results Table 16 summarizes the variation
of the factors assumed being relevant for the fatigue behaviour of the MIM components.
A factor such as surface quality is ranked as bad (-), good (0) and very good (+). The
existence of compressive stresses due to shot peening is labelled as (yes) or (no).
Furthermore, grain size, porosity and impurity levels are represented as actual measured
values for each set of samples.
Table 16. Selected samples for the evaluation of the surface quality influence.
Samples Surface
quality
Compressive
stresses
Grain size
[µm]
Porosity
[%]
Oxygen
Equivalent
[µg/g]
MIM31L - no 97 ± 9 3.4 2598 ± 135
MIM31L* - no 100 ± 11 3.4 2850 ± 264
MIM35L 0 no 77 ± 10 5.7 2763 ± 90
MIM35H 0 no 148 ± 20 3.6 2969 ± 109
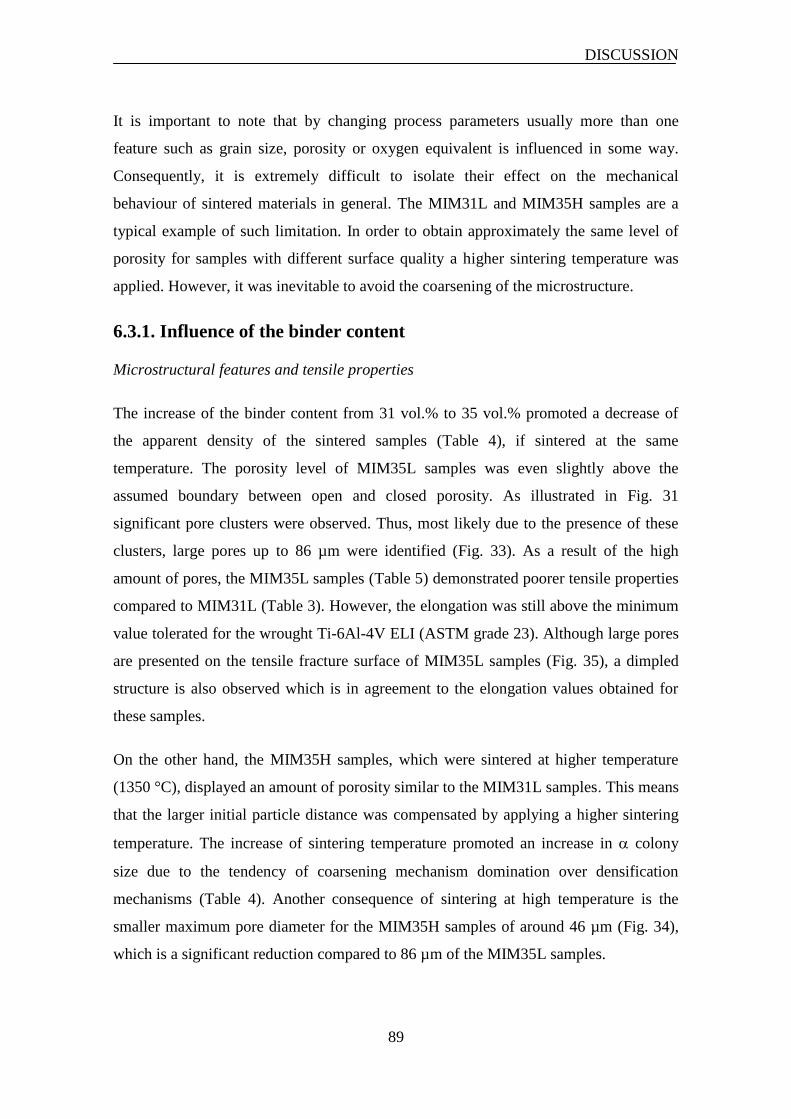
DISCUSSION
89
It is important to note that by changing process parameters usually more than one
feature such as grain size, porosity or oxygen equivalent is influenced in some way.
Consequently, it is extremely difficult to isolate their effect on the mechanical
behaviour of sintered materials in general. The MIM31L and MIM35H samples are a
typical example of such limitation. In order to obtain approximately the same level of
porosity for samples with different surface quality a higher sintering temperature was
applied. However, it was inevitable to avoid the coarsening of the microstructure.
6.3.1. Influence of the binder content
Microstructural features and tensile properties
The increase of the binder content from 31 vol.% to 35 vol.% promoted a decrease of
the apparent density of the sintered samples (Table 4), if sintered at the same
temperature. The porosity level of MIM35L samples was even slightly above the
assumed boundary between open and closed porosity. As illustrated in Fig. 31
significant pore clusters were observed. Thus, most likely due to the presence of these
clusters, large pores up to 86 µm were identified (Fig. 33). As a result of the high
amount of pores, the MIM35L samples (Table 5) demonstrated poorer tensile properties
compared to MIM31L (Table 3). However, the elongation was still above the minimum
value tolerated for the wrought Ti-6Al-4V ELI (ASTM grade 23). Although large pores
are presented on the tensile fracture surface of MIM35L samples (Fig. 35), a dimpled
structure is also observed which is in agreement to the elongation values obtained for
these samples.
On the other hand, the MIM35H samples, which were sintered at higher temperature
(1350 °C), displayed an amount of porosity similar to the MIM31L samples. This means
that the larger initial particle distance was compensated by applying a higher sintering
temperature. The increase of sintering temperature promoted an increase in colony
size due to the tendency of coarsening mechanism domination over densification
mechanisms (Table 4). Another consequence of sintering at high temperature is the
smaller maximum pore diameter for the MIM35H samples of around 46 µm (Fig. 34),
which is a significant reduction compared to 86 µm of the MIM35L samples.
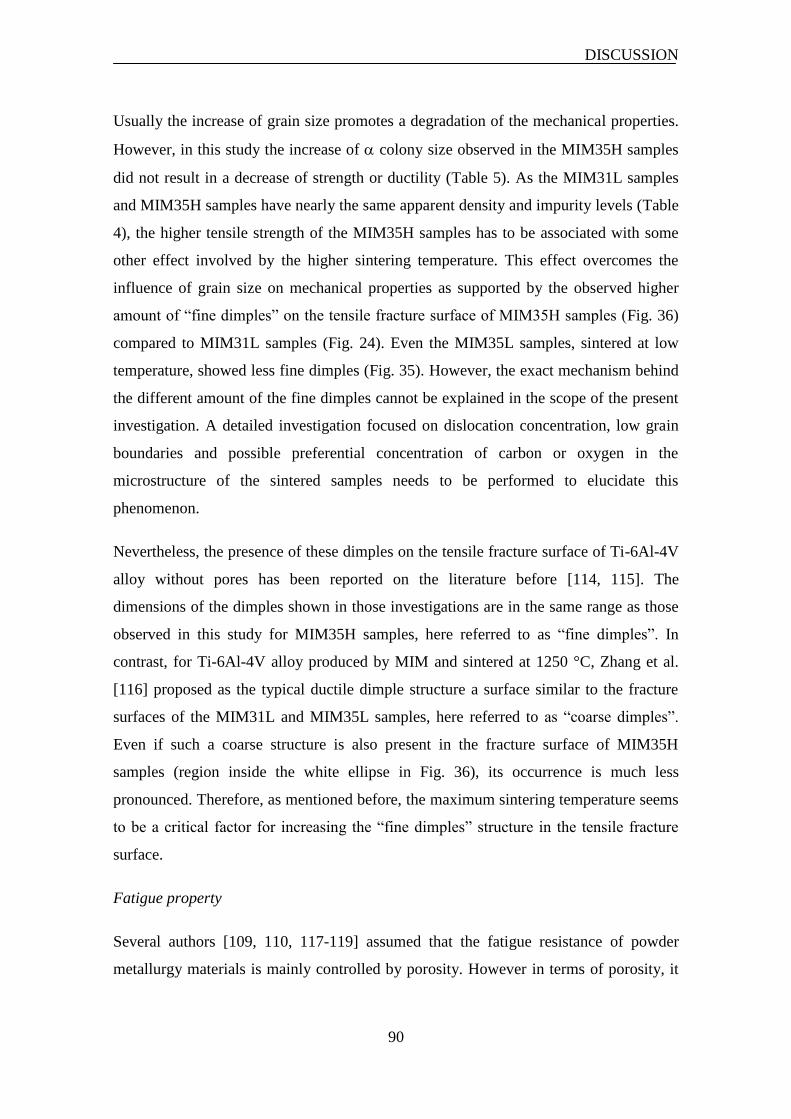
DISCUSSION
90
Usually the increase of grain size promotes a degradation of the mechanical properties.
However, in this study the increase of colony size observed in the MIM35H samples
did not result in a decrease of strength or ductility (Table 5). As the MIM31L samples
and MIM35H samples have nearly the same apparent density and impurity levels (Table
4), the higher tensile strength of the MIM35H samples has to be associated with some
other effect involved by the higher sintering temperature. This effect overcomes the
influence of grain size on mechanical properties as supported by the observed higher
amount of “fine dimples” on the tensile fracture surface of MIM35H samples (Fig. 36)
compared to MIM31L samples (Fig. 24). Even the MIM35L samples, sintered at low
temperature, showed less fine dimples (Fig. 35). However, the exact mechanism behind
the different amount of the fine dimples cannot be explained in the scope of the present
investigation. A detailed investigation focused on dislocation concentration, low grain
boundaries and possible preferential concentration of carbon or oxygen in the
microstructure of the sintered samples needs to be performed to elucidate this
phenomenon.
Nevertheless, the presence of these dimples on the tensile fracture surface of Ti-6Al-4V
alloy without pores has been reported on the literature before [114, 115]. The
dimensions of the dimples shown in those investigations are in the same range as those
observed in this study for MIM35H samples, here referred to as “fine dimples”. In
contrast, for Ti-6Al-4V alloy produced by MIM and sintered at 1250 °C, Zhang et al.
[116] proposed as the typical ductile dimple structure a surface similar to the fracture
surfaces of the MIM31L and MIM35L samples, here referred to as “coarse dimples”.
Even if such a coarse structure is also present in the fracture surface of MIM35H
samples (region inside the white ellipse in Fig. 36), its occurrence is much less
pronounced. Therefore, as mentioned before, the maximum sintering temperature seems
to be a critical factor for increasing the “fine dimples” structure in the tensile fracture
surface.
Fatigue property
Several authors [109, 110, 117-119] assumed that the fatigue resistance of powder
metallurgy materials is mainly controlled by porosity. However in terms of porosity, it
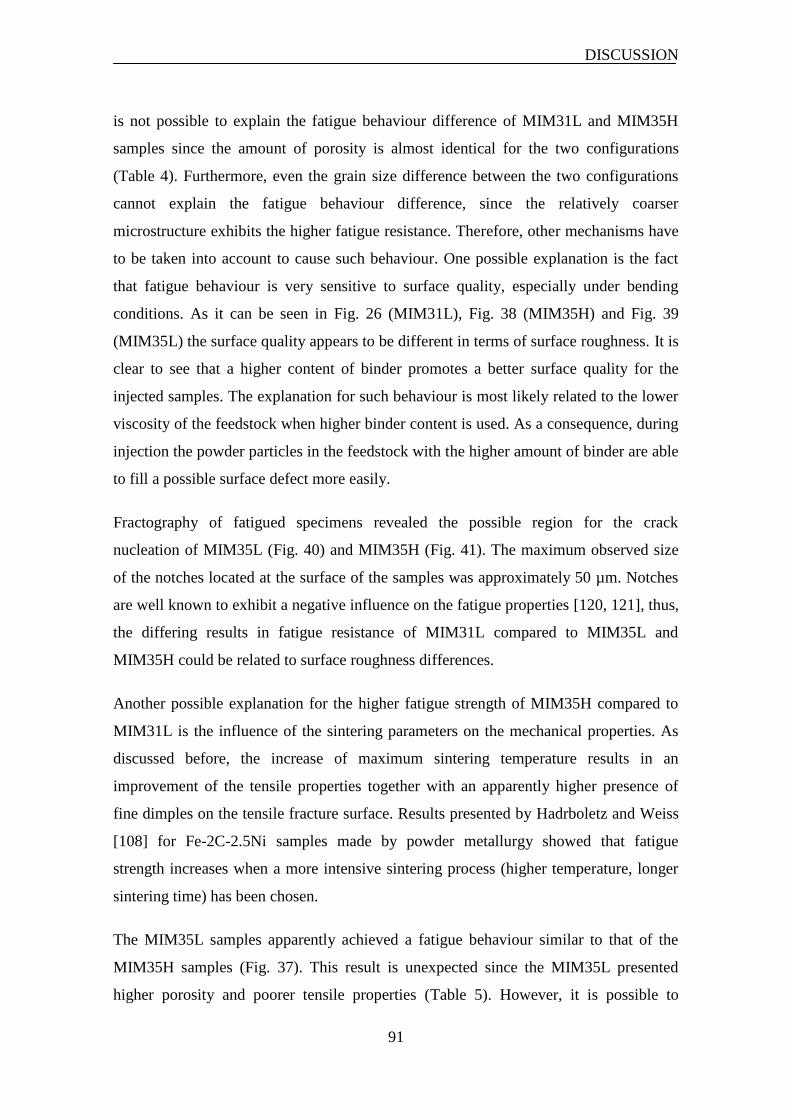
DISCUSSION
91
is not possible to explain the fatigue behaviour difference of MIM31L and MIM35H
samples since the amount of porosity is almost identical for the two configurations
(Table 4). Furthermore, even the grain size difference between the two configurations
cannot explain the fatigue behaviour difference, since the relatively coarser
microstructure exhibits the higher fatigue resistance. Therefore, other mechanisms have
to be taken into account to cause such behaviour. One possible explanation is the fact
that fatigue behaviour is very sensitive to surface quality, especially under bending
conditions. As it can be seen in Fig. 26 (MIM31L), Fig. 38 (MIM35H) and Fig. 39
(MIM35L) the surface quality appears to be different in terms of surface roughness. It is
clear to see that a higher content of binder promotes a better surface quality for the
injected samples. The explanation for such behaviour is most likely related to the lower
viscosity of the feedstock when higher binder content is used. As a consequence, during
injection the powder particles in the feedstock with the higher amount of binder are able
to fill a possible surface defect more easily.
Fractography of fatigued specimens revealed the possible region for the crack
nucleation of MIM35L (Fig. 40) and MIM35H (Fig. 41). The maximum observed size
of the notches located at the surface of the samples was approximately 50 µm. Notches
are well known to exhibit a negative influence on the fatigue properties [120, 121], thus,
the differing results in fatigue resistance of MIM31L compared to MIM35L and
MIM35H could be related to surface roughness differences.
Another possible explanation for the higher fatigue strength of MIM35H compared to
MIM31L is the influence of the sintering parameters on the mechanical properties. As
discussed before, the increase of maximum sintering temperature results in an
improvement of the tensile properties together with an apparently higher presence of
fine dimples on the tensile fracture surface. Results presented by Hadrboletz and Weiss
[108] for Fe-2C-2.5Ni samples made by powder metallurgy showed that fatigue
strength increases when a more intensive sintering process (higher temperature, longer
sintering time) has been chosen.
The MIM35L samples apparently achieved a fatigue behaviour similar to that of the
MIM35H samples (Fig. 37). This result is unexpected since the MIM35L presented
higher porosity and poorer tensile properties (Table 5). However, it is possible to
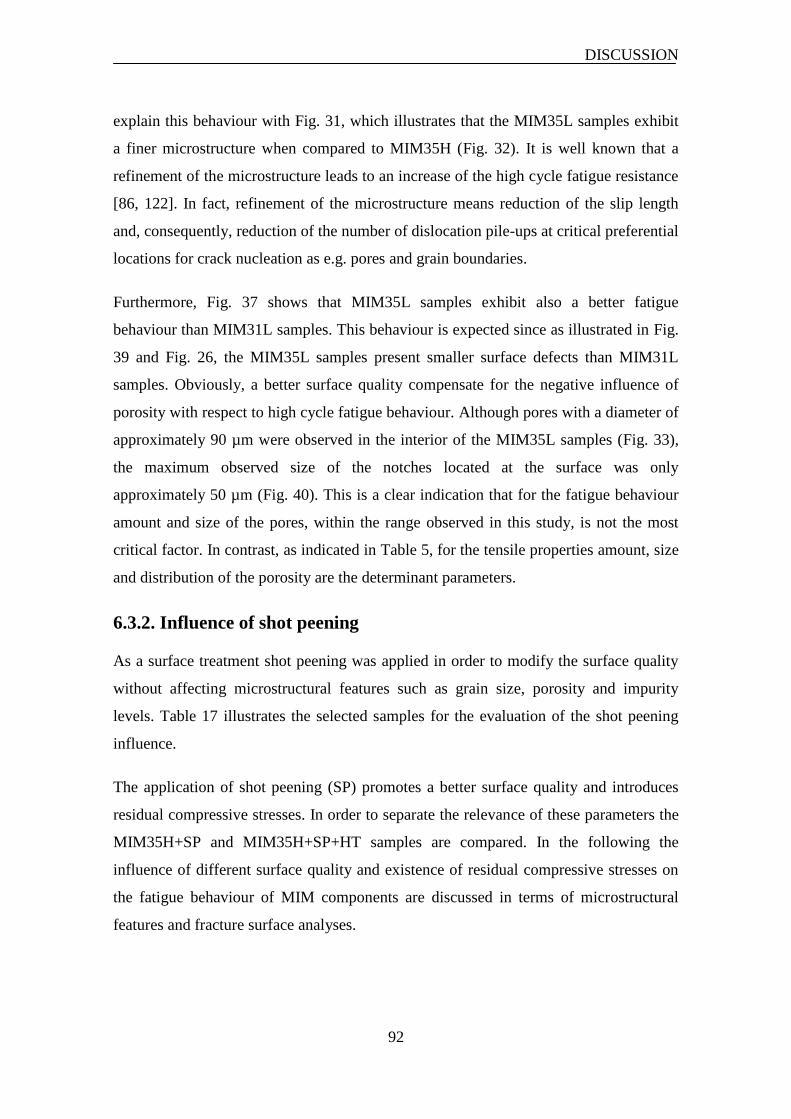
DISCUSSION
92
explain this behaviour with Fig. 31, which illustrates that the MIM35L samples exhibit
a finer microstructure when compared to MIM35H (Fig. 32). It is well known that a
refinement of the microstructure leads to an increase of the high cycle fatigue resistance
[86, 122]. In fact, refinement of the microstructure means reduction of the slip length
and, consequently, reduction of the number of dislocation pile-ups at critical preferential
locations for crack nucleation as e.g. pores and grain boundaries.
Furthermore, Fig. 37 shows that MIM35L samples exhibit also a better fatigue
behaviour than MIM31L samples. This behaviour is expected since as illustrated in Fig.
39 and Fig. 26, the MIM35L samples present smaller surface defects than MIM31L
samples. Obviously, a better surface quality compensate for the negative influence of
porosity with respect to high cycle fatigue behaviour. Although pores with a diameter of
approximately 90 µm were observed in the interior of the MIM35L samples (Fig. 33),
the maximum observed size of the notches located at the surface was only
approximately 50 µm (Fig. 40). This is a clear indication that for the fatigue behaviour
amount and size of the pores, within the range observed in this study, is not the most
critical factor. In contrast, as indicated in Table 5, for the tensile properties amount, size
and distribution of the porosity are the determinant parameters.
6.3.2. Influence of shot peening
As a surface treatment shot peening was applied in order to modify the surface quality
without affecting microstructural features such as grain size, porosity and impurity
levels. Table 17 illustrates the selected samples for the evaluation of the shot peening
influence.
The application of shot peening (SP) promotes a better surface quality and introduces
residual compressive stresses. In order to separate the relevance of these parameters the
MIM35H+SP and MIM35H+SP+HT samples are compared. In the following the
influence of different surface quality and existence of residual compressive stresses on
the fatigue behaviour of MIM components are discussed in terms of microstructural
features and fracture surface analyses.
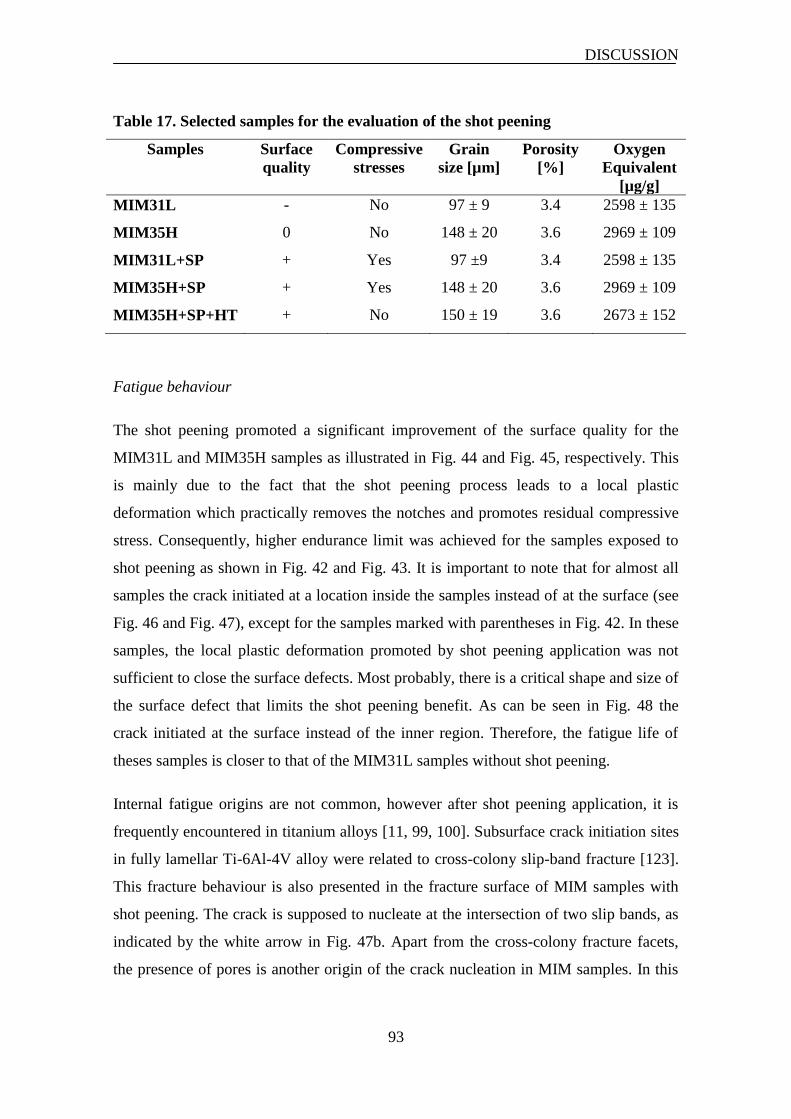
DISCUSSION
93
Table 17. Selected samples for the evaluation of the shot peening
Samples Surface
quality
Compressive
stresses
Grain
size [µm]
Porosity
[%]
Oxygen
Equivalent
[µg/g]
MIM31L - No 97 ± 9 3.4 2598 ± 135
MIM35H 0 No 148 ± 20 3.6 2969 ± 109
MIM31L+SP + Yes 97 ±9 3.4 2598 ± 135
MIM35H+SP + Yes 148 ± 20 3.6 2969 ± 109
MIM35H+SP+HT + No 150 ± 19 3.6 2673 ± 152
Fatigue behaviour
The shot peening promoted a significant improvement of the surface quality for the
MIM31L and MIM35H samples as illustrated in Fig. 44 and Fig. 45, respectively. This
is mainly due to the fact that the shot peening process leads to a local plastic
deformation which practically removes the notches and promotes residual compressive
stress. Consequently, higher endurance limit was achieved for the samples exposed to
shot peening as shown in Fig. 42 and Fig. 43. It is important to note that for almost all
samples the crack initiated at a location inside the samples instead of at the surface (see
Fig. 46 and Fig. 47), except for the samples marked with parentheses in Fig. 42. In these
samples, the local plastic deformation promoted by shot peening application was not
sufficient to close the surface defects. Most probably, there is a critical shape and size of
the surface defect that limits the shot peening benefit. As can be seen in Fig. 48 the
crack initiated at the surface instead of the inner region. Therefore, the fatigue life of
theses samples is closer to that of the MIM31L samples without shot peening.
Internal fatigue origins are not common, however after shot peening application, it is
frequently encountered in titanium alloys [11, 99, 100]. Subsurface crack initiation sites
in fully lamellar Ti-6Al-4V alloy were related to cross-colony slip-band fracture [123].
This fracture behaviour is also presented in the fracture surface of MIM samples with
shot peening. The crack is supposed to nucleate at the intersection of two slip bands, as
indicated by the white arrow in Fig. 47b. Apart from the cross-colony fracture facets,
the presence of pores is another origin of the crack nucleation in MIM samples. In this
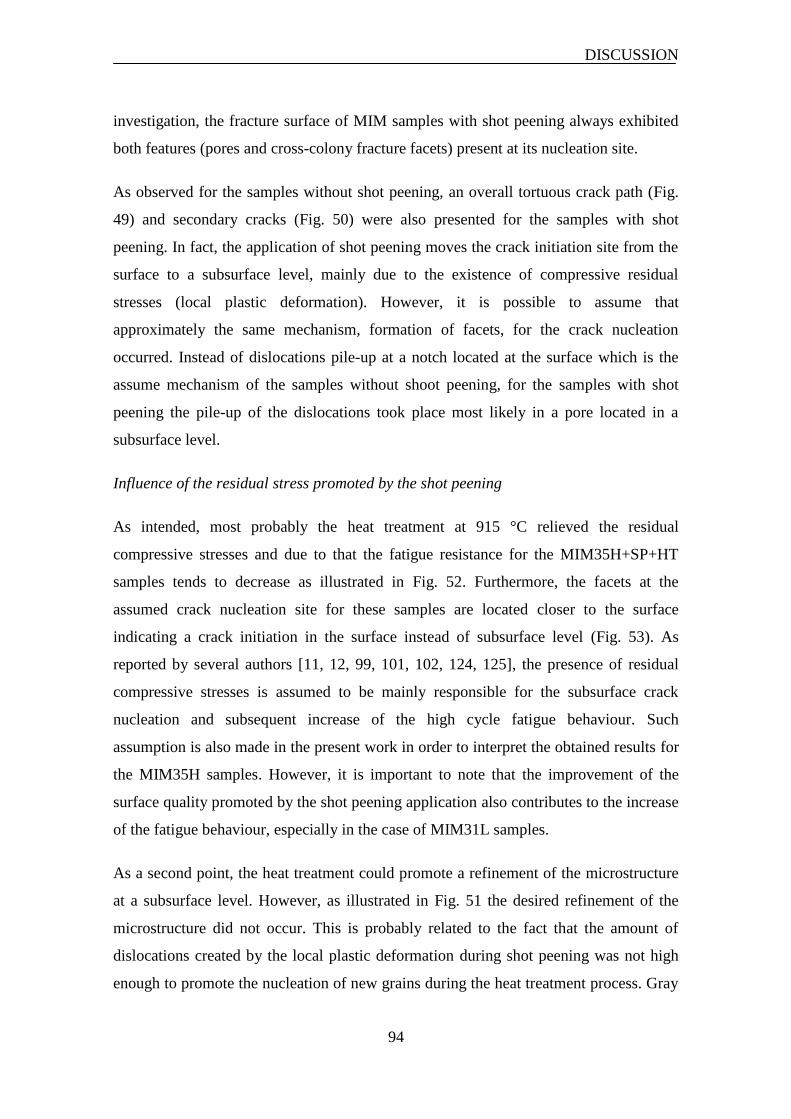
DISCUSSION
94
investigation, the fracture surface of MIM samples with shot peening always exhibited
both features (pores and cross-colony fracture facets) present at its nucleation site.
As observed for the samples without shot peening, an overall tortuous crack path (Fig.
49) and secondary cracks (Fig. 50) were also presented for the samples with shot
peening. In fact, the application of shot peening moves the crack initiation site from the
surface to a subsurface level, mainly due to the existence of compressive residual
stresses (local plastic deformation). However, it is possible to assume that
approximately the same mechanism, formation of facets, for the crack nucleation
occurred. Instead of dislocations pile-up at a notch located at the surface which is the
assume mechanism of the samples without shoot peening, for the samples with shot
peening the pile-up of the dislocations took place most likely in a pore located in a
subsurface level.
Influence of the residual stress promoted by the shot peening
As intended, most probably the heat treatment at 915 °C relieved the residual
compressive stresses and due to that the fatigue resistance for the MIM35H+SP+HT
samples tends to decrease as illustrated in Fig. 52. Furthermore, the facets at the
assumed crack nucleation site for these samples are located closer to the surface
indicating a crack initiation in the surface instead of subsurface level (Fig. 53). As
reported by several authors [11, 12, 99, 101, 102, 124, 125], the presence of residual
compressive stresses is assumed to be mainly responsible for the subsurface crack
nucleation and subsequent increase of the high cycle fatigue behaviour. Such
assumption is also made in the present work in order to interpret the obtained results for
the MIM35H samples. However, it is important to note that the improvement of the
surface quality promoted by the shot peening application also contributes to the increase
of the fatigue behaviour, especially in the case of MIM31L samples.
As a second point, the heat treatment could promote a refinement of the microstructure
at a subsurface level. However, as illustrated in Fig. 51 the desired refinement of the
microstructure did not occur. This is probably related to the fact that the amount of
dislocations created by the local plastic deformation during shot peening was not high
enough to promote the nucleation of new grains during the heat treatment process. Gray
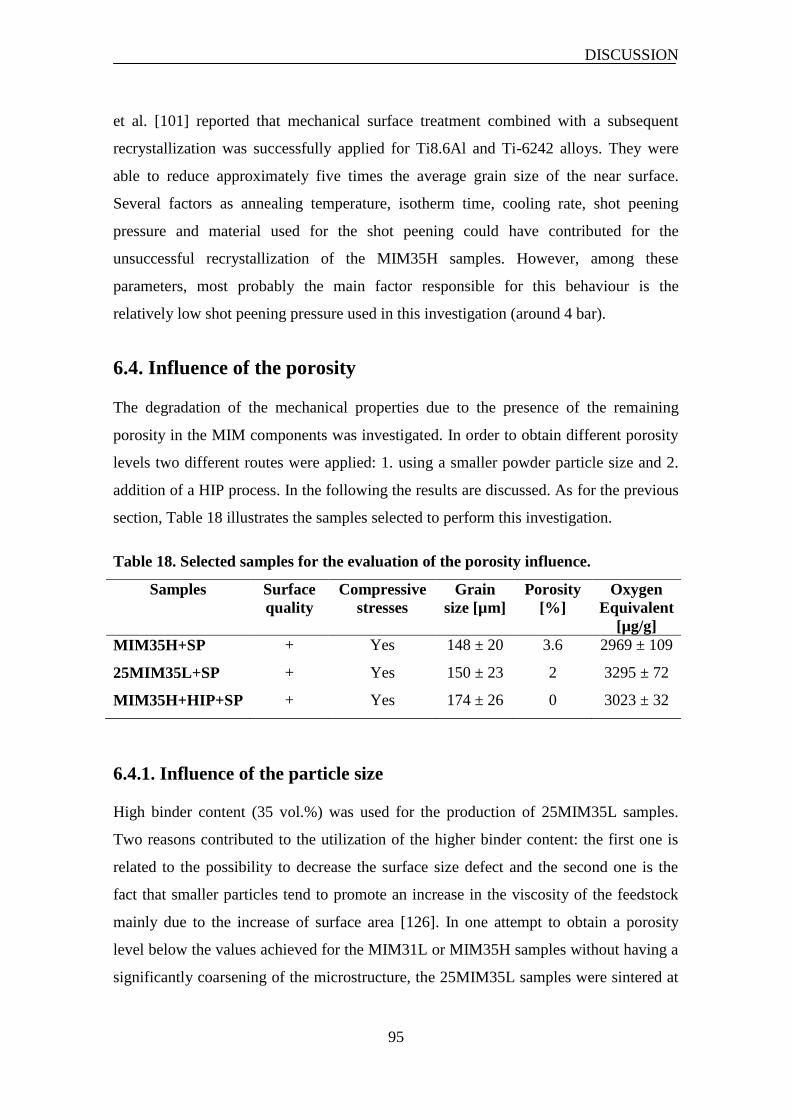
DISCUSSION
95
et al. [101] reported that mechanical surface treatment combined with a subsequent
recrystallization was successfully applied for Ti8.6Al and Ti-6242 alloys. They were
able to reduce approximately five times the average grain size of the near surface.
Several factors as annealing temperature, isotherm time, cooling rate, shot peening
pressure and material used for the shot peening could have contributed for the
unsuccessful recrystallization of the MIM35H samples. However, among these
parameters, most probably the main factor responsible for this behaviour is the
relatively low shot peening pressure used in this investigation (around 4 bar).
6.4. Influence of the porosity
The degradation of the mechanical properties due to the presence of the remaining
porosity in the MIM components was investigated. In order to obtain different porosity
levels two different routes were applied: 1. using a smaller powder particle size and 2.
addition of a HIP process. In the following the results are discussed. As for the previous
section, Table 18 illustrates the samples selected to perform this investigation.
Table 18. Selected samples for the evaluation of the porosity influence.
Samples Surface
quality
Compressive
stresses
Grain
size [µm]
Porosity
[%]
Oxygen
Equivalent
[µg/g]
MIM35H+SP + Yes 148 ± 20 3.6 2969 ± 109
25MIM35L+SP + Yes 150 ± 23 2 3295 ± 72
MIM35H+HIP+SP + Yes 174 ± 26 0 3023 ± 32
6.4.1. Influence of the particle size
High binder content (35 vol.%) was used for the production of 25MIM35L samples.
Two reasons contributed to the utilization of the higher binder content: the first one is
related to the possibility to decrease the surface size defect and the second one is the
fact that smaller particles tend to promote an increase in the viscosity of the feedstock
mainly due to the increase of surface area [126]. In one attempt to obtain a porosity
level below the values achieved for the MIM31L or MIM35H samples without having a
significantly coarsening of the microstructure, the 25MIM35L samples were sintered at
DISCUSSION
96
1250 °C. As shown in Table 7 and Table 18 the 25MIM35L samples exhibited lower
porosity level and similar grain size compared to MIM35H samples. This occurred due
to the fact that the driving force for sintering is the reduction of surface energy. The
surface energy per unit volume depends on the inverse of the particle diameter; thus,
finer particles increase the driving force. Consequently, it is possible to achieve higher
density using lower temperature and less time [127].
Another effect that is probably related to the finer particles is the slight increase of the
impurity levels, especially related to carbon and oxygen content (Table 7). Nevertheless,
as discussed in the section 6.1 such a variation is assumed to be of minor relevance in
terms of mechanical properties. In fact, the significant improvement of the tensile
properties is most probably related to the lower porosity size (Fig. 55) and porosity level
(Table 7) compared to MIM35H samples.
Fatigue behaviour
The 25MIM35L samples exhibited a slight improvement of the fatigue behaviour
compared to MIM35H samples (Fig. 56). Obviously, the smaller amount of pores is the
probable reason to explain the observed increase of the fatigue resistance. Additionally,
another factor that may contribute is the fact that the 25MIM35L samples tend to
exhibit smaller pores diameter (Fig. 55) than MIM35H samples (Fig. 34).
As can be seen in Fig. 57 and Fig. 58, again facets and pores were present on the crack
nucleation site of the 25MIM35L fatigued fracture surface. This, as discussed in the
previous sections, is a further indication that the mechanism that describes the crack
nucleation is the dislocation pile-up at critical points (grain boundaries, pores, particles,
etc).
6.4.2. Influence of the HIP process
The MIM35H sample configuration was chosen due to the fact that the quality of the
sintered surface was much better than that of the samples with a lower binder volume
fraction e.g. MIM31L. Furthermore, the amount of remaining porosity for the MIM35H
was approximately 3.6%. In this investigation this value is assumed to be a typical and
sound porosity level for the components processed by MIM technology.
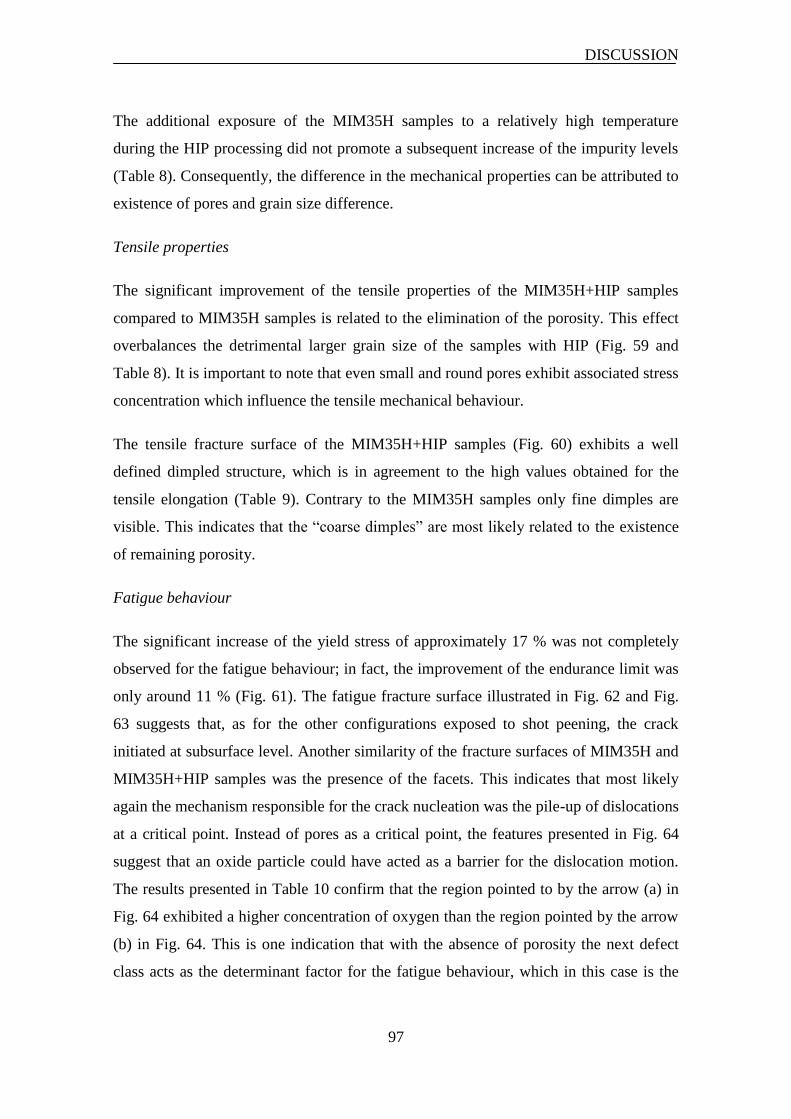
DISCUSSION
97
The additional exposure of the MIM35H samples to a relatively high temperature
during the HIP processing did not promote a subsequent increase of the impurity levels
(Table 8). Consequently, the difference in the mechanical properties can be attributed to
existence of pores and grain size difference.
Tensile properties
The significant improvement of the tensile properties of the MIM35H+HIP samples
compared to MIM35H samples is related to the elimination of the porosity. This effect
overbalances the detrimental larger grain size of the samples with HIP (Fig. 59 and
Table 8). It is important to note that even small and round pores exhibit associated stress
concentration which influence the tensile mechanical behaviour.
The tensile fracture surface of the MIM35H+HIP samples (Fig. 60) exhibits a well
defined dimpled structure, which is in agreement to the high values obtained for the
tensile elongation (Table 9). Contrary to the MIM35H samples only fine dimples are
visible. This indicates that the “coarse dimples” are most likely related to the existence
of remaining porosity.
Fatigue behaviour
The significant increase of the yield stress of approximately 17 % was not completely
observed for the fatigue behaviour; in fact, the improvement of the endurance limit was
only around 11 % (Fig. 61). The fatigue fracture surface illustrated in Fig. 62 and Fig.
63 suggests that, as for the other configurations exposed to shot peening, the crack
initiated at subsurface level. Another similarity of the fracture surfaces of MIM35H and
MIM35H+HIP samples was the presence of the facets. This indicates that most likely
again the mechanism responsible for the crack nucleation was the pile-up of dislocations
at a critical point. Instead of pores as a critical point, the features presented in Fig. 64
suggest that an oxide particle could have acted as a barrier for the dislocation motion.
The results presented in Table 10 confirm that the region pointed to by the arrow (a) in
Fig. 64 exhibited a higher concentration of oxygen than the region pointed by the arrow
(b) in Fig. 64. This is one indication that with the absence of porosity the next defect
class acts as the determinant factor for the fatigue behaviour, which in this case is the
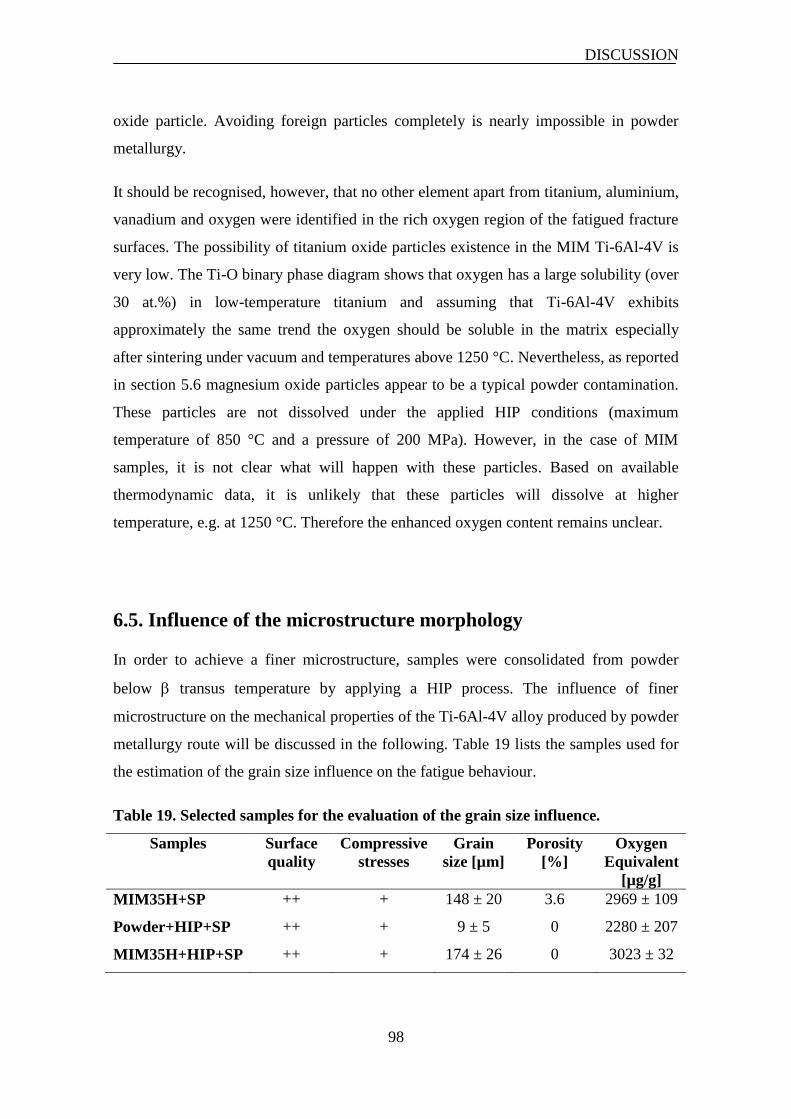
DISCUSSION
98
oxide particle. Avoiding foreign particles completely is nearly impossible in powder
metallurgy.
It should be recognised, however, that no other element apart from titanium, aluminium,
vanadium and oxygen were identified in the rich oxygen region of the fatigued fracture
surfaces. The possibility of titanium oxide particles existence in the MIM Ti-6Al-4V is
very low. The Ti-O binary phase diagram shows that oxygen has a large solubility (over
30 at.%) in low-temperature titanium and assuming that Ti-6Al-4V exhibits
approximately the same trend the oxygen should be soluble in the matrix especially
after sintering under vacuum and temperatures above 1250 °C. Nevertheless, as reported
in section 5.6 magnesium oxide particles appear to be a typical powder contamination.
These particles are not dissolved under the applied HIP conditions (maximum
temperature of 850 °C and a pressure of 200 MPa). However, in the case of MIM
samples, it is not clear what will happen with these particles. Based on available
thermodynamic data, it is unlikely that these particles will dissolve at higher
temperature, e.g. at 1250 °C. Therefore the enhanced oxygen content remains unclear.
6.5. Influence of the microstructure morphology
In order to achieve a finer microstructure, samples were consolidated from powder
below transus temperature by applying a HIP process. The influence of finer
microstructure on the mechanical properties of the Ti-6Al-4V alloy produced by powder
metallurgy route will be discussed in the following. Table 19 lists the samples used for
the estimation of the grain size influence on the fatigue behaviour.
Table 19. Selected samples for the evaluation of the grain size influence.
Samples Surface
quality
Compressive
stresses
Grain
size [µm]
Porosity
[%]
Oxygen
Equivalent
[µg/g]
MIM35H+SP ++ + 148 ± 20 3.6 2969 ± 109
Powder+HIP+SP ++ + 9 ± 5 0 2280 ± 207
MIM35H+HIP+SP ++ + 174 ± 26 0 3023 ± 32
DISCUSSION
99
6.5.1. Microstructural features
As illustrated in Fig. 65 and Fig. 66 the Powder+HIP samples exhibited a relatively fine
microstructure. The microstructure morphology resembles a typical equiaxed
microstructure with some region containing a very fine lamellar structure. This is
mainly related to the fact that the process was carried out below transus temperature.
After handling and HIP processing a moderate increase of the impurity levels was
observed, especially related to oxygen level (Table 11). However, this level was still
lower than the minimal levels obtained for the MIM samples.
6.5.2. Tensile properties
As mentioned in 3.5.4 the tensile properties of the Powder+HIP samples were
characterized by using micro-tensile specimen. It is well known that the miniaturization
of tensile specimen causes so-called “size effects” [128-131], which lead to different
material behaviour in the micro scale compared to the macro scale. Kals et al. [128]
found out that the proportion of grain size versus sheet thickness plays and important
role in the tensile properties. With respect to plastic deformation, grains located at the
specimen surface and grains located within the specimen volume are expected to behave
differently. This difference is connected to the fact that the presence of a free surface
strongly reduces the constraints on the grains near the surface, and consequently, the
grains will be deformed at substantial lower stress. The behaviour of the grains located
at the free surface becomes more and more dominant with the reduction of the specimen
size. To the author’s knowledge no relationship between thickness and grain size was
established for the Ti-6Al-4V alloy; however, in e.g. ferrous materials the size effect
was observed for samples with thicknesses smaller than about 6 to 10 times the average
grain size [130]. Consequently, based on the results for ferrous materials, the size effect
is expected to occur for the MIM35H samples since only few grains are present along
the thickness of the micro-tensile specimens (thickness = 500 µm). This correlates to the
results illustrated in Table 12. The micro tensile specimens exhibited poorer tensile
properties than the dog-bone samples. However, in terms of tensile fracture surface no
significant difference was observed between the dog bone samples (Fig. 36) and micro-
tensile specimens (Fig. 68).
DISCUSSION
100
The Powder+HIP samples exhibited significantly better tensile properties than the
MIM35H samples of same geometry. Furthermore, this is even valid compared to the
MIM35H dog-bone shaped samples. Such behaviour is most probably related to the size
effect and the positive effect of microstructure refinement on the tensile properties.
Furthermore, a larger scatter especially of the elongation was also observed. This
behaviour is most probably related to the fact that particles were found in the fracture
surface of the samples exhibiting lower elongation (Fig. 67a). These particles were not
identified on the samples with higher elongation (Fig. 67b). This could be an indication
that the amount of these particles is relatively small.
6.5.3. Fatigue behaviour
As for the tensile tests the fatigue results of the Powder+HIP samples exhibited a larger
scatter than those of the MIM samples (Fig. 69). Such behaviour is most probably
related to the presence of particles at the assumed crack nucleation size as demonstrated
in Fig. 70 and Fig. 71. The size and location of these particles varied among the
samples, which might be the explanation for the observed larger scatter. The particle
shown in Fig. 71 displays a higher concentration of magnesium and oxygen (Table 13).
The particles observed on the fatigued fracture surface apparently are the same of those
presented on the tensile fracture surface. The presence of such a particle can be related
to:
typical contamination of the material used to do the atomization process or
handling of the powder.
It is important to note here that the Powder+HIP samples were processed twice. This
means that two different charges from Ti-6Al-4V ELI powder were used. This extra
experiment was performed in order to evaluate a possible contamination during
handling of the powder prior the HIP processing. The two sets of samples exhibited
always such particles on the fatigued fracture surface. This indicates that most likely
these particles are a common contamination of the powder.
Most probably these particles (impurities) are also present in the MIM samples.
However, it was not possible to identify such particles on the fatigued fracture surface
of the MIM samples. This could be related to the fact that other defects such as pores
are more relevant to the crack initiation mechanisms than the particles. Another
DISCUSSION
101
argument that contributes to this assumption is the fact, that even the fatigued
MIM35H+HIP samples exhibited a contaminated region at the assumed crack
nucleation site (Fig. 64). Thus, with the elimination of the porosity the next defect class
appears to be the determinant factor for the crack nucleation, here being the presence of
small oxide particles.
As reported by Froes et al. [27] the endurance limit of the Ti-6Al-4V pre-alloyed
powder after HIP processing is in the range of 400 MPa to 600 MPa. Testing conditions
were axial loading with stress ratio of 0.1 and use of smooth samples. The value
obtained for Powder+HIP samples is above this range probably due to the shot peening
application. Consequently, it is possible to assume that the oxide particles found on the
crack initiation sites are a typical impurity feature related to the powder metallurgy
processing. Thus, the value obtained in this study for the endurance limit is in
agreement to the literature.
Finally, it is important to highlight that in spite of the observed foreign particles the
high cycle fatigue limit was much higher than that of the MIM35H and MIM35H+HIP
samples. The main reason for this is assumed to be the grain size and the microstructure
morphology differences among the investigated configurations. As described by Miller
and O’Donnell [132] high cycle fatigue resistance of a material is enhanced if a large
number of barriers is placed in the path of a growing microscopically short crack. The
misorientation of the slip systems of neighboured grains is one of the most effective
barriers. Consequently, due to more barriers per unit area, a small grain size material
has a greater fatigue resistance than a large grain size material.
6.6. Enhancement of the high cycle fatigue behaviour of the MIM
components by microstructure design
As described in this investigation and in the literature [86, 103], the grain size is a
determinant factor regarding the high cycle fatigue behaviour of a material. The
addition of boron on the MIM Ti-6Al-4V alloy was performed with the objective to
obtain a finer microstructure. In this section, the influence of the boron addition on the
DISCUSSION
102
Ti-6Al-4V alloy will be discussed in terms of microstructural features and mechanical
properties.
6.6.1. Variation of boron content
As a preliminary investigation the samples with different boron additions were sintered
at 1250 °C. With the addition of 0.1 wt.% of boron, the colony size was reduced to
approximately 80 µm compared to MIM31L (around 100 µm). Such a phenomenon can
be related to the TiB particles (the particles in the form of needles in Fig. 73) influence
on grain coarsening. Komizo et al. [133] demonstrated by using high-temperature laser
scanning confocal microscopy that TiB particles act as a barrier for grain growth at
high temperatures. However, it is important to note that the lamellar microstructure is
still the predominant microstructure morphology in Ti-6Al-4V-0.1B. In contrast, the
samples with 0.5 wt.% of boron addition exhibited a microstructure with no defined
colony: in other words, the lamellar structure is almost totally suppressed (Fig. 74).
Another important microstructural feature is the porosity. The addition of 0.1 wt.% and
0.5 wt.% of boron promoted a decrease in the relative densification (Table 14). This is a
clear indication that the formation of TiB particles affects the sintering behaviour of the
Ti-6Al-4V alloy. On the other hand, the negative influence of boron addition in terms of
porosity was not observed for samples sintered at 1400 °C. In this case samples with
boron addition exhibited even higher densification level than samples without boron
(Fig. 75). Therefore, a better understanding of the sintering process of the Ti-6Al-4V
alloy powder with added amorphous boron powder is required. One technique that is
very helpful in describing the evolution sintering process is dilatometry.
6.6.2. Sintering process
The addition of boron in the Ti-6Al-4V shifted the start temperature of the shrinkage
process by almost 110 °C as illustrated in Fig. 76a. As stated by German [127] the
shrinkage of the powder compact is a result of a change in the interparticle spacing as
neck growth takes place which is promoted by bulk transport processes. Consequently,
based on the results of the dilatometry experiments it is possible to argue that the boron
causes a delay of the bulk transport processes responsible for the shrinkage of the
DISCUSSION
103
powder compact. Therefore due to the presence of boron the sample starts to shrink only
at 722 °C rather than 614 °C. It is important to note that the pre-sinter of the samples
with and without boron addition was carried out in a single furnace run. No temperature
difference between the samples is expected since they were positioned very close to
each other. Thus it is possible to attribute the delay of the sintering process to the
presence of boron.
Another interesting behaviour of the samples with boron addition is the fact that the
sample progressively increased the linear shrinkage rate (LSR) from 722 °C up to
820 °C (Fig. 76b). After this temperature the LSR decreased until approximately 1050
°C. This phenomenon can be related to the formation of TiB particles. For this
formation a solid diffusion process needs to take place between boron from amorphous
boron powder and titanium from Ti-6Al-4V alloy powder. Divinski et al. [134]
investigated the tracer diffusion of boron in pure -Ti by secondary ion mass
spectroscopy using the stable 11
B isotope. They observed that at temperatures below
760 °C, diffusion profiles of acceptable quality could no longer be measured, probably
due to the low solubility of boron in -Ti. On the other hand, they reported that boron is
the fastest diffuser in -Ti after hydrogen. Therefore, it is reasonable to assume that
most probably the TiB particles are formed above 760 °C. The dilatomety experiment
suggests that the TiB formation occurred above 820 °C which is in a good agreement to
the values obtained by Divinski et al. [134].
It is well known [135-137] that TiB particles can restrict grain growth of cast Ti-6Al-4V
alloy. By extension of this concept it can also be assumed that the initial and
intermediate sintering stage can be inhibited by the presence of TiB particles as well.
The Ti-6Al-4V alloy exhibited a maximum LSR of 0.25 %/min at approximately
985 °C. Above this temperature the LSR started to decrease which is an indication of
the final sintering stage’s initiation. For most materials, it is common that a separation
of grain boundaries and pores occurs, leaving the pores isolated in the grain interior at
final sinter stage process [127]. This leads to coarsening of the microstructure, and
further elimination of the porosity (further densification) becomes difficult since lattice
DISCUSSION
104
diffusion, which is much slower than grain boundary diffusion, is needed for
elimination of the pores.
On the other hand, the Ti-6Al-4V-0.5B alloy started to shrink significantly above
1050 °C. The maximum LSR achieved for this alloy during dilatometry experiments
was approximately 0.45 %/min at around 1250 °C. It is important to note that the
maximum LSR for Ti-6Al-4V-0.5B was roughly two times higher than for the alloy
without boron addition. This behaviour can be explained in terms of densification and
coarsening processes. As pointed out before, the presence of TiB particles decreases the
grain growth. Consequently, a separation of pores and grain boundaries might be
delayed. This leads to an optimum configuration for the elimination of pores by grain
boundary diffusion [138].
In fact, the addition of boron to a Ti-6Al-4V alloy results in a delay of the bulk transport
processes responsible for the shrinkage of the powder compact. Most probably due to
the formation of TiB particles the shrinkage process is retarded from 820 °C up to
1050 °C. This delay of densification occurred due to the pinning effect promoted by the
presence of TiB particles. Such a pinning effect is beneficial for the densification at a
later stage’s of sintering process due to postpone separation of pores and grain
boundaries which extended the elimination of the pores by grain boundary diffusion.
6.6.3. The microstructure of Ti-6Al-4V-0.5B alloy sintered at 1400 °C
As described before, the colony size is not well defined for the Ti-6Al-4V-0.5B
samples (see Fig. 77 and Fig. 79) which can be related to a tendency to form equiaxed
instead of the lamellar structure. Such behaviour was also reported in the work of Hill et
al. [139] for cast Ti-6Al-4V alloy with a small addition of boron. They obtained the
equiaxed microstructure after additional heat treatment with slow cooling from above
the transus without being subjected to any thermo-mechanical treatment in the +
phase field (a typical procedure to create globular microstructure of + titanium
alloys). They suggested that nucleating at and growing from the TiB precipitates
usually results in equiaxed or globular morphology.
DISCUSSION
105
Tamirisakandala et al. [94] also tried to describe the mechanism responsible for the
microstructure refinement of the cast Ti-6Al-4V with a small additions of boron. In
their study, the refinement of the microstructure was explained by three mechanisms:
refinement of -grains, the heterogeneous nucleation and grain growth restriction.
The -grain refinement was related to the influence of boron partitions ahead of the
titanium solid/liquid interface. In hypoeutectic Ti-B alloys the Ti grains are formed
prior to the precipitation of TiB particles. Therefore, TiB particles cannot be nucleation
sites for the Ti grains. More recently, Bermingham et al. [137] described similar
observations for cast commercially pure titanium with a small addition of boron. The
second mechanism, the heterogeneous nucleation, is related to the influence of TiB
particles on the nucleation of phase. They suggested that the presence of TiB particles
enhanced the kinetics of phase transformation from to , which occurs by nucleation
and growth according to Burger’s orientation relationship, by providing additional
nucleation sites. As a consequence of these additional nucleation sites a microstructure
with equiaxed grains is more likely to occur than the lamellar microstructure.
Finally, the grain growth restriction mechanism is related to the pinning effect promoted
by the TiB particles on grain growth. This mechanism for cast materials is assumed to
be relevant during subsequent thermal exposure at elevated temperatures by restricting
the mobility of grain boundaries.
It is important to note that the refinement of -grains mechanism is not likely to occur
for the sintered MIM Ti-6Al-4V-0.5B samples since no liquid phase is expected to be
present during the sintering process. Nevertheless, as for the cast Ti-6Al-4V alloy with a
small addition of boron, the heterogeneous nucleation is a relevant mechanism in
order to describe the microstructure changes of the MIM Ti-6Al-4V-0.5B samples after
sintering. Although the grain growth restriction is assumed to be a secondary
microstructure refinement mechanism for cast Ti-6Al-4V alloy with a small addition of
boron, for the MIM samples this mechanism is significantly relevant for the sintering
process and for the final microstructure.
For the Ti-6Al-4V-0.5B alloy both colonies and grains were assumed to define the
grain size (slip length) because both features exist in the microstructure. Fig. 80b shows
DISCUSSION
106
regions (I) where lamellae are oriented in the same direction, setting up a colony.
However, also regions (regions II) can be observed where neighboured single phases
have no correlated orientation. These regions are considered as single grains. A lower
magnification mapping of the phase orientation (Fig. 79b) confirms the existence of
both small colonies and grains. The microstructure of the samples with 0.5 wt.% of
boron addition can be considered as a transition between lamellar and equiaxed.
In addition, it was possible to clearly identify the phase between lamellae and at
grains boundaries (Fig. 79c). The grain size of the samples with boron addition,
apparently, is smaller than that of samples without boron (Fig. 83c). This is an
indication that the TiB particles act as a barrier to grain growth of grains.
Three boron compounds exist in the Ti-B system: TiB, Ti3B4 and TiB2. These occur at
boron concentrations of about 18%, 22%, and 30% by weight, respectively. Feng et al.
[140] stated that only TiB can be in situ synthesized from the reaction between Ti
powder and boron powder. In this investigation, during the EBSD experiments, only the
TiB phase (Fig. 79d) was indexed and no TiB2 was observed for the Ti-6Al-4V-0.5B
alloy. This is in agreement with thermodynamic expectation [141-145] and with the
Feng et al. [140] statement.
Another interesting aspect of the Ti-6Al-4V-0.5B alloy microstructure produced by
MIM technology is the apparent homogeneous distribution of the TiB particles. This is
a clear advantage of the MIM process over the cast process. As reported by Srinivasan
et al. [146], the cast Ti-6Al-4V alloy with a small addition of boron (0.1 wt.%) tends to
exhibit a microstructure with TiB precipitated at the grain boundaries. This preferential
precipitation at the grain boundaries promotes a degradation of mechanical properties,
especially with respect to ductility.
6.6.4. The tensile property of Ti-6Al-4V-0.5B alloy sintered at 1400 °C
As reported in the literature [147, 148] the TiB particles tend to deteriorate the ductility
of Ti-6Al-4V alloy. Such behaviour was also observed for the Ti-6Al-4V-0.5B samples
produce by MIM (Table 15). However, the level of this expected reduction was rather
moderate (around 2 %). As illustrated in Fig. 84 a typical ductile tensile fracture with
DISCUSSION
107
the presence of fine dimples, coarse dimples and pores occurred for the Ti-6Al-4V-0.5B
samples, being in agreement to the low reduction of tensile elongation. Although a
significant improvement occurred due to the boron addition, the tensile properties are
still inferior to those of the samples without pores (MIM35H+HIP, Table 9). This is a
clear indication that the influence of porosity on the tensile behaviour of MIM
components is greater than the influence of grain size or microstructure morphology.
Another relevant parameter is the maximum sinter temperature. Since the samples with
boron were sintered at higher temperature, it seems possible to attribute the increase of
strength and the decrease of ductility to a possibly higher impurity level. However, as
can be seen in Table 14, impurity levels for the alloy sintered at 1400 °C are in the
accepted variation range and as discussed in section 6.1 no significantly influence on the
mechanical properties is expected.
6.6.5. Fatigue behaviour of Ti-6Al-4V-0.5B alloy sintered at 1400 °C
The addition of boron in the Ti-6Al-4V alloy promoted a significant improvement of the
fatigue behaviour. The endurance limit was approximately 640 MPa. Even the
MIM35H+HIP samples exhibited a lower endurance limit. This is an indication that, in
contrast to the tensile behaviour, for the high cycle four-point bending fatigue behaviour
of MIM components the pores are not the most significant parameter. Instead, the grain
size seems to be much more relevant.
As described before, the boron addition induces a refinement of the microstructure. It is
known that refinement of the microstructure can promote an increase of the Ti-6Al-4V
alloy fatigue strength, e.g. from 440 to 670 MPa as reported in [86]. Furthermore, the
TiB particles are expected to effectively decrease the slip length when compared to the
slip length of fully lamellar Ti-6Al-4V alloy [136]. Therefore, the reduction of the slip
length, which means a more homogeneous distribution of dislocation densities, is
assumed to be one of the main origins for the significant enhancement of the fatigue
behaviour by adding boron as performed in this work.
In this investigation, it was assumed so far, that the crack nucleation is related to
dislocation pile-up at critical points (e.g. pores), leading to the formation of facets in the
crack nucleation region of the fracture surface. As can been seen in Fig. 87, these facets
DISCUSSION
108
and pores were also observed in the assumed crack nucleation location of Ti-6Al-4V-
0.5B samples. In addition another mechanism that might be determinant for the crack
nucleation is the evidence of interfacial decohesion around the TiB particles as
appointed by the white arrows in Fig. 87. Such mechanism was proposed before by
Soboyejo et al. [149] in order to explain the fatigue results obtained for an ingot Ti-6Al-
4V-0.5B alloy.
Flat surfaces as an indication of slip band fracture and micro cracks are typical features
of the crack front profile near the assumed crack nucleation site (Fig. 89). The micro
cracks exhibited microscopic deflection, which is a well known mechanism for the
crack propagation behaviour of + titanium alloys with a lamellar microstructure
[141]. Furthermore, micro cracks apparently are formed near TiB particles, which is a
further indication of the interfacial decohesion mechanism between the matrix and the
TiB particles as clearly illustrated in Fig. 90. Most probably, such phenomenon is
associated to stress concentration promoted by the particles and due to the dislocation
pile-up at the particles.
As a result, for nearly fully dense materials, it is possible to assume that a fine
microstructure can tolerate a higher number of defects than a coarse microstructure. It is
also important to note that apart from the typical crack nucleation mechanisms of the Ti-
6Al-4V alloy fabricated by MIM technology, a further mechanism, the interfacial
decohesion between matrix and TiB particles, apparently occurs during crack nucleation
in the Ti-6Al-4V-0.5B alloy.
CONCLUSIONS
109
7. Conclusions
In the present work, the high cycle four-point bending fatigue behaviour of a Ti-6Al-4V
alloy processed by MIM was investigated and evaluated. Critical process parameters
and the most relevant microstructural features responsible for the fatigue behaviour of
the MIM parts were identified and assessed. Based on the results obtained in this study,
it is proposed that the factors determining the fatigue behaviour of MIM Ti-6Al-4V
components can be ranked in the following order of relevance:
1st: Surface quality
2nd
: Microstructure (grain size)
3rd
: Porosity
4th
: Foreign particles (e.g. oxides)
The amounts of interstitial elements were not considered in the above ranking, since the
observed variation of oxygen equivalent turned out to be irrelevant to describing the
mechanical properties of the MIM Ti-6Al-4V components investigated. However, such
an assumption is only valid for the oxygen equivalent range (Oeq = 2598 – 3238 µg/g)
investigated.
The MIM Ti-6Al-4V samples sintered at 1250 °C with 31 vol. % binder in the feedstock
exhibit a fatigue strength degradation of approximately 39 % compared to the annealed,
wrought Ti-6Al-4V alloy with a lamellar microstructure. This occurs mainly due to the
presence of notches at the surface of the MIM samples. Such notches are assumed to be
created during the injection and debinding processes.
A better surface quality is achieved by using feedstock with higher binder content and
as a result, superior fatigue behaviour is obtained. A clear relationship between the type
of porosity (open or closed) and the tensile properties is observed. However, variations
in porosity (3.6 – 5.7 %) surprisingly did not affect the fatigue behaviour of Ti-6Al-4V
alloy components fabricated by MIM. This is an indication that, at these specific
porosity levels, the surface quality and grain size are the main factors that influence the
fatigue behaviour, not the porosity.
CONCLUSIONS
110
Typical features such as facets and pores are always present in the assumed crack
nucleation site of the MIM samples. Dislocation pile-ups at critical, preferential
locations such as e.g. notches, grain boundaries, pores and oxide particles are assumed
to be responsible for the crack initiation mechanism, which promotes the occurrence of
facets on the fatigued fracture surfaces.
Shot peening was successfully used to generate residual compressive stresses in the
surface regions via local plastic deformation and practically remove notches. As a result
the fatigue behaviour improves and cracks tend to initiate in subsurface regions instead
of at the surface. For high quality surfaces obtained by shot peening, the residual
compressive stresses are the main factor responsible for the enhancement of the fatigue
behaviour.
The elimination of pores by using HIP led to significant improvements in the
mechanical properties. In terms of the yield strength an increase of 17 % was observed,
however, for the fatigue behaviour the improvement was only around 11 %. Such
behaviour might be related to the coarsening of the microstructure promoted by the HIP
processing. Possible oxide particles are the determining defect class in the absence of
porosity.
The samples consolidated directly from powder by applying a HIP process exhibit a
drastic change in the microstructure compared to the microstructure of the MIM
samples. This microstructural refinement promotes a significant improvement in the
mechanical properties. The powder+HIP samples have an approximately 28% higher
endurance limit than the MIM+HIP samples.
Since the refinement of the microstructure seems to be more relevant than the presence
of pores in terms of fatigue behaviour, a small addition of boron was added to the Ti-
6Al-4V during the MIM process. The refinement of the microstructure occurs mainly
due to the fact that TiB particles act as new nucleation sites for the phase
(heterogeneous nucleation) and as pinning sites to restrict grain growth. Such a pinning
effect promotes a delay in the starting point of the sintering process. On the other hand,
this effect is beneficial for densification in the later stages of sintering due to the
delayed separation of pores and grain boundaries.
CONCLUSIONS
111
The significant improvement in the fatigue behaviour to an endurance limit of
approximately 640 MPa is most probably related to the finer grain size. Common
features such as facets and pores are present at the assumed crack nucleation location.
Apart from these features, a further mechanism involving the interfacial decohesion
between matrix and TiB particles may have occurred during the crack nucleation
process. Moreover, it is important to emphasise that even with approximately 2 vol.% of
residual porosity, the samples with boron exhibited higher fatigue resistance than the
MIM+HIP samples (samples with no pores).
As a matter of fact, the results presented in this investigation demonstrate that it is
possible to produce MIM parts with sound mechanical properties even in terms of high
cycle fatigue behaviour. Consequently, entirely new application possibilities may be
considered by designers and engineers in terms of using the MIM technology for the
manufacture of highly loaded components for sectors such as biomedical, aerospace and
automobile industries.
SUGGESTIONS FOR FUTURE WORK
112
8. Suggestions for future work
The fatigue behaviour of the MIM component is mainly determined by the presence of
notches on the surface, which is assumed to be related to the MIM process (injection
and debinding steps). It was demonstrated that the amount of binder plays an important
role in the size of such notches. However, it is necessary to investigate systematically
the influence of other parameters such as:
different particle morphology, e.g. instead of spherical powder, an irregular
powder might be applied.
different binder system, e.g. a binder based on naphthalene. With this
experiment it would be possible to evaluate the effect of a different debinding
process, in this case sublimation of the naphthalene, on the size of the notches.
The presence of fine and coarse dimples on the tensile fracture surface of the MIM
samples need to be careful investigated. A detailed investigation focused on dislocation
concentration, low grain boundaries and possible preferential concentration of carbon or
oxygen in the microstructure of the sintered samples needs to be performed to elucidate
this phenomenon.
The exact influence of impurity levels on the mechanical properties of the MIM
components remains unclear. The results so far suggested that a critical point might
exist. A methodological investigation on the relationship among amount of porosity,
oxygen equivalent and mechanical properties is necessary.
It should be noted that this study was a preliminary investigation of the boron addition
influence on the MIM Ti-6Al-4V alloy. It is clear that more research is needed in order
to evaluate the relationship between mechanical properties and boron addition content.
The development of the microstructure during sintering and cooling steps for the
samples with small addition of boron is still not totally understood. In situ experiments
might be helpful in order to describe the mechanisms involved during the process.

SUGGESTIONS FOR FUTURE WORK
113
The biocompatibility of the Ti-6Al-4V alloy with small boron additions should be
systematically investigated in order to evaluate a possible degradation of this property.
Furthermore, another interesting property that should be investigated is the effect of
boron addition on the corrosion resistence.
REFERENCES
114
References
[1] S. Anken, C.A. Greene, Materials Science and Engineering A 236 (1999) 127-131.
[2] E. Nyberg, M. Miller, K. Simmons, K. S. Weil, Material Science and Engineering C
25 (2005) 336-342.
[3] K. Faller, F. H. Froes, Journal of Metals 52 (2004) 27-28.
[4] J.C. Williams, E.A. Starker, Acta Materialia 51 (2003) 5775-5799.
[5] F.H. Froes, J. E. Smngeresky, in: Proceedings of TMS-ALME Symposium, Las
Vegas, 1980, p. 175.
[6] Y. Itoh, T. Harikou, K. Sato, H. Miura, Improvement of ductility for injection
moulding Ti-6Al-4V alloy, in: PM2004, vol 4, EPMA, Wien, 2004.
[7] M. Niinomi, T. Akahori, M. Nakai, K. Ohnaka, Y. Itoh, K. Sato, T. Ozawa,
Mechanical properties of + type titanium alloys fabricated by metal injection
molding with targetting biomedical applications, in: N. Gungor, M.A. Iman,
F.H. (Sam) Froes (Eds.), TMS, 2007, pp. 209-217.
[8] F.H. Froes, S.J. Mashl, V.S. Moxson, J.C. Hebeisen, V. A. Duz, Journal of Metals
(2004) 46-48.
[9] J. O. Peters, R. O. Ritchie, International Journal of Fatigue 23 (2001) 413-421.
[10] T. Akahori, M. Niinomi, Material Science and Engineering A 243 (1998) 237-243.
[11] M.Y.P. Costa, H.J.C. Voorwald, W.L. Pigatin, V.A. Guimaraes, M. O. H. Cioffi,
Materials Research 9 (2006) 107-109.
[12] N. Tsuiji, S. Tanaka, T. Takasugi, Materials Science and Engineering A 488 (2008)
139-145.
[13] Titanium and titanium alloys, edited by C. Leyens and M. Peters, Wiley-VCH,
2003.
[14] G. Lütjering, J. C. Williams, Titanium, Springer, Heidelberg, Germany, 2003.
[15] H. Conrad, Acta Metallurgica 14 (1966) 1631-1633.
[16] B. D. Meester, M. Doner, H. Conrad, Metallurgical Transactions A 6 (1975) 1965-
1975.
[17] P. S. Prevey, Fatigue and Fracture, American Society for Metals, Metal Park, 1986,
p. 829-853.
REFERENCES
115
[18] H. M. Conrad, M. Doner, B. D. Meester, Critical review deformation and fracture,
in: International Conference on Titanium, Proceedings of Titanium Science and
Technology, Boston, 1973, p. 969.
[19] R. W. Judy, I. L. Caplan, F. D. Bogar, Effects of oxygen and iron on the
environmental and mechanical properties of unalloyed titanium, in: F. H. Froes,
J. Caplan (Eds.), Titanium '92, TMMS, 1993, pp. 2073-2080.
[20] G. Welsch, W. Bunk, Metallurfical and Materials Transactions A 13 (1982) 889-
899.
[21] K. Schwartzwalder, Ceramic Bulletin 28 (1949) 459-461.
[22] R. M. German, Powder injection molding, Metal powder industries federation,
Princeton, New Jersey, 1990.
[23] R. M. German, A. Bose, Injection molding of metals and ceramics, MPIF,
Princeton, 1997.
[24] C. H. Ji, N. H. Loh, K. A. Khor, S. B. Tor, Materials Science and Engineering A
311 (2001) 74-82.
[25] B.C. Mutsuddy, R. G. Ford, Ceramic injection molding, Chapman & Hall, London,
1995.
[26] T. Hartwing, G. Veltl, F. Petzoldt, H. Kunze, R. Scholl, B. Kieback, Journal of the
European Ceramic Society 18 (1998) 1211-1216.
[27] F.H. Froes, J. R. Pickens, Journal of Metals (1984) 14-28.
[28] C. I. Chung, B. O. Rhee, M. Y. Cao, C. X. Liu, Advances in Powder Metallurgy 3
(1989) 67-78.
[29] N. H. Loh, S. B. Tor, K. A. Khor, Journal of Materials Processing Technology 108
(2001) 398-407.
[30] P. T. Vielma, A. Cervera, B. Levenfeld, A. Várez, Journal of the European
Ceramic Society 28 (2008) 763-771.
[31] W. Limberg, E. Aust, T. Ebel, R. Gerling, B. Oger, Metal Injection Molding of an
Advanced Bone Screw Ti-6Al-7Nb Alloy Powder, in: PM 2004, vol 4, EPMA,
Wien, 2004, pp. 436-441.
[32] K.S. Weil, E. Nyberg, K. Simmons, Journal of Materials Processing Technology
176 (2006) 2005-2209.
REFERENCES
116
[33] B. Huang, S. Liang, X. Qu, Journal of Materials Processing Technology 137 (2003)
132-137.
[34] Y. Li, L. Li, K. A. Khalil, Journal of Materials Processing Technology 183 (2007)
432-439.
[35] M. J. Edirisinghe, J. R. G. Evans, Journal of Materials Science 22 (1987) 269-277.
[36] V. V. Bilovol, L. Kowalski, J. Duszczyk, L. Katgerman, Journal of Materials
Processing Technology 178 (2006) 194-199.
[37] R. Heldele, S. Rath, L. Merz, R. Butzbach, M. Hagelstein, J. Haußelt, Nuclear
Instruments and Methods in Physics Research B 246 (2006) 211-216.
[38] Y. Li, F. Jiang, L. Zhao, B. Huang, Material Science and Engineering A 362 (2003)
292-299.
[39] M. R. Barone, J. C. Ulicny, Journal of American Ceramic Society 73 (1990) 3323-
3333.
[40] M. J. Cima, J. A. Lewis, A. D. Devoe, Journal of American Ceramic Society 72
(1989) 1192-1199.
[41] J. G. Zhang, M. J. Edirisinghe, R. G. Evans, Industrial Ceramics 9 (1989) 72-82.
[42] R. M. German, Sintering Theory and Practice, John Wiley & Sons, New York,
1996.
[43] E. A. Olevsky, Materials Science and Engineering R 23 (1998) 41-100.
[44] R. M. German, Z. A. Munir, Journal of Materials Science 10 (1975) 1719-1724.
[45] C. Herring, Journal of Applied Physics 21 (1950) 301-303.
[46] R. F. Walker, Journal of the American Ceramic Society 38 (1955) 187-197.
[47] M. Braginsky, V. Tikare, E. Olevsky, International Journal of Solids and Structures
42 (2005) 621-636.
[48] J. S. Reed, Principles of Ceramics Processing, John Wiley & Sons, New York,
1995.
[49] F. V. Lenel, Powder Metallurgy and Metal Ceramics 3 (1964) 523-529.
[50] C. Herring, Journal of Applied Physics 21 (1950) 437-445.
[51] A. Taskinen, Journal of Materials Science 15 (1980) 2253-2257.
[52] M. N. Rahaman, L. C. D. Jonghe, Journal of the American Ceramic Society 69
(1986) 53-58.

REFERENCES
117
[53] P. Balakrishan, B. N. Murty, K. P. Chakraborthy, R. N. Jayaraj, C. Ganguly,
Journal of Nuclear Materials 297 (2001) 35-42.
[54] J. E. Burke, Journal of the American Ceramic Society 40 (1957) 80-85.
[55] Z. He, J. Ma, Ceramics International 27 (2001) 261-264.
[56] R. J. Brook, Journal of the American Ceramic Society 52 (1969) 56-57.
[57] J. Liu, A. Lal, R. M. German, Acta Metallurgica 47 (1999) 4617-4626.
[58] T. Fujita, A. Ogawa, C. Ouchi, H. Tajima, Materials Science and Engineering A
213 (1996) 148-153.
[59] M. N. Gungor, K. R. Reasbeck, I. Ucok, L. S. Kramer, H. Dong, W. T. Tack,
Microstructures and mechanical properties of extruded and cast Ti-6Al-4V, in:
S. A. M. Ninomi, M. Ikeda, M. Hagiwara, K. Maruyama (Ed.) Ti-2007 Science
and Technology, The Japan Institute of Metals, 2007, pp. 391-394.
[60] F. H. Froes, Powder Metallurgy and Metal Ceramics 46 (2007) 303-310.
[61] F. H. S. Froes, Advances in titanium metal injectiom molding, in: N. Gungor, M.A.
Iman, F.H. (Sam) Froes (Eds.), TMS, 2007, pp. 157-166.
[62] B. Oger, T. Ebel, W. Limberg, The manufacture of highly-ductile and
geometrically complex MIM-parts based on TiAl6V4, in: EUROPM 2006, vol
2, EPMA, 2006, pp. 191-196.
[63] R. Zhang, J. Kruszewski, J. Lo, A study of the effects of sintering parameters on
the microstructure and properties of PIM Ti6Al4V alloy, in: N. Gungor, M.A.
Iman, F.H. (Sam) Froes (Eds.), TMS, 2007.
[64] G. Shibo, Q. Xuanhui, H. Xinbo, Z. Ting, D. Bohua, Journal of Materis Processing
Technology 173 (2006) 310-314.
[65] T. Ebel, Powder Injection Moulding International 2 (2008) 21-30.
[66] Y. Li, X. M. Chou, L. Yu, Powder Metallurgy and Metal Ceramics 49 (2006) 236-
239.
[67] E. S. Thian, N. H. Loh, K. A. Khor, S. B. Tor, Biomaterials 23 (2002) 2927-2938.
[68] R. R. Boyer, G. Welsch, E. W. Collings, Materials Properties Handbook: Titanium
Alloys, International Materials Park, OH, 1994.
[69] F. H. Froes, R. M. German, Metal Powder Report 5 (2000) 12-21.
[70] J. Schijve, International Journal of Fatigue 25 (2003) 679-702.
[71] A. Wöhler, Zeitschrift für Bauwesen 20 (1870) 73-106.
REFERENCES
118
[72] C. Bathias, Fatigue and Fracture of Engineering Materials and Structure 22 (1999)
559-565.
[73] M. Klesnil, P. Lukas, Fatigue of metallic materials, Elsivier, Amsterdam, 1980.
[74] S. Suresh, Fatigue of materials, Cambridge University Press, New York, USA,
1991.
[75] U. Krupp, Fatigue Crack Propagation in Metals and Alloys, Wiley-VCH,
Weinheim, 2007.
[76] R. O. Ritchie, Y. Murakami, Comprehensive Structural Integrity, Elsevier
Pergamon, Oxford, 2003.
[77] S.V. Nair, J.K. Tien, R.C. Bates, O. Buck, Fracture Mechanics: Microstructure and
Micromechanisms, ASM International, Ohio, 1987.
[78] J. C. Grosskreutz, Physics Status Solid 47 (1971) 11.
[79] N. F. Moot, Acta Metallurgica 6 (1958) 195-197.
[80] A. H. Cottrell, D. Hill, Extrusion and Intrusion by Cyclic Slip in Copper, in:
Proceedings of the Royal Society of London. Series A. Mathematical and
Physical Sciences, vol 242, 1957, pp. 211-213.
[81] E. A. Starke, G. Lutjering, Fatigue and Microstructure, American Society for
Metals, Metal Park, Ohio, 1979.
[82] K. Miller, The Three Thresholds for Fatigue Crack Propagation, in: R. S. Piascik, J.
C. Newman, N. E. Dowling (Eds.), Fatigue and Fracture Mechanics, ASTM STP
1296, vol 27th, 1997, pp. 267-286.
[83] H. Kitagawa, S. Takahashi, Applicability of fracture mechanics to very small
cracks or the cracks in the early stage, in: International Conference on
Mechanical Behaviour of Materials, American Society of Metals, Metal Park,
OH, 1976, pp. 627-631.
[84] K. S. Chan, International Journal of Fatigue 32 (2010) 526-534.
[85] C. Leyens, M. Peters, Titanium and titanium alloys, Wiley-VCH, 2003.
[86] C.A. Stubbington, A. W. Bowen, Journal of Material Science 9 (1974) 941-947.
[87] R.K. Nally, B.L. Boyce, J.P. Campbell, J.O. Peters, R. O. Ritchie, Metallurgical
and Materials Transactions A 33 (2002) 899-918.
[88] A. N. Stroh, The formation of cracks as a result of plastic flow, in: Proceedings of
the Royal Society of London, London, 1954, pp. 404-414.
REFERENCES
119
[89] M. R. Bache, International Journal of Fatigue 21 (1999) 105-111.
[90] A.L. Pilchak, A. Bhattacharjee, A.H. Rosenberger, J. C. Williams, International
Journal of Fatigue 31 (2009) 989-994.
[91] K. Tanaka, T. Mura, Journal of Applied Mechanics 48 (1981) 97-103.
[92] K. Tanaka, T. Mura, Metallurfical and Materials Transactions 13A (1982) 117-123.
[93] K. S. Chan, Metallurfical and Materials Transactions 34A (2003) 43-58.
[94] S. Tamirisakandala, R.B. Baht, J.S. Tiley, D.B. Miracle, Scripta Materialia 53
(2005) 1421-1426.
[95] E. W. Collings, Physical metallurgy of titanium alloys, ASM, Metal Park, OH,
1984.
[96] D.F. Neal, P. A. Blenkinsop, Acta Materialia 24 (1975) 59-63.
[97] A. W. Bowen, Acta Materialia 23 (1975) 1401-1409.
[98] R.J. Morrissey, D.L. McDowell, T. Nicholas, International Journal of Fatigue 21
(1999) 679-685.
[99] S.A. Namjoshi, V.K. Jain, S. Mall, Engineering Material and Technology 124
(2002) 222-228.
[100] X.P. Jiang, C.S. Man, M.J. Shepard, T. Zhai, Materials Science and Engineering
A 468-470 (2007) 137-143.
[101] H. Gray, L. Wagner, G. Lütjering, in: H. Wohlfahrt, R. Kopp, O. Vöhringer
(Eds.), Shot Peening, DGM, 1987, pp. 467-476.
[102] X.P. Jiang, C.-S. Man, M.J. Shepard, T. Zhai, Materials Science and Engineering
A 468-470 (2007) 137-143.
[103] G. Lütjering, Materials Science Engineering A 243 (1998) 32-45.
[104] P. S. Prevey, Fatigue and fracture, in: Metal Hanbook, vol 19, Metal Park, 1986,
pp. 829-853.
[105] A. Gysler, G. Lütjering, Metallurgical Transactions A 13 (1982) 1435-1443.
[106] R. Zhang, J. Kruszewski, J. Lo, Powder injection moulding international 2 (2008)
74-78.
[107] B. Weiss, R. Stickler, H. Sychra, Metal Powder Report 45 (1990) 187-192.
[108] A. Hadrboletz, B. Weiss, International Materials Reviews 42 (1997) 1-44.
[109] N. Chawla, X. Deng, Materials Science and Engineering A 390 (2005) 98-112.
REFERENCES
120
[110] N. Chawla, T.F. Murphy, K.S. Narasimhan, M. Koopman, K. K. Chawla,
Materials Science and Engineering A 308 (2001) 180-188.
[111] K.D. Christian, R. M. German, International Journal Powder Metallurgy 1 (1995)
51-61.
[112] D. E. Dieter, Mechanical Metallurgy, MCGraw-Hill, New York, 1986.
[113] A.W. Thompson, J.C. Williams, J.D. Frandsen, J. C. Chesnutt, The effect of
microstructure on the fatigue crack propagation rate in Ti-6Al-4V, in: J.C.
Williams, A. F. Belov (Eds.), Titanium and titanium alloys: sceintific and
technological aspects, Plenum Press, 1982, pp. 691-704.
[114] B. Venkatesh, D.L. Chen, S. D. Bhole, Scripta Materialia 59 (2008) 291-394.
[115] E. D. Tabachnikova, A. V. Podolskiy, V. Z. Bengus, S. N. Smirnov, M. I. Bidylo,
K. Csach, J. Miskuf, L. R. Saitova, I. P. Semenova, R. Z. Valiev, Mat. Scie. and
Eng. A (2008).
[116] R. Zhang, J. Kruszewski, J. Lo, Powder injection moulding international 2 (2008)
74-78.
[117] C. Xu, B. Weiss, G. Khatibi, H. Danninger, Ultra high cycle fatigue behaviour of
high density PM alloy steels, in: PM 2004, vol 3, EPMA, Wien, 2004, pp. 36-41.
[118] R.B. Wassenberg, O.F. Nurol, P.Beiss, Bending fatigue of a high performance
PM steel, in: PM 2004, vol 3, EPMA, Wien, 2004, pp. 133-138.
[119] S. Akaslan, S. Saritas, R.J. Causton, W.B. James, T.F. Murphy, A. Lawley, Effect
of porosity and microstructural inhomogeneities on the fatigue crack growth
response of a sinter-hardenable hybrid PM steel, in: PM 2004, vol 3, EPMA,
Wien, 2004, pp. 117-126.
[120] D.B. Lanning, T. Nicholas, G.K. Haritos, International Journal of Fatigue 27
(2005) 45-57.
[121] G.K. Haritos, T. Nicholas, D.B. Lanning, International Journal of Fatigue 21
(1999) 643-652.
[122] J. Mueller, T. Ludian, H.J. Rack, L. Wagner, Microstructural and mean stress
effects in fatigue performance of shot peened Ti-6Al-4V, in: Ti-2007 Science
and Technology, The Japan Institute of Metals, 2007, pp. 375-378.
[123] R.K. Nalla, B.L. Boyce, J.P. Campbell, J.O. Peters, R. O. Ritchie, Metallurfical
and Materials Transactions A 33 (2002) 899-918.
REFERENCES
121
[124] R.L. Barrie, T.P. Gabb, J. Telesman, P.T. Kantzos, A. Prescenzi, T. Biles, P. J.
Bonacuse, Materials Science and Engineering A 474 (2007) 71-81.
[125] N. Tsuji, S. Tanaka, T. Takasugi, Surface & Coatings Technology 203 (2009)
1400-1405.
[126] Q. Wang, H. Yin, X. Qu, J. L. Johnson, Powder Technology 193 (2009) 15-19.
[127] R. M. German, Powder Metallurgy Science, MPIF, Princeton, 1984.
[128] T.A. Kals, R. Eckstein, Journal of Materials Processing Technology 103 (2000)
95-101.
[129] L.V. Raulea, A.M. Goijaerts, L.E.K. Govaert, F. P. T. Baaijens, Journal of
Materials Processing Technology 115 (2001) 44-48.
[130] A. Kohyama, K. Hamada, H. Matsui, Journal of Nuclear Materials 179-181
(1991) 417-420.
[131] J.F. Michel, P. Picart, Journal of Materials Processing Technology 141 (2003)
439-446.
[132] K. J. Miller, W. J. O’Donnell, Fatigue and Fracture Engineering Materials and
Structure 22 (1999) 545-557.
[133] Y. Komizo, H. Terasaki, M. Ikeda, F. Nishino, M. Toudai, Fine-grained titanium
by inclusion-assisted microstructure control in: Ti-2007 Science and
Technology, 2007, pp. 741-744.
[134] S.V. Divinski, F. Hisker, T. Wilger, M. Friesel, C. Herzig, Intermetallics 16
(2008) 148-155.
[135] I. Sen, U. Ramamurty, Mechanical behaviour of B modified Ti-6Al-4V alloys, in:
Ti-2007 Science and Technology, 2007.
[136] W. Chen, C. J. Boehlert, Materials Science and Engineering A 494 (2008) 132-
138.
[137] M.J. Bermingham, S.D. McDonald, K. Nogita, D.H.ST. John, M. S. Dargusch,
Scripta Materialia 59 (2008) 538-541.
[138] P. E. Zovas, R. M. German, Metallurgical Transactions A 15 (1984) 1103-1110.
[139] D. Hill, R. Banerjee, D. Huber, J. Tiley, H. L. Fraser, Scripta Materialia (2005)
387-392.
[140] H. Feng, Y. Zhou, D. Jia, Q. Meng, Material Science and Engineering A390
(2005) 344-349.
REFERENCES
122
[141] X. Zhang, W. Lü, D. Zhang, R. Wu, Scripta Materialia 41 (1999) 39-46.
[142] S.S. Sahay, K.S. Ravichandran, R. Atri, Journal of Material Research 14 (1999)
4214-4223.
[143] Z.Y. Ma, S.C. Tjong, L. Gen, Scripta Materialia 42 (2000) 367-373.
[144] G. Wen, S.B. Li, B.S. Zhang, Z. X. Guo, Acta Materialia 49 (2001) 1463-1470.
[145] S. Tamirisakandala, R.B. Bhat, V.A. Ravi, D. B. Miracle, Journal of Metals
(2004) 60-63.
[146] R. Srinivasan, D. Miracle, S. Tamirisakandal, Materials Science and Engineering
A 487 (2008) 541-551.
[147] I. Sen, S. Tamirisakandala, D.B. Miracle, U. Ramamurty, Acta Materialia (2007)
4983-4993.
[148] T.M.T. Godfrey, A. Wisbey, P.S. Goodwin, K. Bagnall, C. M. Ward-Colse,
Materials Science and Engineering A 282 (2000) 240-250.
[149] W.O. Soboyejo, W. Shen, T. S. Srivatsan, Mechanics of Materials 36 (2004) 141-
159.
TABLES
123
Tables
Table 1 – Crystal structure, lattice parameters, and fractional coordinates in TiB and
TiB2. ................................................................................................................................ 28
Table 2. Chemical concentration of interstitial alloying element. .................................. 36
Table 3. Tensile properties of the Ti-6Al-4V ELI (ASTM Grade 23) and the MIM31L
samples. .......................................................................................................................... 37
Table 4. Microstructural features of samples sintered at a maximum temperature of
1250 °C and 1350 °C with different binder content. ...................................................... 42
Table 5. Tensile property and fracture surface analysis. ................................................ 44
Table 6. Chemical concentration of interstitial alloying element of MIM35H and
MIM35H+SP+HT samples. ............................................................................................ 53
Table 7. Microstructural features and tensile properties of MIM35H and 25MIM35L
samples. .......................................................................................................................... 57
Table 8. Microstructural features and impurity levels of MIM35H samples with and
without HIP. ................................................................................................................... 60
Table 9. Tensile properties of MIM35H with and without HIP. .................................... 60
Table 10. EDX of the fine particles and the facet regions. ............................................. 63
Table 11. Chemical concentration of interstitial alloying element of Ti-6Al-4V alloy
powder and Ti-6Al-4V alloy powder+HIP. .................................................................... 65
Table 12. Tensile properties of Powder+HIP and MIM35H samples ............................ 66
Table 13. EDX of the particle and the matrix (Fig. 71). ................................................. 69
Table 14. Microstructural features of Ti-6Al-4V-0.5B and MIM35H samples ............. 74
Table 15. Tensile properties of Ti-6Al-4V-0.5B and MIM35H. .................................... 79
TABLES
124
Table 16. Selected samples for the evaluation of the surface quality influence. ............ 88
Table 17. Selected samples for the evaluation of the shot peening ................................ 93
Table 18. Selected samples for the evaluation of the porosity influence. ...................... 95
Table 19. Selected samples for the evaluation of the grain size influence. .................... 98
FIGURES
125
Figures
Fig. 1. Figure (a) illustrates the processing route for fully lamellar microstructure, and
(b) the resultant microstructure......................................................................................... 3
Fig. 2. Figure (a) illustrates the processing route for fully equiaxed microstructure, and
(b) the resultant microstructure......................................................................................... 4
Fig. 3. Figure (a) illustrates the processing route for bi-modal microstructure, and (b)
the resultant microstructure. ............................................................................................. 5
Fig. 4. A schematic diagram of the processing steps, equipments involved and sample
configuration in powder injection moulding. ................................................................... 7
Fig. 5. A schematic comparison of the sequential feedstock flow in progressive mould
filling and jetting [22]. ...................................................................................................... 8
Fig. 6. Possible defects in a MIM component that might be noted after debinding or
sintering process [22]. .................................................................................................... 10
Fig. 7. Grain size and pore size interaction during sintering, showing the condition
where breakaway may occur [56]. .................................................................................. 12
Fig. 8. Schematic illustration of single slip system of intrusion formation [80]. ........... 15
Fig. 9. Schematic of the growth of microstructurally short cracks in a polycrystal. ...... 17
Fig. 10. High cycle fatigue behaviour of Ti-6Al-4V alloy obtained by different
processes route [85]. ....................................................................................................... 17
Fig. 11. Stroh’s model to describe quasi-cleavage facets formed in titanium alloys [88].
........................................................................................................................................ 18
Fig. 12. A schematic showing the fatigue crack initiation process along a planar slip
band due to dislocation pile-up. (d) is referring to grain size and (h) is the slip band
width [91]. ...................................................................................................................... 19
FIGURES
126
Fig. 13. Scanning electron microscope image (SE-mode) of the powder size fraction
used for the present metal injection moulding experiments. .......................................... 20
Fig. 14 – Geometry of bending fatigue specimens. Dimensions of as sintered part and
measured in millimetres.................................................................................................. 21
Fig. 15 - Geometry of “dog-bone” tensile test specimen. Dimensions of as sintered part
and measured in millimetres. .......................................................................................... 21
Fig. 16. HIP process cycle. ............................................................................................. 24
Fig. 17. Typical MIM lamellar microstructure; a) colony size; b) grain size. ......... 27
Fig. 18. Quasi-equiaxed microstructure; a) grain size, b) colony size. ................... 27
Fig. 19. Micro-tensile specimen geometry. Dimensions are in millimetres. .................. 29
Fig. 20. BSE image of the reference material microstructure (equiaxed microstructure).
........................................................................................................................................ 33
Fig. 21. S-N curve for reference materials samples with shot peening (SP). ................. 33
Fig. 22. Microstructure of MIM Ti-6Al-4V with 31 vol.% of binder and sintered at 1250
°C for two hours (MIM31L). .......................................................................................... 35
Fig. 23. Pore diameter distribution and cumulative probability for MIM31L samples.. 36
Fig. 24. Typical tensile fracture surface of MIM31L samples. Pores and dimples are
visible. ............................................................................................................................ 37
Fig. 25. S-N curves for MIM31L samples and the standard material [9]....................... 38
Fig. 26. Surface quality of MIM31L samples. ............................................................... 39
Fig. 27. Typical fracture surface of MIM31L samples. The black line indicates the
position where the crack front profile (Fig. 29) was evaluated. ..................................... 39
FIGURES
127
Fig. 28. Typical fracture surface of MIM31L samples: (a) lower magnification and (b)
higher magnification of the assumed crack initiation location. ...................................... 40
Fig. 29. Typical crack front profile of MIM31L samples. ............................................. 40
Fig. 30. Higher magnification of the crack front profile at crack nucleation site: (a) BSE
image, (b) SE image. ...................................................................................................... 41
Fig. 31. Microstructure of MIM Ti-6Al-4V with 35 vol.% of binder and sintered at 1250
°C (MIM35L). ................................................................................................................ 42
Fig. 32. Microstructure of MIM Ti-6Al-4V with 35 vol.% of binder and sintered at 1350
°C (MIM35H). ................................................................................................................ 43
Fig. 33. Pore diameter distribution and cumulative probability for MIM35L samples.. 43
Fig. 34. Pore diameter distribution and cumulative probability for MIM35H samples. 44
Fig. 35. Typical tensile fracture surface of MIM35L samples. Pores and dimples are
visible. ............................................................................................................................ 45
Fig. 36. Typical tensile fracture surface of MIM35H samples. Pores and dimples are
visible. ............................................................................................................................ 45
Fig. 37. S-N curves for MIM31L, MIM35L and MIM35H samples. ............................ 46
Fig. 38. Surface quality of the MIM35H samples. ......................................................... 47
Fig. 39. Surface quality of the MIM35L samples. ......................................................... 47
Fig. 40. Typical fracture surface of MIM35L samples. Possible crack nucleation region.
........................................................................................................................................ 47
Fig. 41. Typical fracture surface of MIM35H samples. Possible crack nucleation region.
........................................................................................................................................ 48
Fig. 42. S-N curves for MIM31L samples with and without shot penning (SP). ........... 49
Fig. 43. S-N curves for MIM35H samples with and without shot penning (SP). .......... 49
FIGURES
128
Fig. 44. Surface quality of the MIM31L samples with shot peening. ............................ 50
Fig. 45. Surface quality of the MIM35H samples with shot peening. ............................ 50
Fig. 46. Typical fracture surface of MIM31L samples. The black line indicates the
position where the crack front profile (Fig. 49) was evaluated. ..................................... 51
Fig. 47. Typical fracture surface of MIM31L samples with shot peening: (a) lower
magnification and (b) higher magnification of crack initiation location. ....................... 51
Fig. 48. Typical fracture surface of MIM31L samples (Fig. 42 with parentheses) with
shot peening and (a) lower magnification (b) higher magnification of crack initiation
location. .......................................................................................................................... 51
Fig. 49. Typical crack front profile of MIM31L samples with shot peening. ................ 52
Fig. 50. Higher magnification of the crack front profile at crack nucleation site of
MIM31L samples with shot peening, BSE image mode. ............................................... 52
Fig. 51. Typical microstructure of the MIM35H+SP+HT samples. ............................... 53
Fig. 52. S-N curve of the MIM35H, MIM35H+SP and MIM35H+SP+HT samples. .... 54
Fig. 53. Typical fracture surface of MIM35H+SP+HT samples, (a) lower magnification
(b) higher magnification of crack initiation location. ..................................................... 55
Fig. 54. Microstructure of MIM Ti-6Al-4V with 35 vol.% of binder, particle size below
25 µm and sintered at 1250 °C (25MIM35L). ................................................................ 56
Fig. 55. Pore diameter distribution and cumulative probability for 25MIM35L samples.
........................................................................................................................................ 56
Fig. 56. S-N curves for 25MIM35L and MIM35H samples. All samples were exposed
to shot peening (SP) prior to testing. .............................................................................. 58
Fig. 57. Typical fracture surface of 25MIM35L samples. ............................................. 58
FIGURES
129
Fig. 58. Typical fracture surface of 25MIM35L samples with shot peening: (a) lower
magnification and (b) higher magnification of crack initiation location. ....................... 59
Fig. 59. Microstructure of MIM35H samples after HIP process. ................................... 59
Fig. 60. Typical tensile fracture surface of MIM35H+HIP samples. An fine dimpled
structure is visible. .......................................................................................................... 61
Fig. 61. S-N curves for MIM31L and MIM35H+HIP samples. All samples were
exposed to shot peening (SP) prior to testing. ................................................................ 61
Fig. 62. BSE micrograph of a typical fracture surface of MIM+HIP samples with shot
peening. .......................................................................................................................... 62
Fig. 63. Typical fracture surface of MIM35H+HIP samples with shot peening: (a) lower
magnification and (b) higher magnification of crack initiation location. ....................... 62
Fig. 64. Typical fracture surface of MIM35H + HIP samples with shot peening at higher
magnification of crack initiation location. White arrows (a) and (b) indicated the EDX
analysed regions. ............................................................................................................ 63
Fig. 65. Microstructure of Powder+HIP samples. .......................................................... 64
Fig. 66. EBSD phase map of Powder+HIP sample: representation of the (a) BSE image,
(b) phase and (c) phase. Each colour (gray scale for copy) is related to a specific
orientation. ...................................................................................................................... 65
Fig. 67. Tensile fracture surfaces of Powder + HIP samples: (a) 10 % of plastic
elongation, (b) 17 % of plastic elongation. ..................................................................... 67
Fig. 68. Typical tensile fracture surface of the MIM35H samples (micro-tensile
specimens). ..................................................................................................................... 67
Fig. 69. S-N curves for MIM35H, MIM35H+HIP and Powder+HIP samples. All
samples were exposed to shot peening (SP) prior testing. ............................................. 68
FIGURES
130
Fig. 70. Typical fracture surface of Powder + HIP samples with shot peening: (a) lower
magnification and (b) higher magnification of crack initiation location. ....................... 68
Fig. 71. Typical fracture surface of Powder+HIP samples with shot peening. Higher
magnification at the assume crack nucleation site. The particle is highlighted by the
white line. ....................................................................................................................... 69
Fig. 72. Microstructure of Ti-6Al-4V alloy sintered at 1250 °C for two hours and 10
°C/min cooling rate. ........................................................................................................ 70
Fig. 73. Microstructure of Ti-6Al-4V-0.1B alloy sintered at 1250 °C for two hours and
10 °C/min cooling rate. ................................................................................................... 71
Fig. 74. Microstructure of Ti-6Al-4V-0.5B alloy sintered at 1250 °C for two hours and
10 °C/min cooling rate. ................................................................................................... 71
Fig. 75. Relative densification of Ti-6Al-4V alloy with and without addition 0.5 wt.% of
boron at two different maximum sintering temperatures: 1250 °C and 1400 °C. .......... 72
Fig. 76. Dilatometry of Ti-6Al-4V and Ti-6Al-4V-0.5B alloys: a) linear shrinkage (LS)
and b) linear shrinkage rate (LSR). Starting acquisition data at 75 °C. ......................... 73
Fig. 77. Microstructure of Ti-6Al-4V-0.5B alloy sintered at 1400 °C for two hours a
cooling rate of 10 °C/min. .............................................................................................. 74
Fig. 78. Pore diameter distribution and cumulative probability for Ti-6Al-4V-0.5B
samples. .......................................................................................................................... 75
Fig. 79. EBSD phase map of Ti-6Al-4V-0.5B sintered at 1400 °C: representation of the
(a) BSE image, (b) phase, (c) phase and (d) TiB particles. Each colour (gray scale
for copy) is related to a specific orientation. .................................................................. 76
Fig. 80. High magnification EBSD phase map for Ti-6Al-4V-0.5B sintered at 1400 °C.
(a) BSE image, (b) phase. ........................................................................................... 76
Fig. 81. Electron backscattered diffraction patterns obtained from TiB particles in Ti-
6Al-4V-0.5B alloy. a) EBSD pattern, b) indexed EBSD pattern. .................................. 77
FIGURES
131
Fig. 82. Pole figures of the phases presented in Fig. 79. (a) phase, (b) phase and (c)
TiB particles. .................................................................................................................. 77
Fig. 83. EBSD phase map of Ti-6Al-4V sintered at 1400 °C: representation of the (a)
BSE image, (b) phase and (c) phase. Each colour (gray scale for copy) is related to
a specific orientation. ...................................................................................................... 78
Fig. 84. Typical tensile fracture surface of Ti-6Al-4V-0.5B. Fine and coarse dimpled
structures and pores are visible. Additionally, broken and debound TiB particles are
indicated by the white arrows. ........................................................................................ 79
Fig. 85. S-N curves for MIM35H, MIM35H+HIP and Ti-6Al-4V-0.5B alloy. All
samples were exposed to shot peening (SP) prior to testing. ......................................... 80
Fig. 86. Typical BSE micrograph of the fracture surface. The black line indicates the
approximately position where the crack front profile (Fig. 88) was evaluated. ............. 81
Fig. 87. Typical fracture surface of Ti-6Al-4V-0.5B with shot peening at the assumed
crack nucleation site. ...................................................................................................... 81
Fig. 88. Typical crack front profile of Ti-6Al-4V-0.5B samples ................................... 82
Fig. 89. High magnification of the crack front profile (Fig. 88). Directed at the assumed
crack nucleation site. ...................................................................................................... 82
Fig. 90. Crack propagation interaction with TiB particle. .............................................. 83
ABBREVIATIONS INDEX
132
Abbreviations index
BSE Backscattering electrons image mode
CIM Ceramic injection moulding
EBSD Electron backscattering diffraction
EBSPs Electron backscattering diffraction Kikuchi patterns
EDX Energy dispersive X-ray spectroscopy
ELI Extra low interstitial
EVA Polyethylene vinyl acetate
HDH Hydride-dehydride Ti powders
HIP Hot isostatic pressing
LEFM Linear elastic fracture mechanics
LS Linear shrinkage
LSR Linear shrinkage rate
MIM Metal injection moulding
MFM Microstructure fracture mechanics
O(Eq.) Equivalent oxygen
OPS Struers oxide polish suspension
PIM Powder injection moulding
PM Powder metallurgy
SE Secondary electron image mode
SEM Scanning electron microscopy
SP Shot peening
y Yield strength
UTS Ultimate tensile strength
133
Curriculum Vitae
Name: Orley Milagres Ferri
Address: Bahnstraße 49, 21502 Geesthacht, Germany
Email: [email protected]
Date of birth 22.04.1981
Place of birth: Belo Horizonte, MG, Brasil
1999-2004 Graduation in Materials Engineering
Federal University of Santa Catarina, UFSC, Santa Catarina, Brazil
Thesis (Diplomarbeiten): Energy Balance of Electric Arc Furnaces
Supervisors: Dr. Ing. Andreas Opfermann, and Professor, Dr. Ing.
Berend Snoeijer
2004-2006 Master of Science at Technische Universität Hamburg-Harburg
Erasmus Mundus scholarship granted by EMMS (Joint European
Masters in Materials Science)
Master Thesis: Effect of Periodic Overloads on Fatigue Crack
Propagation in Ti-6Al-4V
Supervisors: Professor Dr. Joachim Albrecht, and Dr. Ing.
Jens Heidemann
2006-2010 Research Assistant at GKSS Research Center
Topic of doctoral thesis: Optimisation of fatigue behavior of Ti-6Al-
4V alloy components fabricated by Metal Injection Moulding
(MIM)
Supervisor: Professor Dr. Rüdiger Bormann
Actual Position: Engineer at Volkswagen AG, Baunatal, Germany


![of Ti 6Al 4V Ti 6Al 4V 1B for FRIB beam dumppuhep1.princeton.edu/mumu/target/FRIB/amroussia_112613.pdfTi-6Al-4V vs Ti-6Al-4V-1B Alloy Ti‐6Al‐4V Ti‐6Al‐4V‐1B E [GPa] At RT](https://static.fdocuments.net/doc/165x107/5eb2d6d755eb4c7aaa54e97d/of-ti-6al-4v-ti-6al-4v-1b-for-frib-beam-ti-6al-4v-vs-ti-6al-4v-1b-alloy-tia6ala4v.jpg)