
Investigating the Validity of Acoustic Spectrum as a...
9
Energy and Power Engineering, 2015, 7, 575-583 Published Online December 2015 in SciRes. http://www.scirp.org/journal/epe http://dx.doi.org/10.4236/epe.2015.713054 How to cite this paper: Kotb, A. and Abdulaziz, A.M. (2015) Investigating the Validity of Acoustic Spectrum as a Prediction Tool for Pump Cavitation. Energy and Power Engineering, 7, 575-583. http://dx.doi.org/10.4236/epe.2015.713054 Investigating the Validity of Acoustic Spectrum as a Prediction Tool for Pump Cavitation Ashraf Kotb, Abdulaziz Morgan Abdulaziz Department of Mechanical Power Engineering, Faculty of Engineering, Ain Shams University, Cairo, Egypt Received 18 September 2015; accepted 12 December 2015; published 15 December 2015 Copyright © 2015 by authors and Scientific Research Publishing Inc. This work is licensed under the Creative Commons Attribution International License (CC BY). http://creativecommons.org/licenses/by/4.0/ Abstract Cavitation in pumps causes destructive consequences; it must be detected and prevented. The aim of the present work is investigating the validity of sound spectrum as a prediction tool for pump cavitation. Results showed that; for the discrete frequencies of RF = 47.5 Hz, and BPF = 285 Hz and its second, third, and fourth harmonics of 570 Hz, 855 Hz, and 1140 Hz respectively; there are no great variations in the noise signal for the cavitation and non-cavitation conditions. For the dis- crete frequency of 147 Hz, there is also no great variation in the noise signal at this frequency. The only apparent result is that; the occurrence of cavitation results high energy noise signals at high frequencies from 1000 Hz to 10000 Hz. The absence of any discrete frequency to be monitored makes the sound spectrum not valid as a prediction tool for cavitation in the pumps. Keywords Centrifugal Pump, Cavitation, Acoustic, Blade Passing Frequency 1. Introduction It is expected that all pumps are subjected to cavitation. It occurs when the static pressure at the suction port or through the impeller falls below the saturation pressure corresponds to the fluid temperature. Pressure is reduced due to many aspects; one of the inherent aspects is the inlet guide vanes. At prewhirl angle of 24˚, inlet guide vanes cause pressure drop of 7.6% at the suction pipe inlet [1]. Wherever the pressure falls, the fluid starts to flash and evaporate with the onset of bubbles where their num- ber and size depend mainly on the value of pressure. The bubbles travel with the fluid flow and collapse when- ever reach a point of high pressure at the blade surface. This collapse causes pressure fluctuation with maximum
Transcript of Investigating the Validity of Acoustic Spectrum as a...

Energy and Power Engineering, 2015, 7, 575-583 Published Online December 2015 in SciRes. http://www.scirp.org/journal/epe http://dx.doi.org/10.4236/epe.2015.713054
How to cite this paper: Kotb, A. and Abdulaziz, A.M. (2015) Investigating the Validity of Acoustic Spectrum as a Prediction Tool for Pump Cavitation. Energy and Power Engineering, 7, 575-583. http://dx.doi.org/10.4236/epe.2015.713054
Investigating the Validity of Acoustic Spectrum as a Prediction Tool for Pump Cavitation Ashraf Kotb, Abdulaziz Morgan Abdulaziz Department of Mechanical Power Engineering, Faculty of Engineering, Ain Shams University, Cairo, Egypt
Received 18 September 2015; accepted 12 December 2015; published 15 December 2015
Copyright © 2015 by authors and Scientific Research Publishing Inc. This work is licensed under the Creative Commons Attribution International License (CC BY). http://creativecommons.org/licenses/by/4.0/
Abstract Cavitation in pumps causes destructive consequences; it must be detected and prevented. The aim of the present work is investigating the validity of sound spectrum as a prediction tool for pump cavitation. Results showed that; for the discrete frequencies of RF = 47.5 Hz, and BPF = 285 Hz and its second, third, and fourth harmonics of 570 Hz, 855 Hz, and 1140 Hz respectively; there are no great variations in the noise signal for the cavitation and non-cavitation conditions. For the dis-crete frequency of 147 Hz, there is also no great variation in the noise signal at this frequency. The only apparent result is that; the occurrence of cavitation results high energy noise signals at high frequencies from 1000 Hz to 10000 Hz. The absence of any discrete frequency to be monitored makes the sound spectrum not valid as a prediction tool for cavitation in the pumps.
Keywords Centrifugal Pump, Cavitation, Acoustic, Blade Passing Frequency
1. Introduction It is expected that all pumps are subjected to cavitation. It occurs when the static pressure at the suction port or through the impeller falls below the saturation pressure corresponds to the fluid temperature. Pressure is reduced due to many aspects; one of the inherent aspects is the inlet guide vanes. At prewhirl angle of 24˚, inlet guide vanes cause pressure drop of 7.6% at the suction pipe inlet [1].
Wherever the pressure falls, the fluid starts to flash and evaporate with the onset of bubbles where their num-ber and size depend mainly on the value of pressure. The bubbles travel with the fluid flow and collapse when-ever reach a point of high pressure at the blade surface. This collapse causes pressure fluctuation with maximum

A. Kotb, A. M. Abdulaziz
576
amplitude at the blade leading edge for cavitation flow is 2.54 times larger than that for non-cavitation flow, under large discharge, the magnification on the maximum pressure amplitude is 1.6 [2].
Cavitation causes destructive consequences as results of pressure fluctuation, audible sound, and vibration. It is associated with a non-recoverable degradation of the hydraulic performance, impeller pitting, and material erosion. Therefore cavitation in pumps must be detected and prevented.
There are several methods for detecting the incipient of cavitation; determination of the net positive suction head at a constant speed and flowrate, visualization of the inlet flow at the impeller eye, paint erosion on impel-ler blades, static pressure measurement in the flow, vibration and acoustic measurements.
Cavitation detection by acoustic measurements is based on understanding the sources of the generated noise from the pump.
Mechanical sources of noise include vibration of pump components as a result of; pressure variations through the pump flow passages, defective components such as impeller, seal rubs, bearings, unbalanced impellers, im-proper installation of pump driver and misalignment.
Hydraulic sources of noise include both the transient and instationarity of flow causes; Transients; during the startup and shutdown of the pump, opening or closing of servicing valves may cause severe pressure waves (water hammer) with high intensity of noise levels. Instationarity of flow; as a result of asymmetric outgoing flow of the impeller due to secondary flows in the rotating impeller, number of vanes and thickness which cause a notch in the wake flow, guide vanes and tongue in the pump casing. The instationarity of flow is a combina-tion of both the effect of pressure pulsations and turbulence. Pressure pulsations depend on the design of impel-ler, diffuser, operating parameters, and the distance between impeller and the volute tongue. Turbulence induces vortices and wakes in the clearance between the impeller vane tips and the diffuser or volute lips. Pressure pul-sations produced in this way impinge on the impeller and result in shaft vibrations and noise over a wide fre-quency range.
Also, the noise generated from the pump cavitation depends on the fluid temperature in the range from 80˚C and 280˚C for water [3].
In the case of pump cavitation, random, high frequency broadband energy, which is sometimes superimposed with the blade passing frequency harmonics are generated, the cavitation noise having a characteristic crackling or hissing noise.
Acoustic measurements in the audible range are rarely used as an engineering method, as the total noise level depends on the design and type of the pump, installation, mechanical auxiliaries, operating conditions, and strength of cavitation.
Using the noise to detect the cavitation in pumps is well known but limited on the high frequency range of ul-trasound (above 20 kHz), while the noise is measured inside the pump. In the audible frequency range (from 20 Hz to 20 kHz), studies of cavitation noise are still in development stage with much care of the filtering out with the rotational frequency and harmonics.
Many researchers measured and analyzed the noise spectrum and paid attention to the background noise as a trial to find a specific discrete frequency(s) at which the noise level is varied as a result of cavitation.
For 5 kW pumping set with six semi-open impellers, Cudina found at 147 Hz, there is 12 and 20 dB differ-ence in the noise level between the incipient and fully developed cavitation, with recommendations of using the 147 Hz sound signal as a cavitation detector [4] [5].
For three pumping sets, centrifugal pump with six semi-open impellers, chemical centrifugal pump with six closed impellers, and water mixed-flow pump with five semi-open rotor blades. Cudina and Prezelj measured the noise at discrete frequencies in the audible range to detect the incipient and fully developed cavitation in pump. They found great enough difference in the noise level between the two conditions for various distance between the microphone and the pump, where they found a great difference in noise peak at the discrete fre-quency of 147 Hz [6] [7].
For two centrifugal pumps, the metal alloy one has six blades closed impeller and the plastic one has six blades semi-open impeller. Cernetic et al. found the discrete frequency for the plastic one at 148 Hz [8].
For closed impeller and semi-open impeller, Cernetic tested two the different centrifugal pumps and found that; the convenient range of frequency for cavitation detection is above 1000 Hz [9].
The research in this field extends to consider different measuring techniques and instrumentation, V. Bull et al. used a fiber-optic hydrophone to detect the acoustic emissions over frequency range of 15 - 20 MHz [10]. Antonio Baldassarre et al. used image processing for visual analysis of cavitation conditions [11].

A. Kotb, A. M. Abdulaziz
577
It is noted from the literature survey that; most of researchers focused on the values of the discrete frequencies at which the noise signal has great variation between the cavitation and non-cavitation conditions. This will lead to a recommendation of monitoring the noise generated from the pump at these discrete frequencies as a predic-tion tool for the cavitation inception. The main thrust of the present work is measuring and analyzing the sound spectrum for centrifugal pump under cavitation and non-cavitation conditions for five cases while the pump discharge and pump rotational speed are kept constant. It is an attempt to declare the validity of sound spectrum as a prediction tool for pump cavitation.
2. Theoretical Background The static pressure along a stream line is governed by Bernoulli equation, Equation (1), where it decreases as a result of increasing the velocity.
Figure 1 shows a schematic distribution of the pressure along the pump impeller where it has a minimum value somewhere at the impeller eye. Cavitation Occurs when the pressure falls below the vapor pressure.
2
constant2
sp c z Hg gρ+ + + = (1)
Net Positive Suction Head (NPSHA) is defined as the available total suction head at the pump inlet above the head corresponding to the vapor pressure at that temperature.
2
ANPSH2
s v sp p cg gρ−
= + (2)
NPSHR equals NPSHA when the pump head deteriorates by 3% from the main characteristic curve. Thoma cavitation number is defined by
ANPSHH
σ = (3)
When the investigation of cavitation extends to different pump discharges, the total head will not be constant. During this investigation it is therefore considered more appropriate to propose a new parameter called the cavi-tation strength parameter:
R A
R
NPSH NPSH%
NPSHξ
−= (4)
During cavitation, bubbles are formed in a low pressure media. As the fluid moves through the impeller blades, the pressure is increased by the amount of energy added. At a certain pressure level the bubbles collapse near the wall producing large range of sound spectrum which can be sensed by acoustic sensor in the time do-main. Integration of the acoustic amplitude with time would give the overall sound level. To correlate sound le-vels with cavitation only, other factors must be eliminated.
To get a minimum vibration causes with the associated sound level, the flow must be tangent to the impeller blades at pump inlet. The design blade angle at the design flow rate is β1 which corresponds to the flow velocity at the blade inlet, c1. Referring to Figure 2(a) and Figure 2(b), as the inlet flow velocity increases, c1
\, there will be a shift angle ∆β1 for the flow relative velocity, w1
\, at blade entrance. This will increase the vibration causes.
Figure 1. Schematic distribution of the static pressure along the pump im-peller.
No-cavitation Cavitation
Suction Eye Discharge
Vaporpressure
Suction Eye Discharge
Pres
sure

A. Kotb, A. M. Abdulaziz
578
(a) (b)
Figure 2. (a) Velocity triangles at the impeller inlet and outlet, (b) impeller blade inlet velocity triangle at two discharges. http://lib.convdocs.org/docs/index-126442.html?page=5.
Therefore, there will be a combined effect of both cavitation and flow inlet velocity on the sound level.
Analyzing the time-base acoustic signal with fast Fourier transform separates the discreet frequencies indica-tive to cavitation and other rotational effects. The impeller of a typical centrifugal pump has number of blades that rotates inside a volute casing. Each time any blade passes an arbitrary point on the pump, it generates small disturbance in the flow and consequently produces a pulse of vibration at the discreet frequency called blade passing frequency, BPF. This frequency is equal to the impeller rotational speed multiplied by the number of blades.
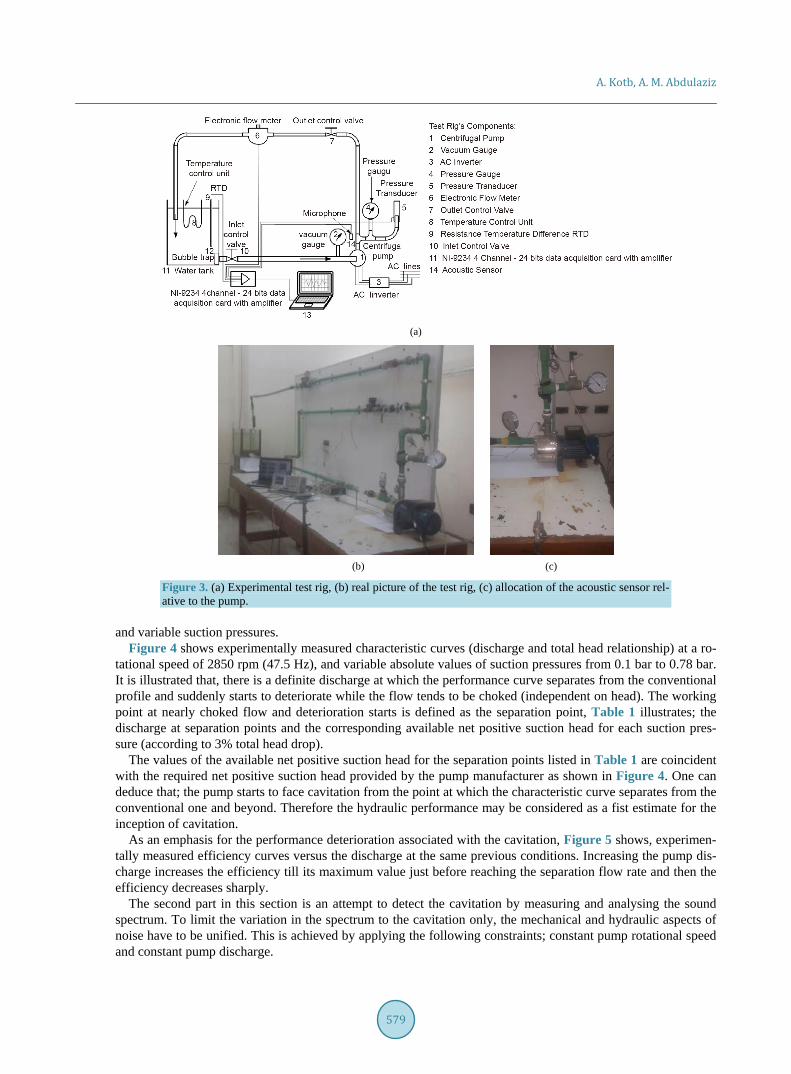
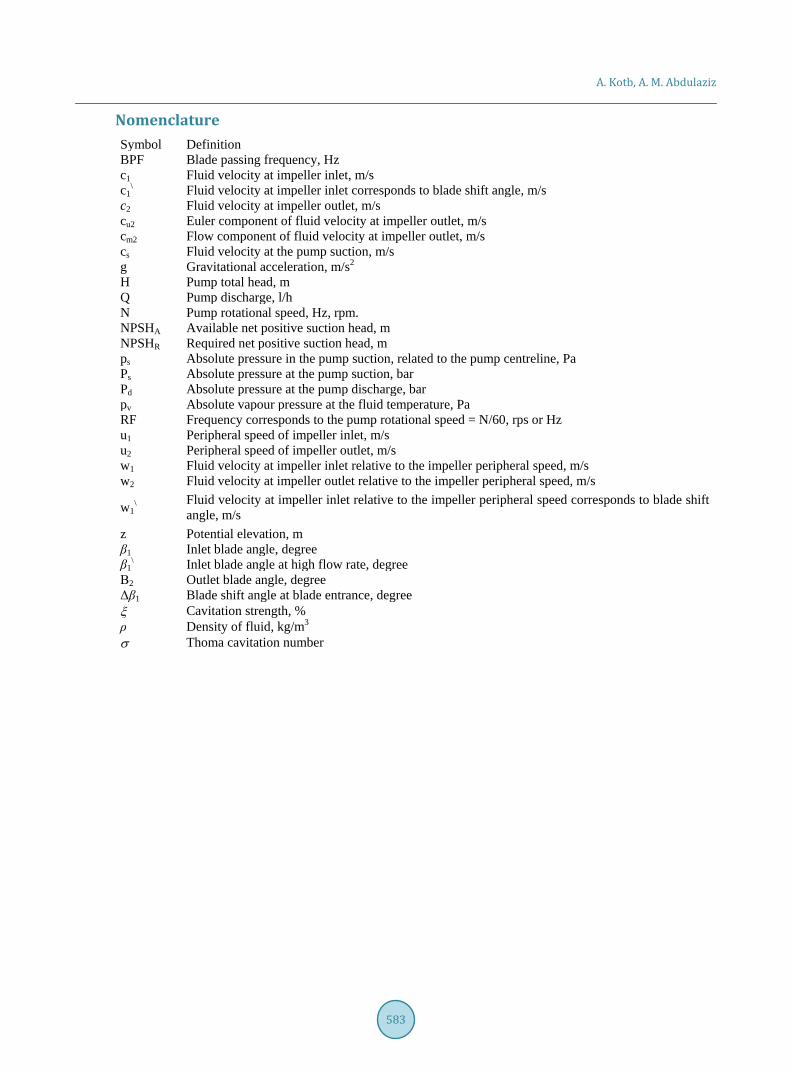
3. Materials and Methods The test rig in accordance with ISO 3555 and BS EN ISO 9906/2000 [12] specifications for acceptance tests for centrifugal, mixed flow and axial pumps Class B tests is shown in Figure 3(a), Figure 3(b). It is a closed loop water circuit composed of a pump, a tank, connecting PVC pipes and regulating valves. The pump rotational speed is precisely controlled with an electronic inverter within 0.1 Hz resolution. The test rig is provided with a set of measuring instrumentation for different variables. Water flow rate is measured by a pre-calibrated elec-tromagnetic flow meter. The upstream and downstream pressures are measured by pre-calibrated dial gauges with additional pressure transducer; Keller Pa 21 SR, to record the downstream pressure. The sound measure-ments are made by GRAS free-field microphone type 46 AE, place 50 cm from the pump in the plane parallel to the pump axis as shown in Figure 3(c). The microphone band width is 3.5:20,000 Hz with uncertainty of ±0.06 dB at the test frequency 250 Hz. All measurements are acquired to a PC via the very specialized NI 9234 data acquisition card. Lab View software is used to simultaneously record the mass flow rate, downstream pressure, and sound levels. The software performs Fast Fourier Transform calculations.
The maximum uncertainty in measuring the mass flow rate as repeated 14 times for each test case is 0.5%. The microphone band width is 0.3 - 15000 Hz with maximum deviation of ±2.5%. The pressure transducer ac-curacy is ±0.5 of full scale. Data acquisition is performed by an NI 9234 card of 4 channels, 24 bits with ampli-fying capability. The sampling frequency is 52.2 kHz for each channel.
Measurements of sound are taken with 52.2 k sample at one second. The data are analyzed by FFT. The mea-surements are repeated 30 times for the same run and the scheme of peak-hold is applied. Meanwhile the instan-taneous volume flow rate and the downstream pressure are continuously acquired and averaged for the 30 second run. All measurements are, therefore, taken simultaneously. The raw and processed data are then stored in an Excel file sheet.
4. Results and Discussion The first part in this section is attempt to use the hydraulic characteristics, and efficiency of a centrifugal pump to pre-detect the occurrence and strength of cavitation (inception, medium, or sever) at constant rotational speed
w1\ w1
c1
u1
c1\
β1 β1\
A. Kotb, A. M. Abdulaziz
579
(a)
(b) (c)
Figure 3. (a) Experimental test rig, (b) real picture of the test rig, (c) allocation of the acoustic sensor rel-ative to the pump.
and variable suction pressures.
Figure 4 shows experimentally measured characteristic curves (discharge and total head relationship) at a ro-tational speed of 2850 rpm (47.5 Hz), and variable absolute values of suction pressures from 0.1 bar to 0.78 bar. It is illustrated that, there is a definite discharge at which the performance curve separates from the conventional profile and suddenly starts to deteriorate while the flow tends to be choked (independent on head). The working point at nearly choked flow and deterioration starts is defined as the separation point, Table 1 illustrates; the discharge at separation points and the corresponding available net positive suction head for each suction pres-sure (according to 3% total head drop).
The values of the available net positive suction head for the separation points listed in Table 1 are coincident with the required net positive suction head provided by the pump manufacturer as shown in Figure 4. One can deduce that; the pump starts to face cavitation from the point at which the characteristic curve separates from the conventional one and beyond. Therefore the hydraulic performance may be considered as a fist estimate for the inception of cavitation.
As an emphasis for the performance deterioration associated with the cavitation, Figure 5 shows, experimen-tally measured efficiency curves versus the discharge at the same previous conditions. Increasing the pump dis-charge increases the efficiency till its maximum value just before reaching the separation flow rate and then the efficiency decreases sharply.
The second part in this section is an attempt to detect the cavitation by measuring and analysing the sound spectrum. To limit the variation in the spectrum to the cavitation only, the mechanical and hydraulic aspects of noise have to be unified. This is achieved by applying the following constraints; constant pump rotational speed and constant pump discharge.

A. Kotb, A. M. Abdulaziz
580
Figure 4. Pump characteristics at variable suction pressures.
Table 1. Separation point and NPSHA.
Suction Pressure bar (abs) Discharge L/hr NPSHA m
0.78 2390 6.71
0.72 2110 6.25
0.65 1970 5.6
0.46 1475 3.87
0.38 1240 3.13
0.29 1160 2.23
0.23 956 1.67
0.18 707 1.21
0.1 515 0.43
Figure 5. Pump efficiency at variable suction pressures.
In compliance with the above constraints, Figure 6 shows various sound spectrums up to 10 kHz, for five
different operating cases. Each case is obtained for no-cavitation and cavitation condition at the same pump dis-
0
5
10
15
20
25
30
35
40
45
50
0 500 1000 1500 2000 2500 3000
Tota
l Hea
d, m
Discharge, L/h
N=2850 rpm0.780.720.650.460.380.290.230.180.1
Suction Pressure, bar-abs.
NPSHR
0
0.05
0.1
0.15
0.2
0.25
0.3
0 500 1000 1500 2000 2500 3000
Effic
ienc
y
Discharge, L/h
N=2850 rpm0.78 0.72 0.650.46 0.38 0.290.23 0.18 0.1
Suction Pressure, bar-abs.

A. Kotb, A. M. Abdulaziz
581
Figure 6. Sound level spectrums for non-cavitation and cavitation conditions.
charge and pump rotational speed.
Investigation the sound spectrums over the measured frequency range (10000 Hz), it is deduced for the dis-crete frequencies of RF = 47.5 Hz, and BPF = 285 Hz and its second, third, and fourth harmonics of 570 Hz, 855 Hz, and 1140 Hz respectively that; there are no great variations in the noise signal at these discrete frequencies for the cavitation and non-cavitation conditions.
Also, for the discrete frequency of 147 Hz that is mentioned in the survey as cavitation’s characteristic there is no great variation in the noise signal at this frequency.
The only apparent result is that; the occurrence of cavitation results high energy signals at high frequencies from 1000 Hz to 10,000 Hz.
The current question arises from this study, is the sound spectrum valid as a prediction tool for pump cavita-tion?
The absence of any discrete frequency to be monitored, the sound spectrum is not valid as a prediction tool for cavitation in the pumps.
5. Conclusions For a centrifugal pump runs at constant speed of 2850 rpm and variable absolute values of suction pressures from 0.1 bar to 0.78 bar, the following remarks could be concluded:
1) Sudden deterioration in the hydraulic characteristics associated with a decrease in the efficiency is a detec-

A. Kotb, A. M. Abdulaziz
582
tor for the cavitation inception. 2) Pump flow rate is almost chocked at the cavitating operating conditions. 3) At the discrete frequencies of RF = 47.5, and BPF = 285 Hz and its second, third, and fourth harmonics of
570 Hz, 855 Hz, and 1140 Hz; there are no great variations in the noise signal for cavitation and non-cavitation conditions.
4) For the discrete frequency of 147 Hz, there is no great variation in the noise signal at this frequency. 5) The occurrence of cavitation results high energy noise signals at high frequencies from 1000 Hz to 10,000 Hz. 6) The absence of any discrete frequency to be monitored makes the sound spectrum not valid as a prediction
tool for cavitation in the pumps.
References [1] Tan, L., Zhu, B.S., Cao, S.L., et al. (2014) Influence of Prewhirl Regulation by Inlet Guide Vanes on Cavitation Per-
formance of a Centrifugal Pump. Energies, 7, 1050-1065. http://dx.doi.org/10.3390/en7021050 [2] Tan, L., Zhu, B.S., Cao, S.L., et al. (2014) Numerical Simulation of Unsteady Cavitation Flow in a Centrifugal Pump
at Off-Design Conditions. Proceedings of the Institution of Mechanical Engineers, Part C: Journal of Mechanical En-gineering Science, 228, 1994-2006. http://dx.doi.org/10.1177/0954406213514573
[3] Kudirka, A.A. and DeCoster, M.A. (1979) Jet Pump Cavitation with Ambient and High Temperature Water. Journal of Fluids Engineering, 101, 93-99. http://dx.doi.org/10.1115/1.3448741
[4] Cudina, M. (2003) Detection of Cavitation Phenomenon in a Centrifugal Pump Using Audible Sound. Mechanical Systems and Signal Processing, 17, 1335-1347. http://dx.doi.org/10.1006/mssp.2002.1514
[5] Cudina, M. (2003) Noise as an Indicator of Cavitation in a Centrifugal Pump. Acoustical Physics, 49, 463-474. From Akusticheski Ï Zhurnal, 49, 551-564.
[6] Cudina, M. and Prezelj, J. (2009) Detection of Cavitation in Operation of Kinetic Pumps. Use of Discrete Frequency Tone in Audible Spectra. Applied Acoustics, 70, 540-546. http://dx.doi.org/10.1016/j.apacoust.2008.07.005
[7] Cudina, M. and Prezelj, J. (2009) Detection of Cavitation in Situ Operation of Kinetic Pumps: Effect of Cavitation on the Characteristic Discrete Frequency Component. Applied Acoustics Applied Acoustics, 70, 1175-1182. http://dx.doi.org/10.1016/j.apacoust.2009.04.001
[8] Cernetic, J., Prezelj, J. and Cudina, M. (2008) Use of Noise and Vibration Signal for Detection and Monitoring of Ca-vitation in Kinetic Pumps. The Journal of the Acoustical Society of America, 123, 3316. http://dx.doi.org/10.1121/1.2933777
[9] Cernetic, J. (2009) The Use of Noise and Vibration Signals for Detecting Cavitation in Kinetic Pumps. Proceedings of the Institution of Mechanical Engineers, Part C: Journal of Mechanical Engineering Science, 223, 1645-1655. http://dx.doi.org/10.1243/09544062JMES1404
[10] Bull, V., Civale, J., Rivens, I. and ter Haar, G.R. (2011) Cavitation Detection Using a Fibre Optic Hydrophone: A Pilot Study. AIP Conference Proceedings, 1359, 85. http://dx.doi.org/10.1063/1.3607887
[11] Baldassarre A., De Lucia, M. and Nesi, P. (1998) Real-Time Detection of Cavitation for Hydraulic Turbomachines. Real-Time Imaging, 4, 403-416.
[12] BS 5316-2:1977, ISO 3555:1977 and BS EN ISO 9906:2000. Specification for Acceptance Tests for Centrifugal, Mixed Flow and Axial Pumps. Class B Tests, MCE/6. BSI.
A. Kotb, A. M. Abdulaziz
583
Nomenclature Symbol Definition BPF Blade passing frequency, Hz c1 Fluid velocity at impeller inlet, m/s c1
\ Fluid velocity at impeller inlet corresponds to blade shift angle, m/s c2 Fluid velocity at impeller outlet, m/s cu2 Euler component of fluid velocity at impeller outlet, m/s cm2 Flow component of fluid velocity at impeller outlet, m/s cs Fluid velocity at the pump suction, m/s g Gravitational acceleration, m/s2 H Pump total head, m Q Pump discharge, l/h N Pump rotational speed, Hz, rpm. NPSHA Available net positive suction head, m NPSHR Required net positive suction head, m ps Absolute pressure in the pump suction, related to the pump centreline, Pa Ps Absolute pressure at the pump suction, bar Pd Absolute pressure at the pump discharge, bar pv Absolute vapour pressure at the fluid temperature, Pa RF Frequency corresponds to the pump rotational speed = N/60, rps or Hz u1 Peripheral speed of impeller inlet, m/s u2 Peripheral speed of impeller outlet, m/s w1 Fluid velocity at impeller inlet relative to the impeller peripheral speed, m/s w2 Fluid velocity at impeller outlet relative to the impeller peripheral speed, m/s
w1\ Fluid velocity at impeller inlet relative to the impeller peripheral speed corresponds to blade shift
angle, m/s z Potential elevation, m β1 Inlet blade angle, degree β1
\ Inlet blade angle at high flow rate, degree Β2 Outlet blade angle, degree Δβ1 Blade shift angle at blade entrance, degree ξ Cavitation strength, % ρ Density of fluid, kg/m3 σ Thoma cavitation number


![Visualization of Unsteady Behavior of Cavitation in ... · cavitation state, transition-cavitation state, and super-cavitation state in the orifice throat [5]. Under relative high](https://static.fdocuments.net/doc/165x107/5b4f673e7f8b9a166e8c4c74/visualization-of-unsteady-behavior-of-cavitation-in-cavitation-state-transition-cavitation.jpg)