Investigating the Limits of AVF Analysis in the …yiorgos.makris/papers/iolts13a.pdf ·...
6
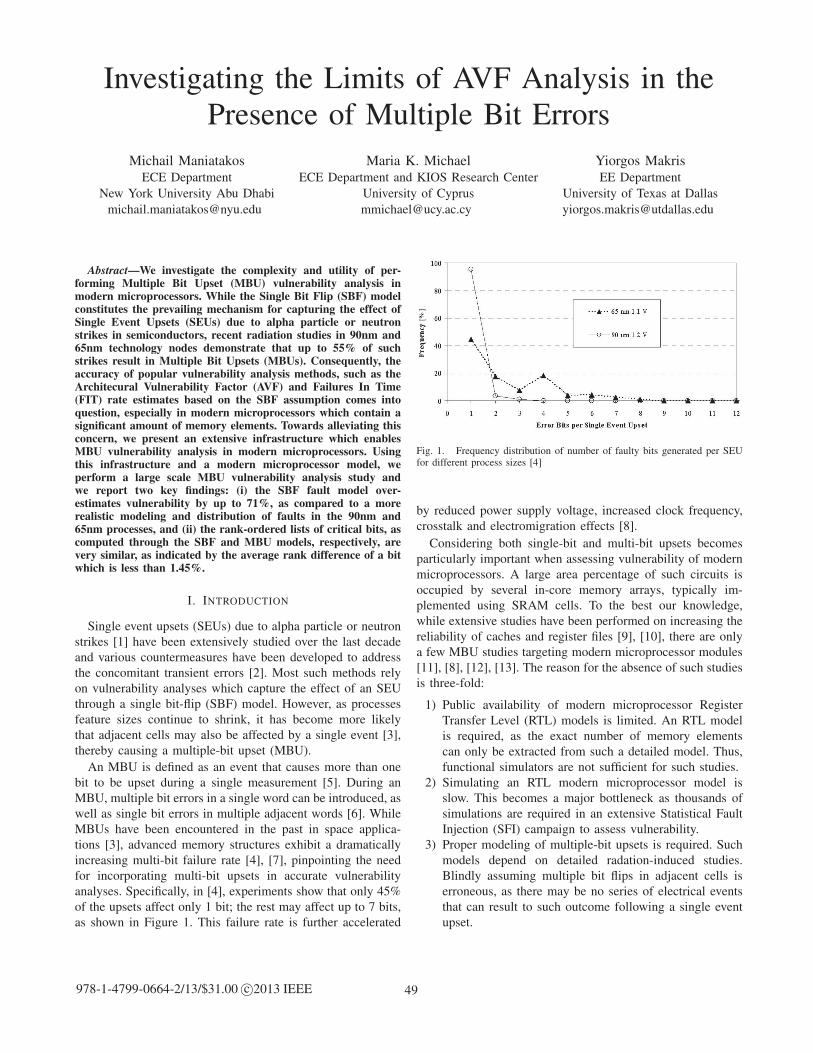
Investigating the Limits of AVF Analysis in the Presence of Multiple Bit Errors Michail Maniatakos ECE Department New York University Abu Dhabi [email protected] Maria K. Michael ECE Department and KIOS Research Center University of Cyprus [email protected] Yiorgos Makris EE Department University of Texas at Dallas [email protected] Abstract—We investigate the complexity and utility of per- forming Multiple Bit Upset (MBU) vulnerability analysis in modern microprocessors. While the Single Bit Flip (SBF) model constitutes the prevailing mechanism for capturing the effect of Single Event Upsets (SEUs) due to alpha particle or neutron strikes in semiconductors, recent radiation studies in 90nm and 65nm technology nodes demonstrate that up to 55% of such strikes result in Multiple Bit Upsets (MBUs). Consequently, the accuracy of popular vulnerability analysis methods, such as the Architecural Vulnerability Factor (AVF) and Failures In Time (FIT) rate estimates based on the SBF assumption comes into question, especially in modern microprocessors which contain a significant amount of memory elements. Towards alleviating this concern, we present an extensive infrastructure which enables MBU vulnerability analysis in modern microprocessors. Using this infrastructure and a modern microprocessor model, we perform a large scale MBU vulnerability analysis study and we report two key findings: (i) the SBF fault model over- estimates vulnerability by up to 71%, as compared to a more realistic modeling and distribution of faults in the 90nm and 65nm processes, and (ii) the rank-ordered lists of critical bits, as computed through the SBF and MBU models, respectively, are very similar, as indicated by the average rank difference of a bit which is less than 1.45%. I. I NTRODUCTION Single event upsets (SEUs) due to alpha particle or neutron strikes [1] have been extensively studied over the last decade and various countermeasures have been developed to address the concomitant transient errors [2]. Most such methods rely on vulnerability analyses which capture the effect of an SEU through a single bit-flip (SBF) model. However, as processes feature sizes continue to shrink, it has become more likely that adjacent cells may also be affected by a single event [3], thereby causing a multiple-bit upset (MBU). An MBU is defined as an event that causes more than one bit to be upset during a single measurement [5]. During an MBU, multiple bit errors in a single word can be introduced, as well as single bit errors in multiple adjacent words [6]. While MBUs have been encountered in the past in space applica- tions [3], advanced memory structures exhibit a dramatically increasing multi-bit failure rate [4], [7], pinpointing the need for incorporating multi-bit upsets in accurate vulnerability analyses. Specifically, in [4], experiments show that only 45% of the upsets affect only 1 bit; the rest may affect up to 7 bits, as shown in Figure 1. This failure rate is further accelerated Fig. 1. Frequency distribution of number of faulty bits generated per SEU for different process sizes [4] by reduced power supply voltage, increased clock frequency, crosstalk and electromigration effects [8]. Considering both single-bit and multi-bit upsets becomes particularly important when assessing vulnerability of modern microprocessors. A large area percentage of such circuits is occupied by several in-core memory arrays, typically im- plemented using SRAM cells. To the best our knowledge, while extensive studies have been performed on increasing the reliability of caches and register files [9], [10], there are only a few MBU studies targeting modern microprocessor modules [11], [8], [12], [13]. The reason for the absence of such studies is three-fold: 1) Public availability of modern microprocessor Register Transfer Level (RTL) models is limited. An RTL model is required, as the exact number of memory elements can only be extracted from such a detailed model. Thus, functional simulators are not sufficient for such studies. 2) Simulating an RTL modern microprocessor model is slow. This becomes a major bottleneck as thousands of simulations are required in an extensive Statistical Fault Injection (SFI) campaign to assess vulnerability. 3) Proper modeling of multiple-bit upsets is required. Such models depend on detailed radation-induced studies. Blindly assuming multiple bit flips in adjacent cells is erroneous, as there may be no series of electrical events that can result to such outcome following a single event upset. 49 978-1-4799-0664-2/13/$31.00 c 2013 IEEE
Transcript of Investigating the Limits of AVF Analysis in the …yiorgos.makris/papers/iolts13a.pdf ·...
Investigating the Limits of AVF Analysis in thePresence of Multiple Bit Errors
Michail ManiatakosECE Department
New York University Abu Dhabi
Maria K. MichaelECE Department and KIOS Research Center
University of Cyprus
Yiorgos MakrisEE Department
University of Texas at Dallas
Abstract—We investigate the complexity and utility of per-forming Multiple Bit Upset (MBU) vulnerability analysis inmodern microprocessors. While the Single Bit Flip (SBF) modelconstitutes the prevailing mechanism for capturing the effect ofSingle Event Upsets (SEUs) due to alpha particle or neutronstrikes in semiconductors, recent radiation studies in 90nm and65nm technology nodes demonstrate that up to 55% of suchstrikes result in Multiple Bit Upsets (MBUs). Consequently, theaccuracy of popular vulnerability analysis methods, such as theArchitecural Vulnerability Factor (AVF) and Failures In Time(FIT) rate estimates based on the SBF assumption comes intoquestion, especially in modern microprocessors which contain asignificant amount of memory elements. Towards alleviating thisconcern, we present an extensive infrastructure which enablesMBU vulnerability analysis in modern microprocessors. Usingthis infrastructure and a modern microprocessor model, weperform a large scale MBU vulnerability analysis study andwe report two key findings: (i) the SBF fault model over-estimates vulnerability by up to 71%, as compared to a morerealistic modeling and distribution of faults in the 90nm and65nm processes, and (ii) the rank-ordered lists of critical bits, ascomputed through the SBF and MBU models, respectively, arevery similar, as indicated by the average rank difference of a bitwhich is less than 1.45%.
I. INTRODUCTION
Single event upsets (SEUs) due to alpha particle or neutron
strikes [1] have been extensively studied over the last decade
and various countermeasures have been developed to address
the concomitant transient errors [2]. Most such methods rely
on vulnerability analyses which capture the effect of an SEU
through a single bit-flip (SBF) model. However, as processes
feature sizes continue to shrink, it has become more likely
that adjacent cells may also be affected by a single event [3],
thereby causing a multiple-bit upset (MBU).
An MBU is defined as an event that causes more than one
bit to be upset during a single measurement [5]. During an
MBU, multiple bit errors in a single word can be introduced, as
well as single bit errors in multiple adjacent words [6]. While
MBUs have been encountered in the past in space applica-
tions [3], advanced memory structures exhibit a dramatically
increasing multi-bit failure rate [4], [7], pinpointing the need
for incorporating multi-bit upsets in accurate vulnerability
analyses. Specifically, in [4], experiments show that only 45%
of the upsets affect only 1 bit; the rest may affect up to 7 bits,
as shown in Figure 1. This failure rate is further accelerated
Fig. 1. Frequency distribution of number of faulty bits generated per SEUfor different process sizes [4]
by reduced power supply voltage, increased clock frequency,
crosstalk and electromigration effects [8].
Considering both single-bit and multi-bit upsets becomes
particularly important when assessing vulnerability of modern
microprocessors. A large area percentage of such circuits is
occupied by several in-core memory arrays, typically im-
plemented using SRAM cells. To the best our knowledge,
while extensive studies have been performed on increasing the
reliability of caches and register files [9], [10], there are only
a few MBU studies targeting modern microprocessor modules
[11], [8], [12], [13]. The reason for the absence of such studies
is three-fold:
1) Public availability of modern microprocessor Register
Transfer Level (RTL) models is limited. An RTL model
is required, as the exact number of memory elements
can only be extracted from such a detailed model. Thus,
functional simulators are not sufficient for such studies.
2) Simulating an RTL modern microprocessor model is
slow. This becomes a major bottleneck as thousands of
simulations are required in an extensive Statistical Fault
Injection (SFI) campaign to assess vulnerability.
3) Proper modeling of multiple-bit upsets is required. Such
models depend on detailed radation-induced studies.
Blindly assuming multiple bit flips in adjacent cells is
erroneous, as there may be no series of electrical events
that can result to such outcome following a single event
upset.
49978-1-4799-0664-2/13/$31.00 c©2013 IEEE
In this paper, we address the aforementioned issues and we
present a multiple bit error vulnerability analysis study in a
complex modern microprocessor module. This study reveals
that using the conventional SBF fault model results in a
gross overestimate of module vulnerability, as compared to
using more realistic fault models which are crafted based on
the findings of recent proton and neutron irradiation tests.
An ancillary outcome of this study is the observation that
the rank-ordered list of SRAM cells, with respect to their
SEU vulnerability, is largely independent of the fault model
utilized for the analysis. The rest of the paper is organized
as follows: Section II briefly discusses existing techniques for
vulnerability analysis in modern microprocessors. Section III
introduces the methods used to enable this study, followed by
section IV where the employed simulation-based experimental
infrastructure is described. Results, along with a comparative
analysis between the various models are presented in section
V, followed by conclusions in section VI.
II. RELATED WORK
The vulnerability of a microprocessor, expressed as the Soft
Error Rate (SER), is defined as the product of the raw FIT
(Failures In Time) rate and the probability that a fault results
into a visible user error. The FIT rate can be calculated through
sophisticated models, usually as a function of the elevation,
technology generation [14], supply voltage, etc. Typical rate
numbers for latches vary between 0.001 - 0.01 FIT/bit [1].
However, calculating the probability that a fault results in a
visible user error is not trivial and researchers have followed
various approaches to provide accurate estimates.
In [15], AVF is defined as the probability of a bit-flip
in a microprocessor leading to a user visible system error.
The authors calculate AVF by tracking the subset of the
microprocessor state bits required for architecturally correct
execution (ACE). An upset affecting ACE bits will definitely
cause a visible error, while events on un-ACE bits will never
propagate to the output. ACE analysis is further elaborated in
[16], introducing the Silent Data Corruption (SDC) rate and
the Detected Unrecoverable Error (DUE) rate metrics, further
increasing the granularity of ACE analysis.
Wang et. al [17] investigated the accuracy of ACE anal-
ysis through extensive statistical fault injection experiments.
Their results corroborated that ACE analysis overestimates
microprocessor vulnerability, mostly due to less detailed
structures available in the performance model employed in
[15].Furthermore, recent radiation studies with actual proton
and neutron irradiation tests showed that SFI measurements
closely match in-field exposure [18]. While [19] shows that
ACE inaccuracy can be reduced by adding extra detail to the
employed model, accurate AVF analysis heavily relies on the
existence of a detailed RTL model.
Perfoming extensive fault injection campaigns on a complex
RTL microprocessor model incurs great cost in terms of
time and computational power. In order to bridge this gap,
[20] introduced a method called Global Vulnerability Factor
(GSV) analysis to approximate AVF using single stuck-at
fault simulations. GSV can provide, in much shorter time, the
same relative ranking of memory elements in terms of their
criticality, as compared to AVF. However, the acquired GSV
figures are dependent on the experimental setup and are not
transferrable across designs and experiments.
In [21], program vulnerability factor traces are used to
accelerate AVF analysis. The performance improvement of
2x, however, is still not suitable for modern microprocessor
designs. The methodology presented in [22], combines one-
time fault injection and static analysis of the application
control and data flow in order to accurately evaluate the effect
of a soft-error.
All the aforementioned vulnerability analysis techniques
employ single error models to estimate the reliability of the
microprocessor. Multiple, non-concurrent faults are discussed
in [23] in order to evaluate the efficiency of design diversity.
Exhaustive characterization of multi-bit errors in 90/130nm
memories is presented in [7], while in [13], the authors
perform multi-bit error campaigns in an embedded cache and
discuss how cache scrubbing can reduce the double-bit error
rate. Another investigation of multi-bit failure rate in advanced
memories appears in [4], targeting 65nm processes. The latter
study triggered the definition of a new probabilistic framework
for incorporating vulnerability of memories to different fault
multiplicities into AVF [12]. Finally, [8] investigates the effects
of multiple non-concurrent faults on the operation of a micro-
processor. Both [12] and [13] conclude that the probability of
non-clustered double faults is negligible, and can be eliminated
with simple scrubbing techniques [13].
III. ENABLING MBU ANALYSIS IN MODERN
MICROPROCESSORS
In this section, we discuss the factors that need to be
addressed in order to perform an extensive MBU analysis in
modern microprocessor designs.
A. MBU Fault Model
Recent radiation tests [4], [12] presented real-life evidence
of spatial multi-bit upsets in technologies below 130nm.
Figure 1 shows the observed multi-bit upsets for two different
technologies. For 65nm, almost 20% of the SEUs generated 4
soft errors, highlighting the neccessity of taking into account
MBUs during SER analysis.
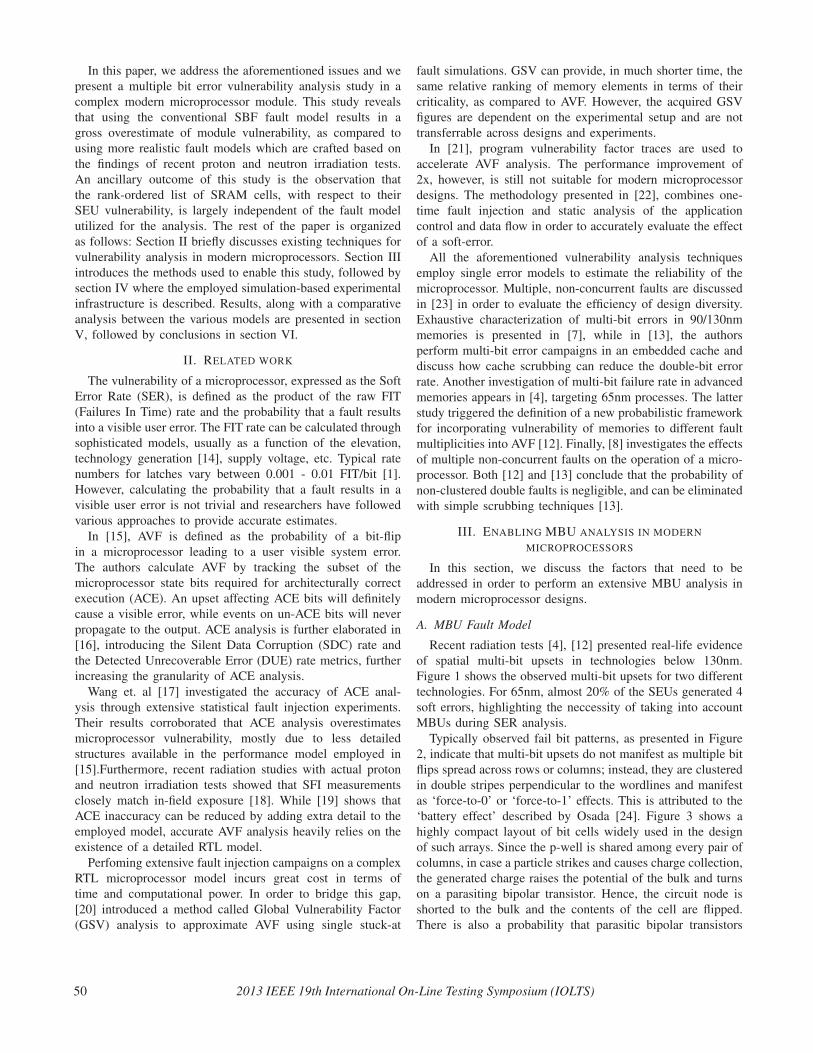
Typically observed fail bit patterns, as presented in Figure
2, indicate that multi-bit upsets do not manifest as multiple bit
flips spread across rows or columns; instead, they are clustered
in double stripes perpendicular to the wordlines and manifest
as ‘force-to-0’ or ‘force-to-1’ effects. This is attributed to the
‘battery effect’ described by Osada [24]. Figure 3 shows a
highly compact layout of bit cells widely used in the design
of such arrays. Since the p-well is shared among every pair of
columns, in case a particle strikes and causes charge collection,
the generated charge raises the potential of the bulk and turns
on a parasiting bipolar transistor. Hence, the circuit node is
shorted to the bulk and the contents of the cell are flipped.
There is also a probability that parasitic bipolar transistors
50 2013 IEEE 19th International On-Line Testing Symposium (IOLTS)
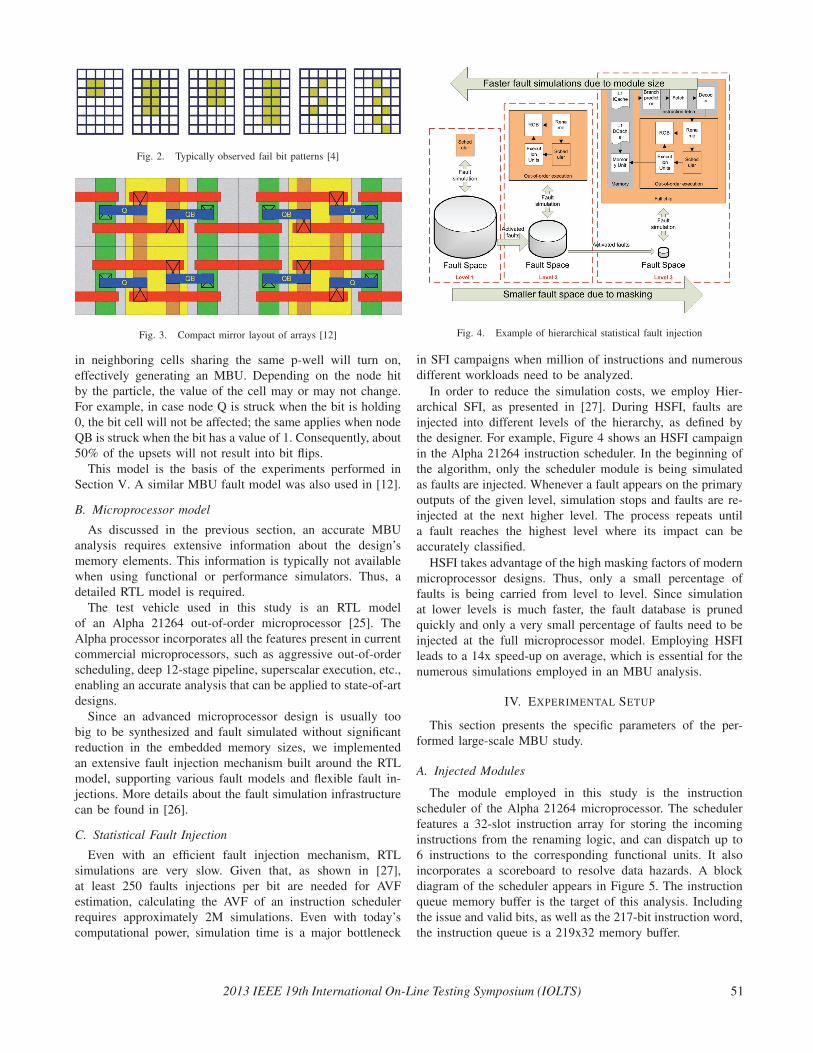
Fig. 2. Typically observed fail bit patterns [4]
Fig. 3. Compact mirror layout of arrays [12]
in neighboring cells sharing the same p-well will turn on,
effectively generating an MBU. Depending on the node hit
by the particle, the value of the cell may or may not change.
For example, in case node Q is struck when the bit is holding
0, the bit cell will not be affected; the same applies when node
QB is struck when the bit has a value of 1. Consequently, about
50% of the upsets will not result into bit flips.
This model is the basis of the experiments performed in
Section V. A similar MBU fault model was also used in [12].
B. Microprocessor model
As discussed in the previous section, an accurate MBU
analysis requires extensive information about the design’s
memory elements. This information is typically not available
when using functional or performance simulators. Thus, a
detailed RTL model is required.
The test vehicle used in this study is an RTL model
of an Alpha 21264 out-of-order microprocessor [25]. The
Alpha processor incorporates all the features present in current
commercial microprocessors, such as aggressive out-of-order
scheduling, deep 12-stage pipeline, superscalar execution, etc.,
enabling an accurate analysis that can be applied to state-of-art
designs.
Since an advanced microprocessor design is usually too
big to be synthesized and fault simulated without significant
reduction in the embedded memory sizes, we implemented
an extensive fault injection mechanism built around the RTL
model, supporting various fault models and flexible fault in-
jections. More details about the fault simulation infrastructure
can be found in [26].
C. Statistical Fault Injection
Even with an efficient fault injection mechanism, RTL
simulations are very slow. Given that, as shown in [27],
at least 250 faults injections per bit are needed for AVF
estimation, calculating the AVF of an instruction scheduler
requires approximately 2M simulations. Even with today’s
computational power, simulation time is a major bottleneck
Fig. 4. Example of hierarchical statistical fault injection
in SFI campaigns when million of instructions and numerous
different workloads need to be analyzed.
In order to reduce the simulation costs, we employ Hier-
archical SFI, as presented in [27]. During HSFI, faults are
injected into different levels of the hierarchy, as defined by
the designer. For example, Figure 4 shows an HSFI campaign
in the Alpha 21264 instruction scheduler. In the beginning of
the algorithm, only the scheduler module is being simulated
as faults are injected. Whenever a fault appears on the primary
outputs of the given level, simulation stops and faults are re-
injected at the next higher level. The process repeats until
a fault reaches the highest level where its impact can be
accurately classified.
HSFI takes advantage of the high masking factors of modern
microprocessor designs. Thus, only a small percentage of
faults is being carried from level to level. Since simulation
at lower levels is much faster, the fault database is pruned
quickly and only a very small percentage of faults need to be
injected at the full microprocessor model. Employing HSFI
leads to a 14x speed-up on average, which is essential for the
numerous simulations employed in an MBU analysis.
IV. EXPERIMENTAL SETUP
This section presents the specific parameters of the per-
formed large-scale MBU study.
A. Injected Modules
The module employed in this study is the instruction
scheduler of the Alpha 21264 microprocessor. The scheduler
features a 32-slot instruction array for storing the incoming
instructions from the renaming logic, and can dispatch up to
6 instructions to the corresponding functional units. It also
incorporates a scoreboard to resolve data hazards. A block
diagram of the scheduler appears in Figure 5. The instruction
queue memory buffer is the target of this analysis. Including
the issue and valid bits, as well as the 217-bit instruction word,
the instruction queue is a 219x32 memory buffer.
2013 IEEE 19th International On-Line Testing Symposium (IOLTS) 51
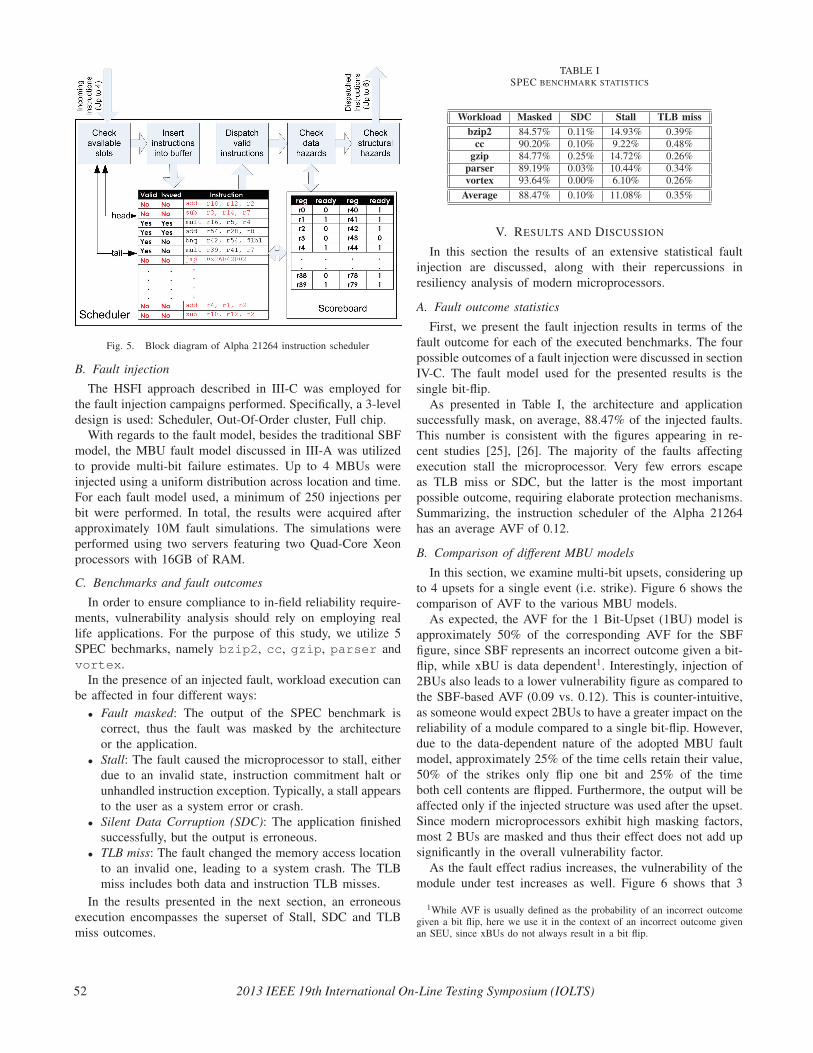
Fig. 5. Block diagram of Alpha 21264 instruction scheduler
B. Fault injection
The HSFI approach described in III-C was employed for
the fault injection campaigns performed. Specifically, a 3-level
design is used: Scheduler, Out-Of-Order cluster, Full chip.With regards to the fault model, besides the traditional SBF
model, the MBU fault model discussed in III-A was utilized
to provide multi-bit failure estimates. Up to 4 MBUs were
injected using a uniform distribution across location and time.
For each fault model used, a minimum of 250 injections per
bit were performed. In total, the results were acquired after
approximately 10M fault simulations. The simulations were
performed using two servers featuring two Quad-Core Xeon
processors with 16GB of RAM.
C. Benchmarks and fault outcomes
In order to ensure compliance to in-field reliability require-
ments, vulnerability analysis should rely on employing real
life applications. For the purpose of this study, we utilize 5
SPEC bechmarks, namely bzip2, cc, gzip, parser and
vortex.In the presence of an injected fault, workload execution can
be affected in four different ways:
• Fault masked: The output of the SPEC benchmark is
correct, thus the fault was masked by the architecture
or the application.
• Stall: The fault caused the microprocessor to stall, either
due to an invalid state, instruction commitment halt or
unhandled instruction exception. Typically, a stall appears
to the user as a system error or crash.
• Silent Data Corruption (SDC): The application finished
successfully, but the output is erroneous.
• TLB miss: The fault changed the memory access location
to an invalid one, leading to a system crash. The TLB
miss includes both data and instruction TLB misses.
In the results presented in the next section, an erroneous
execution encompasses the superset of Stall, SDC and TLB
miss outcomes.
TABLE ISPEC BENCHMARK STATISTICS
Workload Masked SDC Stall TLB missbzip2 84.57% 0.11% 14.93% 0.39%
cc 90.20% 0.10% 9.22% 0.48%gzip 84.77% 0.25% 14.72% 0.26%
parser 89.19% 0.03% 10.44% 0.34%vortex 93.64% 0.00% 6.10% 0.26%
Average 88.47% 0.10% 11.08% 0.35%
V. RESULTS AND DISCUSSION
In this section the results of an extensive statistical fault
injection are discussed, along with their repercussions in
resiliency analysis of modern microprocessors.
A. Fault outcome statistics
First, we present the fault injection results in terms of the
fault outcome for each of the executed benchmarks. The four
possible outcomes of a fault injection were discussed in section
IV-C. The fault model used for the presented results is the
single bit-flip.
As presented in Table I, the architecture and application
successfully mask, on average, 88.47% of the injected faults.
This number is consistent with the figures appearing in re-
cent studies [25], [26]. The majority of the faults affecting
execution stall the microprocessor. Very few errors escape
as TLB miss or SDC, but the latter is the most important
possible outcome, requiring elaborate protection mechanisms.
Summarizing, the instruction scheduler of the Alpha 21264
has an average AVF of 0.12.
B. Comparison of different MBU models
In this section, we examine multi-bit upsets, considering up
to 4 upsets for a single event (i.e. strike). Figure 6 shows the
comparison of AVF to the various MBU models.
As expected, the AVF for the 1 Bit-Upset (1BU) model is
approximately 50% of the corresponding AVF for the SBF
figure, since SBF represents an incorrect outcome given a bit-
flip, while xBU is data dependent1. Interestingly, injection of
2BUs also leads to a lower vulnerability figure as compared to
the SBF-based AVF (0.09 vs. 0.12). This is counter-intuitive,
as someone would expect 2BUs to have a greater impact on the
reliability of a module compared to a single bit-flip. However,
due to the data-dependent nature of the adopted MBU fault
model, approximately 25% of the time cells retain their value,
50% of the strikes only flip one bit and 25% of the time
both cell contents are flipped. Furthermore, the output will be
affected only if the injected structure was used after the upset.
Since modern microprocessors exhibit high masking factors,
most 2 BUs are masked and thus their effect does not add up
significantly in the overall vulnerability factor.
As the fault effect radius increases, the vulnerability of the
module under test increases as well. Figure 6 shows that 3
1While AVF is usually defined as the probability of an incorrect outcomegiven a bit flip, here we use it in the context of an incorrect outcome givenan SEU, since xBUs do not always result in a bit flip.
52 2013 IEEE 19th International On-Line Testing Symposium (IOLTS)
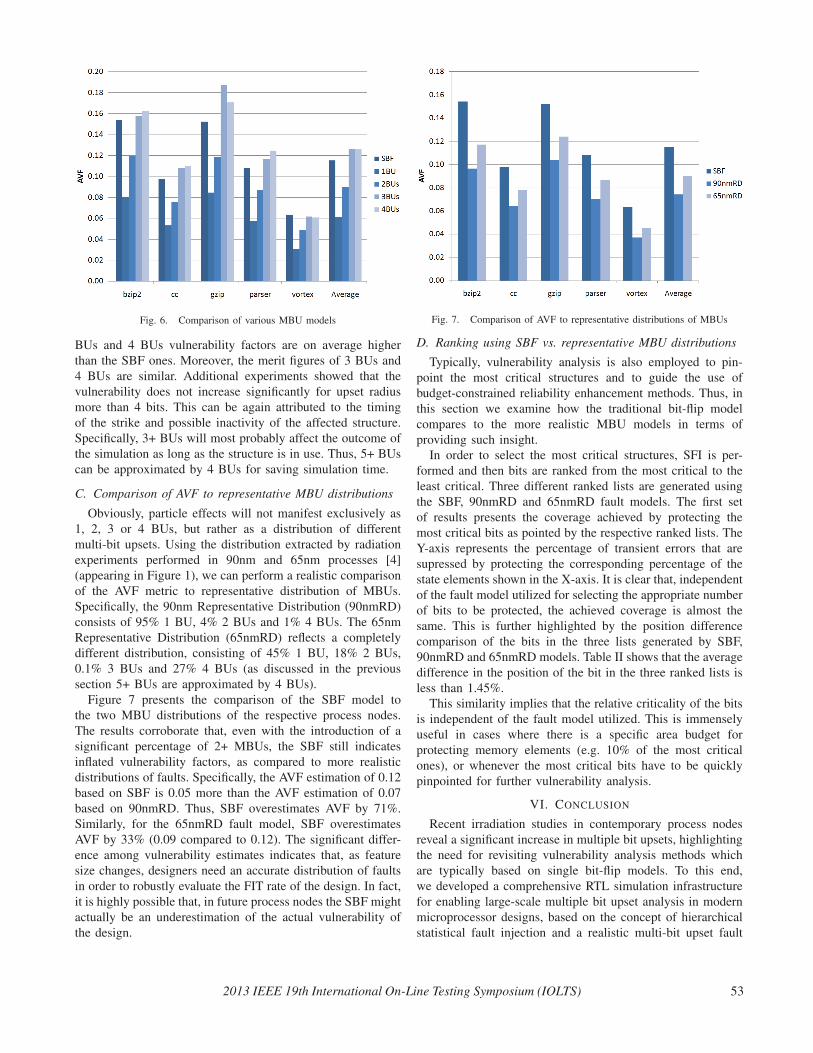
Fig. 6. Comparison of various MBU models
BUs and 4 BUs vulnerability factors are on average higher
than the SBF ones. Moreover, the merit figures of 3 BUs and
4 BUs are similar. Additional experiments showed that the
vulnerability does not increase significantly for upset radius
more than 4 bits. This can be again attributed to the timing
of the strike and possible inactivity of the affected structure.
Specifically, 3+ BUs will most probably affect the outcome of
the simulation as long as the structure is in use. Thus, 5+ BUs
can be approximated by 4 BUs for saving simulation time.
C. Comparison of AVF to representative MBU distributions
Obviously, particle effects will not manifest exclusively as
1, 2, 3 or 4 BUs, but rather as a distribution of different
multi-bit upsets. Using the distribution extracted by radiation
experiments performed in 90nm and 65nm processes [4]
(appearing in Figure 1), we can perform a realistic comparison
of the AVF metric to representative distribution of MBUs.
Specifically, the 90nm Representative Distribution (90nmRD)
consists of 95% 1 BU, 4% 2 BUs and 1% 4 BUs. The 65nm
Representative Distribution (65nmRD) reflects a completely
different distribution, consisting of 45% 1 BU, 18% 2 BUs,
0.1% 3 BUs and 27% 4 BUs (as discussed in the previous
section 5+ BUs are approximated by 4 BUs).
Figure 7 presents the comparison of the SBF model to
the two MBU distributions of the respective process nodes.
The results corroborate that, even with the introduction of a
significant percentage of 2+ MBUs, the SBF still indicates
inflated vulnerability factors, as compared to more realistic
distributions of faults. Specifically, the AVF estimation of 0.12
based on SBF is 0.05 more than the AVF estimation of 0.07
based on 90nmRD. Thus, SBF overestimates AVF by 71%.
Similarly, for the 65nmRD fault model, SBF overestimates
AVF by 33% (0.09 compared to 0.12). The significant differ-
ence among vulnerability estimates indicates that, as feature
size changes, designers need an accurate distribution of faults
in order to robustly evaluate the FIT rate of the design. In fact,
it is highly possible that, in future process nodes the SBF might
actually be an underestimation of the actual vulnerability of
the design.
Fig. 7. Comparison of AVF to representative distributions of MBUs
D. Ranking using SBF vs. representative MBU distributions
Typically, vulnerability analysis is also employed to pin-
point the most critical structures and to guide the use of
budget-constrained reliability enhancement methods. Thus, in
this section we examine how the traditional bit-flip model
compares to the more realistic MBU models in terms of
providing such insight.In order to select the most critical structures, SFI is per-
formed and then bits are ranked from the most critical to the
least critical. Three different ranked lists are generated using
the SBF, 90nmRD and 65nmRD fault models. The first set
of results presents the coverage achieved by protecting the
most critical bits as pointed by the respective ranked lists. The
Y-axis represents the percentage of transient errors that are
supressed by protecting the corresponding percentage of the
state elements shown in the X-axis. It is clear that, independent
of the fault model utilized for selecting the appropriate number
of bits to be protected, the achieved coverage is almost the
same. This is further highlighted by the position difference
comparison of the bits in the three lists generated by SBF,
90nmRD and 65nmRD models. Table II shows that the average
difference in the position of the bit in the three ranked lists is
less than 1.45%.This similarity implies that the relative criticality of the bits
is independent of the fault model utilized. This is immensely
useful in cases where there is a specific area budget for
protecting memory elements (e.g. 10% of the most critical
ones), or whenever the most critical bits have to be quickly
pinpointed for further vulnerability analysis.
VI. CONCLUSION
Recent irradiation studies in contemporary process nodes
reveal a significant increase in multiple bit upsets, highlighting
the need for revisiting vulnerability analysis methods which
are typically based on single bit-flip models. To this end,
we developed a comprehensive RTL simulation infrastructure
for enabling large-scale multiple bit upset analysis in modern
microprocessor designs, based on the concept of hierarchical
statistical fault injection and a realistic multi-bit upset fault
2013 IEEE 19th International On-Line Testing Symposium (IOLTS) 53
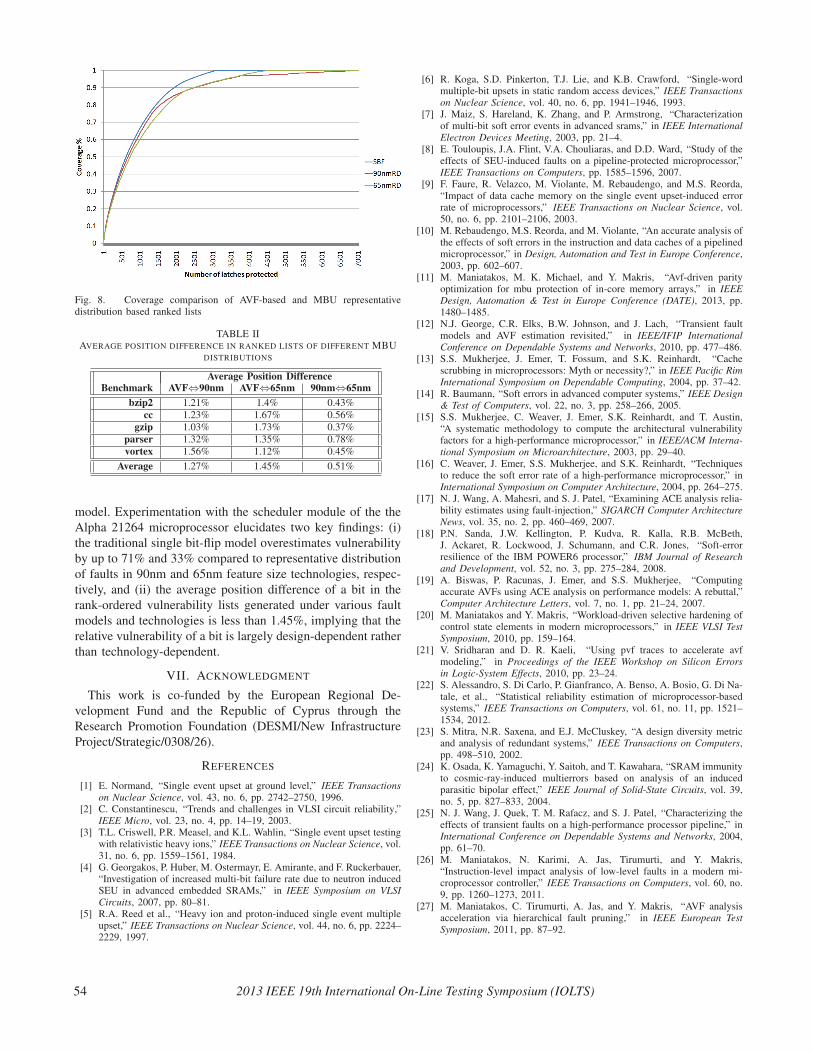
Fig. 8. Coverage comparison of AVF-based and MBU representativedistribution based ranked lists
TABLE IIAVERAGE POSITION DIFFERENCE IN RANKED LISTS OF DIFFERENT MBU
DISTRIBUTIONS
Average Position DifferenceBenchmark AVF⇔90nm AVF⇔65nm 90nm⇔65nm
bzip2 1.21% 1.4% 0.43%cc 1.23% 1.67% 0.56%
gzip 1.03% 1.73% 0.37%parser 1.32% 1.35% 0.78%vortex 1.56% 1.12% 0.45%
Average 1.27% 1.45% 0.51%
model. Experimentation with the scheduler module of the the
Alpha 21264 microprocessor elucidates two key findings: (i)
the traditional single bit-flip model overestimates vulnerability
by up to 71% and 33% compared to representative distribution
of faults in 90nm and 65nm feature size technologies, respec-
tively, and (ii) the average position difference of a bit in the
rank-ordered vulnerability lists generated under various fault
models and technologies is less than 1.45%, implying that the
relative vulnerability of a bit is largely design-dependent rather
than technology-dependent.
VII. ACKNOWLEDGMENT
This work is co-funded by the European Regional De-
velopment Fund and the Republic of Cyprus through the
Research Promotion Foundation (DESMI/New Infrastructure
Project/Strategic/0308/26).
REFERENCES
[1] E. Normand, “Single event upset at ground level,” IEEE Transactionson Nuclear Science, vol. 43, no. 6, pp. 2742–2750, 1996.
[2] C. Constantinescu, “Trends and challenges in VLSI circuit reliability,”IEEE Micro, vol. 23, no. 4, pp. 14–19, 2003.
[3] T.L. Criswell, P.R. Measel, and K.L. Wahlin, “Single event upset testingwith relativistic heavy ions,” IEEE Transactions on Nuclear Science, vol.31, no. 6, pp. 1559–1561, 1984.
[4] G. Georgakos, P. Huber, M. Ostermayr, E. Amirante, and F. Ruckerbauer,“Investigation of increased multi-bit failure rate due to neutron inducedSEU in advanced embedded SRAMs,” in IEEE Symposium on VLSICircuits, 2007, pp. 80–81.
[5] R.A. Reed et al., “Heavy ion and proton-induced single event multipleupset,” IEEE Transactions on Nuclear Science, vol. 44, no. 6, pp. 2224–2229, 1997.
[6] R. Koga, S.D. Pinkerton, T.J. Lie, and K.B. Crawford, “Single-wordmultiple-bit upsets in static random access devices,” IEEE Transactionson Nuclear Science, vol. 40, no. 6, pp. 1941–1946, 1993.
[7] J. Maiz, S. Hareland, K. Zhang, and P. Armstrong, “Characterizationof multi-bit soft error events in advanced srams,” in IEEE InternationalElectron Devices Meeting, 2003, pp. 21–4.
[8] E. Touloupis, J.A. Flint, V.A. Chouliaras, and D.D. Ward, “Study of theeffects of SEU-induced faults on a pipeline-protected microprocessor,”IEEE Transactions on Computers, pp. 1585–1596, 2007.
[9] F. Faure, R. Velazco, M. Violante, M. Rebaudengo, and M.S. Reorda,“Impact of data cache memory on the single event upset-induced errorrate of microprocessors,” IEEE Transactions on Nuclear Science, vol.50, no. 6, pp. 2101–2106, 2003.
[10] M. Rebaudengo, M.S. Reorda, and M. Violante, “An accurate analysis ofthe effects of soft errors in the instruction and data caches of a pipelinedmicroprocessor,” in Design, Automation and Test in Europe Conference,2003, pp. 602–607.
[11] M. Maniatakos, M. K. Michael, and Y. Makris, “Avf-driven parityoptimization for mbu protection of in-core memory arrays,” in IEEEDesign, Automation & Test in Europe Conference (DATE), 2013, pp.1480–1485.
[12] N.J. George, C.R. Elks, B.W. Johnson, and J. Lach, “Transient faultmodels and AVF estimation revisited,” in IEEE/IFIP InternationalConference on Dependable Systems and Networks, 2010, pp. 477–486.
[13] S.S. Mukherjee, J. Emer, T. Fossum, and S.K. Reinhardt, “Cachescrubbing in microprocessors: Myth or necessity?,” in IEEE Pacific RimInternational Symposium on Dependable Computing, 2004, pp. 37–42.
[14] R. Baumann, “Soft errors in advanced computer systems,” IEEE Design& Test of Computers, vol. 22, no. 3, pp. 258–266, 2005.
[15] S.S. Mukherjee, C. Weaver, J. Emer, S.K. Reinhardt, and T. Austin,“A systematic methodology to compute the architectural vulnerabilityfactors for a high-performance microprocessor,” in IEEE/ACM Interna-tional Symposium on Microarchitecture, 2003, pp. 29–40.
[16] C. Weaver, J. Emer, S.S. Mukherjee, and S.K. Reinhardt, “Techniquesto reduce the soft error rate of a high-performance microprocessor,” inInternational Symposium on Computer Architecture, 2004, pp. 264–275.
[17] N. J. Wang, A. Mahesri, and S. J. Patel, “Examining ACE analysis relia-bility estimates using fault-injection,” SIGARCH Computer ArchitectureNews, vol. 35, no. 2, pp. 460–469, 2007.
[18] P.N. Sanda, J.W. Kellington, P. Kudva, R. Kalla, R.B. McBeth,J. Ackaret, R. Lockwood, J. Schumann, and C.R. Jones, “Soft-errorresilience of the IBM POWER6 processor,” IBM Journal of Researchand Development, vol. 52, no. 3, pp. 275–284, 2008.
[19] A. Biswas, P. Racunas, J. Emer, and S.S. Mukherjee, “Computingaccurate AVFs using ACE analysis on performance models: A rebuttal,”Computer Architecture Letters, vol. 7, no. 1, pp. 21–24, 2007.
[20] M. Maniatakos and Y. Makris, “Workload-driven selective hardening ofcontrol state elements in modern microprocessors,” in IEEE VLSI TestSymposium, 2010, pp. 159–164.
[21] V. Sridharan and D. R. Kaeli, “Using pvf traces to accelerate avfmodeling,” in Proceedings of the IEEE Workshop on Silicon Errorsin Logic-System Effects, 2010, pp. 23–24.
[22] S. Alessandro, S. Di Carlo, P. Gianfranco, A. Benso, A. Bosio, G. Di Na-tale, et al., “Statistical reliability estimation of microprocessor-basedsystems,” IEEE Transactions on Computers, vol. 61, no. 11, pp. 1521–1534, 2012.
[23] S. Mitra, N.R. Saxena, and E.J. McCluskey, “A design diversity metricand analysis of redundant systems,” IEEE Transactions on Computers,pp. 498–510, 2002.
[24] K. Osada, K. Yamaguchi, Y. Saitoh, and T. Kawahara, “SRAM immunityto cosmic-ray-induced multierrors based on analysis of an inducedparasitic bipolar effect,” IEEE Journal of Solid-State Circuits, vol. 39,no. 5, pp. 827–833, 2004.
[25] N. J. Wang, J. Quek, T. M. Rafacz, and S. J. Patel, “Characterizing theeffects of transient faults on a high-performance processor pipeline,” inInternational Conference on Dependable Systems and Networks, 2004,pp. 61–70.
[26] M. Maniatakos, N. Karimi, A. Jas, Tirumurti, and Y. Makris,“Instruction-level impact analysis of low-level faults in a modern mi-croprocessor controller,” IEEE Transactions on Computers, vol. 60, no.9, pp. 1260–1273, 2011.
[27] M. Maniatakos, C. Tirumurti, A. Jas, and Y. Makris, “AVF analysisacceleration via hierarchical fault pruning,” in IEEE European TestSymposium, 2011, pp. 87–92.
54 2013 IEEE 19th International On-Line Testing Symposium (IOLTS)