INVESTIGATING THE EFFECT OF COIL PLATES ON THE …
53
INVESTIGATING THE EFFECT OF COIL PLATES ON THE PERFORMANCE OF FIRE TUBE STEAM PACKAGED BOILER USING SIMULATION SOFTWARE By MOHAMAD HAZIQ FAIZ BIN MOHD HASHIM Dissertation submitted in partial fulfillment of the requirements of the Bachelor of Engineering (Hons) (Mechanical Engineering) SEPTEMBER 2013 Universiti Teknologi PETRONAS Bandar Seri Iskandar 31750 Tronoh Perak Darul Ridzuan CORE Metadata, citation and similar papers at core.ac.uk Provided by UTPedia
Transcript of INVESTIGATING THE EFFECT OF COIL PLATES ON THE …
i
INVESTIGATING THE EFFECT OF COIL PLATES ON THE
PERFORMANCE OF FIRE TUBE STEAM PACKAGED BOILER
USING SIMULATION SOFTWARE
By
MOHAMAD HAZIQ FAIZ BIN MOHD HASHIM
Dissertation submitted in partial fulfillment
of the requirements of the
Bachelor of Engineering (Hons)
(Mechanical Engineering)
SEPTEMBER 2013
Universiti Teknologi PETRONAS
Bandar Seri Iskandar
31750 Tronoh
Perak Darul Ridzuan
CORE Metadata, citation and similar papers at core.ac.uk
Provided by UTPedia

i
CERTIFICATION OF APPROVAL
INVESTIGATING THE EFFECT OF COIL PLATES ON THE
PERFORMANCE OF FIRE TUBE STEAM PACKAGED BOILER
USING SIMULATION SOFTWARE
by
Mohamad Haziq Faiz Bin Mohd Hashim
A project dissertation submitted to the
Mechanical Engineering Programme
Universiti Teknologi PETRONAS
in partial fulfillment of the requirement for the
Bachelor of Engineering (Hons)
(Mechanical Engineering)
Approved:
_________________________
Ir. Dr. Suhaimi Hassan
Project Supervisor
UNIVERSITI TEKNOLOGI PETRONAS
TRONOH, PERAK
September 2013

ii
CERTIFICATE OF ORIGINALITY
This is to certify that I am responsible for the work submitted in this
project, that the original work is my own except as specified in the
references and acknowledgements, and that the original work contained
herein have not been undertaken or done by unspecified sources or persons.
_________________________________
Mohamad Haziq Faiz Bin Mohd Hashim

iii
ACKNOWLEDGEMENT
Given this opportunity, I would like to acknowledge those who have been
helping me, either directly or indirectly, in continue working on the project – starting
from preliminary research, to the development phase and until the completion phase of
this Final Year Project in Universiti Teknologi PETRONAS.
First of all, I would like to express my gratitude to God for giving me the
strength and health throughout my years of study in this university, which allows me to
gain enough theoretical knowledge and practical skill sets as a mechanical engineer, to
be applied into this particular project or other project in the coming years.
I would like to thank Ir. Dr Suhaimi Hassan, my supervisor for this project for
the past two semesters. Ir. Dr Suhaimi has been giving me moral and mental support
since the first day we had a meeting regarding the topic that I have chosen. His
understanding and confidence on my capabilities and passion towards the idea has given
me the flexibility and spiritual advantages that I needed in conducting the project from
the start to finish.
Besides that, I also like to thank post-graduate student, Mohd Khairi and
colleagues in the university for their assistants in helping me to master visual basic for
application skills needed during the simulation work using ANSYS Fluent. The same
gratitude goes to my beloved parents for always giving me advice and support that has
boosted my confidence in exploring further into the project.

iv
ABSTRACT
In recent years, the study of increasing the heat transfer rate in a boiler had been
conducted widely. Boiler is a type of heat exchangers which can be categorized as; Fire-
tube boiler and Water-tube boiler. The project was entitled as "Investigating the effect of
coil plates on the performance of Fire-tube steam packaged boiler using the simulation
software”. The previous study had found out that to increase the heat transfer rate, the
coil plates had been used as an insert into the generating tube inside the boiler.
Nevertheless, the amount that heats energy produced by the furnace is still not been fully
utilized. The heat transfer from the generating tube to the water still can be increased by
increasing the surface area of the coil plate inserts into the generating tube. In this
project it will determined the effects by varying the surface area towards the heat
transfer rate of the Fire-tube boiler by using the ANSYS FLUENT simulation software .
The coil plates are proposed to have several numbers of holes and diameters which can
differentiate the surface area of coil plates. All the results were recorded to compare and
determined which design of coil plates gives the maximum heat transfer rate. From the
first hypothesis, the coil plate will have a greater surface area when the hole is created.
But from the result obtained, a surface area of coil plates is decreasing when the hole is
created. Nevertheless, the heat transfer rate is still increasing due to the increasing
velocity. The lower the size of holes, the higher the velocity hence it will increase the
heat transfer rate. The creation of holes on the coil plate will lead to a higher velocity
and change the type of flow to approach turbulence. In a nutshell, the creation of holes
on the coil plate will increase the heat transfer rate inside the generating tube.
v
TABLE OF CONTENTS
CERTIFICATION OF APPROVAL ........................................................................................ i
CERTIFICATE OF ORIGINALITY ....................................................................................... ii
ACKNOWLEDGEMENT ...................................................................................................... iii
ABSTRACT ........................................................................................................................... iv
LIST OF TABLES .................................................................................................................. vi
LIST OF FIGURES ............................................................................................................... vii
ABBREVIATIONS AND NOMENCLATURES ................................................................ viii
1.0 INTRODUCTION....................................................................................................... 1
1.1 Project Background ............................................................................................... 1
1.2 Problem Statement ................................................................................................ 2
1.3 Objectives .............................................................................................................. 2
1.4 Scope of Study ...................................................................................................... 2
1.5 Relevancy of Study ............................................................................................... 3
1.6 Feasibility of Study ............................................................................................... 3
2.0 LITERATURE REVIEW............................................................................................ 4
3.0 METHODOLOGY ...................................................................................................... 9
3.1 Research Methodology.......................................................................................... 9
3.2 Project Methodology ........................................................................................... 12
3.3 Project Gantt-Chart ............................................................................................. 15
3.4 Key-Milestone ..................................................................................................... 17
4.0 RESULTS & DISCUSSION ..................................................................................... 18
4.1 Proposed Design of Coil Plates ........................................................................... 18
4.2 Static Temperature Contour Plots ....................................................................... 19
4.3 Velocity Contour Plots ........................................................................................ 27
4.4 Relationship between Velocity with Number of Holes ....................................... 31
4.5 Relationship between Reynold Number with Number of Holes ......................... 32
4.6 Relationship between Nusselt Number with Number of Holes .......................... 34
4.7 Relationship between Surface Areas of Coil Plate with Number of Holes ......... 35
4.8 Relationship between Heat Transfer Rate with Number of Holes ...................... 36
4.9 Relationship between Pressure Drop with Number of Holes .............................. 38
vi
5.0 CONCLUSIONS & RECOMMENDATIONS ......................................................... 40
6.0 REFERENCES .......................................................................................................... 41
APPENDIX ........................................................................................................................... 43
LIST OF TABLES
Table 1: Description for various type of action technique ............................................... 5
Table 2: Description for various type of passive technique ............................................. 6
Table 3: Parameters for the simulation work. ............................................................... 14
Table 4: Gantt-Chart for FYP I .................................................................................... 15
Table 5: Gantt-Chart FYP II ......................................................................................... 16
Table 6: Table for Key-milestones ............................................................................... 17
Table 7: The proposed design of coil plates .................................................................. 18
Table 8: Type of Flow Based on Reynold Number (Çengel and Ghajar, 2011) ............. 32

vii
LIST OF FIGURES
Figure 1: Fire-Tube Boiler ...................................................................................................... 3
Figure 2: The geometry of coil plates .................................................................................... 18
Figure 3: Static temperature contour plots with 4mm diameter and the number of holes are
varied..................................................................................................................... 19
Figure 4: Static temperature contour plots with 8mm diameter and the number of holes are
varied..................................................................................................................... 20
Figure 5: Static temperature contour plots with 10mm diameter and the number of holes are
varied..................................................................................................................... 21
Figure 6: Static temperature contour plots with 15mm diameter and the number of holes are
varied..................................................................................................................... 22
Figure 7: Static temperature contour plots with 1 hole and the diameter of holes are varied ... 23
Figure 8: Static temperature contour plots with 2 holes and the diameter of holes are varied .. 24
Figure 9: Static temperature contour plots with 3 holes and the diameter of holes are varied .. 25
Figure 10: Static temperature contour plots with 4 holes and the diameter of holes are varied .. 26
Figure 11: Velocity contour plots with 4mm diameter and the number of holes are varied ....... 27
Figure 12: Velocity contour plots with 8mm diameter and the number of holes are varied ....... 28
Figure 13: Velocity contour plots with 10mm diameter and the number of holes are varied...... 29
Figure 14: Velocity contour plots with 15mm diameter and the number of holes are varied...... 30
Figure 15: Relationship between Velocity with Number of Holes ............................................ 31
Figure 16: Relationship between Reynold Number with Number of Holes ............................... 32
Figure 17: Relationship between Nusselt Number with Number of Holes ................................ 34
Figure 18: Relationship between Surface Areas of Coil Plate with Number of Holes................ 35
Figure 19: Relationship between Heat Transfer Rate with Number of Holes ............................ 36
Figure 20: Relationship between Pressure Drop with Number of Holes.................................... 38

viii
ABBREVIATIONS AND NOMENCLATURES
𝐴 Area
𝐴𝑠 Surface area
𝑑,𝐷 Diameter
𝑓 Friction Factor
Convection heat transfer coefficient, 𝑊/𝑚2. 𝐾
𝑘 Thermal conductivity, 𝑊/𝑚. 𝐾
𝐿 Length
𝑁𝑢 Nusselt number
∆𝑃 Pressure drop, Pa
𝑃𝑟 Prandtl number
𝑄 Heat transfer rate, W
𝑅𝑒 Reynold number
𝑇𝑠 Surface temperature, K
𝑇∞ Fluid temperature, K
𝑉 Velocity, m/s
μb Average dynamic viscosity, 𝑘𝑔/𝑚. 𝑠
μs Surface dynamic viscosity, 𝑘𝑔/𝑚. 𝑠
𝜈 Kinematic viscosity, 𝑚2/𝑠
𝜌 Density, 𝑘𝑔/𝑚3

1
1.0 INTRODUCTION
1.1 Project Background
Boiler is a type of heat exchanger that converting water to steam through boiling
process. It has been used in industrial application in various processes such as power
generation, central heating and sanitation. As it is a heat exchanger, the heat is
transferred from the combustion chamber to the water and converts it into steam.
According to Amori and Insayif (2011) [1] the efficiency of this process is low, only up
to 70% and the previous study has found the solution to increase the rate of heat transfer
by inserting the coil plate into the heat exchanger. In this case, the heat exchanger will
be the Fire-tube Boiler. Zimparov and Penchev (2000) [2] had stated that the main
objective of enhancing the heat transfer rate is to encourage or increase the heat fluxes.
Encouraging the heat fluxes will reduce the size of the heat exchanger and as well as the
capital cost. Prajapati et al. (2012) [3] stated another advantage of enhancing the heat
transfer rate is that the heat exchanger can operate at low velocity but the performance
will be the same or better than the heat exchanger that did not use the inserts into the
tubes. This will lead to a pressure drop and low operating cost.
In this project, the passive technique of enhancing heat transfer was used because
it does not require any external input power. The inserts that is the coil plates is installed
into the generated tube to promote higher heat transfer coefficient by disturbing the
existing fluid flow behavior (Kumar and Murugesan, 2012) [4]. The heat that been
generated from the combustion chamber inside the Fire-tube Boiler using the plain
twisted coil plates, still not been fully utilized to convert the water into steam. The
enhancement of heat transfer technique can be improved by increasing the surface area
of the coil plate because the larger the surface area, the greater the heat transfer rate. The
surface area of the coil plate can be increase by creating set of holes throughout the coil
plate. The surface area of the coil plate is depends on the diameter of the holes.
Investigation on the effect of coil plate surface area towards the performance of the Fire-
tube Boiler will be conducted using the ANSYS software. By manipulating the surface
area of the coil plate, the minimum total surface area to increase the performance of the
boiler will be determined.

2
1.2 Problem Statement
The generating tube inside the boiler used coil plates insert to enhance the heat transfer
rate from the combustion chamber to the water. The rate of heat transfer can be increase
by increasing the surface area of the coil plate. The effect of the coil plate surface area
towards the performance of the boiler have to be investigated using ANSYS simulation
software and the minimum total surface area have to be determined to increase the
efficiency of the boiler.
1.3 Objectives
The objectives of this project are as follows:
1. To study the effect of the coil plates surface area in enhancement of heat transfer
using simulation software
2. To propose new design of coil plate using simulation software
3. To simulate the overall performance of boiler with the new design of coil plates
and without coil plate
1.4 Scope of Study
The scope of study in this project will be within the Fire-tube Boiler. The coil
plates will be designed to have a set of holes and each coil plates have different diameter
of holes that shows different surface area. With the new design of coil plates, then it will
be simulated using the ANSYS software to compare the overall performance of the
boiler.
3
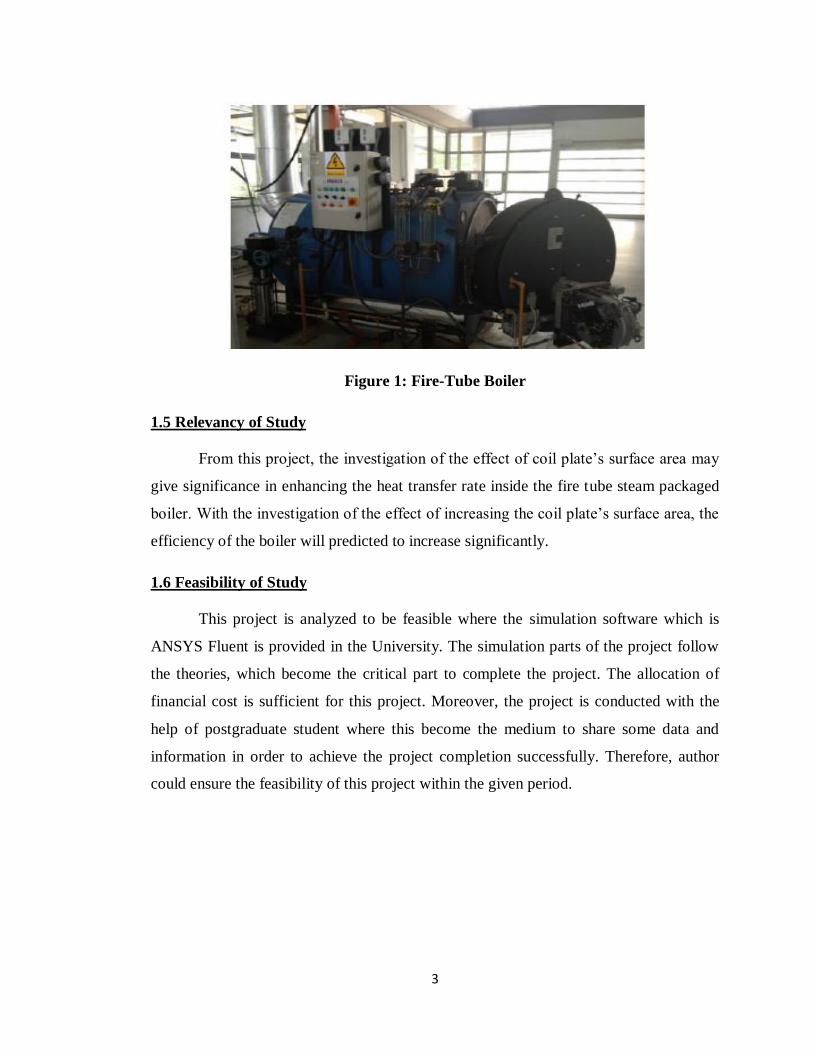
Figure 1: Fire-Tube Boiler
1.5 Relevancy of Study
From this project, the investigation of the effect of coil plate’s surface area may
give significance in enhancing the heat transfer rate inside the fire tube steam packaged
boiler. With the investigation of the effect of increasing the coil plate’s surface area, the
efficiency of the boiler will predicted to increase significantly.
1.6 Feasibility of Study
This project is analyzed to be feasible where the simulation software which is
ANSYS Fluent is provided in the University. The simulation parts of the project follow
the theories, which become the critical part to complete the project. The allocation of
financial cost is sufficient for this project. Moreover, the project is conducted with the
help of postgraduate student where this become the medium to share some data and
information in order to achieve the project completion successfully. Therefore, author
could ensure the feasibility of this project within the given period.
4
2.0 LITERATURE REVIEW
Boiler has been used in industrial application to generate steam to produce
power. There are two types of boiler which are Fire-tube Boiler and Water-tube Boiler.
The concept that been used between these two boilers are the same but the way they
operate it is difference. In Fire-tube Boiler, the hot gases will pass through the tube that
been surrounded by water. The heat is transferred from the wall of tubes to the water
through thermal conduction process. The water will confine in the outer shell of the
boiler. Fire-tube Boiler usually been used in low pressure that is up to 50 mbtu per hour
or less to avoid the need of bigger thickness for the outer shell (U.S. Department of
Energy, 2010) [5]. But nowadays, the size of the Fire-tube Boiler has increased so that it
can withstand with the higher pressure. In Water-tube Boiler, the water been heated in
the other way around. The water will pass through the bundle of tubes while it been
heated externally. Water-tube Boiler usually been used in high pressure because the
pressure is confined inside the tube (U.S. Department of Energy, 2010). The previous
Fire-tube Boiler that been created have a low efficiency which is only up to 70% with
high fuel consumption (Amori and Insayif, 2011). The amount of heat energy used to
boil the water is high due to low efficiency of heat transfer rate.
The augmentation technique has been used recently to increase the heat transfer
rate. Kumar and Murugesan had described the augmentation technique of heat transfer
which can be divided into three techniques; active technique, passive technique and
compound technique. The active technique required external power input to improve the
heat transfer rate. This technique is complex and not all applications can adapt this kind
of technique. The passive technique did not require any external power, only use the
power from the system itself and create higher fluids pressure drop. It used geometrical
modifications by installing the inserts to the flow channel. This will create a disturbing
from the original flow, hence, it increase the heat transfer coefficient. The compound
technique is the combination between the active and passive technique. It is proven that
by using the passive technique, the rate of heat transfer can be improved. Sarada et al.
(2010) [6] studied the frictional and heat transfer characteristics in turbulent flow using
various widths of twisted tape inserts under constant wall heat flux. The result is that the
highest Nusselt number (Nu) obtained with full width of twisted tape. The mean heat

5
transfer gain is increase varied from 4% to 20% compared to plain tube. Dewan et al.
(2004) [7] described the effect toward the flow after implemented the augmentation
techniques. The passive technique use inserts such as wire coil, twisted tape or coil plate
is installed in the flow channel and will reduce the hydraulic diameter of the flow
channel. This will result in increasing of heat transfer due to the flow blockage that
increases the pressure drop, viscous effect and fluid flow velocity. Furthermore, by
installing the inserts also will result the formation of secondary flow that can enhance
the heat transfer. It provides better thermal contact between the surface and the fluid due
to the swirl created by the secondary flow and lead to a better mixture of fluid. Based on
Mohapatra and Sahu (2007) [8], the type of active technique and passive technique can
be described in the Table 1 and Table 2 below.
Table 1: Description for various type of active technique
Type Description
Mechanical aids The fluids were stirred by mechanical devices or rotating the
surface.
Surface vibration It is been applied to increase the convection heat transfer
coefficients at low or high frequency in single phase flow.
Fluid vibration With the frequency of vibration ranging from 1.0Hz – 1.0MHz
used in single phase flow.
Electrostatic fields The sources of electric is from alternative current (AC) or direct
current (DC) that been applied to heat exchange systems
involving dielectric fluid.
Injection Is been used only in single phase flow. Injecting the fluid into
the main bulk fluid through the porous zone or upstream heat
transfer section.
Suction Removing the vapor or fluid through the porous heated surface.
Jet impingement Direction of heating or cooling is perpendicular to the heat
transfer surface. Single or multiple jets may be used in single
phase flow.
6
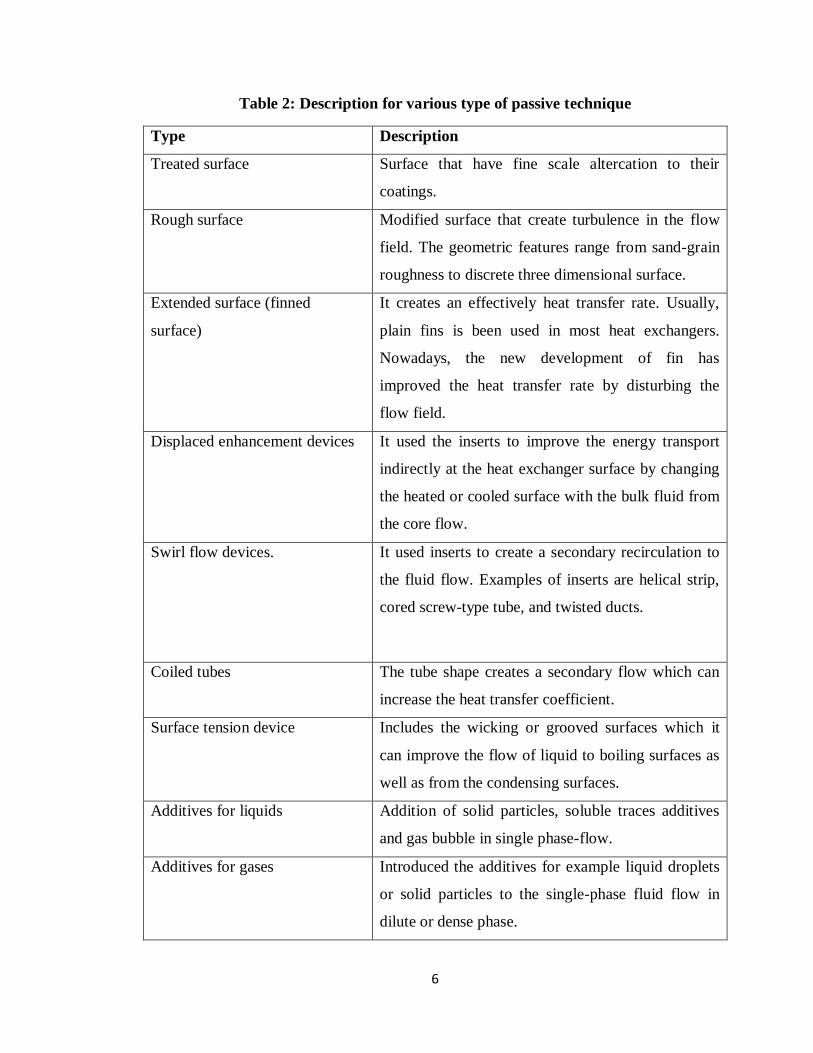
Table 2: Description for various type of passive technique
Type Description
Treated surface Surface that have fine scale altercation to their
coatings.
Rough surface Modified surface that create turbulence in the flow
field. The geometric features range from sand-grain
roughness to discrete three dimensional surface.
Extended surface (finned
surface)
It creates an effectively heat transfer rate. Usually,
plain fins is been used in most heat exchangers.
Nowadays, the new development of fin has
improved the heat transfer rate by disturbing the
flow field.
Displaced enhancement devices It used the inserts to improve the energy transport
indirectly at the heat exchanger surface by changing
the heated or cooled surface with the bulk fluid from
the core flow.
Swirl flow devices. It used inserts to create a secondary recirculation to
the fluid flow. Examples of inserts are helical strip,
cored screw-type tube, and twisted ducts.
Coiled tubes The tube shape creates a secondary flow which can
increase the heat transfer coefficient.
Surface tension device Includes the wicking or grooved surfaces which it
can improve the flow of liquid to boiling surfaces as
well as from the condensing surfaces.
Additives for liquids Addition of solid particles, soluble traces additives
and gas bubble in single phase-flow.
Additives for gases Introduced the additives for example liquid droplets
or solid particles to the single-phase fluid flow in
dilute or dense phase.
7
Numbers of experiment have been conducted to study the effect of inserts
towards the enhancement of heat transfer. The enhancement of heat transfer in passive
technique is depends on the type of fluid flow; laminar flow or turbulent flow. The wire
coil inserts is perform better in turbulent flow (Dewan et al.) meanwhile in laminar flow
the twisted tape inserts give a better result in heat transfer enhancement (Kumbhar and
Sane, 2010) [9]. Various experiments had been conducted to study the performance of
heat exchanger with wire coil inserts in turbulent flow. For example, Kim et al. (2001)
[10] had conducted the experiment to study the flow pattern of the fluid in vertical round
tube using wire coil insert. The observation is that the void fraction is higher than a
smooth tube in turbulent flow. Hence, the performance of wire coil in the turbulent flow
is higher than any other inserts. Arici and Asan (1994) [11] conducted the experiment to
enhance the turbulent flow by introducing the wire coil inserts. They found out that by
increasing the pitch of the wire coil will increase the heat transfer rate. Other than that,
Rahai et al. (2001) [12] also studied the effect of wire coil on mixing enhancement
turbulent jet from Bunsen burner. The wire coil have a constant 𝑝/𝐷 = 1. The result
shows that there is a significant increase in the mixing process near the discharge region
of the jet. There are also experiments been conducted to show the effect of twisted tape
inserts in laminar flow towards the performance of the heat exchanger. Yadav (2009)
[13] had conducted an experiment to investigate the influences of the half length twisted
tube inserts on pressure drop and heat transfer characteristics in U-bend double pipe heat
exchanger. The result is the heat transfer coefficients was increased 40% with half
length twisted tube inserts compared to the plain tube. Naphon (2006) [14] carried an
experiment to investigate the heat transfer characteristics and pressure drop with twisted
tape inserts in the horizontal double pipes. The result obtained showed that with twisted
tape inserts, the heat transfer rate is increase compared to those pipes without twisted
tape inserts.
8
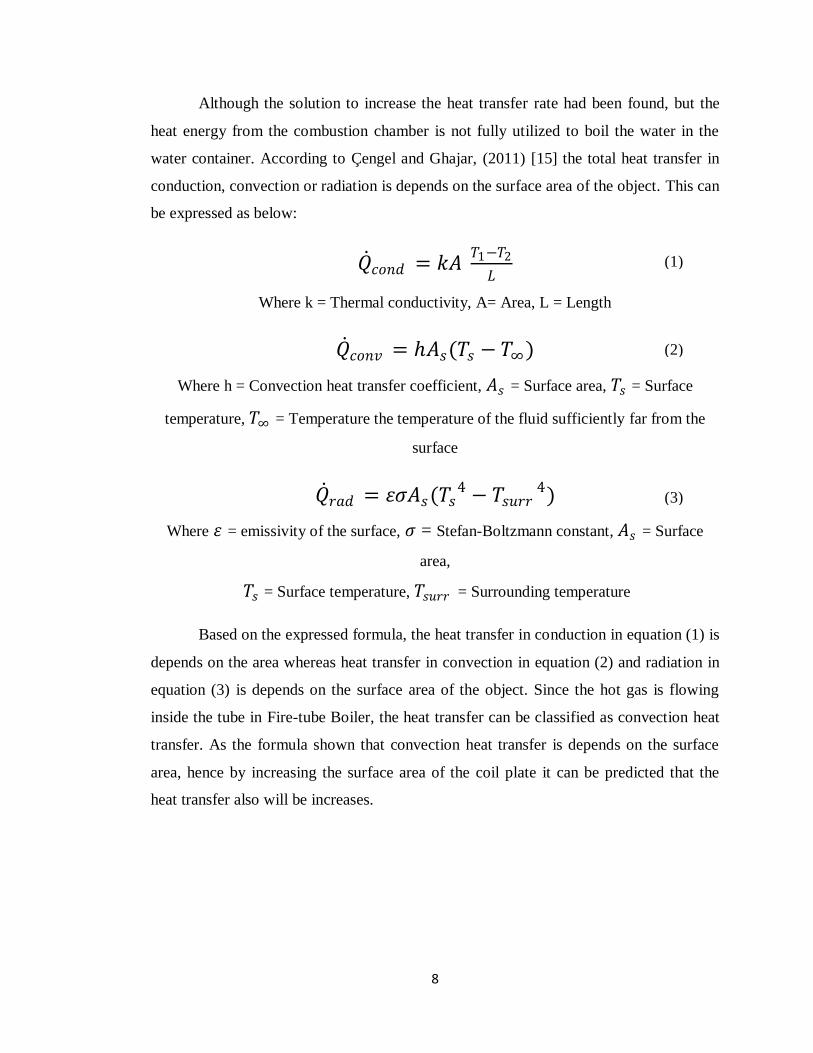
Although the solution to increase the heat transfer rate had been found, but the
heat energy from the combustion chamber is not fully utilized to boil the water in the
water container. According to Çengel and Ghajar, (2011) [15] the total heat transfer in
conduction, convection or radiation is depends on the surface area of the object. This can
be expressed as below:
𝑄 𝑐𝑜𝑛𝑑 = 𝑘𝐴 𝑇1−𝑇2
𝐿
Where k = Thermal conductivity, A= Area, L = Length
𝑄 𝑐𝑜𝑛𝑣 = 𝐴𝑠(𝑇𝑠 − 𝑇∞)
Where h = Convection heat transfer coefficient, 𝐴𝑠 = Surface area, 𝑇𝑠 = Surface
temperature, 𝑇∞ = Temperature the temperature of the fluid sufficiently far from the
surface
𝑄 𝑟𝑎𝑑 = 𝜀𝜎𝐴𝑠(𝑇𝑠4 − 𝑇𝑠𝑢𝑟𝑟
4)
Where 𝜀 = emissivity of the surface, 𝜎 = Stefan-Boltzmann constant, 𝐴𝑠 = Surface
area,
𝑇𝑠 = Surface temperature, 𝑇𝑠𝑢𝑟𝑟 = Surrounding temperature
Based on the expressed formula, the heat transfer in conduction in equation (1) is
depends on the area whereas heat transfer in convection in equation (2) and radiation in
equation (3) is depends on the surface area of the object. Since the hot gas is flowing
inside the tube in Fire-tube Boiler, the heat transfer can be classified as convection heat
transfer. As the formula shown that convection heat transfer is depends on the surface
area, hence by increasing the surface area of the coil plate it can be predicted that the
heat transfer also will be increases.
(1)
(2)
(3)
9
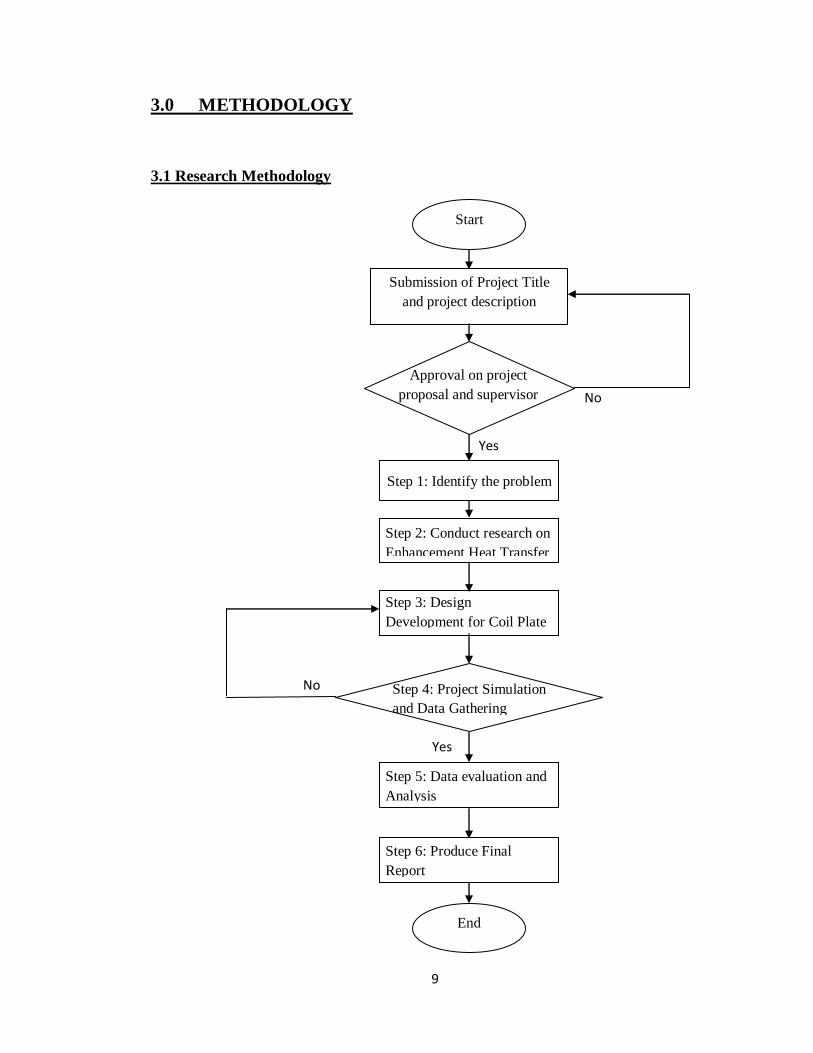
3.0 METHODOLOGY
3.1 Research Methodology
Start
Submission of Project Title
and project description
Approval on project
proposal and supervisor
Step 1: Identify the problem
Step 2: Conduct research on
Enhancement Heat Transfer
Step 3: Design
Development for Coil Plate
Step 4: Project Simulation
and Data Gathering
Step 5: Data evaluation and
Analysis
Step 6: Produce Final
Report
End
Yes
Yes
No
No
10
Step 1: Identify the Problem
The problem for the project should be identified first which is how to increase the heat
transfer in the Fire-tube Boiler with coil plates inserts into the tube. After identifying the
problem, then the objectives of the project can be determined which is to design new
sets of coil plates and compare the overall performance of the Fire-tube Boiler with the
new sets of design as well as without the coil plate.
Step 2: Conduct research on Enhancement Heat Transfer
Conduct a research regarding the enhancement technique for the heat transfer. The
enhancement technique is called augmentation technique which can be divided into three
types; active technique, passive technique and compound technique. Gather the
important information regarding those techniques based on the previous study and
experiment to carry out the project. Produce a literature review based on the information
obtained.
Step 3: Design Development for Coil Plate
Produce several designs of coil plates that can increase the heat transfer. Based on the
theory, to increase the heat transfer, the surface area of the coil plate should be bigger.
Hence, the coil plates should have set of holes to increase the surface area of the coil
plates. The diameter and number of holes should be varied in order to see the difference
of the heat transfer rate.
Step 4: Project Simulation and Data Gathering
The new design coil plate were simulate using the ANSYS software and collect the
important data for example temperature distribution, velocity distribution, and the heat
transfer rate. If the simulation part is fail to simulate, so step 3 should be repeated. After
simulating all the new design of coil plates as well as the tube without the coil plate, the
result and data should be recorded.
11
Step 5: Data evaluation and Analysis
Evaluate and analyze the data by comparing the results that been recorded based from
the simulation. Compare the heat transfer rate between the tube that have coil plates
insert and the plain tube. Study the effect of coil plate surface area towards the
performance of boiler. Specify the design of the coil plates that produce highest heat
transfer rate.
Step 6: Produce Final Report
Prepare final report to propose the new design of coil plate with the data obtained.
Produce some recommendations towards the project so that it can be improves and
obtain better result in enhancing the heat transfer rate of Fire-tube Boiler.
12
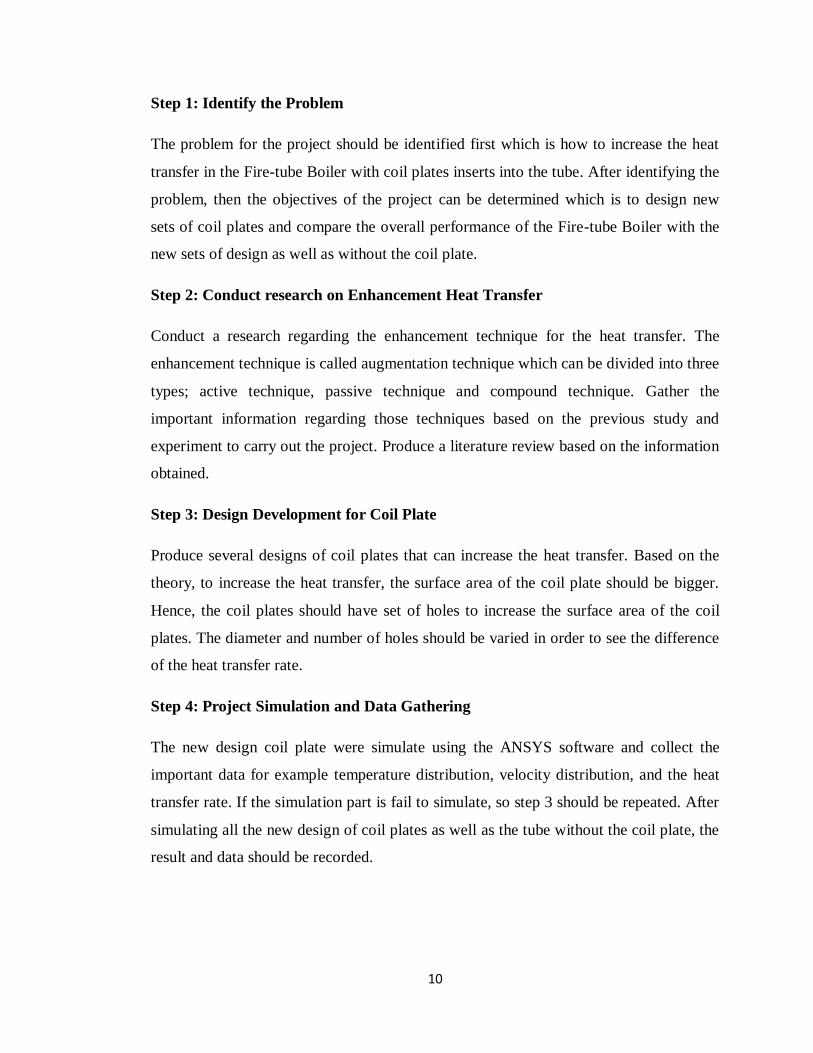
3.2 Project Methodology
In the simulation work, there are six step involves in order to obtain the results. The step
is been summarized in the flowchart shown as below.
Start
Step 1: Design coil plates and
all related geometry using
CATIA V5R14
Step 2: Import the geometry
into ANSYS Fluent 14.5
Step 3: Mesh the geometry
with fine and smooth meshing
Step 4: Set the boundary
condition for the stipulated
geometry
Step 5: Run the simulation
and evaluate the results
Step 6: Record the data and
save the results
End
No
Yes

13
Step 1: Design Coil Plates and All Related Geometry using CATIA V5R14
The coil plates should be design first using the design software which in this case is the
CATIA V5R14. The proposed design is to have the holes been punched to the coil plates
to increase the surface area. The holes diameter are varied from 4mm, 8mm, 10mm, and
15mm and the number of holes been created are one, two and three holes.
Step 2: Import the Geometry into ANSYS Fluent 14.5
The geometry that been designed should consists of the coil plates which is the inserts,
the air, and the generating tube of the Fire-tube boiler.
Step 3: Mesh the Geometry with Fine and Smooth Meshing
Meshing is the critical parts in the simulation work. Meshing is an integral part of the
computer-aided engineering (CAE) simulation process. With proper meshing, the results
will be much more accurate and precise. Other than that, meshing also will determine
the boundary from one object to another which in this case there are three different
objects; the inserts, air and the generating tube. The help of meshing will distinguish the
three objects and ease the simulation work.
Step 4: Set the Boundary Condition for the Stipulated Geometry
The hot air flowing inside the generating tube is assumed to be laminar with 160°C. The
air is incompressible, and steady. The hot air is also assumed to have a constant heat flux
with no slip condition. There is also no heat conduction occur at the surface of the coil
plates. The hot air is flowing from the inlet at certain velocity and goes out through the
outlet. The constant and varied parameters are shown in the Table 3 below.
Step 5: Run the Simulation and Evaluate the Results
Before running the simulation the calculation should be initialized based on the inlet
condition. After it has been initialized, run the simulation and evaluate the results obtain.
If the result is not according as the expected, repeat Step 4. Make sure that the boundary
condition has been set up according to the real situation.
14
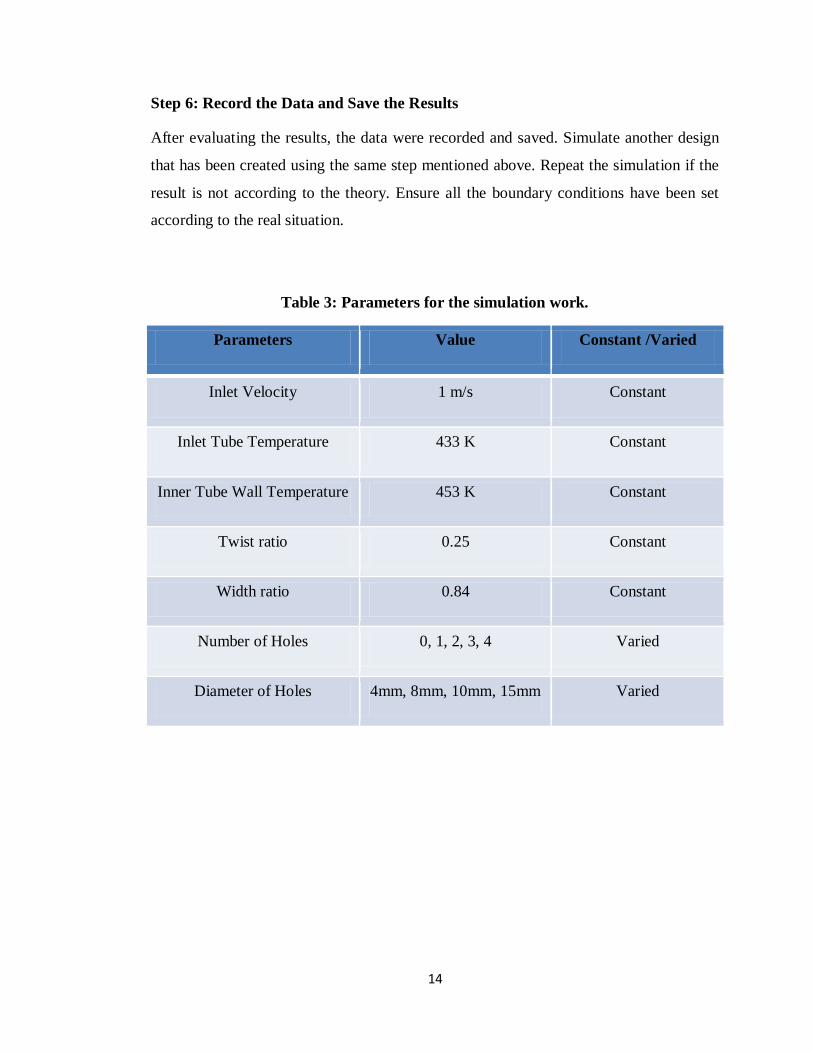
Step 6: Record the Data and Save the Results
After evaluating the results, the data were recorded and saved. Simulate another design
that has been created using the same step mentioned above. Repeat the simulation if the
result is not according to the theory. Ensure all the boundary conditions have been set
according to the real situation.
Table 3: Parameters for the simulation work.
Parameters Value Constant /Varied
Inlet Velocity 1 m/s Constant
Inlet Tube Temperature 433 K Constant
Inner Tube Wall Temperature 453 K Constant
Twist ratio 0.25 Constant
Width ratio 0.84 Constant
Number of Holes 0, 1, 2, 3, 4 Varied
Diameter of Holes 4mm, 8mm, 10mm, 15mm Varied

15
3.3 Project Gantt-Chart
Detail Week 1 Week 2 Week 3 Week 4 Week 5 Week 6 Week 7 Week 8 Week 9 Week 10 Week 11 Week 12 Week 13 Week 14
Selection of FYP topics
Preliminary Research
regarding boilers
Meeting with
Master Students
Gather Literature Review and Articles
relating to Augmentation Technique
Preparing Extended Proposals
Submission of Extended Proposals
Preparation for Proposal Defence
Proposal Defence
Preliminary Simulation
using Ansys
Obtain Preliminary Results
Preparing Interim Report
Submission of Interim Report
Table 4: Gantt-Chart for FYP I

16
Detail Week 1 Week 2 Week 3 Week 4 Week 5 Week 6 Week 7 Week 8 Week 9 Week 10 Week 11 Week 12 Week 13 Week 14
Data Collection
Preparing Progress Report
Progress Report Submission
Obtain Final Results
Pre-SEDEX
Preparing Final Report and Technical
Report
Submission of Disertation (Softcopy)
Submission of Technical Paper
Oral Presentation
Submission of Disertation (Hard Bound)
Table 5: Gantt-Chart FYP II

17
3.4 Key-Milestone
Table 6: Table for Key-milestones
No. Milestone Date
1 Submission of Extended Proposals June 2013
2 Proposal Defense June 2013
3 Preliminary Simulation August 2013
4 Data Collection September 2013
5 Submission Progress Report November 2013
6 Final Results of Simulation November 2013
7 Pre-SEDEX December 2013
8 Submission of Disertation (softcopy) December 2013
9 Submission of Technical Report December2013
10 Oral Presentation December 2013
11 Submission of Disertation (hardbound) January 2014
18
4.0 RESULTS & DISCUSSION
4.1 Proposed Design of Coil Plates
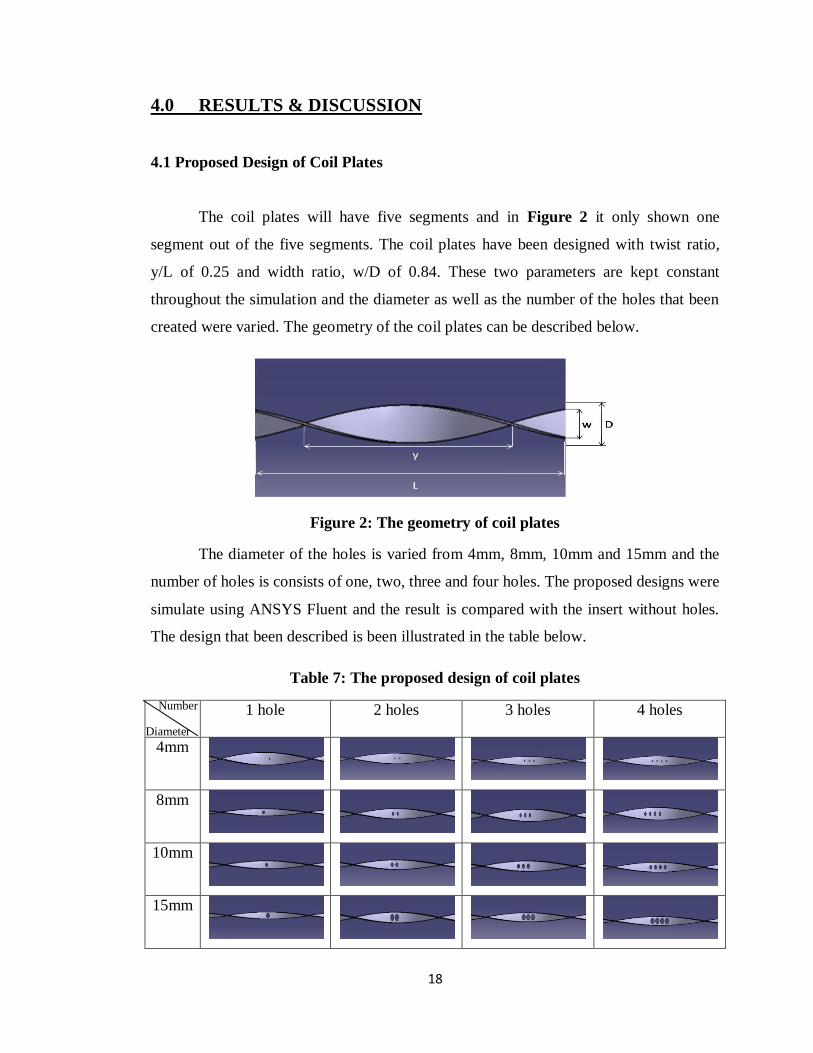
The coil plates will have five segments and in Figure 2 it only shown one
segment out of the five segments. The coil plates have been designed with twist ratio,
y/L of 0.25 and width ratio, w/D of 0.84. These two parameters are kept constant
throughout the simulation and the diameter as well as the number of the holes that been
created were varied. The geometry of the coil plates can be described below.
Figure 2: The geometry of coil plates
The diameter of the holes is varied from 4mm, 8mm, 10mm and 15mm and the
number of holes is consists of one, two, three and four holes. The proposed designs were
simulate using ANSYS Fluent and the result is compared with the insert without holes.
The design that been described is been illustrated in the table below.
Table 7: The proposed design of coil plates
1 hole 2 holes 3 holes 4 holes
4mm
8mm
10mm
15mm
Number
Diameter
19
4.2 Static Temperature Contour Plots
The simulation had been conducted for the tube with inserts as well as without
the inserts. The simulation for the tube with inserts had been conducted for all the
design. The results had been recorded and shown as below:
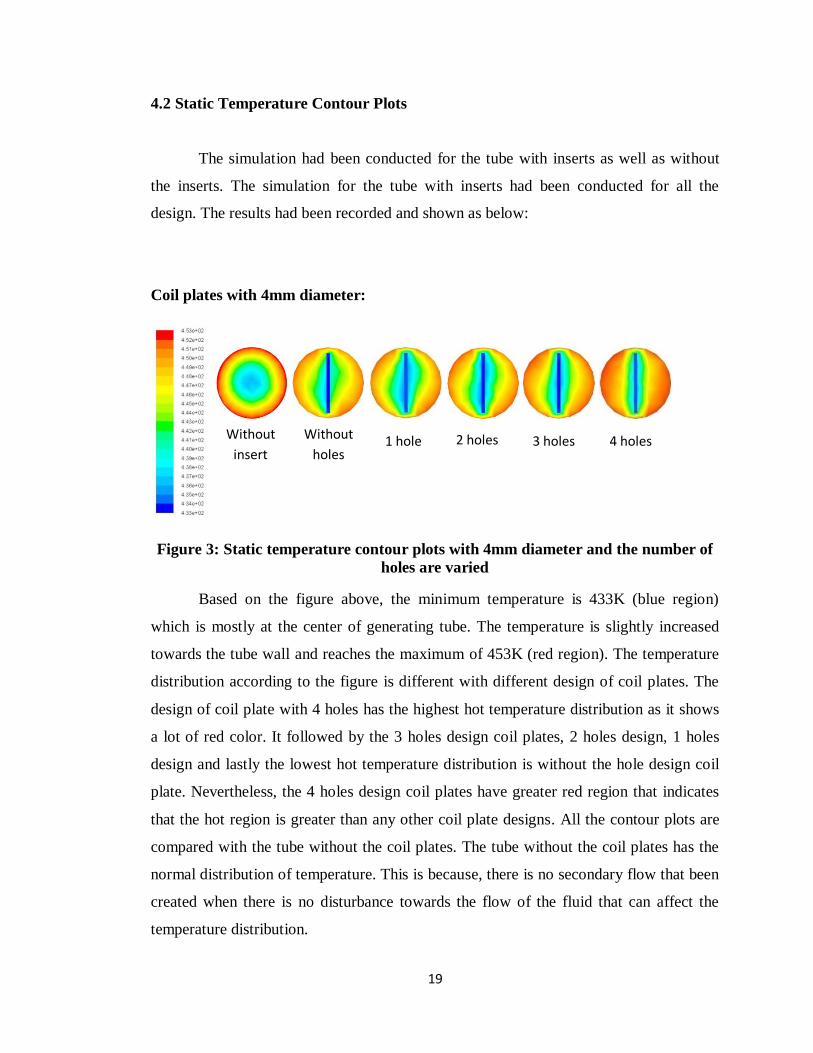
Coil plates with 4mm diameter:
Figure 3: Static temperature contour plots with 4mm diameter and the number of
holes are varied
Based on the figure above, the minimum temperature is 433K (blue region)
which is mostly at the center of generating tube. The temperature is slightly increased
towards the tube wall and reaches the maximum of 453K (red region). The temperature
distribution according to the figure is different with different design of coil plates. The
design of coil plate with 4 holes has the highest hot temperature distribution as it shows
a lot of red color. It followed by the 3 holes design coil plates, 2 holes design, 1 holes
design and lastly the lowest hot temperature distribution is without the hole design coil
plate. Nevertheless, the 4 holes design coil plates have greater red region that indicates
that the hot region is greater than any other coil plate designs. All the contour plots are
compared with the tube without the coil plates. The tube without the coil plates has the
normal distribution of temperature. This is because, there is no secondary flow that been
created when there is no disturbance towards the flow of the fluid that can affect the
temperature distribution.
1 hole Without
holes 2 holes 3 holes 4 holes Without
insert
20
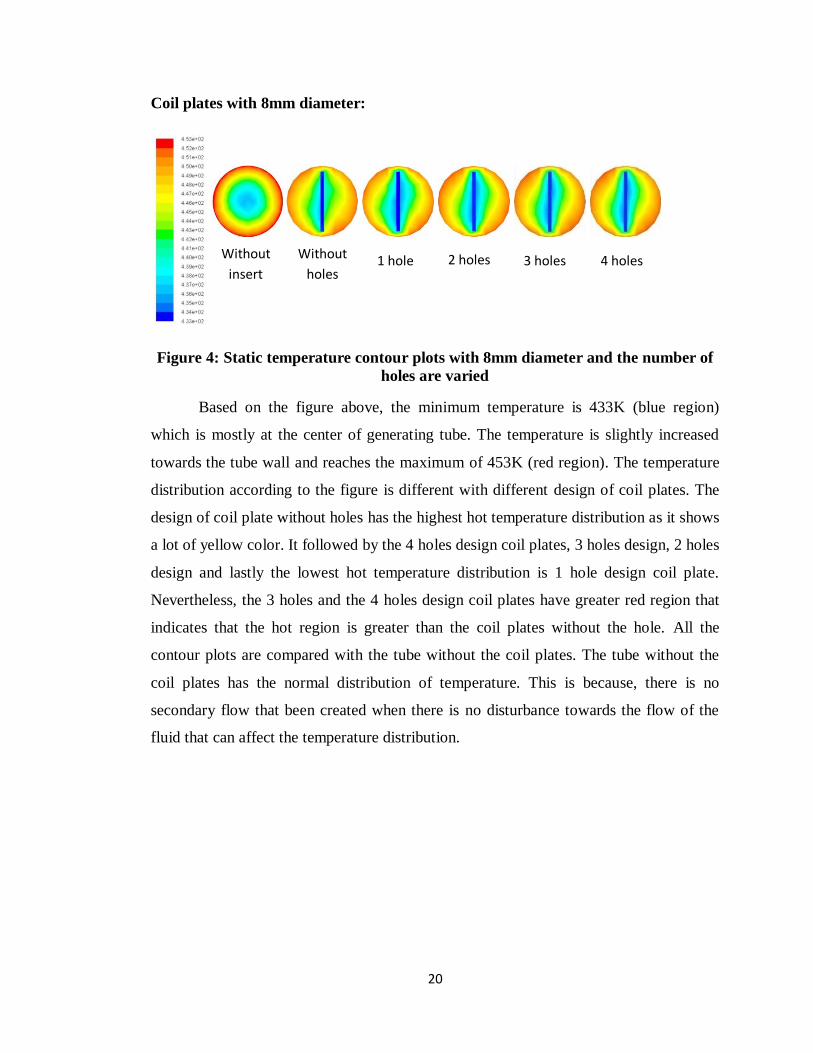
Coil plates with 8mm diameter:
Figure 4: Static temperature contour plots with 8mm diameter and the number of
holes are varied
Based on the figure above, the minimum temperature is 433K (blue region)
which is mostly at the center of generating tube. The temperature is slightly increased
towards the tube wall and reaches the maximum of 453K (red region). The temperature
distribution according to the figure is different with different design of coil plates. The
design of coil plate without holes has the highest hot temperature distribution as it shows
a lot of yellow color. It followed by the 4 holes design coil plates, 3 holes design, 2 holes
design and lastly the lowest hot temperature distribution is 1 hole design coil plate.
Nevertheless, the 3 holes and the 4 holes design coil plates have greater red region that
indicates that the hot region is greater than the coil plates without the hole. All the
contour plots are compared with the tube without the coil plates. The tube without the
coil plates has the normal distribution of temperature. This is because, there is no
secondary flow that been created when there is no disturbance towards the flow of the
fluid that can affect the temperature distribution.
1 hole Without
holes 2 holes 3 holes 4 holes Without
insert

21
Coil plates with 10mm diameter:
Figure 5: Static temperature contour plots with 10mm diameter and the number of
holes are varied
Based on the figure above, the minimum temperature is 433K (blue region)
which is mostly at the center of generating tube. The temperature is slightly increased
towards the tube wall and reaches the maximum of 453K (red region). The temperature
distribution according to the figure is not much different between the four designs. The
red region which indicates the hottest region clearly can be seen between the four
designs. This indicates that the design for 10mm diameter with variety number of holes
did not affect much towards the temperature distribution of the hot air flowing inside the
generating tube. Meanwhile, the tube without insert has the normal distribution of
temperature because there is no formation of secondary flow due to the absence of coil
plates.
1 hole Without
holes 2 holes 3 holes 4 holes Without
insert

22
Coil plates with 15mm diameter:
Figure 6: Static temperature contour plots with 15mm diameter and the number of
holes are varied
Based on the figure above, the minimum temperature is 433K (blue region)
which is mostly at the center of generating tube. The temperature is slightly increased
towards the tube wall and reaches the maximum of 453K (red region). The temperature
distribution according to the figure is different with different design of coil plates. The
design which does not drill with the holes has the highest hot temperature distribution as
it shows a lot of yellow color. It followed by the 1 hole design coil plates, 2 holes
design, 3 holes design and lastly the lowest hot temperature distribution is 4 hole design
coil plate. Increasing number of holes will affect the fluid flow. The fluid will flow
easily with bigger diameter and large number of holes. Hence it will affect the heat
transfer rate inside the generating tube.
1 hole Without
holes 2 holes 3 holes 4 holes Without
insert
23
Coil plates with 1 hole:
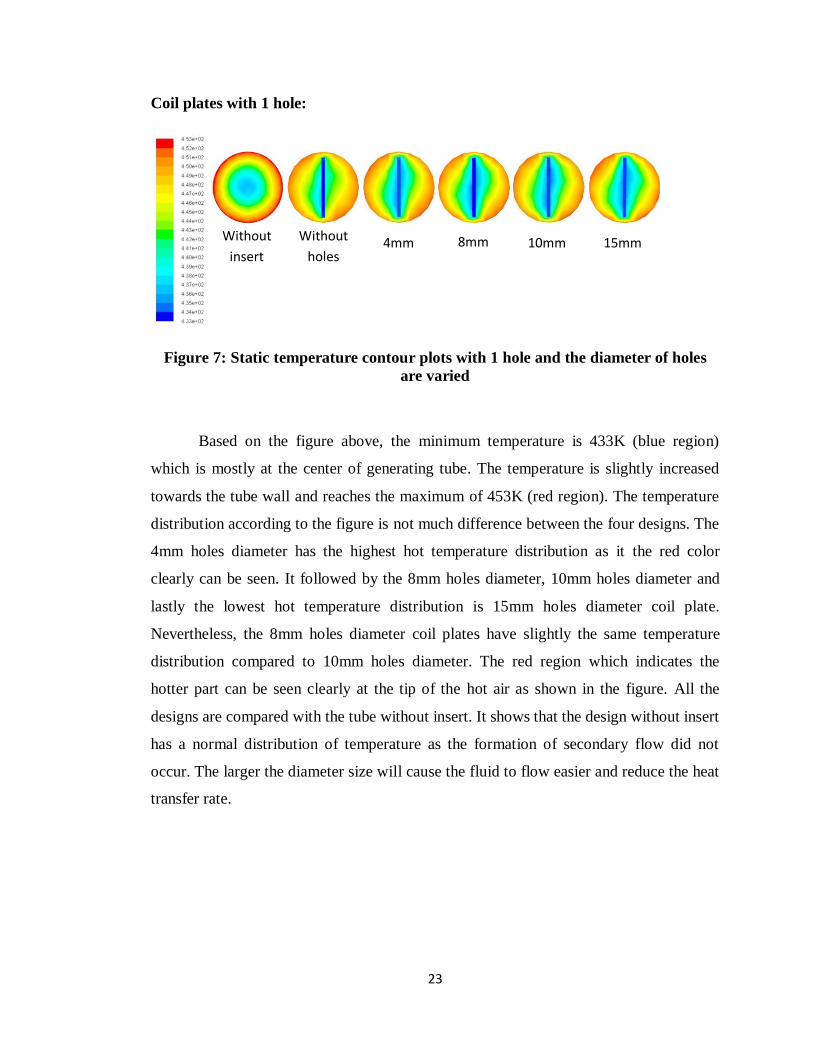
Figure 7: Static temperature contour plots with 1 hole and the diameter of holes
are varied
Based on the figure above, the minimum temperature is 433K (blue region)
which is mostly at the center of generating tube. The temperature is slightly increased
towards the tube wall and reaches the maximum of 453K (red region). The temperature
distribution according to the figure is not much difference between the four designs. The
4mm holes diameter has the highest hot temperature distribution as it the red color
clearly can be seen. It followed by the 8mm holes diameter, 10mm holes diameter and
lastly the lowest hot temperature distribution is 15mm holes diameter coil plate.
Nevertheless, the 8mm holes diameter coil plates have slightly the same temperature
distribution compared to 10mm holes diameter. The red region which indicates the
hotter part can be seen clearly at the tip of the hot air as shown in the figure. All the
designs are compared with the tube without insert. It shows that the design without insert
has a normal distribution of temperature as the formation of secondary flow did not
occur. The larger the diameter size will cause the fluid to flow easier and reduce the heat
transfer rate.
4mm Without
holes 8mm 10mm 15mm Without
insert
24
Coil plates with 2 holes:
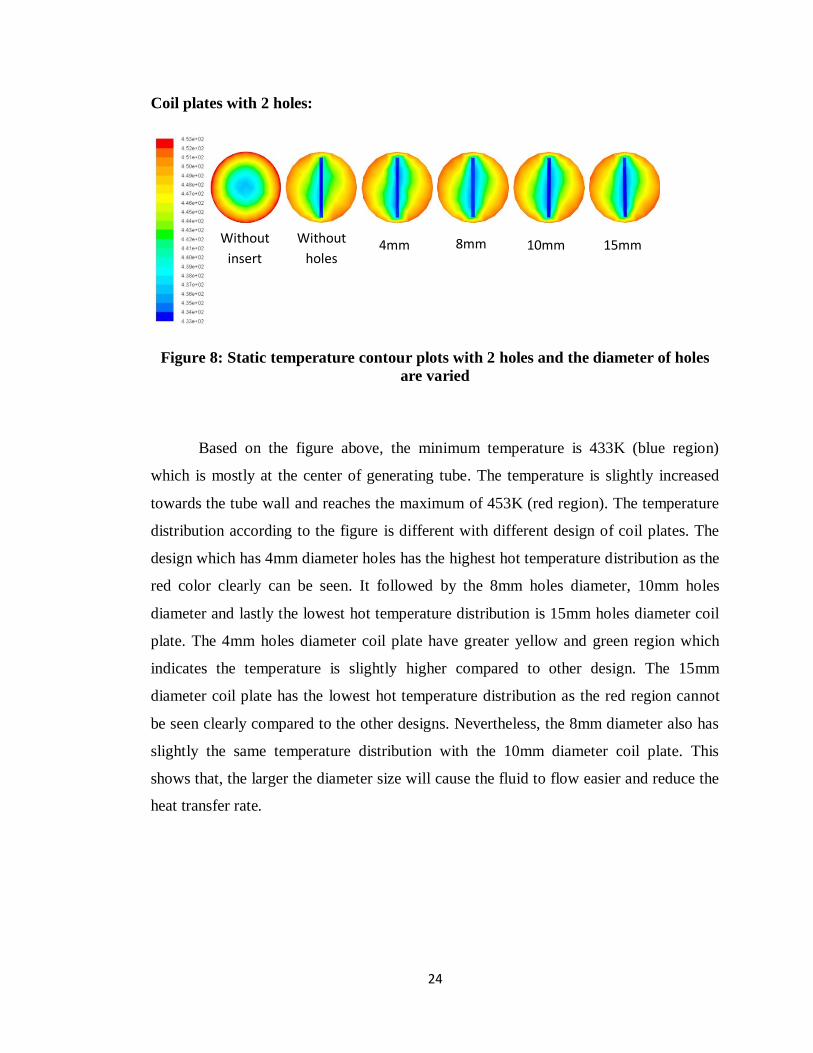
Figure 8: Static temperature contour plots with 2 holes and the diameter of holes
are varied
Based on the figure above, the minimum temperature is 433K (blue region)
which is mostly at the center of generating tube. The temperature is slightly increased
towards the tube wall and reaches the maximum of 453K (red region). The temperature
distribution according to the figure is different with different design of coil plates. The
design which has 4mm diameter holes has the highest hot temperature distribution as the
red color clearly can be seen. It followed by the 8mm holes diameter, 10mm holes
diameter and lastly the lowest hot temperature distribution is 15mm holes diameter coil
plate. The 4mm holes diameter coil plate have greater yellow and green region which
indicates the temperature is slightly higher compared to other design. The 15mm
diameter coil plate has the lowest hot temperature distribution as the red region cannot
be seen clearly compared to the other designs. Nevertheless, the 8mm diameter also has
slightly the same temperature distribution with the 10mm diameter coil plate. This
shows that, the larger the diameter size will cause the fluid to flow easier and reduce the
heat transfer rate.
4mm Without
holes 8mm 10mm 15mm Without
insert
25
Coil plates with 3 holes:
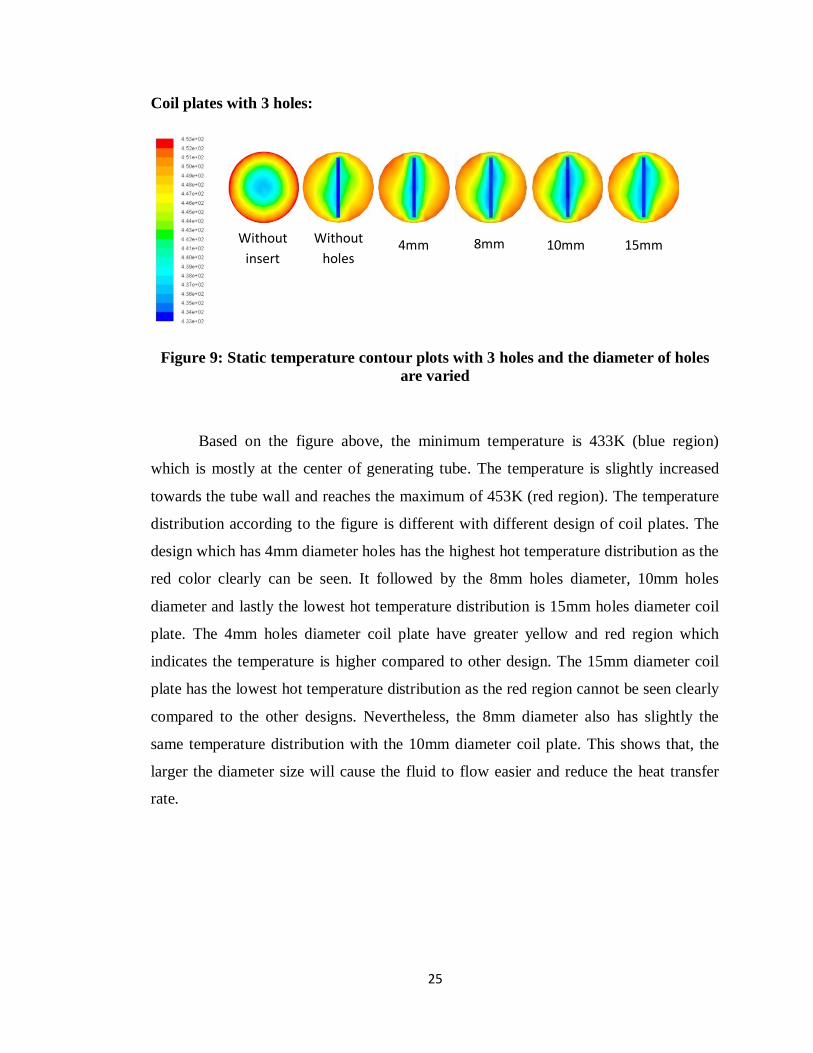
Figure 9: Static temperature contour plots with 3 holes and the diameter of holes
are varied
Based on the figure above, the minimum temperature is 433K (blue region)
which is mostly at the center of generating tube. The temperature is slightly increased
towards the tube wall and reaches the maximum of 453K (red region). The temperature
distribution according to the figure is different with different design of coil plates. The
design which has 4mm diameter holes has the highest hot temperature distribution as the
red color clearly can be seen. It followed by the 8mm holes diameter, 10mm holes
diameter and lastly the lowest hot temperature distribution is 15mm holes diameter coil
plate. The 4mm holes diameter coil plate have greater yellow and red region which
indicates the temperature is higher compared to other design. The 15mm diameter coil
plate has the lowest hot temperature distribution as the red region cannot be seen clearly
compared to the other designs. Nevertheless, the 8mm diameter also has slightly the
same temperature distribution with the 10mm diameter coil plate. This shows that, the
larger the diameter size will cause the fluid to flow easier and reduce the heat transfer
rate.
4mm Without
holes 8mm 10mm 15mm Without
insert
26
Coil plates with 4 holes:
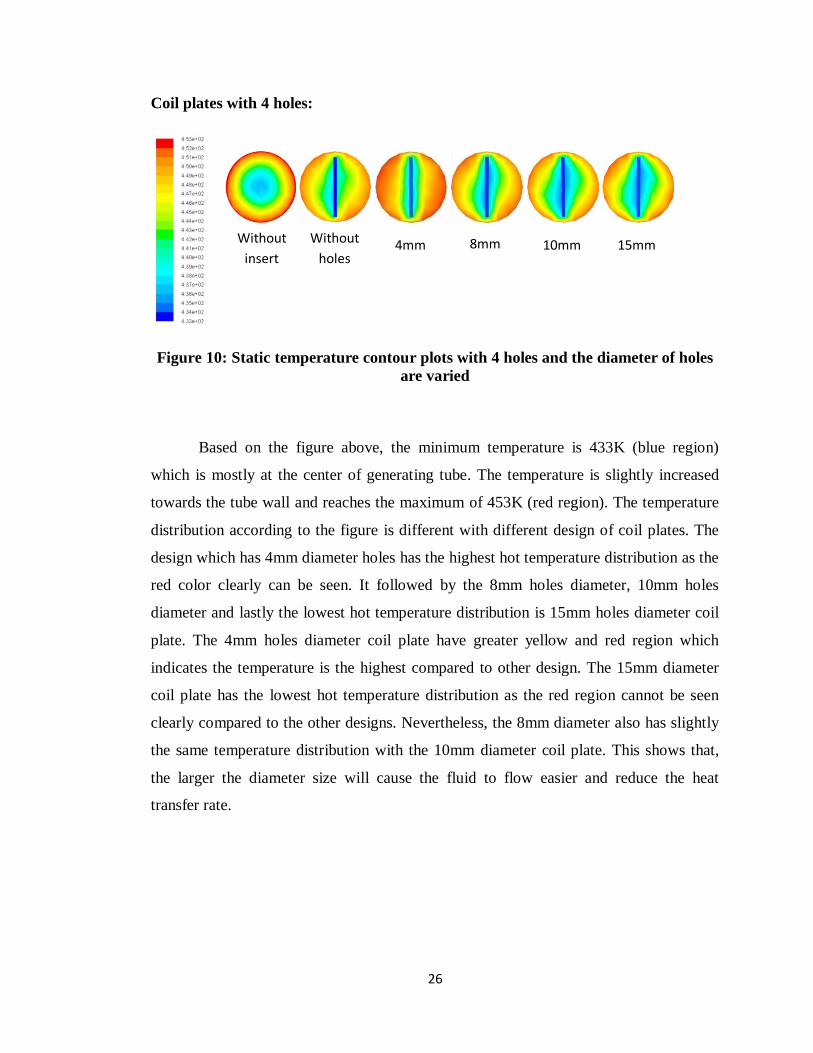
Figure 10: Static temperature contour plots with 4 holes and the diameter of holes
are varied
Based on the figure above, the minimum temperature is 433K (blue region)
which is mostly at the center of generating tube. The temperature is slightly increased
towards the tube wall and reaches the maximum of 453K (red region). The temperature
distribution according to the figure is different with different design of coil plates. The
design which has 4mm diameter holes has the highest hot temperature distribution as the
red color clearly can be seen. It followed by the 8mm holes diameter, 10mm holes
diameter and lastly the lowest hot temperature distribution is 15mm holes diameter coil
plate. The 4mm holes diameter coil plate have greater yellow and red region which
indicates the temperature is the highest compared to other design. The 15mm diameter
coil plate has the lowest hot temperature distribution as the red region cannot be seen
clearly compared to the other designs. Nevertheless, the 8mm diameter also has slightly
the same temperature distribution with the 10mm diameter coil plate. This shows that,
the larger the diameter size will cause the fluid to flow easier and reduce the heat
transfer rate.
4mm Without
holes 8mm 10mm 15mm Without
insert

27
4.3 Velocity Contour Plots
Coil plates with 4mm diameter:
Based on the figure above, each of the design has different maximum velocity
recorded. The highest value of maximum velocity is 1.49 m/s which are for the 4 holes
design coil plates. This design has the highest value of maximum velocity because it
contains greater number of holes which allows the hot air to flow through it with more
than one path than the other designs. The second highest value of maximum velocity is
1.48 m/s which are for the 3 holes design coil plates. The value is slightly lower than the
4 holes design. Next, the values of the maximum velocity are 1.47 m/s and 1.41 m/s for
2 holes design and 1 hole design respectively. The lowest value of maximum velocity
recorded is 1.35 m/s which are for the design without the holes. According to the figure
above, the maximum velocity is accumulates at the center of the generating tube. This is
because the maximum velocity is mainly focused on the center of the tube. The coil
plates separate the flow of the hot air hence creating the secondary flow to create a better
heat transfer rate.
1 hole
2 holes 3 holes
Without
holes Without
insert
4 holes
Figure 11: Velocity contour plots with 4mm diameter and the number of holes
are varied
28
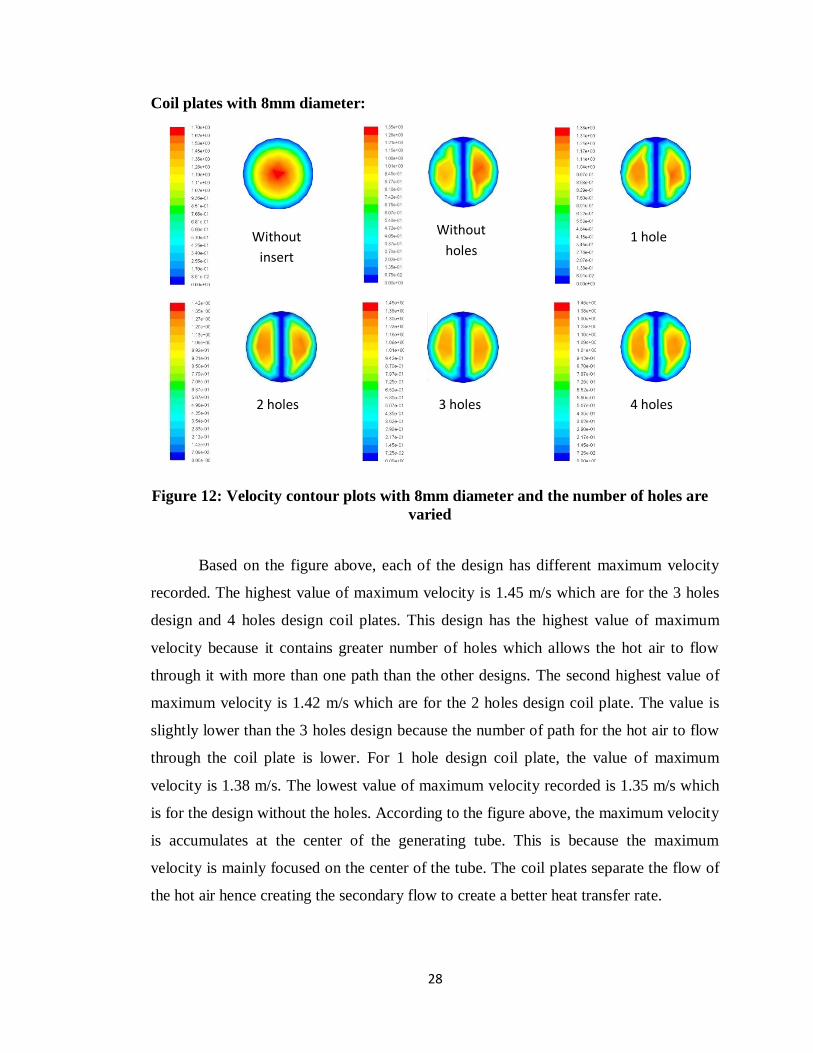
Coil plates with 8mm diameter:
Based on the figure above, each of the design has different maximum velocity
recorded. The highest value of maximum velocity is 1.45 m/s which are for the 3 holes
design and 4 holes design coil plates. This design has the highest value of maximum
velocity because it contains greater number of holes which allows the hot air to flow
through it with more than one path than the other designs. The second highest value of
maximum velocity is 1.42 m/s which are for the 2 holes design coil plate. The value is
slightly lower than the 3 holes design because the number of path for the hot air to flow
through the coil plate is lower. For 1 hole design coil plate, the value of maximum
velocity is 1.38 m/s. The lowest value of maximum velocity recorded is 1.35 m/s which
is for the design without the holes. According to the figure above, the maximum velocity
is accumulates at the center of the generating tube. This is because the maximum
velocity is mainly focused on the center of the tube. The coil plates separate the flow of
the hot air hence creating the secondary flow to create a better heat transfer rate.
Figure 12: Velocity contour plots with 8mm diameter and the number of holes are
varied
1 hole
2 holes 3 holes
Without
holes Without
insert
4 holes
29
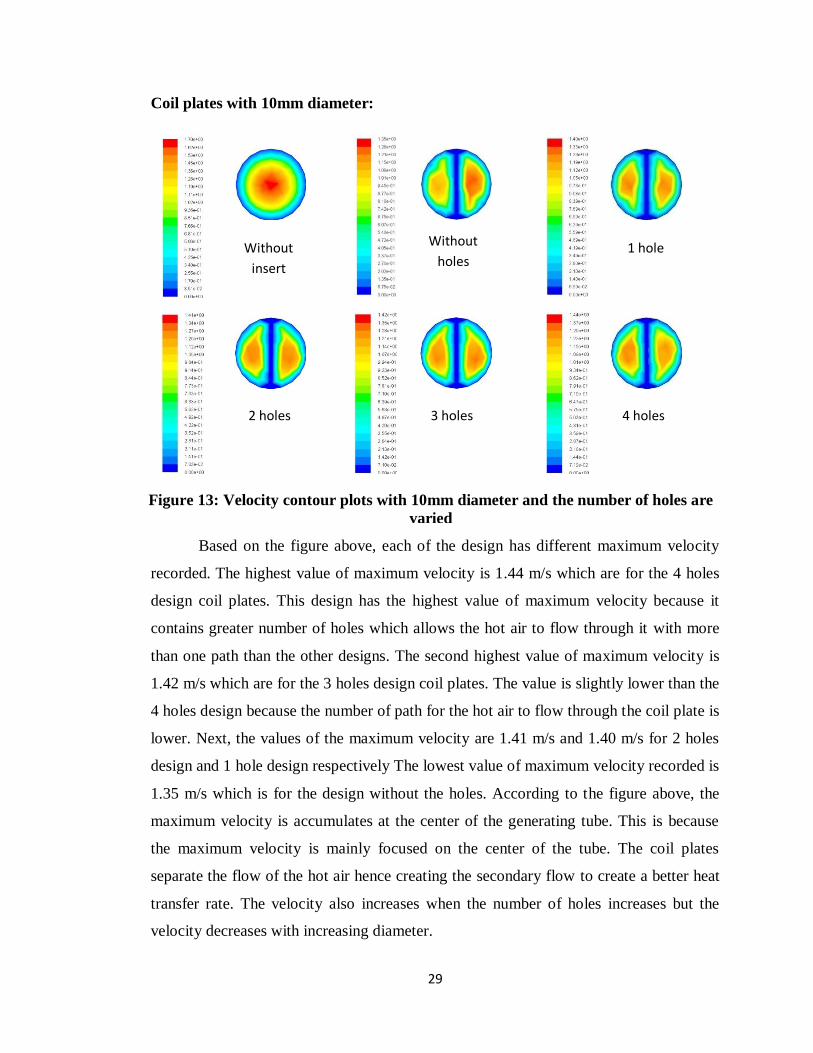
Coil plates with 10mm diameter:
Based on the figure above, each of the design has different maximum velocity
recorded. The highest value of maximum velocity is 1.44 m/s which are for the 4 holes
design coil plates. This design has the highest value of maximum velocity because it
contains greater number of holes which allows the hot air to flow through it with more
than one path than the other designs. The second highest value of maximum velocity is
1.42 m/s which are for the 3 holes design coil plates. The value is slightly lower than the
4 holes design because the number of path for the hot air to flow through the coil plate is
lower. Next, the values of the maximum velocity are 1.41 m/s and 1.40 m/s for 2 holes
design and 1 hole design respectively The lowest value of maximum velocity recorded is
1.35 m/s which is for the design without the holes. According to the figure above, the
maximum velocity is accumulates at the center of the generating tube. This is because
the maximum velocity is mainly focused on the center of the tube. The coil plates
separate the flow of the hot air hence creating the secondary flow to create a better heat
transfer rate. The velocity also increases when the number of holes increases but the
velocity decreases with increasing diameter.
Figure 13: Velocity contour plots with 10mm diameter and the number of holes are
varied
1 hole
2 holes 3 holes
Without
holes Without
insert
4 holes
30
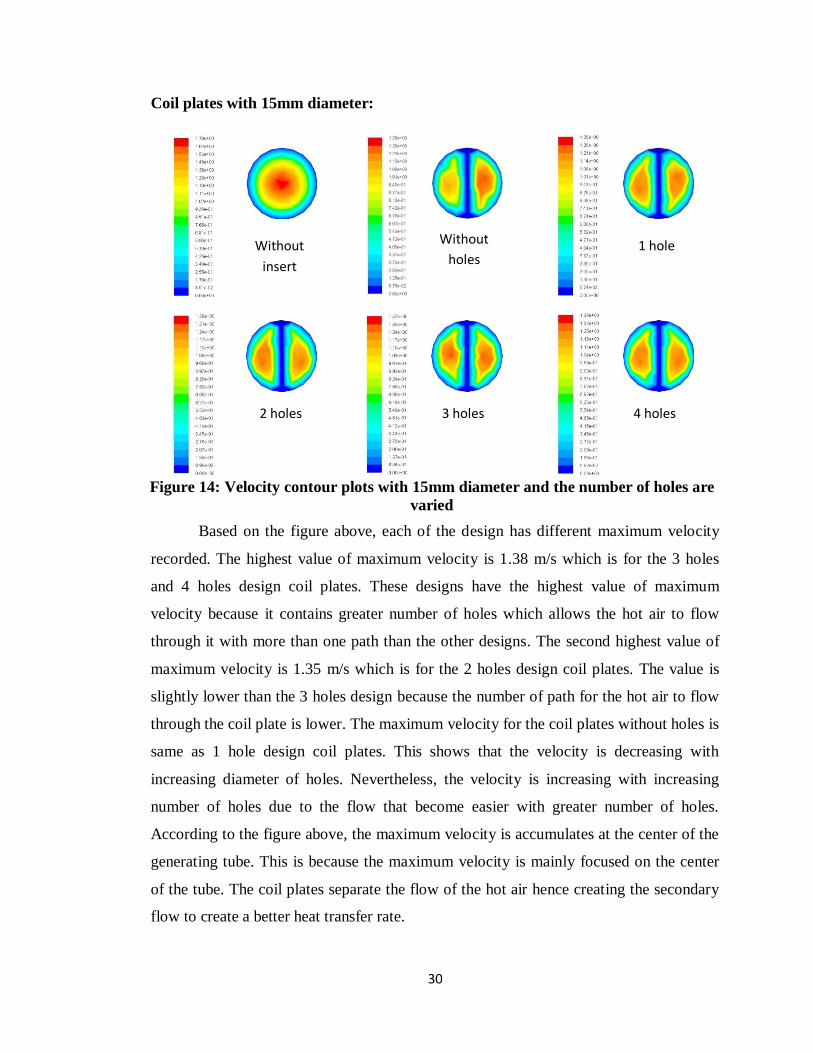
Coil plates with 15mm diameter:
Based on the figure above, each of the design has different maximum velocity
recorded. The highest value of maximum velocity is 1.38 m/s which is for the 3 holes
and 4 holes design coil plates. These designs have the highest value of maximum
velocity because it contains greater number of holes which allows the hot air to flow
through it with more than one path than the other designs. The second highest value of
maximum velocity is 1.35 m/s which is for the 2 holes design coil plates. The value is
slightly lower than the 3 holes design because the number of path for the hot air to flow
through the coil plate is lower. The maximum velocity for the coil plates without holes is
same as 1 hole design coil plates. This shows that the velocity is decreasing with
increasing diameter of holes. Nevertheless, the velocity is increasing with increasing
number of holes due to the flow that become easier with greater number of holes.
According to the figure above, the maximum velocity is accumulates at the center of the
generating tube. This is because the maximum velocity is mainly focused on the center
of the tube. The coil plates separate the flow of the hot air hence creating the secondary
flow to create a better heat transfer rate.
Figure 14: Velocity contour plots with 15mm diameter and the number of holes are
varied
1 hole
2 holes 3 holes
Without
holes Without
insert
4 holes
31
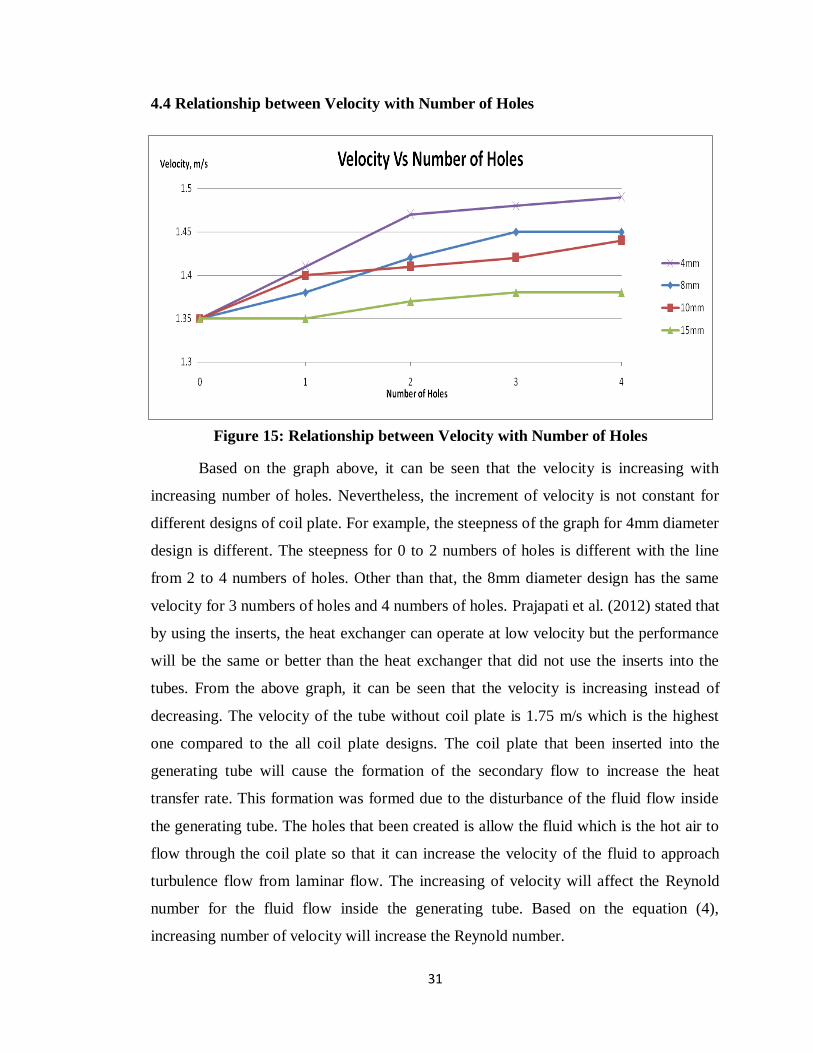
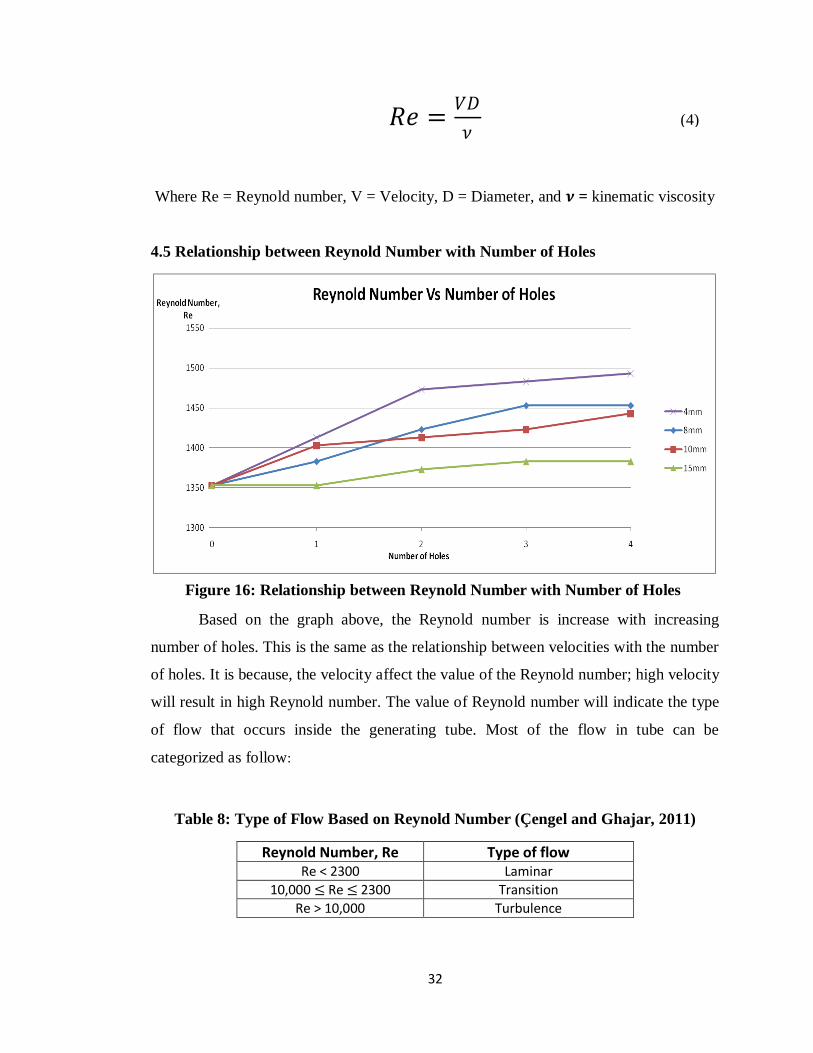
4.4 Relationship between Velocity with Number of Holes
Based on the graph above, it can be seen that the velocity is increasing with
increasing number of holes. Nevertheless, the increment of velocity is not constant for
different designs of coil plate. For example, the steepness of the graph for 4mm diameter
design is different. The steepness for 0 to 2 numbers of holes is different with the line
from 2 to 4 numbers of holes. Other than that, the 8mm diameter design has the same
velocity for 3 numbers of holes and 4 numbers of holes. Prajapati et al. (2012) stated that
by using the inserts, the heat exchanger can operate at low velocity but the performance
will be the same or better than the heat exchanger that did not use the inserts into the
tubes. From the above graph, it can be seen that the velocity is increasing instead of
decreasing. The velocity of the tube without coil plate is 1.75 m/s which is the highest
one compared to the all coil plate designs. The coil plate that been inserted into the
generating tube will cause the formation of the secondary flow to increase the heat
transfer rate. This formation was formed due to the disturbance of the fluid flow inside
the generating tube. The holes that been created is allow the fluid which is the hot air to
flow through the coil plate so that it can increase the velocity of the fluid to approach
turbulence flow from laminar flow. The increasing of velocity will affect the Reynold
number for the fluid flow inside the generating tube. Based on the equation (4),
increasing number of velocity will increase the Reynold number.
Figure 15: Relationship between Velocity with Number of Holes
32
𝑅𝑒 =𝑉𝐷
𝜈
Where Re = Reynold number, V = Velocity, D = Diameter, and 𝝂 = kinematic viscosity
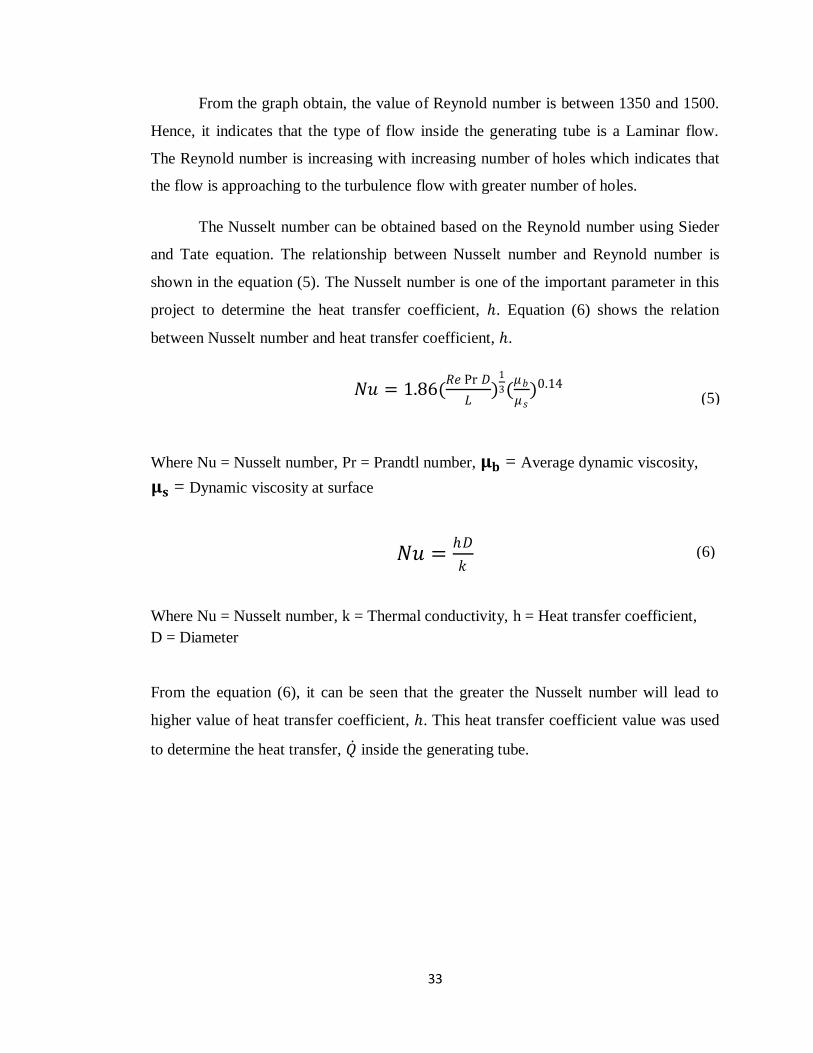
4.5 Relationship between Reynold Number with Number of Holes
Based on the graph above, the Reynold number is increase with increasing
number of holes. This is the same as the relationship between velocities with the number
of holes. It is because, the velocity affect the value of the Reynold number; high velocity
will result in high Reynold number. The value of Reynold number will indicate the type
of flow that occurs inside the generating tube. Most of the flow in tube can be
categorized as follow:
Table 8: Type of Flow Based on Reynold Number (Çengel and Ghajar, 2011)
Reynold Number, Re Type of flow Re < 2300 Laminar
10,000 ≤ Re ≤ 2300 Transition
Re > 10,000 Turbulence
(4)
Figure 16: Relationship between Reynold Number with Number of Holes
33
From the graph obtain, the value of Reynold number is between 1350 and 1500.
Hence, it indicates that the type of flow inside the generating tube is a Laminar flow.
The Reynold number is increasing with increasing number of holes which indicates that
the flow is approaching to the turbulence flow with greater number of holes.
The Nusselt number can be obtained based on the Reynold number using Sieder
and Tate equation. The relationship between Nusselt number and Reynold number is
shown in the equation (5). The Nusselt number is one of the important parameter in this
project to determine the heat transfer coefficient, . Equation (6) shows the relation
between Nusselt number and heat transfer coefficient, .
𝑁𝑢 = 1.86(𝑅𝑒 Pr 𝐷
𝐿)
1
3(𝜇𝑏
𝜇𝑠)0.14
Where Nu = Nusselt number, Pr = Prandtl number, 𝛍𝐛 = Average dynamic viscosity,
𝛍𝐬 = Dynamic viscosity at surface
𝑁𝑢 =𝐷
𝑘
Where Nu = Nusselt number, k = Thermal conductivity, h = Heat transfer coefficient,
D = Diameter
From the equation (6), it can be seen that the greater the Nusselt number will lead to
higher value of heat transfer coefficient, . This heat transfer coefficient value was used
to determine the heat transfer, 𝑄 inside the generating tube.
(6)
(5)

34
4.6 Relationship between Nusselt Number with Number of Holes
Based on the graph above, the Nusselt number is increase with increasing
number of holes. The steepness for each of the designs is not the same. For example,
4mm diameter design coil plate has higher steepness compared to other designs. The
number of holes also does not affect the steepness of the graph but it affect the Nusselt
number. But in overall, the higher number of holes the greater the Nusselt number.
Based on the equation (5), if Reynold number is increase, the Nusselt number
also will increase. The 4mm diameter design coil plate has the highest value of Nusselt
number due to the maximum velocity that is also the highest one compared to other
designs. It followed by the 8mm diameter design coil plate, 10mm diameter design coil
plate and lastly is the 15mm diameter design coil plate. Based on the graph it can be
seen that the bigger the diameter, the lower the value of Nusselt number. With lower
value of Nusselt number, it will affect the heat transfer rate, 𝑄 inside the generating tube.
By obtaining the value of Nusselt number, the heat transfer coefficient, also
can be determined using equation (6). Hence, the heat transfer also can be determined as
well. Most of the parameter such as diameter, D, inlet temperature, T, and the length of
the tube, L, are kept constant throughout the experiment.
Figure 17: Relationship between Nusselt Number with Number of Holes

35
4.7 Relationship between Surface Areas of Coil Plate with Number of Holes
Based on the graph above, it can be seen that the surface area of the coil plate is
decreasing with increasing size of holes. The surface area of the coil plate also decrease
with increasing number of holes. From the first hypothesis, it is stated that the surface
area of the coil plate will increase when the holes is created on it. But from the graph
shown above, the surface area is decreasing when the holes is created.
The 4mm diameter design coil plate has the highest value of surface area while
the 15mm diameter design coil plate has the lowest. The decrement line for 4mm
diameter design coil plate is too low because the value difference is not too big. While
the decrement line for 15mm diameter design coil plate is the highest due to the value
drop is too big.
Although the surface area is decreasing, the velocity is increase with decreasing
size of holes. With this factor, the heat transfer rate can be increase. It is because when
velocity is increase, it will affect the Nusselt number that also will increase. The velocity
also increases with increasing number of holes.
Figure 18: Relationship between Surface Areas of Coil Plate with Number of Holes

36
4.8 Relationship between Heat Transfer Rate with Number of Holes
Based on the graph above, the 4mm diameter design coil plate has the highest
value of heat transfer rate, 𝑄 . For 1 number of holes, the 10mm diameter design coil
plate has slightly higher value of heat transfer compared to 8mm diameter design coil
plate. But after that, the 8mm diameter coil plate has the higher value compared to
10mm diameter design coil plate. The value of heat transfer is increasing for the 4mm
diameter design coil plate as well as 8mm diameter design coil plate. But at 4 numbers
of holes, the heat transfer is decreasing for 8mm diameter design coil plate. For 10mm
diameter design coil plate, the value of heat transfer is constant from 1 number of holes
to 3 numbers of holes. But at 4 numbers of holes, the value is slightly increasing. For
15mm diameter design coil plate, the value of heat transfer is decreasing from without
holes to 4 numbers of holes. It can be seen that 15mm diameter design is not the best
design to increase the heat transfer rate inside the generating tube.
The heat transfer rate inside the tube can be determined from the equation (7).
Note that the temperature difference between the surface and the fluid is kept constant
throughout the simulation work.
Figure 19: Relationship between Heat Transfer Rate with Number of Holes
37
𝑄 = 𝐴𝑠(𝑇𝑠 − 𝑇∞)
Where 𝑄 = Heat transfer rate, = heat transfer coefficient, 𝐴𝑠 = Surface area,
𝑇𝑠 = Surface temperature, 𝑇∞ = Fluid temperature
The heat transfer coefficient is obtained based on the Nusselt number using the
equation (6). The surface area of the coil plate is actually decreased when the hole is
created. The surface area without the holes has the highest value compared to other
designs. The parameter that increases the value of heat transfer rate, 𝑄 is the heat
transfer coefficient, which is affected by the velocity of the fluid. Although the surface
area is decreased, the velocity of the fluid is increasing and will increase the value of
heat transfer coefficient.
The heat transfer rate, 𝑄 is increased due to the increasing value of velocity. The
holes that been created on the coil plate will leads to the higher velocity. The fluid is
initially in laminar flow when there is no hole created on the coil plate. But after the hole
is created, the velocity is increase and as well as the Reynold number, Re. The
increasing value of Reynold number indicates that the flow is approaching to the
turbulence flow to create a better heat transfer rate.
(7)

38
4.9 Relationship between Pressure Drop with Number of Holes
Based on the graph above, the 4mm diameter design coil plate has the highest
value of pressure drop, ∆𝑷, which is approximately 1.90 Pa for 4 numbers of holes. The
gradient of this design is steep from 0 number of hole to 2 numbers of holes then it
decreases. But still has the highest value compared to other designs. The 8mm diameter
design coil plate has higher steepness compared to 10mm diameter and 15mm diameter
design coil plate. From the graph, it can be seen that the lower the diameter of holes, the
higher the pressure drop. Increasing number of holes also will increase the pressure
drop.
Prajapati et al. (2012) has stated that by inserting the coil plate into the
generating tube, it will leads to a pressure drop. It has been proved in the graph that is
shown above. The pressure drop has occurred when inserting the coil plate into the
generating tube. The pressure drop also increase with increasing number of holes and
decreasing size of holes diameter. The pressure drop can be calculated using the
equation (8) shown below:
Figure 20: Relationship between Pressure Drop with Number of Holes

39
∆𝑃 = 𝑓𝐿
𝐷
𝜌𝑉2
2
Where ∆𝑃 = Pressure drop, 𝑓 = friction factor, 𝜌 = density of fluid, 𝐿 = Length of tube,
𝐷 = Inner diameter of tube, 𝑉 = Velocity of the fluid.
And the friction factor, 𝑓, for laminar flow in circular tube can be calculated by equation
(9):
𝑓 =64
𝑅𝑒
Where Re = Reynold number.
From the equation (8) and (9), it can be seen that the velocity affect the pressure
drop, ∆𝑃. Increasing velocity will increase the pressure drop inside the generating tube.
For 4mm diameter design coil plate, it has the highest velocity compared to all other
design. Hence, the pressure drop, ∆𝑃, is also the highest.
(8)
(9)
40
5.0 CONCLUSIONS & RECOMMENDATIONS
The conclusion that can be made based on the project that been done by the author for
this Final Year Project are:
The coil plate surface area is decrease with increasing size of holes. The coil
plate surface area also decrease with increasing number of holes. But the heat
transfer rate is increase with increasing velocity due to greater number of holes
and low size of diameter.
The proposed design of coil plate in this project is 4mm diameter with 4 numbers
of holes. This is because this design results in high heat transfer rates.
The overall performance of boiler is increase with inserting the coil plate into the
generating tube compared to the one without the coil plate.
The objective of the project have been achieved by studying the effect of the coil
plates surface area in enhancement of heat transfer using simulation software and
propose new design of coil plate using simulation software. The overall performance of
boiler also has been compared with boiler with and without the coil plate inside the
generating tube.
For the future works, it would be good if the result for the simulation work can be
compared to the experimental data. It is because it can verify the results from the
simulation work with the experimental data. The result from the experiment is according
to the real case situation while the simulation work is only virtual work that has some
limitations. Due to the limitations, the assumptions have to be made and the result may
not be the same as the experimental result. Below are some recommendations that could
be made for further research to improve the heat transfer rate.
Improve the flow of the hot air inside the generating tube to change the laminar
to turbulence flow. Hence, it can increase the heat transfer rate.
Conduct a research on how the width ratio and twist ratio will affect the heat
transfer rate with different design of coil plate.
41
6.0 REFERENCES
[1] Amori, K. E., & Insayif, R. K. (2011), “Investigation of twisted tape turbulator
for fire tube boiler”. Journal of Engineering, vol. 7, pp. 695-696.
[2] Zimparov, V., & Penchev, P. (2000), “Performance evaluation of some tube
inserts as heat transfer enhancement techniques”.
[3] Prajapati, C., Patel, P., Patel, J., & Patel, U. (2012), “A review of heat transfer
enhancement using twisted tape”. International Journal of Advanced
Engineering Research and Studies, vol. 2, pp. 162-164.
[4] Kumar, C.N., & Murugesan, P. (2012), “Review on twisted tapes heat transfer
enhancement”. International Journal of Scientific & Engineering Research, vol.
3, pp. 1-2.
[5] FEMP O&M Best Practices, “A Guide to Achieving Operational Efficiency”,
U.S. Department of Energy, 2010. Retrieved from:
http://www1.eere.energy.gov/femp/pdfs/omguide_complete.pdf
[6] Sarada, S.N., Raju, A.V.S.R., Radha, K.K., & Sunder, L.S. (2010),
“Enhancement of heat transfer using varying width twisted tape inserts”.
International Journal of Engineering, Science and Technology, vol. 2, pp. 108-
113.
[7] Dewan, A., Mahanta, P., Raju, K.S., & Kumar, P.S. (2004), “Review of passive
heat transfer augmentation techniques”. Journal of Power and Energy, vol. 218,
pp. 510-512.
[8] Mohapatra, V.C., & Sahu, D. (2007), “Experimental studies on heat transfer
augmentation using twisted aluminum taper clips and twisted tapes as inserts”.
National Institute of Technology Rourkela.
[9] Kumbhar, D.G., & Sane N.K. (2010), “Heat transfer enhancement in a circular
tube twisted with swirl generator: A review”. Gujarat, India.
42
[10] Kim, H. Y., Koyama, S., and Matsumoto, W. (2001), “Flow pattern and flow
characteristics for counter-current two-phase flow in a vertical round tube with
wire coil insert”. Int. J. Multiphase Flow, vol. 27, pp. 2063–2081.
[11] Arici, M. E., and Asan, H. (1994), “Enhancement of turbulent flow heat transfer
in tubes by means of wire coil inserts”. ASME PD Adv. in Heat Transfer, vol. 64,
pp. 113–117.
[12] Rahai, H. R., Vu, H. T., and Shojaeefard, M. H. (2001), “Mixing enhancement
using a coil insert”. Appl. Thermal Engineering, vol. 21, pp. 303–309.
[13] Yadav, A. (2009), "Effect of half length twisted tape turbulator on heat transfer
& pressure drop characteristics inside a double pipe U-bend heat exchanger".
Jordan journal of Mechanical & Industrial engineering, vol. 3, pp. 17-22.
[14] Naphon, P. (2006), "Heat transfer & pressure drop in horizontal double pipes
with & without twisted tape inserts". International Communications in Heat and
Mass Transfer, vol. 33, pp. 166-175.
[15] Çengel Y.A., & Ghajar A.J. (2011), “Heat and mass transfer; Fundamentals and
Application”. McGraw-Hill, New York.

APPENDIX
Appendix – I
Sample calculation for 4mm diameter with 4 numbers of holes design coil plate
Based on the simulation, the maximum velocity is 1.49 m/s. Based on this velocity, the
Reynold number can be calculated. From equation (4):
𝑅𝑒 =𝑉𝐷
𝜈
𝑅𝑒 = 1.49 (0.031)
0.000030935
𝑅𝑒 = 1493.13
To calculate the Nusselt number based on the Reynold number, equation (5) was used.
𝑁𝑢 = 1.86(𝑅𝑒 Pr 𝐷
𝐿)
13(
𝜇𝑏
𝜇𝑠)0.14
𝑁𝑢 = 1.86( 1493.13 0.7003 (0.031)
1.5)
13(
0.00002462
0.00002504)0.14
𝑁𝑢 = 5.17
Based on the Nusselt number obtained, the heat transfer coefficient, h, also can be
determined by using equation (6):
𝑁𝑢 =𝐷
𝑘
=𝑁𝑢. 𝑘
𝐷
= 5.17 (0.035785)
0.031
= 5.97 𝑊/𝑚2.𝐾

The heat transfer rate can be identified based on the heat transfer coefficient using the
equation (7):
𝑄 = 𝐴𝑠(𝑇𝑠 − 𝑇∞)
𝑄 = 5.97 (0.22998)(453 − 433)
𝑄 = 27.44 𝑊
The pressure drop inside the generating tube also can be calculated using equation (8):
∆𝑃 = 𝑓𝐿
𝐷
𝜌𝑉2
2
Where, 𝑓 =64
𝑅𝑒
𝑓 =64
1493.13
𝑓 = 0.04
Hence, the Pressure drop inside the generating tube is;
∆𝑃 = (0.04)1.5
0.031
(0.779)(1.49)2
2
∆𝑃 = 1.79 𝑃𝑎
Note that, all the properties of air at 160°C can be obtained from Table A-15 in Çengel
Y.A., & Ghajar A.J. (2011), “Heat and mass transfer; Fundamentals and Application”.
McGraw-Hill, New York.