Investigating potential transit ridership by fusing ... · Investigating potential transit...
18
Investigating potential transit ridership by fusing smartcard and GSM data ir. Karin de Regt dr. Oded Cats dr. ir. Niels van Oort prof. dr. ir. Hans van Lint • [email protected] • https://nielsvanoort.weblog.tudelft.nl/ • @Niels_van_Oort
Transcript of Investigating potential transit ridership by fusing ... · Investigating potential transit...
Investigating potential transit
ridership by fusing
smartcard and GSM data
ir. Karin de Regt
dr. Oded Cats
dr. ir. Niels van Oort
prof. dr. ir. Hans van Lint
• https://nielsvanoort.weblog.tudelft.nl/
• @Niels_van_Oort

INTRODUCTION
2
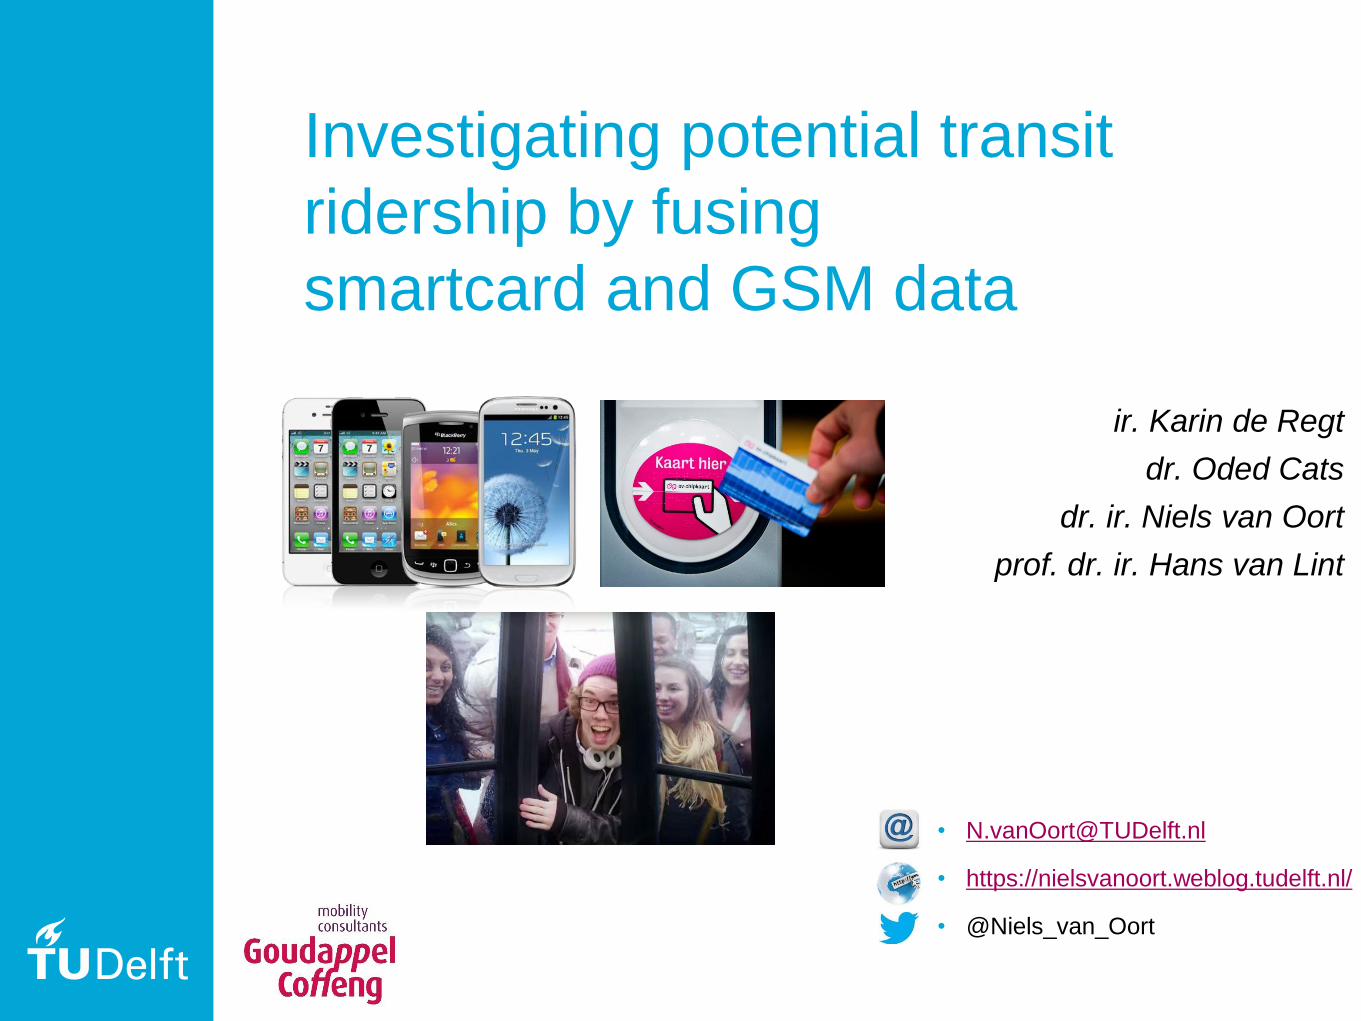
Introduction
• Demand for efficient public transport systems
• Passengers have different mobility patterns
• Dynamic in time and space
• Insights required into: Interaction with the overall travel
demand: modal split
• Different datasets offer opportunities to analyse mobility
3
Introduction
4
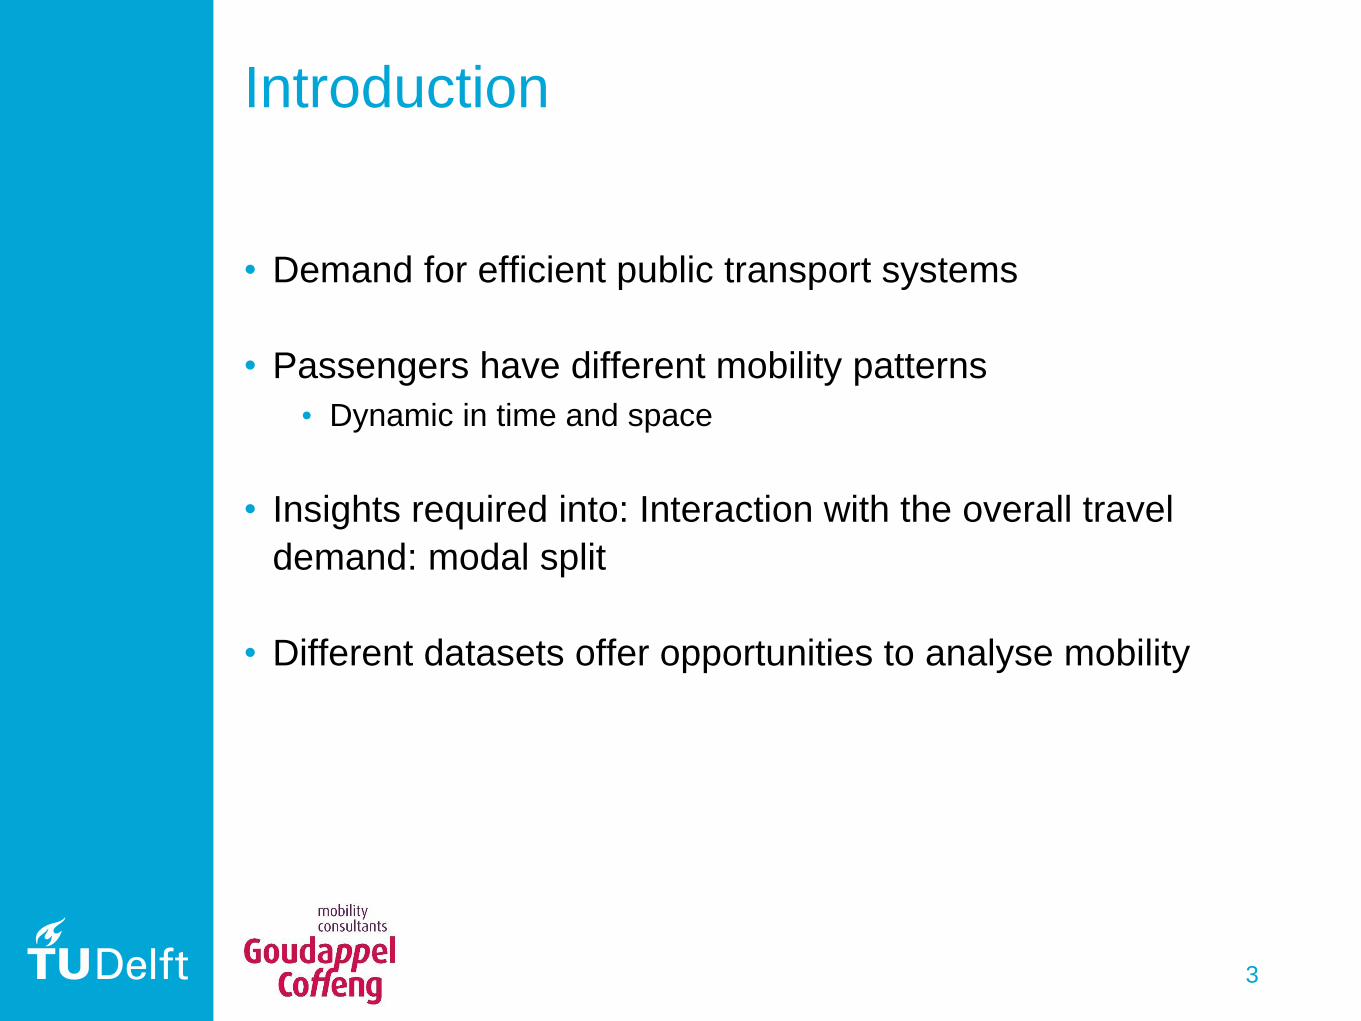
• Spatial and temporal dynamic information of public transport
passengers versus the overall travel demand
Characteristics Survey data
Included
modalities
All – distinction
between modes
Spatial
dynamicsYes
Temporal
dynamicsNo
Research
population
Sample of total
population
Characteristics Survey data GSM data
Included
modalities
All – distinction
between modes
All – no distinction
between modes
Spatial
dynamicsYes Yes
Temporal
dynamicsNo Yes
Research
population
Sample of total
population
Sample of total
population
Characteristics Survey data GSM data OV-chipkaart
data
Included
modalities
All – distinction
between modes
All – no distinction
between modesPublic transport
Spatial
dynamicsYes Yes Yes
Temporal
dynamicsNo Yes Yes
Research
population
Sample of total
population
Sample of total
population
Public transport
passengers
IntroductionResearch question
5
How can fusion of smartcard data and GSM data contribute
to the identification of spatial and temporal dynamic mobility
patterns of public transport passengers versus the overall
travel demand?

METHODOLOGY
DEVELOPMENT
6
• Anonymous OV-chipkaart & GSM data
• Spatial and temporal boundaries
• Scenarios (to compare)
• Anonymous OV-chipkaart & GSM data
• Spatial and temporal boundaries
• Scenarios (to compare)
• Anonymous OV-chipkaart & GSM data
• Spatial and temporal boundaries
• Scenarios (to compare)
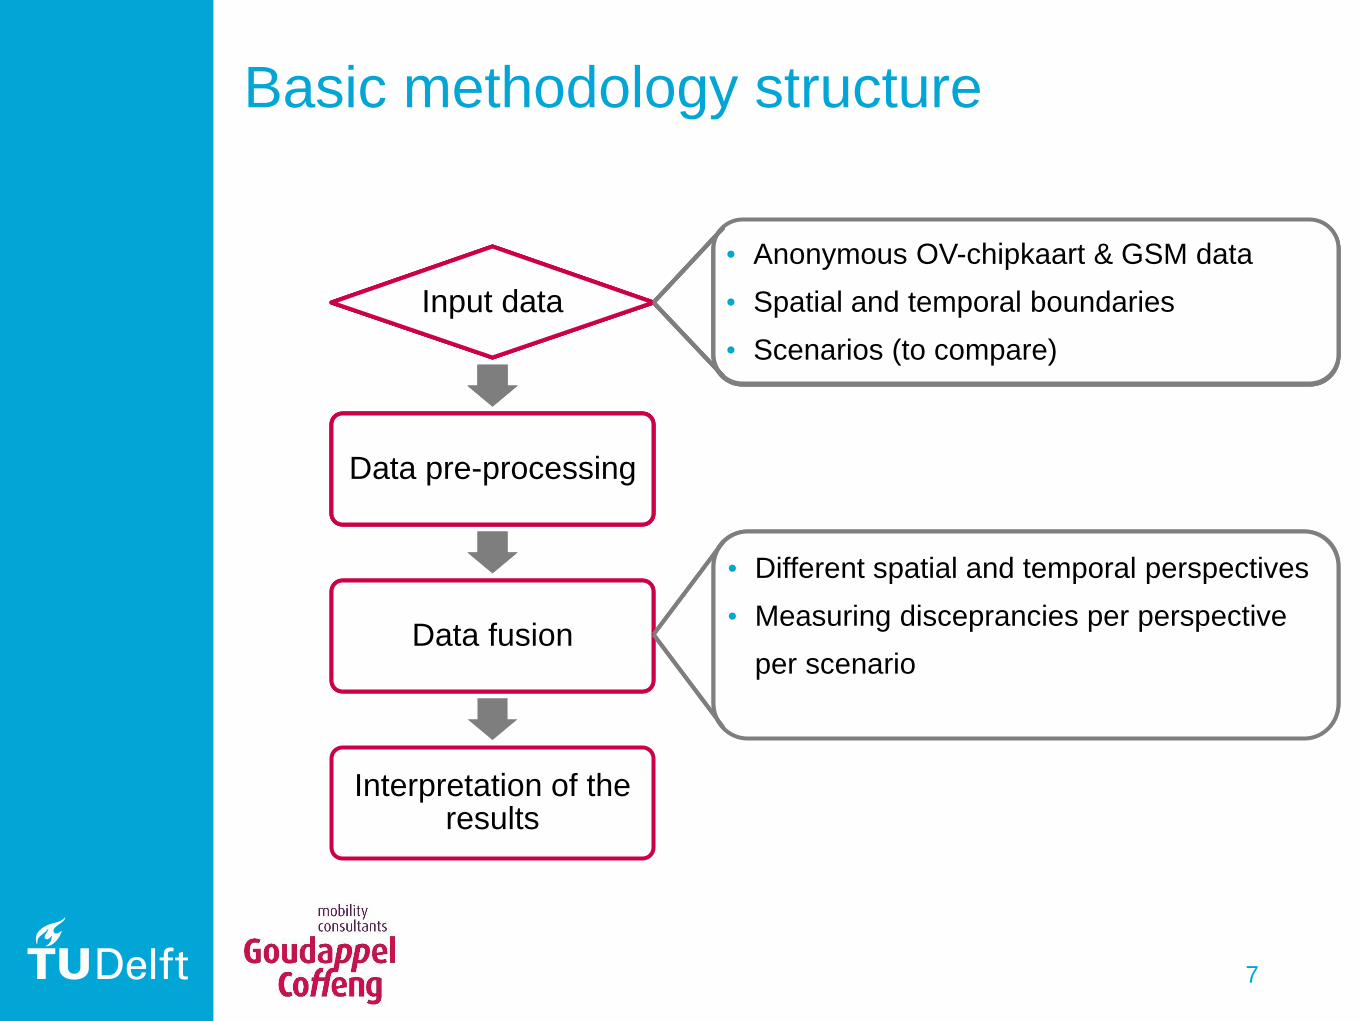
Basic methodology structure
• Anonymous OV-chipkaart & GSM data
• Spatial and temporal boundaries
• Scenarios (to compare)
7
Input data
Data pre-processing
Data fusion
Interpretation of the results
Input data
Data pre-processing
Data fusion
Interpretation of the results
Input data
Data pre-processing
Data fusion
Interpretation of the results
• Different spatial and temporal perspectives
• Measuring disceprancies per perspective
per scenario
Input data
Data pre-processing
Data fusion
Interpretation of the results
• Different spatial and temporal perspectives
• Measuring disceprancies per perspective
per scenario
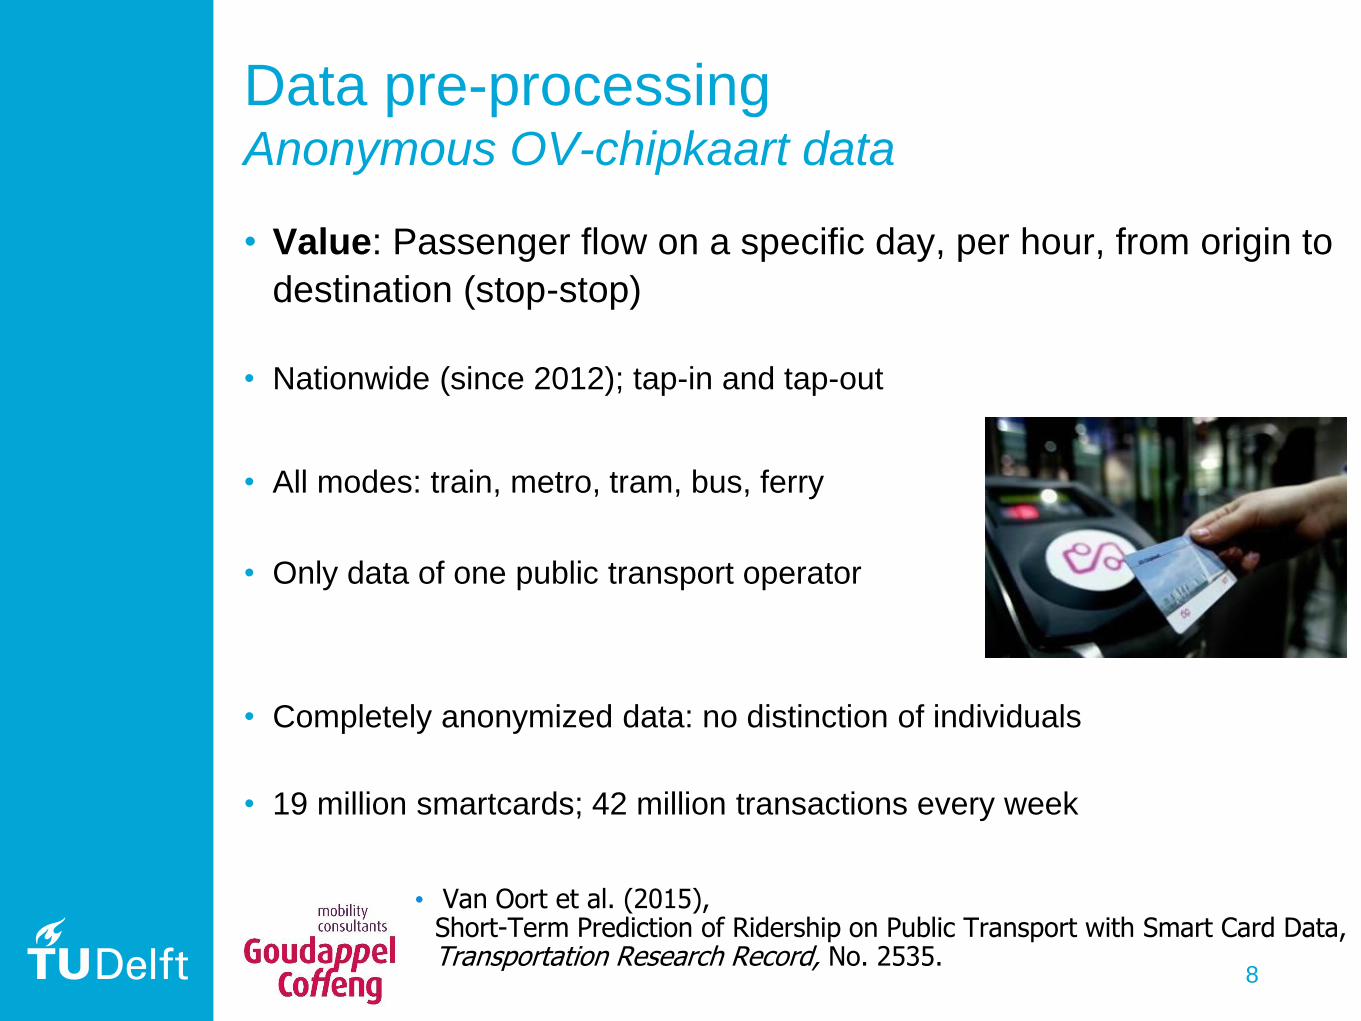
Data pre-processingAnonymous OV-chipkaart data
• Value: Passenger flow on a specific day, per hour, from origin to
destination (stop-stop)
• Nationwide (since 2012); tap-in and tap-out
• All modes: train, metro, tram, bus, ferry
• Only data of one public transport operator
• Completely anonymized data: no distinction of individuals
• 19 million smartcards; 42 million transactions every week
• Van Oort et al. (2015), Short-Term Prediction of Ridership on Public Transport with Smart Card Data, Transportation Research Record, No. 2535.
8

Data pre-processingGSM data
Value: Amount of visitors detected in a zone, on a specific day,
per hour
• Data from one network operator
• Algorithm to increase sample data to total population
• Distinction inhabitants or visitors
• Place of residence based on overnight stays per month
• Spatial level of detail: zone level
• Antennas have overlapping reach
• Difference occupancy between subsequent hours is a net
change
9
×
×
×
Data fusionOV-chipkaart data and GSM data of occupancy
• Spatial perspectives:
• Total of all zones
• Per zone
• Per Origin-Destination relation
• Temporal perspectives:
• Per day
• Per hour
• MPE: Mean Percentage Error
10
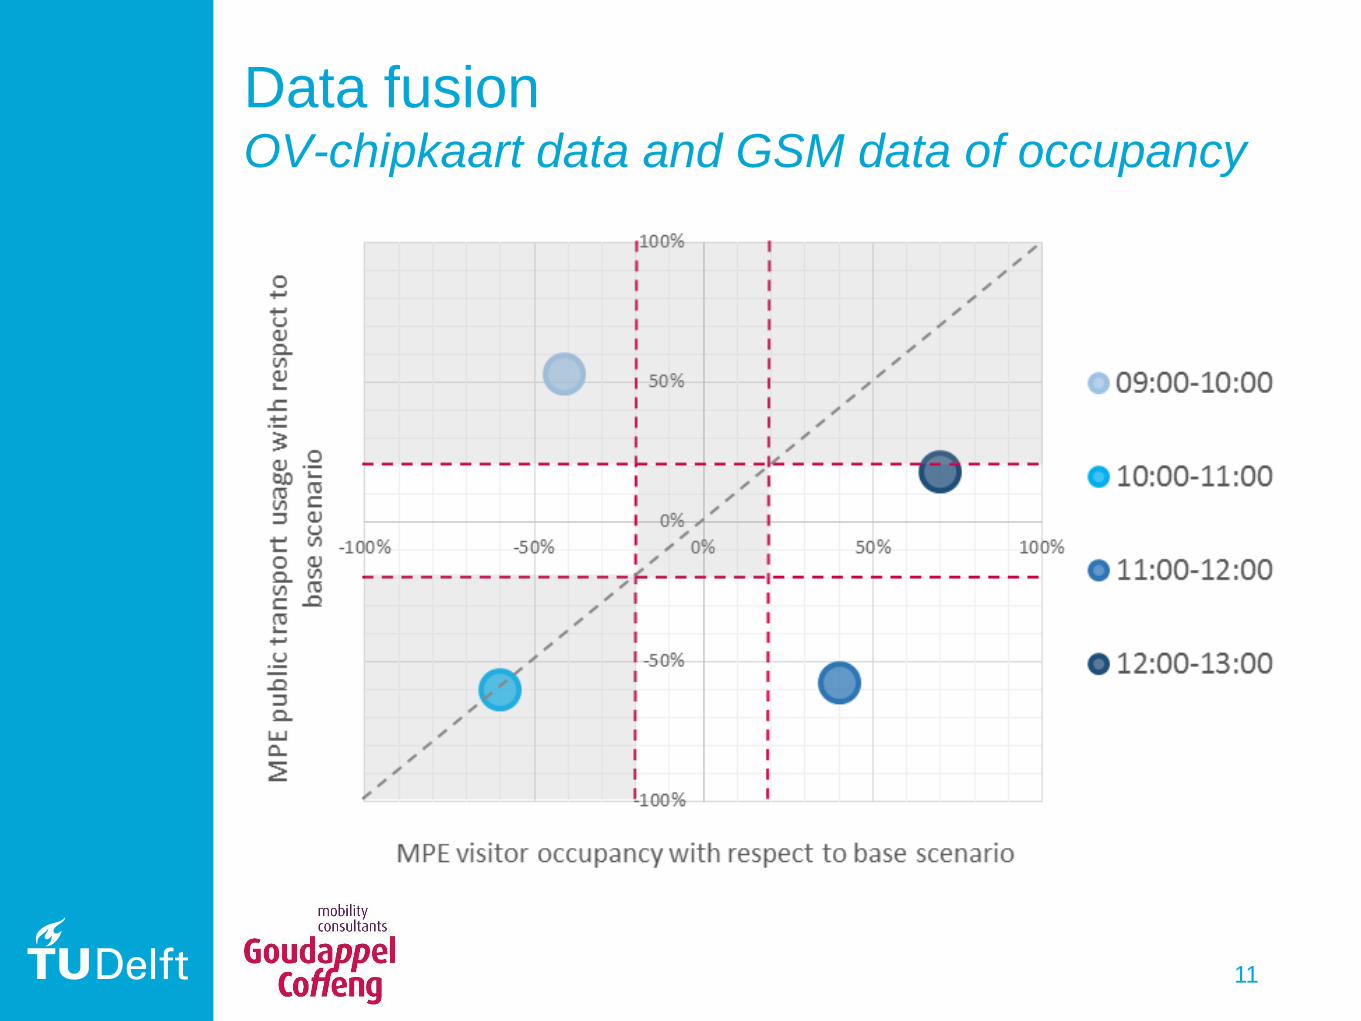
Data fusionOV-chipkaart data and GSM data of occupancy
11
CASE STUDY:
LATE EVENINGS & EARLY
MORNINGS IN ROTTERDAM
17
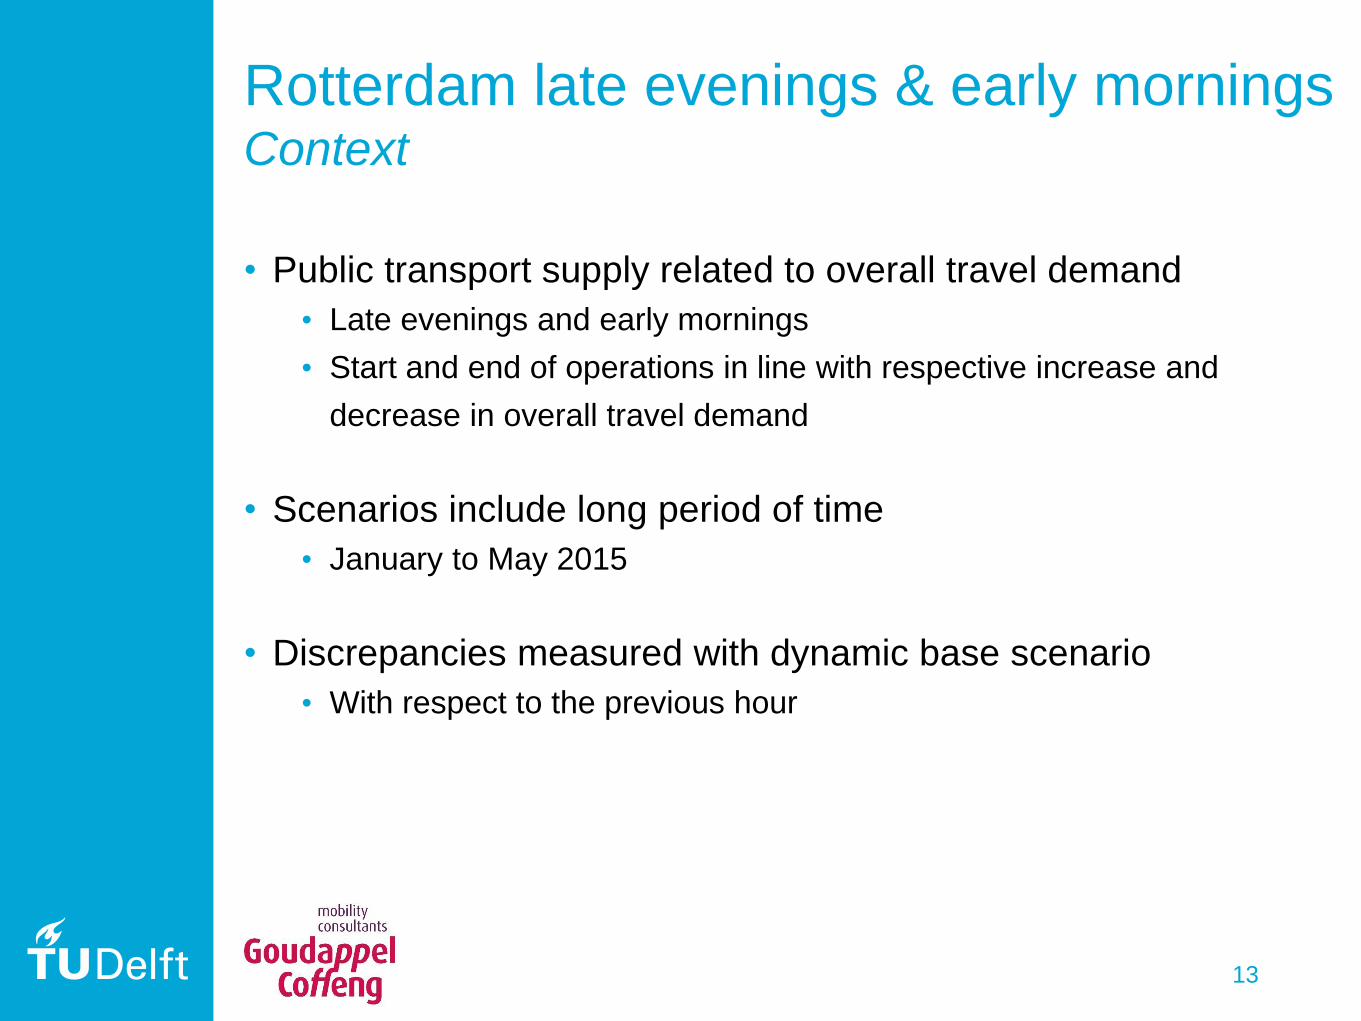
Rotterdam late evenings & early morningsContext
• Public transport supply related to overall travel demand
• Late evenings and early mornings
• Start and end of operations in line with respective increase and
decrease in overall travel demand
• Scenarios include long period of time
• January to May 2015
• Discrepancies measured with dynamic base scenario
• With respect to the previous hour
13

Rotterdam late evenings & early morningsWorking day scenario: zonal hourly perspective
14
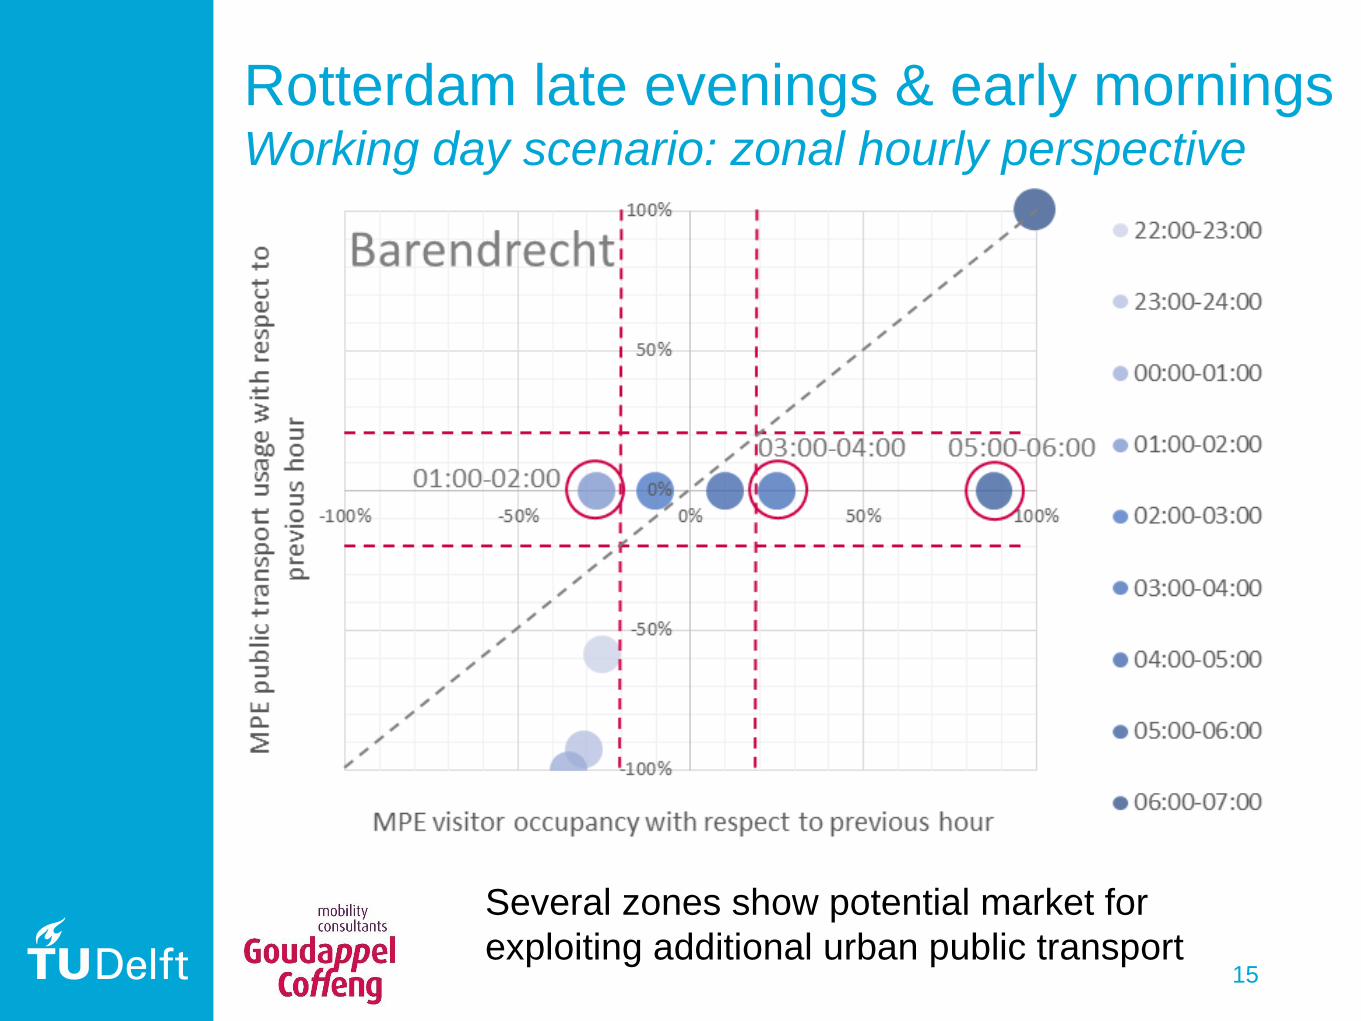
Rotterdam late evenings & early morningsWorking day scenario: zonal hourly perspective
15
Several zones show potential market for
exploiting additional urban public transport
CONCLUSIONS AND
RECOMMENDATIONS
25
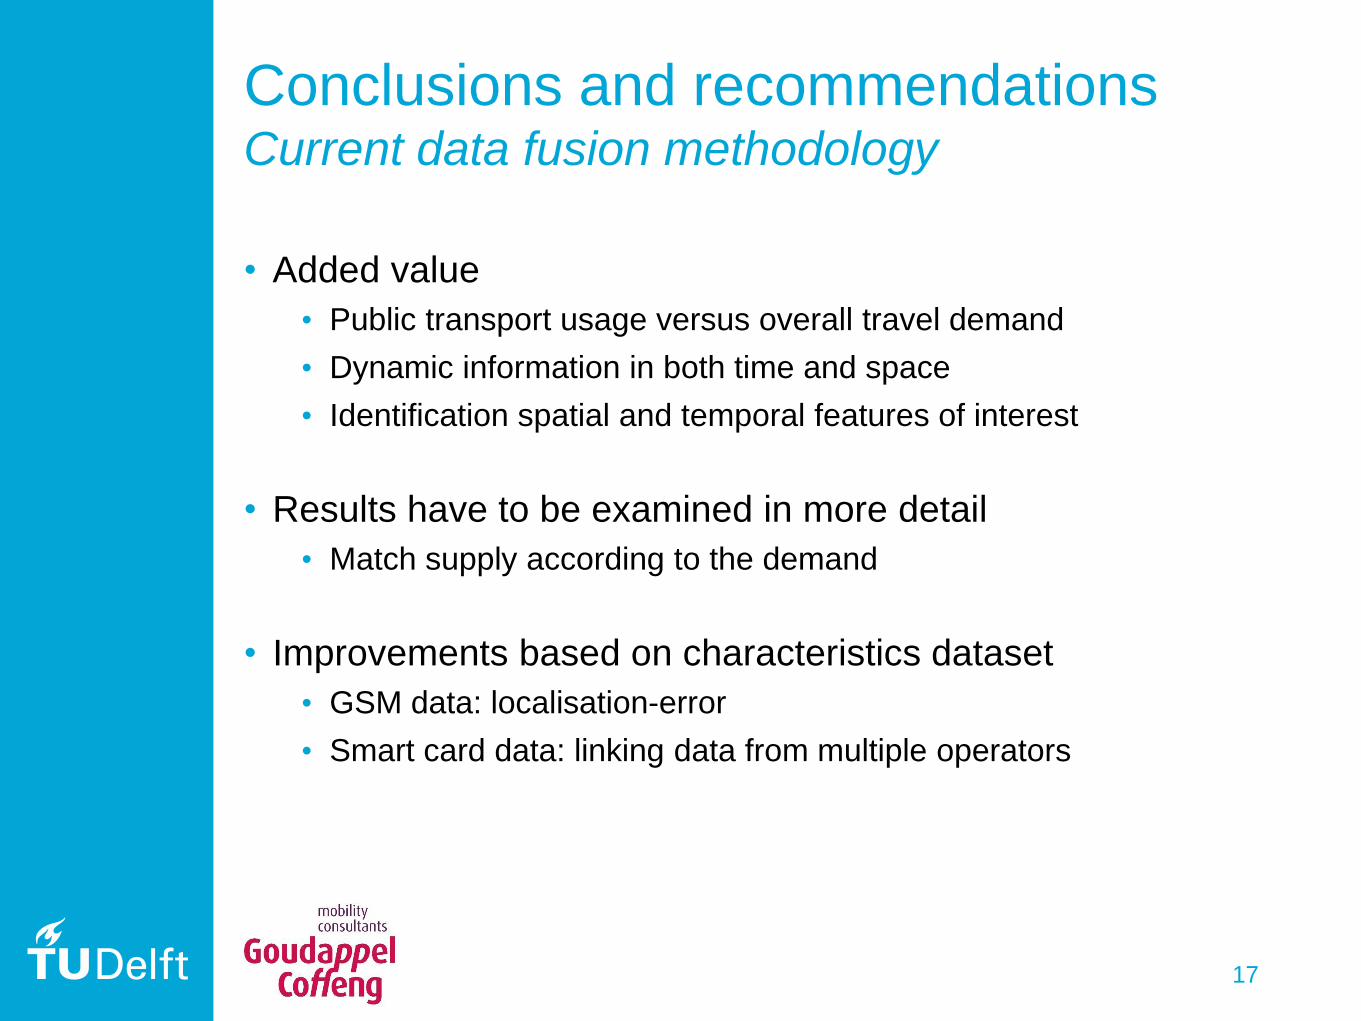
Conclusions and recommendationsCurrent data fusion methodology
• Added value
• Public transport usage versus overall travel demand
• Dynamic information in both time and space
• Identification spatial and temporal features of interest
• Results have to be examined in more detail
• Match supply according to the demand
• Improvements based on characteristics dataset
• GSM data: localisation-error
• Smart card data: linking data from multiple operators
17

Questions and contact
18
Amsterdam
May 2017
• [email protected]• [email protected]
• https://nielsvanoort.weblog.tudelft.nl/
• @Niels_van_Oort


![Initiation Fusing[1]](https://static.fdocuments.net/doc/165x107/577ce0e11a28ab9e78b44e50/initiation-fusing1.jpg)